Metrics Line Edition
80
USER’S GUIDE Metrics Line Edition PUBLICATION METLE-UM001A-EN-E–May 2007
Transcript of Metrics Line Edition

IDE 2007
METLN-UM001A-EN-E 5/8/07 9:34 AM Page 1
USER’S GU
Metrics Line Edition
PUBLICATION METLE-UM001A-EN-E–May

Contact Rockwell Customer Support Telephone — 1.440.646.3434Online Support — http://www.rockwellautomation.com/support
Copyright Notice © 2007 Rockwell Automation Technologies, Inc. All rights reserved. Printed in USA.This document and any accompanying Rockwell Software products are copyrighted by Rockwell Automation Technologies, Inc. Any reproduction and/or distribution without prior written consent from Rockwell Automation Technologies, Inc. is strictly prohibited. Please refer to the license agreement for details.
Trademark Notices Allen-Bradley, Arena, ControlLogix, Datapac, Emonitor, Emonitor Odyssey, Enlab, Enlube, Enpac, Enshare, Entek, Entrx, Enwatch, eProcedure, FactoryTalk, MotorMonitor, PlantLink, PLC-2, PLC-3, PLC-5, Rockwell Automation, Rockwell Software, RSLinx, RSView, the Rockwell Software logo, SIMAN, RSTune, VersaView, and XM are registered trademarks of Rockwell Automation, Inc.
The following logos and products are trademarks of Rockwell Automation, Inc.:RSBizWare, the RSBizWare logo, RSBizWare Batch, FactoryTalk Batch, RSBizWare BatchCampaign, RSBizWare BatchHistorian, FactoryTalk Historian for Batch, RSBizWare Historian, FactoryTalk Historian Classic, RSBizWare MaterialTrack, RSBizWare Scheduler, FactoryTalk Scheduler, and RSLoop OptimizerRSMACC, FactoryTalk AssetCentre, ProcessLogix, RSLogix, PhaseManager, RSLogix Emulate, RSLogix Guard, RSOPC Gateway, FactoryTalk Gateway, FactoryTalk Shop Operations Server, and FactoryTalk ProductionCentreAdvanced Interface (A.I.) Series, A.I. Series, AdvanceDDE, ControlView, Data Highway Plus, DH+, RSView, FactoryTalk View, RSView Studio, FactoryTalk View Studio, MobileView, PanelBuilder, PanelView, RSView Machine Edition, RSView ME Station, RSView32, RSView32 Resource Kit, and WINtelligentFactoryTalk Activation, FactoryTalk Administration Console, FactoryTalk Alarms and Events, FactoryTalk Automation Platform, FactoryTalk Services Platform, FactoryTalk Audit, FactoryTalk Data Model, FactoryTalk Diagnostics, FactoryTalk Directory, FactoryTalk Live Data, FactoryTalk Messenger, RSAssetSecurity, FactoryTalk Security, RSBizWare PlantMetrics, FactoryTalk Metrics, RSSql, FactoryTalk Transaction Manager, FactoryTalk Integrator EE, FactoryTalk Portal, and FactoryTalk Unified Plant ModelIntelligent Advisory, GuardLogix, GuardPLC, MicroLogix, PanelView, RSLinx Classic, RSLinx Enterprise, RSNetWorx, RSNetWorx for ControlNet, RSNetWorx for DeviceNet, RSNetWorx for EtherNet, RSNetWorx for EtherNet/IP, SLC 5, SLC 500, and SoftLogixPropack Data, Propack Data PMX CTM, Propack Data PMX Dispense RDM, Propack Data PMX EBR RDM, Propack Data PMX Equipment CTM, Propack Data PMX Equipment Management CTM, Propack Data PMX Equipment Management MES, Propack Data PMX Formulation RDM, Propack Data PMX MES, Propack Data PMX Plan RDM, Propack Data PMX RDM, Propack Data PMX Warehouse RDM, and Propack Data VISIONAnalytical Datamart, Application Solutions, CAPA,Complaint Handling, Dashboard Administrator, Datamart Administrator, ECO Manager, Enterprise Administrator, ICAPA, Integrate, Knowledge Administrator, Knowledge Datamart, Manufacturing Dashboard, Operational Data Store, ODS, Plant Operations, Process Designer, Quality Assurance, RMA Management and Repair, Shop Operations, and Supplier Management
Other Trademarks ActiveX, Microsoft, Microsoft Access, SQL Server, Visual Basic, Visual C++, Visual SourceSafe, Windows, Windows ME, Windows NT, Windows 2000, Windows Server 2003, and Windows XP are either registered trademarks or trademarks of Microsoft Corporation in the United States and/or other countries.Adobe, Acrobat, and Reader are either registered trademarks or trademarks of Adobe Systems Incorporated in the United States and/or other countries.ControlNet is a registered trademark of ControlNet International.DeviceNet is a trademark of the Open DeviceNet Vendor Association, Inc. (ODVA).Ethernet is a registered trademark of Digital Equipment Corporation, Intel, and Xerox Corporation.OLE for Process Control (OPC) is a registered trademark of the OPC Foundation.Oracle, SQL*Net, and SQL*Plus are registered trademarks of Oracle Corporation.All other trademarks are the property of their respective holders and are hereby acknowledged.
Warranty This product is warranted in accordance with the product license. The product’s performance may be affected by system configuration, the application being performed, operator control, maintenance and other related factors. Rockwell Automation is not responsible for these intervening factors. The instructions in this document do not cover all the details or variations in the equipment, procedure, or process described, nor do they provide directions for meeting every possible contingency during installation, operation, or maintenance. This product’s implementation may vary among users.
ii

This document is current as of the time of release of the product; however, the accompanying software may have changed since the release. Rockwell Automation, Inc. reserves the right to change any information contained in this document or the software at anytime without prior notice. It is your responsibility to obtain the most current information available from Rockwell when installing or using this product.
Version: 8.0.0 (CPR 7)Modified: June 27, 2007 7:01 am
iii

iv

Contents
1 • Welcome to FactoryTalk Metrics Line Edition 1What is FactoryTalk Metrics Line Edition? . . . . . . . . . . . . . . . . . . . . . . . . . . . . . . . . . 1Benefits of FactoryTalk Metrics Line Edition . . . . . . . . . . . . . . . . . . . . . . . . . . . . . . . 1Intended audience. . . . . . . . . . . . . . . . . . . . . . . . . . . . . . . . . . . . . . . . . . . . . . . . . . . . . 2
FactoryTalk Metrics Line Edition administrator . . . . . . . . . . . . . . . . . . . . . . . . . . 2FactoryTalk Metrics Line Edition user. . . . . . . . . . . . . . . . . . . . . . . . . . . . . . . . . . 2
Where can I go for help? . . . . . . . . . . . . . . . . . . . . . . . . . . . . . . . . . . . . . . . . . . . . . . . 3Reference the RSBizWare Administrator’s Guide . . . . . . . . . . . . . . . . . . . . . . . . . 3Reference the online help . . . . . . . . . . . . . . . . . . . . . . . . . . . . . . . . . . . . . . . . . . . . 3Get phone support. . . . . . . . . . . . . . . . . . . . . . . . . . . . . . . . . . . . . . . . . . . . . . . . . . 3Get Web support . . . . . . . . . . . . . . . . . . . . . . . . . . . . . . . . . . . . . . . . . . . . . . . . . . . 4Get on-site support . . . . . . . . . . . . . . . . . . . . . . . . . . . . . . . . . . . . . . . . . . . . . . . . . 4Get consulting services. . . . . . . . . . . . . . . . . . . . . . . . . . . . . . . . . . . . . . . . . . . . . . 4Contact us . . . . . . . . . . . . . . . . . . . . . . . . . . . . . . . . . . . . . . . . . . . . . . . . . . . . . . . . 4
2 • Getting Started 5Connecting to FactoryTalk Metrics Line Edition. . . . . . . . . . . . . . . . . . . . . . . . . . . . . 5Overview . . . . . . . . . . . . . . . . . . . . . . . . . . . . . . . . . . . . . . . . . . . . . . . . . . . . . . . . . . . 6Viewing Reports. . . . . . . . . . . . . . . . . . . . . . . . . . . . . . . . . . . . . . . . . . . . . . . . . . . . . . 6Administration functions . . . . . . . . . . . . . . . . . . . . . . . . . . . . . . . . . . . . . . . . . . . . . . . 7Understanding the FactoryTalk Metrics Line Edition architecture . . . . . . . . . . . . . . . 9
3 • Using FactoryTalk Metrics LE 11Accessing FactoryTalk Metrics LE . . . . . . . . . . . . . . . . . . . . . . . . . . . . . . . . . . . . . . 11Navigating Report Expert. . . . . . . . . . . . . . . . . . . . . . . . . . . . . . . . . . . . . . . . . . . . . . 11Viewing FactoryTalk Metrics LE items. . . . . . . . . . . . . . . . . . . . . . . . . . . . . . . . . . . 12
Using the Explorer area . . . . . . . . . . . . . . . . . . . . . . . . . . . . . . . . . . . . . . . . . . . . 12Using the Parameter area . . . . . . . . . . . . . . . . . . . . . . . . . . . . . . . . . . . . . . . . . . . 13
Using the Parameter Set controls . . . . . . . . . . . . . . . . . . . . . . . . . . . . . . . . . . . . . . . . 15Using the Date / Time / Shift box. . . . . . . . . . . . . . . . . . . . . . . . . . . . . . . . . . . . . 15Using the Grouping box . . . . . . . . . . . . . . . . . . . . . . . . . . . . . . . . . . . . . . . . . . . . 19Using the Sorting box . . . . . . . . . . . . . . . . . . . . . . . . . . . . . . . . . . . . . . . . . . . . . . 22Using the Plant Model box . . . . . . . . . . . . . . . . . . . . . . . . . . . . . . . . . . . . . . . . . . 23Using the Filtering box . . . . . . . . . . . . . . . . . . . . . . . . . . . . . . . . . . . . . . . . . . . . . 24Using the TOP N box . . . . . . . . . . . . . . . . . . . . . . . . . . . . . . . . . . . . . . . . . . . . . . 25Using the Terminology box . . . . . . . . . . . . . . . . . . . . . . . . . . . . . . . . . . . . . . . . . 26
i

FACTORYTALK METRICS LINE EDITION USER’S GUIDE•
• •
• •
Viewing and Using reports. . . . . . . . . . . . . . . . . . . . . . . . . . . . . . . . . . . . . . . . . . . . . 26Navigating a report . . . . . . . . . . . . . . . . . . . . . . . . . . . . . . . . . . . . . . . . . . . . . . . . 27Exporting a report . . . . . . . . . . . . . . . . . . . . . . . . . . . . . . . . . . . . . . . . . . . . . . . . . 28Printing a report . . . . . . . . . . . . . . . . . . . . . . . . . . . . . . . . . . . . . . . . . . . . . . . . . . 28
4 • Administering FactoryTalk Metrics LE 29Configuring security for FactoryTalk Metrics LE . . . . . . . . . . . . . . . . . . . . . . . . . . . 29
Setting up security . . . . . . . . . . . . . . . . . . . . . . . . . . . . . . . . . . . . . . . . . . . . . . . . 29Disabling security . . . . . . . . . . . . . . . . . . . . . . . . . . . . . . . . . . . . . . . . . . . . . . . . . 30
Loading FactoryTalk Metrics LE data into the RSBizWare database . . . . . . . . . . . . 30Accessing FactoryTalk Metrics LE and the Report Expert Administration area. . . . 33Managing the Explorer Area . . . . . . . . . . . . . . . . . . . . . . . . . . . . . . . . . . . . . . . . . . . 34
Add an item to the tree . . . . . . . . . . . . . . . . . . . . . . . . . . . . . . . . . . . . . . . . . . . . . 35Modify an item in the tree . . . . . . . . . . . . . . . . . . . . . . . . . . . . . . . . . . . . . . . . . . 36Delete an item from the tree . . . . . . . . . . . . . . . . . . . . . . . . . . . . . . . . . . . . . . . . . 36
Managing the Quick Web Feature . . . . . . . . . . . . . . . . . . . . . . . . . . . . . . . . . . . . . . . 37Managing Report Subscriptions . . . . . . . . . . . . . . . . . . . . . . . . . . . . . . . . . . . . . . . . . 37
Adding a Report Subscription . . . . . . . . . . . . . . . . . . . . . . . . . . . . . . . . . . . . . . . 38Modifying a Report Subscription . . . . . . . . . . . . . . . . . . . . . . . . . . . . . . . . . . . . . 38Deleting a Report Subscription. . . . . . . . . . . . . . . . . . . . . . . . . . . . . . . . . . . . . . . 40
Managing Parameter Sets . . . . . . . . . . . . . . . . . . . . . . . . . . . . . . . . . . . . . . . . . . . . . . 40Adding a Parameter Set . . . . . . . . . . . . . . . . . . . . . . . . . . . . . . . . . . . . . . . . . . . . 41Modifying a Parameter Set . . . . . . . . . . . . . . . . . . . . . . . . . . . . . . . . . . . . . . . . . . 42Deleting a Parameter Set . . . . . . . . . . . . . . . . . . . . . . . . . . . . . . . . . . . . . . . . . . . 42
Managing the Terminologies Feature. . . . . . . . . . . . . . . . . . . . . . . . . . . . . . . . . . . . . 42Create a new domain terminology . . . . . . . . . . . . . . . . . . . . . . . . . . . . . . . . . . . . 43Add terms to selected terminology. . . . . . . . . . . . . . . . . . . . . . . . . . . . . . . . . . . . 43Edit terms . . . . . . . . . . . . . . . . . . . . . . . . . . . . . . . . . . . . . . . . . . . . . . . . . . . . . . . 44Copy terminology to another culture . . . . . . . . . . . . . . . . . . . . . . . . . . . . . . . . . . 44Delete terminology . . . . . . . . . . . . . . . . . . . . . . . . . . . . . . . . . . . . . . . . . . . . . . . . 44Delete copied (in another culture) version of domain terminology . . . . . . . . . . . 44Init terminology every report . . . . . . . . . . . . . . . . . . . . . . . . . . . . . . . . . . . . . . . . 45
Managing the Line Order Feature . . . . . . . . . . . . . . . . . . . . . . . . . . . . . . . . . . . . . . . 45
5 • Standard Reports 47FactoryTalk Metrics Line Edition Standard Reports . . . . . . . . . . . . . . . . . . . . . . . . . 47Report field descriptions . . . . . . . . . . . . . . . . . . . . . . . . . . . . . . . . . . . . . . . . . . . . . . 47
Event Detail report . . . . . . . . . . . . . . . . . . . . . . . . . . . . . . . . . . . . . . . . . . . . . . . . 47Event Summary report . . . . . . . . . . . . . . . . . . . . . . . . . . . . . . . . . . . . . . . . . . . . . 47Performance report . . . . . . . . . . . . . . . . . . . . . . . . . . . . . . . . . . . . . . . . . . . . . . . . 48Production report . . . . . . . . . . . . . . . . . . . . . . . . . . . . . . . . . . . . . . . . . . . . . . . . . 48
ii

CONTENTS• • • • •
Quality report . . . . . . . . . . . . . . . . . . . . . . . . . . . . . . . . . . . . . . . . . . . . . . . . . . . . 49Root Cause Analysis report . . . . . . . . . . . . . . . . . . . . . . . . . . . . . . . . . . . . . . . . . 49Throughput report. . . . . . . . . . . . . . . . . . . . . . . . . . . . . . . . . . . . . . . . . . . . . . . . . 50Uptime report . . . . . . . . . . . . . . . . . . . . . . . . . . . . . . . . . . . . . . . . . . . . . . . . . . . . 51
Raw data . . . . . . . . . . . . . . . . . . . . . . . . . . . . . . . . . . . . . . . . . . . . . . . . . . . . . . . . . . . 52Calculations . . . . . . . . . . . . . . . . . . . . . . . . . . . . . . . . . . . . . . . . . . . . . . . . . . . . . . . . 52
Performance Report . . . . . . . . . . . . . . . . . . . . . . . . . . . . . . . . . . . . . . . . . . . . . . . 52Production Report. . . . . . . . . . . . . . . . . . . . . . . . . . . . . . . . . . . . . . . . . . . . . . . . . 53Quality Report . . . . . . . . . . . . . . . . . . . . . . . . . . . . . . . . . . . . . . . . . . . . . . . . . . . 54Throughput Report . . . . . . . . . . . . . . . . . . . . . . . . . . . . . . . . . . . . . . . . . . . . . . . . 54Uptime Report . . . . . . . . . . . . . . . . . . . . . . . . . . . . . . . . . . . . . . . . . . . . . . . . . . . 54
6 • FactoryTalk Metrics Line Edition Reports 57Dashboard Folder . . . . . . . . . . . . . . . . . . . . . . . . . . . . . . . . . . . . . . . . . . . . . . . . . 57OEE Summary Report . . . . . . . . . . . . . . . . . . . . . . . . . . . . . . . . . . . . . . . . . . . . . 58OEE Details Report . . . . . . . . . . . . . . . . . . . . . . . . . . . . . . . . . . . . . . . . . . . . . . . 58Line Efficiency Report . . . . . . . . . . . . . . . . . . . . . . . . . . . . . . . . . . . . . . . . . . . . . 59Availability Report . . . . . . . . . . . . . . . . . . . . . . . . . . . . . . . . . . . . . . . . . . . . . . . . 60Change Over Report . . . . . . . . . . . . . . . . . . . . . . . . . . . . . . . . . . . . . . . . . . . . . . . 61States Top 10 . . . . . . . . . . . . . . . . . . . . . . . . . . . . . . . . . . . . . . . . . . . . . . . . . . . . 62Down Time Top 10. . . . . . . . . . . . . . . . . . . . . . . . . . . . . . . . . . . . . . . . . . . . . . . . 63Event Top 10 . . . . . . . . . . . . . . . . . . . . . . . . . . . . . . . . . . . . . . . . . . . . . . . . . . . . 64Root Cause Analysis. . . . . . . . . . . . . . . . . . . . . . . . . . . . . . . . . . . . . . . . . . . . . . . 65Performance Report . . . . . . . . . . . . . . . . . . . . . . . . . . . . . . . . . . . . . . . . . . . . . . . 67Capacity Report . . . . . . . . . . . . . . . . . . . . . . . . . . . . . . . . . . . . . . . . . . . . . . . . . . 68Quality Report . . . . . . . . . . . . . . . . . . . . . . . . . . . . . . . . . . . . . . . . . . . . . . . . . . . 68
Index 71
iii

FACTORYTALK METRICS LINE EDITION USER’S GUIDE•
• •
• •
iv

1 Welcome to FactoryTalk Metrics Line Edition
What is FactoryTalk Metrics Line Edition?FactoryTalk Metrics Line Edition is a prepackaged performance management (Overall Equipment Effectiveness - OEE) application that is targeted at reducing the total cost and effort associated with deploying a performance management application within a manufacturing facility. The FactoryTalk Metrics Line Edition package includes the following software components:
FactoryTalk Metrics, for performance and event data collection
FactoryTalk Metrics Production Client, for configuration
Report Expert, for reporting and visualization
FactoryTalk Metrics LE is shipped with pre-configured components (workcell definition, performance and event data collection scheme, and reports). Plant personnel can modify or extend the standard configuration to address the needs of their solution by leveraging the configuration wizards provided in the FactoryTalk Metrics Production Client application. FactoryTalk Metrics Line Edition captures, analyzes, and displays key performance metrics associated with production lines, machines and workcells. Reports have been configured and grouped in a fashion that facilitates the analysis process. Plant personnel are able to extensively analyze availability, throughput and quality losses through an intuitive web based reporting interface.
Benefits of FactoryTalk Metrics Line EditionFactoryTalk Metrics LE provides the following benefits:
Improved Throughput: The standard reports enable production management to view actual production versus rated capacity. Other reports provide information to determine if lost production was from equipment that was being run at a reduced rate or equipment downtime.
Reduced Downtime: The reporting interface allows the operator to drill down into the causes of downtime and identify the root cause of equipment breakdown or actual time taken for changeover/setup.
Lowered Operating Costs: The reports give production management the ability to compare the amount of labor used on the production lines and the quantity of scrap generated. By drilling into the data, they can determine how to optimize production to lower operating costs.
1

FACTORYTALK METRICS LINE EDITION USER’S GUIDE•
• •
• •
Increased Line Efficiency: The Overall Equipment Effectiveness (OEE) of individual pieces of equipment and of the overall line can be viewed with the standard reports. Production management can use the information to focus improvement efforts on less efficient equipment.
Better Performance Reporting: FactoryTalk Metrics LE has many dynamic pre-configured reports that allow a user to immediately start receiving value from the system. The reports are web-based and can be viewed from any computer on the network. Reports are limited only by the number of users licensed to be logged in at any given time. They are built with drill down capability that allows production management to monitor current performance and view the underlying data to identify causes of inefficiencies.
Standards Compliance: The FactoryTalk Metrics LE data structure conforms to the S95 standards. This data format, in a FactoryTalk enabled environment, enables the solution to present the data for viewing in multiple formats to meet the demands of different individuals within the facility (i.e. production, engineering, maintenance, and quality).
Intended audienceThe FactoryTalk Metrics Line Edition User’s Guide is designed to help you understand how to configure, access, use, and maintain FactoryTalk Metrics LE. This document is intended for the following types of users:
FactoryTalk Metrics Line Edition administratorThis is the individual who maintains FactoryTalk Metrics LE after it is installed and configured for use. This individual should be familiar with:
Microsoft Windows operating systems
Microsoft Internet Explorer
Microsoft SQL Server 2005 (including Microsoft Reporting Services)
FactoryTalk Metrics Line Edition userThis is the individual who makes use of the reports provided by FactoryTalk Metrics LE to perform their job. This individual should be familiar with:
Microsoft Windows operating systems
Microsoft Internet Explorer
2

1 • WELCOME TO FACTORYTALK METRICS LINE EDITION• • • • •
Where can I go for help?Our commitment to your success starts with the suite of learning aids and assistance we provide with FactoryTalk Metrics LE. Consult the following resources for additional information about this product:
Reference the RSBizWare Administrator’s GuideThis document is designed to help the RSBizWare administrator install and configure the software and to understand the components that make up the RSBizWare suite of products. The first chapter of the guide provides an overview of the software components that make up the RSBizWare suite and describes the architecture on which they are built. The remaining chapters describe the installation steps and available options when deploying the RSBizWare software.
A printed copy of the RSBizWare Administrator’s Guide is distributed in the box with the RSBizWare software and an electronic copy of the guide is available from the RSBizWare software installation CD-ROM.
Reference the online helpYou will be able to use the Report Expert online help as well as the FactoryTalk Metrics/RSBizWare Plant Metrics online help for related information.
Get phone supportRockwell Automation’s support team of outstanding professionals provides top-notch technical support—monitoring and tracking your experience with our products to pave the road to your success in understanding and improving your factory performance.
Rockwell Automation provides full support for the FactoryTalk Metrics LE product. Questions concerning installation and the use of the software are handled by the Rockwell Automation Customer Support Center, staffed Monday through Friday—except U.S. holidays—from 8 AM to 5 PM Eastern time zone for calls originating within the U.S. and Canada.
To reach the Customer Support Center, call 440-646-3434 and follow the prompts. For calls originating outside the U.S./Canada, locate the number in your country by visiting support.rockwellautomation.com and selecting the Phone/On-site link. A list will be presented from which you can locate the number to call in your country.
WHEN YOU CALL
When you call, you should be at your computer and prepared to give the following information:
3

FACTORYTALK METRICS LINE EDITION USER’S GUIDE•
• •
• •
The product serial number and version number, which can be found in the client software by selecting Help > About FactoryTalk Metrics Line Edition
The type of hardware you are using
The exact wording of any errors or messages that appeared on your screen
A description of what happened and what you were doing when the problem occurred
A description of how you attempted to solve the problem
Get Web supportIn addition to phone support, the Rockwell Automation Customer Support Center offers extensive online knowledgebases of tech notes and frequently asked questions for support of non-urgent issues. These databases are updated daily by our support specialists.
To receive regular e-mail messages with links to the latest tech notes, software updates, and firmware updates for the products that are of interest to you or to submit an online support request, visit support.rockwellautomation.com and select the Online link.
Get on-site supportRockwell Automation field support engineers are located around the globe to provide assistance with special projects, unexpected problems, or emergency situations on-site. Field support engineers are available for dispatch 24x7x365 and can arrive at many locations the same day.
To learn more about this and other support services, visit the Customer Support Web site at support.rockwellautomation.com.
Get consulting servicesRockwell Automation provides expert consulting and turnkey implementation of FactoryTalk Metrics LE. Please contact your local representative for more information.
Contact usWe strive to help all of our customers become successful in their manufacturing improvement efforts. Toward this objective, we invite you to contact your local representative or Rockwell Automation at any time that we may be of service to you.
4

2 Getting StartedThis chapter discusses the basics of using the Report Expert interface to FactoryTalk Metrics Line Edition and explains the architecture of the product.
Connecting to FactoryTalk Metrics Line EditionReport Expert is the interface to FactoryTalk Metrics LE and is used to configure and view FactoryTalk Metrics LE reports. From the Report Expert home page, you can view the FactoryTalk Metrics LE reports available from the Explorer area or the Parameter area. Administrators can view reports, manage parameter sets, administer the Explorer area, and schedule reports for future delivery.
To access Report Expert, open Internet Explorer, enter the address for the Report Expert Web Site (server machine name, slash, “reportexpert”; for example, http://rsi-rockwell:8001/RockwellSoftware/reportexpert) in the browser’s Address field, and press the Enter key.
5

FACTORYTALK METRICS LINE EDITION USER’S GUIDE•
• •
• •
OverviewThe home page contains three basic areas; the Report Viewer area on the right side of the screen, the Toolbar at the top of the screen, and the Explorer or Parameter area along the left side of the screen.
The home page includes the Welcome text and links to the Administration functions, the Report Expert Help file, and this User’s Guide. The Administration button on the toolbar will also take you to the Administration functions area.
Viewing ReportsYou have two ways to display reports from the Report Viewer: the Explorer area and the Parameter area.
USING THE EXPLORER AREA
From the Explorer area, you can select a report item from the tree (click its name) and it is automatically displayed in the display area.
To access the Explorer area at any time, click the Explorer button in the Report Expert toolbar.
6

2 • GETTING STARTED• • • • •
USING THE PARAMETER AREA
From the Parameter area, you can manage parameter sets and associate reports with parameter sets prior to displaying the report.
To access the Parameter area, click the Parameters button in the Report Expert toolbar.
To display reports from the Parameter area, you select a report from the Select Report list, select a parameter set from the Select Parameter Set list, and click the View Report link. The report appears in the main display area.
To manage parameter sets from the Parameter area, you use the Edit Parameter Set Name field and the New, Delete, Save, and Cancel buttons. (This editing functionality is available to Administrators only.)
For complete instructions on using the Parameters area, see “Using the Parameter area” on page 13
Administration functionsThe Administration area of Report Expert enables administrators to do the following:
Manage the Explorer area
Manage the Quick Web feature
7

FACTORYTALK METRICS LINE EDITION USER’S GUIDE•
• •
• •
Manage Report Subscriptions
Manage Parameter sets
Manage the Terminologies feature
Manage the Line Order feature
For complete instructions on using the Administration area, see “Administering FactoryTalk Metrics LE” on page 29.
To access the Administration area, click the Administration button in the Report Expert toolbar or click the Administration link on the Report Expert home page.
8

2 • GETTING STARTED• • • • •
Understanding the FactoryTalk Metrics Line Edition architectureThe following diagram provides a high-level architecture of FactoryTalk Metrics Line Edition and its major components:
The FactoryTalk Metrics Line Edition architecture is a scalable, multi-tiered, distributed architecture consisting of a data collection sub-system, an Oracle or SQL Server database repository, the Information Services Manager, and clients.
Rockwell Automation’s FactoryTalk Transaction Manager is the embedded engine that collects data from the control system(s) and the Metrics Server Manager logs it to the predefined database repository.
9

FACTORYTALK METRICS LINE EDITION USER’S GUIDE•
• •
• •
There are several types of clients, including the Configuration Console and the Web-based report client. Users can author reports via Microsoft Visual Studio or Microsoft Reporting Services Report Builder.
The FactoryTalk Metrics Line Edition architecture can be configured to run on a single computer, or it can be distributed across multiple computers. In the simplest case, the Configuration Console, the Information Services Manager, the Metrics Server Manager, the FactoryTalk Transaction Manager data collection engine, and the database run on a single computer. In a distributed setting, these components may reside on separate computers.
Clients connect to the server using TCP/IP, so they can be deployed over a LAN, WAN, intranet, or the Internet. The scalability of the FactoryTalk Metrics Line Edition architecture allows many clients to connect to a single server.
10

3 Using FactoryTalk Metrics LEReport Expert is the reporting interface for FactoryTalk Metrics LE and is used to configure and view FactoryTalk Metrics LE reports. From the Report Expert home page, you can view the FactoryTalk Metrics LE reports available from the Explorer area or the Parameter area. This chapter discusses how to navigate FactoryTalk Metrics LE and how to use Report Viewer to display reports and navigate the contents of those reports.
Accessing FactoryTalk Metrics LETo access Report Expert, open Internet Explorer, enter the address for the Report Expert Web Site (server machine name, slash, “reportexpert”; for example, http://rsi-rockwell:8001/RockwellSoftware/reportexpert) in the browser’s Address field, and press the Enter key.
Navigating Report ExpertUse the tool bar at the top of Report Expert to navigate to different areas of the product and control what is displayed.
The following table describes how to get to different parts of Report Expert by using the buttons in the toolbar.
Table 4-1. Navigation buttons
Button Destination
Home Click the Home button to display the Report Expert home page.
Administration Click the Administration button to navigate to the administrative functions. This displays a multi-tabbed page that provides access to the Report Explorer, QuickWeb, Subscriptions, Parameter Sets, Terminologies, and Line Order tabs.
Explorer Click the Explorer button to display or hide the Explorer area.
Parameters Click the Parameters button to display or hide the Parameter area.
Heading Click the Heading button to display or hide the heading bar at the top of Report Expert. The heading bar indicates your current location within Report Expert.
11

FACTORYTALK METRICS LINE EDITION USER’S GUIDE•
• •
• •
Viewing FactoryTalk Metrics LE itemsFactoryTalk Metrics LE is shipped with pre-configured components (workcell definition, performance and event data collection scheme, and reports). You can modify or extend the standard configuration to address the needs of your application. FactoryTalk Metrics Line Edition captures, analyzes, and displays key performance metrics associated with production lines, machines and workcells. Reports have been configured and grouped in a fashion that facilitates the analysis process. The resulting reports may be saved to the tree in the Explorer area for repeated use or can be a single-use instance of a standard report.
Using the Explorer areaReports can be saved and sorted on the tree in the Explorer area by administrators. You can use this tree to browse the reports that have been saved.
When you click on a report in the tree, the report is displayed in the display area.
When you click on URL in the tree, the contents of that URL is displayed in the display area.
When you click on a folder in the tree, the folder is opened (to expose its content) or closed.
Status Click the Status button to display or hide the status bar at the bottom of Report Expert. The status bar shows tool tips and messages as you work within Report Expert.
Info Click the Info button to display a new browser window containing a list of the various components (and their version) numbers being used by Report Expert.
Help Click the Help button to display the help for Report Expert.
Table 4-1. Navigation buttons
Button Destination
12

3 • Using FactoryTalk Metrics LE• • • • •
Using the Parameter areaAccess the Parameter area by clicking the Parameter button in the toolbar. From the Parameter area, you can do one of two things:
Display a report using an existing parameter set
Display a report using an existing parameter set that you temporarily customize
DISPLAYING A REPORT WITH AN EXISTING PARAMETER SET
The Parameter area enables you to select a report and select a saved parameter set, which filters the report using the properties of the parameter set. To display the report in the display area, click the View Report link located in the upper right corner of the parameter window.
13

FACTORYTALK METRICS LINE EDITION USER’S GUIDE•
• •
• •
DISPLAYING A REPORT WITH A TEMPORARILY CUSTOMIZED PARAMETER SET
If you want to display a report using a temporarily customized parameter set, do the following:
1. Select the type of report you want to view from the Select Report list.
2. Select a parameter set that is the closest to the temporary parameter set that you want to use.
3. In the Date / Time / Shift box, define how you want to filter the data based on time. For more information on using this box, see “Using the Date / Time / Shift box” on page 15.
4. In the Grouping box, define how you want to group and organize the information in the report. For more information on using this box, see “Using the Grouping box” on page 19.
5. In the Sorting box, define how you want the grouped information sorted. For more information on using this box, see “Using the Sorting box” on page 22.
6. In the Plant Model box, specify the activity areas for which you want information to be displayed in the report. For more information on using this box, see “Using the Plant Model box” on page 23.
14

3 • Using FactoryTalk Metrics LE• • • • •
7. In the Filtering box, define how you want to further filter the information in the report. For more information on using this box, see “Using the Filtering box” on page 24.
8. In the TOP N box, define the data limit of a report to for the top (or bottom) number (N) of occurences of a field you specify. For more information on using this box, see “Using the TOP N box” on page 25.
9. In the Terminology box, select different domain terminology sets for your report parameter sets. For more information on using this box, see “Using the Terminology box” on page 26.
10. Click the View Report link.
CREATING A REPORT WITH A NEW PARAMETER SET
If you have Administrator privileges you can create new parameter sets in the Report Expert Administration section under the Parameter Sets tab. Administrator privileges also allow you to create a new parameter set in the client view Parameter area.
Use the New button to define a new parameter set name in the Edit Parameter Set Name field. Select the desired parameters from each of the parameter boxes, and click Save when done.
The new parameter set can applied to one of the standard reports to create a new report.
Using the Parameter Set controlsTo properly define a parameter set, you must understand how each of the Parameter Set controls is used. The subsections that follow describe each of these controls.
Using the Date / Time / Shift boxThe Date/Time/Shift box enables you to specify or change the date/time and shift properties associated with a parameter set. When applied to a report, these properties are used to filter out data that is not associated with the specified dates/times and shifts.
15

FACTORYTALK METRICS LINE EDITION USER’S GUIDE•
• •
• •
SELECTING DATE/TIME
There are six different ways to specify the values of the date/time properties; to select one, click the appropriate button and then enter any additional information.
Table 4-2. Date/Time buttons
Button Description
(All Time)When this button is clicked, you specify that you do not want to filter out any information based on the date and time when the data was recorded in the database.
(Specify Time Range with Start and End Dates)
When this button is clicked, you specify that you want to view all information that was recorded between a specified start and end date and time.
You must specify a time interval:
The Start and End date fields must specify a date with the following format: MM/DD/YYYY, where leading 0's in the month and day are optional (for example 4/1/2007). The following shortcut keys are available to quickly enter a date: [t] to enter today's date, [up arrow] for tomorrow's date, [down arrow] for yesterday's date, [page up] for the next month, [page down] for the previous month, and [c] to access the calendar date picker. You can also access the calendar date picker by clicking the calendar icon.
The Start and End time fields must specify a time with the following format: hh:mm:ss [AM or PM], where leading 0's in the hour are optional (for example 1:23:00 AM). The following shortcut keys are available to quickly enter a date: Ctrl + [n] to enter the current time, [up arrow] for the next minute, [down arrow] for the previous minute, [page up] for the next hour, [page down] for the previous hour.
(Specify Time Span Ending Now)
When this button is clicked, you specify that you want to view all information that was recorded during a specified time interval (in the past) through the current date and time.
You must specify a time interval. The first Past field must specify a number and the second Past field must contain a time value (Seconds, Minutes, and so on). Together, these two fields specify the length of the time interval.
16

3 • Using FactoryTalk Metrics LE• • • • •
(Specify Time Span Ending on Date)
When this button is clicked, you specify that you want to view all information that was recorded during a specified time interval (in the past) through a specified end date and time.
You must specify a time interval and an end date/time:
The Past field must specify a number and the Past list must contain a time value (Seconds, Minutes, and so on). Together, these two fields specify the length of the time interval.
The End date field must specify a date with the following format: MM/DD/YYYY, where leading 0's in the month and day are optional (for example 4/1/2007). The following shortcut keys are available to quickly enter a date: [t] to enter today's date, [up arrow] for tomorrow's date, [down arrow] for yesterday's date, [page up] for the next month, [page down] for the previous month, and [c] to access the calendar date picker. You can also access the calendar date picker by clicking the calendar icon.
The End time field must specify a time with the following format: hh:mm:ss [AM or PM], where leading 0's in the hour are optional (for example 1:23:00 AM). The following shortcut keys are available to quickly enter a date: Ctrl + [n] to enter the current time, [up arrow] for the next minute, [down arrow] for the previous minute, [page up] for the next hour, [page down] for the previous hour.
Table 4-2. Date/Time buttons
Button Description
17

FACTORYTALK METRICS LINE EDITION USER’S GUIDE•
• •
• •
SELECTING SHIFT
You must specify a shift by selecting one of the following from the Shift list:
A specific shift. Selecting one of these values will cause the corresponding report to return all data associated with the selected shift. If you do not collect shift-stamped data or you use time patterns for one or more of your workcells, the corresponding data will not be returned for each such workcell.
Current Shift. Selecting this value will cause the corresponding report to return all data associated with the currently running shift. If you do not collect shift-stamped data, you use time patterns for one or more of your workcells, or one or more workcells is outside of the current shift, the corresponding data will not be returned for each such workcell.
(Specify Time Span Starting on Start Date)
When this button is clicked, you specify that you want to view all information that was recorded during a specified time interval (in the past) from a specified start date and time.
You must specify a time interval and a start date/time:
The Next field must specify a number and the Next list must contain a time value (Seconds, Minutes, and so on). Together, these two fields specify the length of the time interval.
The Start date field must specify a date with the following format: MM/DD/YYYY, where leading 0's in the month and day are optional (for example 4/1/2007). The following shortcut keys are available to quickly enter a date: [t] to enter today's date, [up arrow] for tomorrow's date, [down arrow] for yesterday's date, [page up] for the next month, [page down] for the previous month, and [c] to access the calendar date picker. You can also access the calendar date picker by clicking the calendar icon.
The Start time field must specify a time with the following format: hh:mm:ss [AM or PM], where leading 0's in the hour are optional (for example 1:23:00 AM). The following shortcut keys are available to quickly enter a date: Ctrl + [n] to enter the current time, [up arrow] for the next minute, [down arrow] for the previous minute, [page up] for the next hour, [page down] for the previous hour.
(Specify Named Date Range)
When this button is clicked, you specify that you want to view all information that was recorded during a specified named date range.
You must specify a named date range (Today, Yesterday, Last Week, and so on).
Table 4-2. Date/Time buttons
Button Description
18

3 • Using FactoryTalk Metrics LE• • • • •
All. Data is returned for all workcells.
Using the Grouping boxThe Grouping box enables you to create one or more grouping filters that specify how the information in a report will be combined and physically arranged. When you create a grouping filter, you must specify the field that will be used to group the information and you must specify the grouping type. There are three grouping types: Row, Column, and Page.
The maximum number of fields/groups available are:
5 grouping fields
3 row groups
2 column groups
1 page group
The Event Detail report is an exception. It supports a maximum of 1 page group, 5 row groups, and 0 column groups.
Data aggregation for each grouping is done sequentially (1 through 5). When groupings are in the parameter set, aggregations are done for:
1. 0 groupings (grand totals)
2. Grouping 1
3. Grouping 1, 2
4. Grouping 1, 2, 3...
5. Etc.
An aggregation is not done for grouping 1, 3, or just grouping 3. This is not a concern until you mix row and column groupings. When there is a mix, you can expand group 3 before you expand group 2 for example.
A typical example might be grouping by WorkCell, Shift, Part, for the Performance report. This would let you see OEE for everything, OEE for each workcell, OEE for each shift for each workcell, and OEE for each part within each shift for each workcell. It would not let you see OEE for each part for each workcell. To do that, the order of the grouping would have to be WorkCell, Part, Shift.
19

FACTORYTALK METRICS LINE EDITION USER’S GUIDE•
• •
• •
SELECTING THE GROUPING FIELD
The grouping field is used by FactoryTalk Metrics LE to organize and label the information in a report. For example, if you selected Workcell as a grouping field and you have Bend, Cut, Finish, Machine, and Weld workcells, your report will contain rows, columns, or pages (subsections) labeled with those workcell names and containing data associated with those workcells. There is a maximum of 5 grouping fields.
SELECTING THE GROUPING TYPE
The grouping type is used by FactoryTalk Metrics LE to specify the general layout of the information in a report. There are three grouping types: row, column, and page.
Row grouping type
When you specify the row grouping type, the grouped information is organized in rows. For example, if you group a Performance report by workcell and select a group type of row, the information in your report will look something like this:
There is a maximum of 3 row groups.
Column grouping type
When you specify the column grouping type, the grouped information is organized in columns. For example, if you group a Performance report by workcell and select a group type of column, the information in your report will look something like this:
20

3 • Using FactoryTalk Metrics LE• • • • •
There is a maximum of 2 column groups.
Page grouping type
When you specify the page grouping type, the grouped information is organized in subsections. For example, if you group a Performance report by workcell and select a group type of column, the information in your report will look something like this:
There is a maximum of 1 page group.
SELECTING THE GROUPING EXPANSION TYPE
The Grouping expansion type is used to specify whether the grouped data will be initially displayed fully expanded or collapsed. To specify expanded, click the plus icon button (+) to the right of the grouping type list so that the plus turns into a minus (-).
21

FACTORYTALK METRICS LINE EDITION USER’S GUIDE•
• •
• •
To specify collapsed, accept the default plus icon button. For example, if you group a Performance report by workcell, select a group type of row, and specify expanded the information in your report will initially look something like this:
DELETING A GROUPING
Click the (Delete Grouping) button to remove an existing grouping.
Using the Sorting boxThe Sorting box enables you create one or more sort orders that specify how the information in a report will be sorted. When you create a sort order, you must specify the field that will be used to sort the information and you must specify a sort method. There are two methods of sorting: Ascending and Descending.
SELECTING THE SORT FIELD
The sort field is used by FactoryTalk Metrics LE to sort the information in a report. For example, if you selected Workcell as a sorting field, your report will be sorted by workcell.
22

3 • Using FactoryTalk Metrics LE• • • • •
Note: If you sort-by a field that is not displayed on the report, you will not notice changes caused by the sorting field unless you group-by the sorting field.
For example, in case of a Performance Report, the following fields are displayed on the report: Uptime %, Throughput %, Quality %, and OEE %. If you sort the report on the field Workcell, you will not notice any sorting related changes in the data displayed on the report. The workaround is to group-by the Workcell field (in addition to using the field in sort-by).
SELECTING THE SORT METHOD
The sort method specifies the order of the information within each grouping in a report. There are two sort methods:
Ascending Sort: When you specify the Ascending sort method, the information is sorted within each grouping alphabetically, from A to Z or numerically, from lowest to highest.
Descending Sort: When you specify the Descending sort method, the information is sorted within each grouping alphabetically, from Z to A or numerically, from highest to lowest.
DELETING A SORT
Click the (Delete Sort) button to remove an existing sort.
Using the Plant Model boxThe Plant Model box enables you to specify the activity areas of a plant for which a report will display data. The Plant Model box displays the plant model defined in the Plant Model dialog, which is accessed from the Configuration Console in RSBizWare.
To associate one or more activity areas with a parameter set, select the check boxes for those activity areas. For example, if you wanted to associate the Bend and Cut workcells with a parameter set, you would select their check boxes as shown below:
23

FACTORYTALK METRICS LINE EDITION USER’S GUIDE•
• •
• •
If you wanted to see information on all of the workcells in the preceding example, you would either check each workcell check box (Cut, Bend, Finish, Machine, and Weld) or the Main Line check box (selecting a parent checkbox automatically causes all child checkboxes to be implicitly selected). If you do not want to sort data based on a plant area, you would uncheck all boxes in the Plant Model area.
Using the Filtering boxThe Filtering box enables you create one or more filters that will limit the information displayed in the report. When applied to a report, the field and value pairs that you create are used to filter out data that is not associated with the specified field and value pairs.
For example, if you select Parts as the filtering field and you specify P3463ZX as the field value, your report will contain information for that part only.
SELECTING THE FILTERING FIELD AND VALUE
The filter field and value are used by FactoryTalk Metrics LE to limit the information returned to a report. The field you select will dictate how the value is to be entered—some
24

3 • Using FactoryTalk Metrics LE• • • • •
fields allow you to type any value in the box, while other fields require selection from a possible list of values.
The condition for all field and value pairs is "equals." If more than one filter is specified, the filter items are joined by a logical AND.
DELETING A FILTER
Click the (Delete Filter) button to remove an existing filter.
Using the TOP N boxUsing the Top N functionality, you can enable a parameter set to limit the data of a report to the top (or bottom) N (number) of occurrences of a field you specify.
When enabled, you must specify the field to limit and its desired maximum number of occurrences. The sorting will determine what the top or bottom N occurrences are of the limiting field.
When Top N is enabled, the top N rows of a dataset grouped only by the top N field and sorted by the top N field called “using”, will determine the top N occurrences of the top N field. “Top” will give the largest occurrences of the top N field while “bottom” will give the smallest occurrences. N can be a number between 1 and 20.
Example:
Let’s say you wanted an Event Summary report. The Parameter set was selected to be by Work Cell, and the Grouping was set to Event Reason Code. The Top N parameter box was set to Top, 3, of field Event Reason Code, using Event Count.
When querying for the dataset, each workcell could have a large number of reason codes. They could also have some reason codes in their own top 3, but not part of the overall top 3 for all workcells in the query.
The Top N feature will first determine the top 3 reason codes for all workcells in this example. Once those top 3 reason codes are determined, the query or queries used to
25

FACTORYTALK METRICS LINE EDITION USER’S GUIDE•
• •
• •
generate the report will include a filter to limit the data to these 3 reason codes across the entire report.
Using the Terminology boxThe terminology box in the parameter set toolbar enables you to apply different domain terminology sets to your report's parameter sets.
For example, if you have two domain terminology sets available, you can apply both sets to your report's parameter set. Thus, viewing your report using two different domain terminology sets.
To view, select a Report from the drop-down, select a Parameter Set from the drop-down, and then select a Terminology Set from the drop-down.
For information on administering the Terminology feature, see “Manage the Terminologies feature” on page 34.
Viewing and Using reportsThere are two ways for you to view a report; use the Explorer area and select a report from the tree of available reports, or use the Parameter area and select a set of parameters and view the report using those specific selections.
When a report is displayed in the main display area of FactoryTalk Metrics LE, it contains standard tools for navigating the report, exporting the report to external files, and printing the report.
An example of a report is shown below.
26

3 • Using FactoryTalk Metrics LE• • • • •
Navigating a reportThere are several tools to help you navigate a report and view its content.
Table 4-2. Navigation buttons
To ... Use the ...
Navigate the pages of a report Buttons on the page navigator to navigate to the
first page, previous page, next page, and last page or use the page text field to go directly to a specified page.
Zoom in or zoom out Zoom list to specify the zoom percentage at which to view
the report.
27

FACTORYTALK METRICS LINE EDITION USER’S GUIDE•
• •
• •
Exporting a reportTo export a report to a file:
1. Select the format of the file to which you want to export the report from the Select a format list and click Export. The following formats are available:
XML file with report data
CSV (comma delimited)
TIFF file
Acrobat (PDF) file
Web archive
Excel file
2. On the File Download dialog, click Save.
3. On the Save As dialog, specify a name and folder location for the file and click Save.
Printing a reportTo print a FactoryTalk Metrics LE report:
1. Click (the print button) in the report toolbar.
On the Print dialog, select a printer and click Print.
Find specific text in a report Search text field and the Find and Next buttons to
search for one or more instances of a specific text string.
View or hide detailed information associated with summary report lines
Plus and minus signs next to report lines to expand and collapse the summary report lines.
Refresh the content of the currently displayed report.
Refresh button.
Table 4-2. Navigation buttons
To ... Use the ...
28

4 Administering FactoryTalk Metrics LEThis chapter describes how to administer and maintain FactoryTalk Metrics LE so that it will best serve your specific needs. Only administrators can perform the functions described in this chapter.
Configuring security for FactoryTalk Metrics LEThere are two types of user roles in FactoryTalk Metrics LE:
Users, who have access only to the Report Viewer areas of FactoryTalk Metrics LE.
Administrators, who have access to all areas of FactoryTalk Metrics LE including the Administration area.
FactoryTalk Metrics LE makes use of Windows integrated security to enable you to identify a user as either a user or an administrator. If you don’t require that functionality, you can disable security in FactoryTalk Metrics LE.
Note: The instructions in this section assume that the FactoryTalk Metrics LE Web Site and all of the FactoryTalk Metrics LE Clients are contained within a single domain. In addition, this section assumes that the security administrator is familiar with Windows security.
Setting up securityTo set up security for FactoryTalk Metrics LE, perform the following steps on the FactoryTalk Metrics LE Web Site:
1. Create a new local group to contain all of your FactoryTalk Metrics LE administrators by using the Computer Management application contained in the Windows Administrative Tools program group.For example, you could create a group named host\RptExpAdmins. Note: By default the existing host\Administrators group is the administrator’s group.
2. For each administrator, add the administrator’s Windows domain user name to the group created in Step 1 by using the Computer Management application contained in the Windows Administrative Tools program group.
3. Using an ASCII editor such as Notepad, edit the following lines contained in the Web.config file in the FactoryTalk Metrics LE installation directory ( <install_dir>\Website\Web.config ) and replace the word Administrators with the name of the group you created in Step 1:
<add key="ReportExpertAdminGroup" value="Administrators"/>...
29

FACTORYTALK METRICS LINE EDITION USER’S GUIDE•
• •
• •
<allow roles="Administrators"/>For example:
<add key="ReportExpertAdminGroup" value="RptExpAdmins"/>...<allow roles="RptExpAdmins"/>
Disabling securityTo disable security for FactoryTalk Metrics LE and allow any user full administrator access, do the following on the FactoryTalk Metrics LE Web Site:
Remove or comment out the ReportExpertAdminGroup add key.
<add key="ReportExpertAdminGroup" value="Administrators"/>...<allow roles="Administrators"/>
For example you can comment it out by using a <!-- before and a --> after the add key line:
<!-- <add key="ReportExpertAdminGroup" value="RptExpAdmins"/>
-->
Loading FactoryTalk Metrics LE data into the RSBizWare database
Prior to using FactoryTalk Metrics LE, you must load data required by FactoryTalk Metrics LE into the RSBizWare database by doing the following:
1. Using the Windows ODBC Data Source Administrator dialog, create a data source name (DSN) for the RSBizWare database on the server containing the FactoryTalk Metrics LE Web Site. If RSBizWare is already installed and configured on the server containing the FactoryTalk Metrics LE Web Site, the DSN to the RSBizWare database will already exist. For more information on creating a DSN, see the RSBizWare Administrator’s Guide.
2. Load the FactoryTalk Metrics LE data into the RSBizWare database by running the RSBizWare Database Load and Update Wizard from the Windows Start menu by selecting Programs > Rockwell Software > FactoryTalk Tools> Database Wizard. On the RSBizWare Product and Database Connection panel, select the DSN that you created in the preceding step and connect to it by supplying the user and password for the
30

4 • Administering FactoryTalk Metrics LE• • • • •
DSN. Then, select the FactoryTalk Metrics LE checkbox in the Available Product Modules list and click Finish to load the data.
3. Click Close after the data load completes.
Database Wizard screens:
31

FACTORYTALK METRICS LINE EDITION USER’S GUIDE•
• •
• •
32

4 • Administering FactoryTalk Metrics LE• • • • •
Accessing FactoryTalk Metrics LE and the Report Expert Administration area
Report Expert is the reporting interface for FactoryTalk Metrics LE.
To access Report Expert, open Internet Explorer, enter the address for the Report Expert Web Site (server machine name, slash, “reportexpert”; for example, rsi-rockwell/reportexpert) in the browser’s Address field, and press the Enter key.
To access the Administration area containing the functional areas described in this chapter, do either of the following:
Click the Administration button in the Report Expert toolbar
Click the Administration link on the Report Expert home page.
The Administration area is shown below:
33

FACTORYTALK METRICS LINE EDITION USER’S GUIDE•
• •
• •
The Administration area of Report Expert enables administrators to do the following:
Manage the Explorer area
Manage the Quick Web feature
Manage Report Subscriptions
Manage Parameter sets
Manage the Terminologies feature
Manage the Line Order feature
Each of these functions is described in this chapter.
Managing the Explorer AreaThe Report Explorer tab enables you to add, modify, and delete Report Expert items (FactoryTalk Metrics LE reports, Microsoft Reporting Services folders, URLs, and folders) that are the components of the tree in the Explorer area. From this dialog, you can also preview reports and URLs in a separate Internet Explorer session. As in other standard trees, the items that make up the report tree are arranged in a hierarchy that users can navigate to access standard and site-specific reports and URLs.
34

4 • Administering FactoryTalk Metrics LE• • • • •
Add an item to the treeTo add an item to the tree in the Explorer area:
1. Select the tree item under which you want your new item to appear and click the New button. (Note: the right mouse button menu can also be used to add new items. Items may also be rearranged in the tree by dragging and dropping an item).
2. Enter the desired item title in the Tree Item Title field.
3. Enter text to describe the item in the Description (Tooltip) field. This is the text that appears as a tool tip in the status bar when a user hovers the mouse pointer over the tree item title when in the Explorer view.
4. Select the type of item you want to add from the Tree Item Type drop down list. The available items are:
Folder: A folder that you can use to hold reports, URLs, or other folders.
Report Expert Report: If you select this option, then two additional fields appear; the Report Expert Report drop down list, from which you must select one of the 8 standard reports, and the Parameter Set drop down list, from which you must select one of the saved parameters sets that you want to apply to the selected report.
35

FACTORYTALK METRICS LINE EDITION USER’S GUIDE•
• •
• •
URL: Adding a URL to the tree allows your users to link to another Web page from Report Expert. Enter the path to the Web page in the URL text box (which is only available if URL is selected as the Tree Item Type).
Reporting Services Folder: A Reporting Services Folder provides a convenient link to a folder in Microsoft Reporting Services, containing custom reports. Use the Reporting Services Folder text box to enter the name of the folder.
5. From the Tree Image drop down list, select the image that you want displayed to the left of the name of your new item in the tree.
6. Select a Terminology option from the Terminology drop down list. Refer to the “Managing the Terminologies Feature” on page 26 for more information.
7. Click the Save button to save the tree items.
8. Click the Sync IIS with New Terminology button on the Terminology tab to apply changes to the report.Note: You can apply Terminology sets to your reports from the Parameter Set tab as well. However, the terminology sets applied here in the Report Tree tab take precedence over sets applied via the Parameters Set tab.
9. Click Preview to view the new report or URL in a separate Internet Explorer session.
10. Click Save to save your selections or click Cancel to ignore them.
Modify an item in the treeTo modify an existing item in the tree:
1. Select the item that you want to modify from the tree on the left side of the Report Explorer tab.
2. Make any desired changes to the tree item as described in steps 2 though 6 in the preceding section.
3. Click Preview to view the new report or URL in a separate Internet Explorer session.
4. Click Save to save your selections or click Cancel to ignore them.
Delete an item from the treeTo delete an item from the Explorer tree:
1. Select the item that you want to delete from the tree.
2. Click the Delete button. You will be prompted to confirm your deletion. Note: you can also select Delete from the right mouse button menu.
36

4 • Administering FactoryTalk Metrics LE• • • • •
Managing the Quick Web FeatureThe QuickWeb is a special Web page, hosted by the Information Services Manager, that gives you access to reports stored on the Information Services Manager. The QuickWeb tab enables you to include a QuickWeb page in the tree of the Explorer area. When added, QuickWeb will appear as separate tab in the Explorer area.
To include the QuickWeb on the Report Expert client page:
1. Select the QuickWeb checkbox.
2. Enter the name of the Information Services Manager host.
3. Enter the HTTP port number used by the Information Services Manager computer.
4. Click Save to save your changes.
Managing Report SubscriptionsThe Subscriptions tab of the Administration area provides a way for you to schedule reports to be created and delivered in an unattended manner. For example, you can create a subscription that emails the previous day’s production report every week day in PDF format to your shop floor supervisors.
37

FACTORYTALK METRICS LINE EDITION USER’S GUIDE•
• •
• •
Adding a Report SubscriptionTo add a new report subscription:
1. From the Report list, select the report that you want to run on a scheduled interval.
2. Select the Parameter Set that will provide the filtering criteria for this subscription.
3. Select a delivery method from the Delivery list.
4. From the Schedule list, select the shared schedule that will define how often the subscription runs.
5. Click New to create a new subscription record. The new record will be added to the list at the bottom of the page; however, until you modify the record, it will not be saved as a subscription.
Modifying a Report SubscriptionTo modify a report subscription:
1. Click the Edit link in the Edit Command column for the subscription to which you want to make changes.
2. Enter the following information:For subscriptions using the Email delivery method:
Description—A meaningful description of the report.
Email To (required)—The email address to which the report will be sent.
38

4 • Administering FactoryTalk Metrics LE• • • • •
CC—The email address to which a Carbon Copy of the report will be sent.
BCC—The email address to which a Blind Carbon Copy of the report will be sent.
Subject (required)—The text that will appear in the subject line of the email message
Render Format (required)—The name of the rendering extension to use to generate the rendered report. This value is required if Include Report is set to true. Valid values are XML, CSV, Image, PDF, Excel, HTML 4.0, HTML 3.2, MHTML.
Reply To—The email address that will appear in the Reply To header of the email message. The value must be a single email address.
Comment—The text that will be included in the body of the email message.
Priority—The priority with which the email is sent. Valid values are Normal, Low, and High. The default value is Normal.
Include Report (required)—This value indicates whether to include the report in the email delivery. A value of true indicates that the report is included in the body of the email message.
Include Link (required)—This value indicates whether to include a link to the report in the body of the email. A value of true indicates that a link to the report is included in the body of the email message.
For subscriptions using the FileShare delivery method:
Description—A meaningful description of the report.
File (required)—The name of the file that is saved to disk.
Path (required)—The UNC file share path to which to save the report.
Extension (required)—Indicates whether to include a file extension for the rendered report. The value is either true or false.
UserName (required)—The username required to access the network resource or disk.
Password (required)—The password required to access the network resource or disk.
Write Mode (required)—The write mode to use when accessing the disk. Valid values are None, Overwrite and AutoIncrement.
39

FACTORYTALK METRICS LINE EDITION USER’S GUIDE•
• •
• •
Render Format (required)—The name of the rendering extension to use to generate the rendered report. Valid values are XML, CSV, Image, PDF, Excel, HTML 4.0, HTML 3.2, MHTML.
3. Click the Update link in the Edit Command column to save your changes. The subscription will run at the next occurrence of the specified schedule.
4. Click Save to write the changes to the database. The subscription will run at the next occurrence of the specified schedule.
Note: If you close your browser before clicking Save, the changes are lost.
Deleting a Report SubscriptionTo delete an existing report subscription:
1. Click the Delete link in the Edit Command column for the subscription you want to delete. You will be prompted to confirm the deletion.
2. Click Save to write the changes to the database.
Note: If you close your browser before clicking Save, the changes are lost.
Managing Parameter SetsThe Parameter Sets tab enables you to add, modify, and delete the parameter sets that serve as the filtering criteria required to execute FactoryTalk Metrics LE reports.
40

4 • Administering FactoryTalk Metrics LE• • • • •
Adding a Parameter SetTo add a new parameter set, do the following:
1. Click New and enter a name for the parameter set in the Parameter Set Name field. The name you entered in the Parameter Set Name field will appear in the Select Parameter Set field.
2. In the Date / Time / Shift box, define how you want to filter the data based on time. For more information on using this box, see “Using the Date / Time / Shift box” on page 15.
3. In the Grouping box, define how you want to group and organize the information in the report. For more information on using this box, see “Using the Grouping box” on page 19.
4. In the Sorting box, define how you want the grouped information sorted. For more information on using this box, see “Using the Sorting box” on page 22.
5. In the Plant Model box, specify the activity areas for which you want information to be displayed in the report. For more information on using this box, see “Using the Plant Model box” on page 23.
6. In the Filtering box, define how you want to further filter the information in the report. For more information on using this box, see “Using the Filtering box” on page 24.
41

FACTORYTALK METRICS LINE EDITION USER’S GUIDE•
• •
• •
7. In the TOP N box, define the data limit of a report to for the top (or bottom) number (N) of occurences of a field you specify. For more information, see “Using the TOP N box” on page 25.
8. In the Terminology box, select different domain terminology sets for your report parameter sets. For more information, see “Using the Terminology box” on page 26.Note: The terminology sets applied in the Report Explorer tab take precedence over terminology sets applied via the Parameters Set tab.
9. Click Save to save the new parameter set.
Modifying a Parameter SetTo modify an existing parameter set:
1. Select the existing parameter set from the Select Parameter Set list.
2. Make the changes you want in the various parameter set boxes, described in “Using the Parameter Set controls” on page 15.
3. Click Save to save the modified parameter set.
Deleting a Parameter SetTo delete an existing parameter set:
1. Select the parameter set from the Select Parameter Set list.
2. Click Delete to delete the selected parameter set.
Managing the Terminologies FeatureThe Terminology dialog enables you to create terminology for your specific domain, copy terminology to other cultures (languages), and edit terminology appropriate to the context of your domain.
For example, if you have an Electronics plant, you can use this dialog box to create a domain terminology specific to your plant, add terms to your domain terminology from Report Expert's default terminology database, copy your domain terminology into other languages, and edit or translate terms as appropriate to your domain and culture (language).
The default culture (language) in Report Expert is English (United States).
Note: The functions described in this section can only be performed by Administrators.
42

4 • Administering FactoryTalk Metrics LE• • • • •
Create a new domain terminologyIn the Create a New Terminology box, enter the new name, and then click the Create Terminology button.
Add terms to selected terminology1. In the Add terms to selected Terminology box, select a domain terminology from the
Terminology drop-down.
2. In the Terminology Editor box on the left, select the terms you want to add. Use the checkbox to the left of each term.
3. Click the numbered links at the bottom of the page to scroll through all available terms.
4. Once you have selected all the terms, click the Add Terms button in the right pane. The terms will be added, and all terms displayed in the terminology editor.
5. Click the Sync IIS with new Terminology button below the editor.
Note: If you are adding terms to a domain terminology that has versions in other cultures (languages), they will be added to all versions of that domain terminology. Once added, you must edit or translate the terms as appropriate to your domain and culture (language).
43

FACTORYTALK METRICS LINE EDITION USER’S GUIDE•
• •
• •
Edit terms1. Select a domain terminology from the Terminology drop-down underneath the
Terminology Editor title on the Terminology Editor box on the left. The terms from that domain terminology will be displayed in the Terminology Editor.
2. To edit a term, click the Edit link in the row for the term. This will open an edit box containing the current value of the term.
3. Edit the term as appropriate to the culture and domain, and click Update.
4. If you don't want to make changes, click Cancel to cancel the edit.
5. Click Delete to remove a term from the domain terminology.
Note: You can not delete terms from the default terminology database. You can only delete terms from your domain terminology database.
6. To view all of the terms in the terminology, use the numbered links shown at the bottom of the editor.
7. Click the Sync IIS with new Terminology button below the editor.
Copy terminology to another culture1. Select a domain terminology from the Terminology drop-down underneath the
Terminology Editor title in the Terminology Editor box.
2. In the Copy Terminology to a different Culture box, select a language from the Culture drop-down, and click the Copy Terminology button. This will copy all terms of that domain terminology to the culture you selected.
3. Once copied, you must edit or translate terms as appropriate to that culture (language).
Delete terminology1. Select a domain terminology from the Terminology drop-down underneath the
Terminology Editor title in the Terminology Editor box.
2. Click Delete Terminology to delete the selected domain terminology. Deleting a domain terminology also deletes all translated versions of it in other cultures. For example, if you had a copy of your domain terminology in Chinese, deleting will remove the Chinese version as well.
Delete copied (in another culture) version of domain terminology1. Select a domain terminology from the Terminology drop-down underneath the
Terminology Editor title.
44

4 • Administering FactoryTalk Metrics LE• • • • •
2. Select a culture from the Culture drop-down underneath the Terminology drop-down.
3. Click Delete Culture to remove that version of your domain terminology.
Init terminology every reportThis checkbox will set the Reporting Expert software to reload/refresh Terminology on a continuing basis. Use this option when you want your reports to quickly reflect the changes in Terminology or other settings. Otherwise, turn it off (de-select the checkbox) to conserve database resources.
Managing the Line Order FeatureThe Line Order feature allows you to specify the order of work cells within a specific line.
Note: The functions described in this section can only be performed by Administrators.
Select a Line from the Line drop down box. The Line Order field will then display all of the workcells in that line. The “first” workcell is displayed at the top.
To re-order the line, select a workcell and use the Shift Up or Shift Down buttons to move the workcell to the new desired position.
Click Save when done.
45

FACTORYTALK METRICS LINE EDITION USER’S GUIDE•
• •
• •
46

5 Standard Reports
FactoryTalk Metrics Line Edition Standard ReportsThis chapter contains information about the FactoryTalk Metrics LE standard reports. The following topics are covered for each of the reports:
Report field descriptions: These are descriptions of each of the fields in the reports.
Raw data: The source of the raw data used in each of the reports.
Calculations: These are the formulas used to derive the calculated fields in each of the reports.
All reports are based upon these standard 8 reports. The next chapter describes the pre-defined FactoryTalk Metrics LE reports that are included with the product. Those reports can be used as is, or modified or extended to address specific needs.
Report field descriptionsThis section describes each of the fields in each of the Report Expert reports.
Event Detail reportThe Event Detail report shows raw event data. The report contains a time-series chart for each group field value plotting when the event was high and when it was low, as well as a grid that shows the following fields:
Start Time—The date and time that the event started.
End Time—The date and time that the event ended.
Duration—The length of the event, calculated as the difference between Start Time and End Time and displayed using the format HH:MM:SS.mmm.
Start Value—The value collected at the start of the event.
End Value—The value collected at the end of the event.
Event Summary reportThe Event Summary Report shows aggregated event data. This report allows you to determine how often and for how long events occurred during the manufacturing process. The report contains a horizontal bar chart showing Event Count and Time In Event, as well as a grid that shows the following fields:
Event Count—The number of events that occurred during the reporting period.
47

FACTORYTALK METRICS LINE EDITION USER’S GUIDE•
• •
• •
Time In Event—The total time (HH:MM:SS.mmm) in the reporting period during which an event was occurring.
Min Duration—The shortest event occurrence.
Max Duration—The longest event occurrence.
Average Duration—The average length of event occurrences.
Clicking any of these fields in the Event Summary report will link back to the Event Summary report. The new report will be grouped by the next value in the click-through hierarchy (Enterprise, Site, Area, Line, Workcell, Month, Week, Day, Shift, Hour); once at the group by hour level, the next drill-through click will display the event detail report filtered by that hour.
Performance reportThe Performance report provides the Overall Equipment Effectiveness (OEE) rating that can be used to assess a single machine’s performance over time or to compare the performance of machines to each other. The Performance report contains a horizontal bar chart showing OEE Percent, as well as a grid that shows the following fields:
Availability—The percentage of available time that the machine was actually running.
Throughput—The performance of a machine when it is running compared to its ideal cycle time. The ideal cycle time will depend upon the product being produced and is measured in units of seconds per part.
Quality—The percentage of good parts that are produced.
OEE—The product of Uptime, Throughput, and Quality.
Clicking a value in the Availability, Throughput, or Quality fields in the report will link to the report of the same name. Clicking OEE will link back to the Performance report. The new report will be grouped by the selected value or the next value in the clickthrough hierarchy (Enterprise, Site, Area, Line, Workcell, Month, Week, Day, Shift, Hour).
Production reportThe Production report allows you to determine the production success of a single workcell or to compare the production successes of multiple workcells. The Production report contains the following charts:
A horizontal bar chart showing Good Parts.
A line chart showing Good Parts versus Ideal Parts.
The Production report also contains a grid that shows the following fields:
48

5 • Standard Reports• • • • •
Good Parts—The number of good parts produced.
Scrap Parts—The number of parts rejected due to poor quality.
Total Parts—The total number of parts produced.
Ideal Parts—The total number of parts that could have been produced in the available time.
Percent Ideal—A measurement of how close the activity area was to ideal performance. This calculation is the percentage of the ideal part count that was actually produced.
Percent Scrap—The percentage of total parts produced that were rejected due to poor quality.
Run Time—The number of seconds the machine was in a running state.
Uptime Percent—The percentage of available time that the machine was actually running.
Clicking a value in the Run Time or Uptime Percent fields in the report will link to the Uptime report. All other columns will link back to the Production report. The new report will be grouped by the selected value.
Quality reportThe Quality report allows you to assess the quality of the parts that have been produced by a machine. The Quality report contains a horizontal bar chart showing Quality Percent, as well as a grid that shows the following fields:
Good Parts—The number of good parts produced.
Scrap Parts—The number of parts rejected due to poor quality.
Quality—The percentage of total parts produced that were of good quality.
Clicking on any of these fields in the Quality report will link back to the Quality report. The new report will be grouped by the selected value.
Root Cause Analysis reportThe Root Cause Analysis report consists of a Gantt chart displaying workcell state occurrences over time. The chart will display the work cells in the order specified by the Line Order parameter configuration.
Below the Gantt chart for each line is a table of data showing the same data used in the chart. The data in the table consists of:
Work Cell—The work cell selected for the report.
49

FACTORYTALK METRICS LINE EDITION USER’S GUIDE•
• •
• •
State Name—The machine state. This field is color coded.
Start Time—The date and time that the event started.
End Time—The date and time that the event started.
Duration—The end time minus the start time.
The report has six control buttons. Each adjusts the parameter set time window of the state data displayed.
<< Scroll left 1: Decrease the parameter set time start and end by the difference between end and start.
< Scroll left 1/4: Decrease the parameter set time start and end by 1/4 the difference between end and start.
>> Scroll right 1: Increase the parameter set time start and end by the difference between end and start.
> Scroll right 1/4: Increase the parameter set time start and end by 1/4 the difference between end and start.
Zoom In: Zoom in 50%. Increase the parameter set time start and decrease the parameter set time end by 1/4 the difference between end and start.
Zoom Out: Zoom out 2X. Decrease the parameter set time start and increase the parameter set time end by 1/2 the difference between end and start.
Throughput reportThe Throughput report allows you to assess the performance of a machine as compared to its ideal cycle time. The ideal cycle time will depend upon the product being produced and is measured in units of seconds per part.
The Throughput report contains the following charts:
A horizontal bar chart showing Throughput Percent.
A line chart showing Ideal Cycle Time versus Realized Cycle Time.
The Throughput report also contains a grid that shows the following fields:
Total Parts—The total number of parts produced.
Run Time—The number of seconds the machine was in a running state.
Realized Cycle Time—The actual amount of time it took to produce a part. This value is a ratio of running time to the total number of parts produced.
50

5 • Standard Reports• • • • •
Cycle Time Diff.—The difference between the ideal amount of time it should take to produce a part and the actual amount of time it took to produce parts.
Cycle Time Diff. Pct.—A percentage of the difference between the Ideal and Realized cycle times.
Throughput—The performance of a machine when it is running compared to its ideal cycle time. The ideal cycle time will depend upon the product being produced and is measured in units of seconds per part.
Clicking a value in the Total Parts field will link to the Production report. Clicking on a value in the Run Time field will link to the Uptime report. All other fields will link back to the Throughput report. The new report will be grouped by the selected value.
Uptime reportThe Uptime report allows you to assess the production availability of one or more activity areas. Uptime is a ratio of running time to available time. Available time may be defined by a schedule or modified by planned downtime events such as preventive maintenance. Available time may also be modified by events such as being starved for parts or being blocked by a downstream process.
The Uptime report contains a horizontal bar chart showing Uptime Percent, as well as a grid that shows the following fields:
Run Time—The number of seconds the machine was in a running state.
Available Time—Uptime (or Available time) may be defined by a schedule or modified by planned downtime events such as preventive maintenance. Uptime may also be modified by events such as being starved for parts or being blocked by a downstream process.
Downtime—The amount of time the machine was available, but was not running.
Stops-A count of how many times an activity area stopped during production. How Stops is determined varies based on the Run Type specified for the activity area.
If the activity area is configured as “Always Running” then the Stops value is set to zero.
If the activity area is configured as “Running when Available and not in a Faulted State” then the Stops value is set to FaultCount.
If the activity area is configured as “Unscheduled Datapoint to determine Running State” then the system simply counts the number of times the data point event goes low.
51
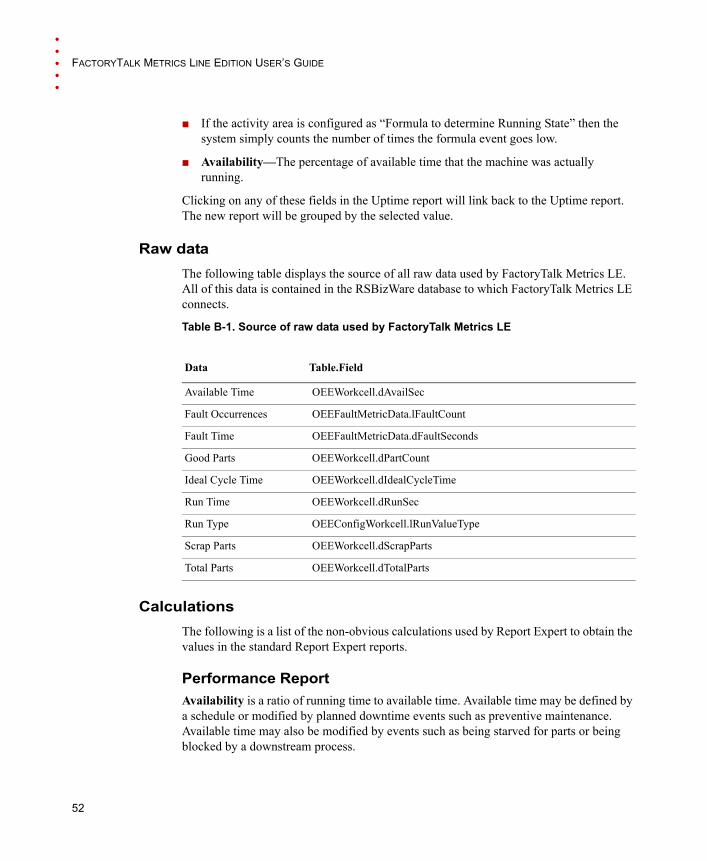
FACTORYTALK METRICS LINE EDITION USER’S GUIDE•
• •
• •
If the activity area is configured as “Formula to determine Running State” then the system simply counts the number of times the formula event goes low.
Availability—The percentage of available time that the machine was actually running.
Clicking on any of these fields in the Uptime report will link back to the Uptime report. The new report will be grouped by the selected value.
Raw dataThe following table displays the source of all raw data used by FactoryTalk Metrics LE. All of this data is contained in the RSBizWare database to which FactoryTalk Metrics LE connects.
Table B-1. Source of raw data used by FactoryTalk Metrics LE
CalculationsThe following is a list of the non-obvious calculations used by Report Expert to obtain the values in the standard Report Expert reports.
Performance ReportAvailability is a ratio of running time to available time. Available time may be defined by a schedule or modified by planned downtime events such as preventive maintenance. Available time may also be modified by events such as being starved for parts or being blocked by a downstream process.
Data Table.Field
Available Time OEEWorkcell.dAvailSec
Fault Occurrences OEEFaultMetricData.lFaultCount
Fault Time OEEFaultMetricData.dFaultSeconds
Good Parts OEEWorkcell.dPartCount
Ideal Cycle Time OEEWorkcell.dIdealCycleTime
Run Time OEEWorkcell.dRunSec
Run Type OEEConfigWorkcell.lRunValueType
Scrap Parts OEEWorkcell.dScrapParts
Total Parts OEEWorkcell.dTotalParts
52

5 • Standard Reports• • • • •
Throughput is the performance of a machine when it is running compared to its ideal cycle time. The ideal cycle time will depend upon the product being produced and is measured in units of seconds per part.
Quality is the percentage of good parts that are produced.
The OEE calculation is the product of these three components:
or
This reduces to:
Note: The OEE calculation will typically be performed over a time range with numerous IdealCycleTime values. In this case, the calculation should be done for each unique IdealCycleTime using the GoodParts and AvailableTime during that IdealCycleTime. Each individual calculation should then be multiplied by its fraction of the TotalAvailableTime (AvailableTime/TotalAvailableTime) and then summed together. The formula below illustrates the calculation with multiple IdealCycleTimes.
Where ICT = IdealCycleTime, GP = GoodParts, and A = AvailableTime.
Production ReportIdealParts is the total number of parts that could have been produced in the available time.
PercentIdeal is a measurement of how close the activity area was to ideal performance. This calculation is the percentage of the ideal part count that was actually produced.
Availablity RunningTime AvailableTime⁄=
Throughput TotalParts IdealCycleTime×( ) RunningTime⁄=
Quality GoodParts TotalParts⁄=
OEE Availability Throughput× Quality×=
OEE RunningTimeAvailableTime----------------------------------------- TotalParts IdealCycleTime×
RunningTime---------------------------------------------------------------------------------× GoodParts
TotalParts------------------------------×=
OEE IdealCycleTime GoodParts×AvailableTime
----------------------------------------------------------------------------------=
OEE ICT1 GP1×( ) ICT2 GP2×( ) ICTn GPn×( )+ +A1 A2 An+ +
-------------------------------------------------------------------------------------------------------------------------=
IdealParts AvailableTime IdealCycleTime⁄=
53

FACTORYTALK METRICS LINE EDITION USER’S GUIDE•
• •
• •
PercentScrap is the percentage of total parts produced that were scrapped.
UptimePercent is the percentage of available time that the machine was actually running.
Quality ReportQuality is the percentage of total parts produced that were of good quality.
Throughput ReportRealizedCycleTime is the actual amount of time it takes to produce a part. This value is a ratio of running time to the total number of parts produced.
CycleTimeDifference is the difference between the ideal amount of time it should take to produce a part and the actual amount of time it took to produce parts.
CycleTimePercentDifference is a percentage of the difference between the Ideal and Realized cycle times.
The Throughput calculation is as defined in the Performance Report above.
Uptime ReportDowntime is the amount of time the machine is available, but is not running.
The Stops value is simply a count of how many times an activity area stopped during production. How Stops is determined varies based on the Run Type specified for the activity area. If the activity area is configured as “Always Running” then
PercentIdeal GoodParts IdealParts⁄=
PercentScrap ScrapParts TotalParts⁄=
UptimePercent RunningTime AvailableTime⁄=
Quality GoodParts TotalParts⁄=
RealizedCycleTime RunningTime TotalParts⁄=
CycleTimeDifference IdealCycleTime RealizedCycleTime–=
CycleTimePercentDifference C– ycleTimeDifference IdealCycleTime⁄=
DownTime AvailableTime RunningTime–=
Stops 0=
54

5 • Standard Reports• • • • •
If the activity area is configured as “Running when Available and not in a Faulted State” then
If the activity area is configured as “Unscheduled Datapoint to determine Running State” then the system simply counts the number of times the datapoint event goes low.
If the activity area is configured as “Formula to determine Running State” then the system simply counts the number of times the formula event goes low.
The Availability calculation is as defined in the Performance Report above.
Stops FaultCount=
Stops COUNT HighLowTransitionsOfActivityAreaRunningPointEvent( )=
Stops COUNT HighLowTransitionsOfActivityAreaRunningFormulaEvent( )=
55

FACTORYTALK METRICS LINE EDITION USER’S GUIDE•
• •
• •
56

6 FactoryTalk Metrics Line Edition ReportsFactoryTalk Metrics LE is shipped with pre-configured components (workcell definition, performance and event data collection scheme, and reports). Plant personnel can modify or extend the standard configuration to address the needs of their solution by leveraging the configuration wizards provided in the FactoryTalk Metrics Production Client application. FactoryTalk Metrics Line( <install_dir>\Website\Web.config ) Edition captures, analyzes, and displays key performance metrics associated with production lines, machines and workcells.
These reports have been configured and grouped in a fashion that facilitates the analysis process.
These reports can be seen in the Explorer tree as shown below:
These reports can be used as they are pre-defined or they may be modified to suit your application needs. The pre-configured reports are defined in this chapter.
Dashboard FolderThis is a folder where a custom “dashboard” type of report may be located. This allows quick access to a custom report containing data that you’d use frequently. The report could be created from an existing report or could be created from newly defined parameters.
57

FACTORYTALK METRICS LINE EDITION USER’S GUIDE•
• •
• •
OEE Summary ReportThis report is based upon the Performance standard report. The OEE Summary report displays OEE component summary information (Uptime %, Throughput %, Quality %) for selected production lines, work cells, and time periods. The OEE (Overall Equipment Effectiveness) Summary report uses the following parameter filter criteria:
Line (single selection)
Time interval
Start Date/Time
End Date/Time
This report has a chart that reflects the following information for the parameters selected:
Equipment Availability
Performance Efficiency
Quality Rate
OEE
Line Efficiency
The following definitions are displayed at the bottom of the report:
Uptime %
Throughput %
Quality %
OEE Details ReportThis report is based upon the Performance standard report. The OEE Details report displays OEE component detail information (Uptime %, Throughput %, Quality %) for selected production lines, work cells, and time periods. The OEE (Overall Equipment Effectiveness) Details report uses the following parameter filter criteria:
Line (multiple selections)
Work cell (multiple selections)
Shift (multiple selections)
Product (multiple selections)
Time interval
Start Date/Time
58

6 • FACTORYTALK METRICS LINE EDITION REPORTS• • • • •
End Date/Time
This report has a chart or grid that reflects the following information for the parameters selected:
Line
Work cell
Shift
Product ID
Equipment Availability
Performance Efficiency
Quality Rate
OEE
Time Stamp
The following definitions are displayed at the bottom of the report:
Uptime %
Throughput %
Quality %
Line Efficiency ReportThis report is based upon the Throughput standard report. The Line Efficiency report displays detailed line efficiency information (Total Parts Produced, Realized Cycle Time, Throughput %) for selected production lines, work cells, parts, and time periods (by shift). The Line Efficiency report uses the following parameter filter criteria:
Line (multiple selections)
Shift (multiple selections)
Product (multiple selections)
Time interval
Start Date/Time
End Date/Time
This report has a chart or grid that reflects the following information for the parameters selected:
59

FACTORYTALK METRICS LINE EDITION USER’S GUIDE•
• •
• •
Line
Product ID
Shift
Good Parts
Ideal Cycle Time
Line Efficiency
The Line Efficiency definition is displayed at the bottom of the report.
Line Efficiency = (Good Parts x Ideal Cycle Time) / Ideal Available Time
Availability ReportThis report is based upon the Uptime standard report. The Availability report provides detailed availability data (Running Time vs. Available Time) for selected production lines, work cells, and time periods (by shift). The Availability report uses the following parameter filter criteria:
Line (multiple selections)
Work cell (multiple selections)
Shift (multiple selections)
Product (multiple selections)
Time Interval
Start Date/Time
End Date/Time
This report has a chart or grid that reflects the following information for the parameters selected:
Line
Work cell
Shift
Product ID
Available Mins
Running Mins
Equipment Availability
60

6 • FACTORYTALK METRICS LINE EDITION REPORTS• • • • •
The following reports can be accessed from this report by clicking the appropriate items:
State Top 10 report
Change Over report
Down Time Top 10 report
Change Over ReportThis report is based upon the Event Summary standard report. The Change Over report displays detailed Change Over data for selected production lines, work cells, part IDs, and time periods. The Change Over report uses the following parameter filter criteria:
Line (multiple selections)
Work cell (multiple selections)
Shift (multiple selections)
Product (multiple selections)
Time Interval
Start Date/Time
End Date/Time
This report has a chart or grid that reflects the following information for the parameters selected:
Line
Work cell
Shift
Product ID
Duration
Time Stamp
The Change Over report has a line chart that displays the change over duration for the selected filter criteria. (X Axis = date/time, Y Axis = change over duration time, Chart points = work cell change over duration times.)
There is also a line chart that displays the change over counts for the selected filter criteria (X Axis = date/time, Y Axis = change over counts, chart points = work cell change over counts.)
61

FACTORYTALK METRICS LINE EDITION USER’S GUIDE•
• •
• •
States Top 10This report is based upon the Event Summary standard report. The States Top 10 report displays top 10 states (e.g. Starved, Blocked, etc.) for selected work cells and time periods. The States Top 10 report uses the following parameter filter criteria:
Line (multiple selections)
Work cell (multiple selections)
Shift (multiple selections)
Product (multiple selections)
Time Interval
Start Date/Time
End Date/Time
One of the following grouping criteria may be chosen:
Work cell
Product ID
Shift
Operator
This report has a grouped bar chart that displays the top 10 states durations for the selected filter and grouping criteria. It also has a grouped bar chart that displays the top 10 states occurrences for the selected filter and grouping criteria.
This report has a grid that displays the following State Occurrence Summary information for the selected filter criteria:
Grouping
Event Description
Duration
Count
This report has a grid that displays the following State Occurrence Details for the selected filter criteria:
Line
Work cell
Shift
62

6 • FACTORYTALK METRICS LINE EDITION REPORTS• • • • •
Product ID
Event Description
Duration
Count
Operator
Time Stamp
Down Time Top 10This report is based upon the Event Summary standard report. The Down Time Top 10 report displays top 10 down time events (e.g. conveyor jam, part shortage, etc.) for selected work cells and time periods. The Down Time Top 10 report uses the following parameter filter criteria:
Line (multiple selections)
Work cell (multiple selections)
Shift (multiple selections)
Product (multiple selections)
Time Interval
Start Date/Time
End Date/Time
One of the following grouping criteria may be chosen:
Work cell
Product ID
Shift
Operator
This report has a chart that displays the top 10 down time durations for the selected filter and grouping criteria. It also has a chart that displays the top 10 down time occurrences for the selected filter and grouping criteria.
This report has a grid that displays the following Down Time Summary information for the selected filter criteria:
Grouping
63

FACTORYTALK METRICS LINE EDITION USER’S GUIDE•
• •
• •
Event Description
Duration
Count
This report has a grid that displays the following Down Time Details for the selected filter criteria:
Work cell
Shift
Product ID
Event Description
Duration
Occurrences
Reporting Value
Operator
Time Stamp
Event Top 10This report is based upon the Event Summary standard report. The Event Top 10 report displays top 10 events (e.g. machine not in Auto, infeed blocked, etc.) for selected work cells and time periods. The Event Top 10 report uses the following parameter filter criteria:
Line (multiple selections)
Work cell (multiple selections)
Shift (multiple selections)
Product (multiple selections)
Time Interval
Start Date/Time
End Date/Time
One of the following grouping criteria may be chosen:
Work cell
Product ID
64

6 • FACTORYTALK METRICS LINE EDITION REPORTS• • • • •
Shift
Operator
This report has a chart that displays the top 10 event durations for the selected filter and grouping criteria. It also has a chart that displays the top 10 event occurrences for the selected filter and grouping criteria.
This report has a grid that displays the following Event Summary information for the selected filter criteria:
Grouping
Event Description
Duration
Count
This report has a grid that displays the following Event Details for the selected filter criteria:
Line
Work cell
Shift
Product ID
Duration
Occurrences
Event Description
Reporting Value
Operator
Time Stamp
Root Cause AnalysisThis report is based upon the Root Cause Analysis standard report. The Root Cause Analysis report displays state occurences and durations for selected production lines, work cells, and time periods. The Root Cause Analysis report uses the following parameter filter criteria:
Line (multiple selections)
Work cell (multiple selections)
65

FACTORYTALK METRICS LINE EDITION USER’S GUIDE•
• •
• •
Shift (multiple selections)
Product (multiple selections)
Duration (minutes)
Start Date/Time
The Duration entry allows the following times: 1, 5, 10, 15, 30, 45, or 60 minutes.
The Root Cause Analysis report consists of a Gantt chart displaying workcell state occurrences over time. The chart will display the work cells in the order specified by the Line Order parameter configuration.
Below the Gantt chart for each line is a table of data showing the same data used in the chart. The data in the table consists of:
Work Cell—The work cell selected for the report.
State Name—The machine state. This field is color coded.
Start Time—The date and time that the event started.
End Time—The date and time that the event started.
Duration—The end time minus the start time.
The report has six control buttons. Each adjusts the parameter set time window of the state data displayed.
<< Scroll left 1: Decrease the parameter set time start and end by the difference between end and start.
< Scroll left 1/4: Decrease the parameter set time start and end by 1/4 the difference between end and start.
>> Scroll right 1: Increase the parameter set time start and end by the difference between end and start.
> Scroll right 1/4: Increase the parameter set time start and end by 1/4 the difference between end and start.
Zoom In: Zoom in 50%. Increase the parameter set time start and decrease the parameter set time end by 1/4 the difference between end and start.
Zoom Out: Zoom out 2X. Decrease the parameter set time start and increase the parameter set time end by 1/2 the difference between end and start.
66

6 • FACTORYTALK METRICS LINE EDITION REPORTS• • • • •
Performance ReportThis report is based upon the Throughput standard report. The Performance report displays detailed performance data (Throughput %, Ideal vs. Realized Cycle Time) for selected work cells, parts, and time periods. The Performance report uses the following parameter filter criteria:
Line (multiple selections)
Work cell (multiple selections)
Shift (multiple selections)
Product (multiple selections)
Time Interval
Start Date/Time
The following reports can be accessed from this report by clicking the appropriate items:
Part Count report
Capacity report
The Performance report has a chart that displays the efficiency values for the selected filter criteria.
This report has a grid that displays the following Performance efficiency details for the selected filter criteria:
Line
Work cell
Shift
Product ID
Performance Efficiency
Good parts
Scrap parts
Total parts
Ideal parts
Cycle time
Running minutes
67

FACTORYTALK METRICS LINE EDITION USER’S GUIDE•
• •
• •
Capacity ReportThis report is based upon the Production standard report. The Capacity report displays detailed capacity data (Total Parts Produced vs. Ideal Parts) for selected work cells, parts, and time periods. The Capacity report uses the following parameter filter criteria:
Line (multiple selections)
Work cell (multiple selections)
Shift (multiple selections)
Product (multiple selections)
Time Interval
Start Date/Time
End Date/Time
One of the following grouping criteria may be chosen:
Work cell
Product ID
Shift
Operator
The Capacity report has a chart that displays the part count vs. capacity for the selected filter and grouping criteria. It also has a chart that displays the part count vs. capacity by hour for the selected time window.
Quality ReportThis report is based upon the Quality standard report. The Quality report displays detailed quality data (Good Parts, Scrap Parts, Quality %) for selected production lines, work cells, and time periods (by shift). The Quality report uses the following parameter filter criteria:
Line (multiple selections)
Work cell (multiple selections)
Shift (multiple selections)
Product (multiple selections)
Time Interval
Start Date/Time
End Date/Time
68

6 • FACTORYTALK METRICS LINE EDITION REPORTS• • • • •
The Quality report has a chart that displays the quality values for the selected filter criteria.
This report has a grid that displays the following performance quality rate details for the selected filter criteria:
Line
Work cell
Shift
Product ID
Quality rate
Good parts
Scrap parts
69

FACTORYTALK METRICS LINE EDITION USER’S GUIDE•
• •
• •
70

Index
AAccessing FactoryTalk Metrics LE 11Adding
a Parameter Set 41a Report Subscription 38an item to the tree 35terms to selected terminology 43
Administration functions 7architecture 9Availability Report 60
CCalculations 52Capacity Report 68Change Over Report 61Configuring security for FactoryTalk Metrics
LE 29Connecting to FactoryTalk Metrics Line
Edition 5consulting services 4Copy terminology to another culture 44Creating
a report with a new parameter set 15new domain terminology 43
DDashboard Folder 57Database Wizard 30Date/Time/Shift 15Deleting
a Parameter Set 42a Report Subscription 40an item from the tree 36copied (in another culture) version of
domain terminology 44terminology 44
Displayinga report with a temporarily customized
parameter set 14a report with an existing parameter set 13
Down Time Top 10 63
EEdit terms 44Event Detail report 47Event Summary report 47Event Top 10 64Exporting a report 28
FFactoryTalk Metrics Line Edition
administrator 2architecture 9overview 1Reports 57user 2
Filtering 24
GGantt chart 49Grouping 19
IInit terminology every report 45
LLine Efficiency Report 59Line Order 45Loading FactoryTalk Metrics LE data into the
RSBizWare database 30
MManaging
Parameter Sets 40Report Subscriptions 37the Explorer Area 34the Line Order Feature 45the Quick Web Feature 37the Terminologies Feature 42
71

FACTORYTALK METRICS LINE EDITION USER’S GUIDE•
• •
• •
Modifyinga Parameter Set 42a Report Subscription 38an item in the tree 36
NNavigating
Report Expert 11reports 27
OOEE 1OEE Details Report 58OEE Summary Report 58online help 3on-site support 4Overall Equipment Effectiveness 1
PParameter Set controls 15Parameter Sets 40Performance Report 67Performance report 48Plant Model 23Printing a report 28Production report 48
QQuality Report 68Quality report 49QuickWeb 37
RRaw data 52
Report field descriptions 47Root Cause Analysis 65Root Cause Analysis report 49RSBizWare Administrator’s Guide 3
Ssecurity
disabling 30setting up 29
Sorting 22Standard Reports 47States Top 10 62support 3
Ttechnical support 3Terminology 42terminology 26Throughput report 50Top N 25
UUptime report 51Using the Explorer area 6Using the Parameter area 7
VViewing and Using reports 26Viewing Reports 6
WWeb support 4
72