
Metric-driven Robust Design – Robustness Quantification of ... · Metric-driven Robust Design –...
173
General rights Copyright and moral rights for the publications made accessible in the public portal are retained by the authors and/or other copyright owners and it is a condition of accessing publications that users recognise and abide by the legal requirements associated with these rights. Users may download and print one copy of any publication from the public portal for the purpose of private study or research. You may not further distribute the material or use it for any profit-making activity or commercial gain You may freely distribute the URL identifying the publication in the public portal If you believe that this document breaches copyright please contact us providing details, and we will remove access to the work immediately and investigate your claim. Downloaded from orbit.dtu.dk on: Jan 02, 2020 Metric-driven Robust Design – Robustness Quantification of Complex Engineering Systems Göhler, Simon Moritz Publication date: 2017 Document Version Publisher's PDF, also known as Version of record Link back to DTU Orbit Citation (APA): Göhler, S. M. (2017). Metric-driven Robust Design – Robustness Quantification of Complex Engineering Systems. DCAMM Special Report, No. S224
Transcript of Metric-driven Robust Design – Robustness Quantification of ... · Metric-driven Robust Design –...

General rights Copyright and moral rights for the publications made accessible in the public portal are retained by the authors and/or other copyright owners and it is a condition of accessing publications that users recognise and abide by the legal requirements associated with these rights.
Users may download and print one copy of any publication from the public portal for the purpose of private study or research.
You may not further distribute the material or use it for any profit-making activity or commercial gain
You may freely distribute the URL identifying the publication in the public portal If you believe that this document breaches copyright please contact us providing details, and we will remove access to the work immediately and investigate your claim.
Downloaded from orbit.dtu.dk on: Jan 02, 2020
Metric-driven Robust Design – Robustness Quantification of Complex EngineeringSystems
Göhler, Simon Moritz
Publication date:2017
Document VersionPublisher's PDF, also known as Version of record
Link back to DTU Orbit
Citation (APA):Göhler, S. M. (2017). Metric-driven Robust Design – Robustness Quantification of Complex EngineeringSystems. DCAMM Special Report, No. S224
Ph
D T
he
sis
Metric-driven Robust Design – Robustness Quantifi cation of Complex Engineering Systems
Simon Moritz Göhler DCAMM Special Report No. S224February 2017

Metric-driven Robust Design – Robustness Quantification of Complex Engineering Systems PhD Thesis Simon Moritz Göhler February 2017 Academic Supervisor Thomas J. Howard, Associate Professor Section of Engineering Design and Product Development Department of Mechanical Engineering Technical University of Denmark Academic Co-Supervisor Tobias Eifler, Assistant Professor Section of Engineering Design and Product Development Department of Mechanical Engineering Technical University of Denmark Industrial Supervisor Niels-Aage Hansen, Chief Engineer Device R&D Novo Nordisk A/S Hillerød, Denmark DTU Mechanical Engineering Section of Engineering Design and Product Development Technical University of Denmark (DTU) Produktionstorvet, Bldg. 426 DK-2800 Kgs. Lyngby Denmark Phone (+45) 4525 6263 www.mek.dtu.dk

i
Abstract
Variation is omnipresent - no two manufactured products are exactly the same or are used in exactly the same
way and under the exact same conditions. To ensure quality and functionality for customer satisfaction,
variation needs to be addressed in product development and production. In recent decades, the initiatives to
deal with and address variation have moved more and more from quality control in production to the design
and development phase. Rather than addressing the source of variation, Robust Design is applied as a strategy
and paradigm to design products that are inherently insensitive to variation and function despite them.
However, the ever-increasing complexity of products and engineering systems due to the integration of more
functionality challenges engineers in designing robust products.
In this PhD thesis, this challenge of designing complex products and engineering systems to be robust to
variation is addressed. More specifically, the robustness quantification and evaluation as an essential part of
the design process to measure, monitor, select, prioritize and optimize for robustness has been investigated. A
“metric-driven” approach enables an efficient and systematic Robust Design process.
Different angles on the quantification of robustness have been researched. A study of the landscape of Robust
Design methods and tools revealed the mechanisms and coherences between the individual methods. An
iterative Robust Design process was proposed based on the coherences and the associated activities of the
engineers. It was also shown that the robustness evaluation plays a central role in the Robust Design process.
However, even though there is consensus among Robust Design practitioners and academics regarding the
general concept of robustness as a paradigm and strategy to design products insensitive to variation, some
ambiguities were still observed in the literature and in practice. A systematic literature study and analysis of
robustness metrics led to the conclusion that four different notions of robustness exist: concept robustness,
design robustness, function robustness and product robustness. For the latter, the complexity of the product
has a large influence. This could be shown in a case study as well as in a model-based study which both
revealed a reduction of robustness with an increased level of contradiction in the functions with larger/smaller-
the-better requirements. This augments the work on Axiomatic Design by Suh, who proved this to be true for
coupling and nominal-the-best requirements. To support the evaluation of the level of contradiction of a
design, a method and metric, the Contradiction Index (CI), was developed.
Based on the insights gained throughout the research regarding the quantification of robustness, the VMF Tool
was proposed to support a holistic and metric-driven Robust Design. By modeling and sensible decomposition
of the (complex) product through relations of different degrees of fidelity, structural and functional robustness
analyses have been incorporated. The VMF Tool supports the engineers to build a comprehensive functional
understanding and enables efficient robustness quantification throughout the design process. Two case studies
were conducted showing the merit and applicability of the tool, which has also been confirmed by qualitative
feedback from participating engineers in the case companies.

ii
Resumé (in Danish)
Variation er allestedsnærværende – ingen fremstillede produkter er helt ens, bruges præcist på den samme
måde eller ved de præcist samme omstændigheder. For at sikre at kvaliteten og funktionaliteten tilfredsstiller
kunden, er det nødvendigt at tage sig af variation i løbet af produktudviklingen og produktionen. I de seneste
årtier har indsatsen for at adressere variation bevæget sig mere og mere fra kvalitetskontrol i produktionen til
design- og udviklingsfasen. I stedet for at adressere variationskilderne anvendes Robust Design som en strategi
eller et paradigme til at designe produkter, som er grundlæggende ufølsomme overfor variation og virker på
trods af variation. Den stadigt stigende produkt- og systemkompleksitet, som skyldes forøgelsen af
funktionalitet, udfordrer imidlertid ingeniører, når de skal designe robuste produkter.
I denne Ph.d.-afhandling adresseres udfordringen at designe komplekse produkter og systemer, så de bliver
robuste overfor variation. Mere specifikt undersøges robusthedskvantificering og -evaluering for at måle,
monitorere, vælge, prioritere, og optimere robusthed som en essentiel del af designprocessen. En ”metric-
driven” tilgang tillader en effektiv og systematisk Robust Design-Proces.
Forskellige vinkler på robusthedskvantificeringen er blevet undersøgt. Et studie af landskabet af Robust Design-
metoder og -værktøjer afslørede mekanismerne og fællestrækkende for de individuelle metoder. En iterativ
Robust Design-Proces baseret på disse fællestræk og ingeniørernes tilhørende aktiviteter blev foreslået. Det
blev også vist, at robusthedsevaluering spiller en central rolle i Robust Design-Processen.
Selvom der er konsensus iblandt akademikere og udøvere af Robust Design vedrørende det generelle
robusthedsbegreb som et paradigme og en strategi til at designe produkter, der er ufølsomme over for
variation, blev flertydigheder imidlertid stadig observeret i litteraturen og i praksis. Et systematisk
litteraturstudie og analyse af robusthedsgrad førte til konklusionen, at fire forskellige opfattelser af robusthed
eksisterer: konceptrobusthed, designrobusthed, funktionsrobusthed og produktrobusthed. Produktets
kompleksitet har stor indflydelse på den sidstnævnte. Dette kunne vises i et casestudie og ligeså i et
modelbaseret studie, som begge afslørede, at robustheden reduceres når ”jo-større/mindre-des-bedre”-krav til
produktfunktioner modstrider hinanden i højere grad. Dette udvider Suhs arbejde med Axiomatisk Design, som
beviste, at dette er sandt for koblinger og ”jo-tættere-på-nominelt-des-bedre”-krav. En metode og en
måleenhed, Contradiction Index (CI), blev udviklet for at understøtte evalueringen af i hvor høj grad kravene
modstrider hinanden i et design.
VMF-værktøjet blev foreslået baseret på den indsigt, der blev opnået gennem denne forskning vedrørende
kvantificeringen af robusthed, således at en holistisk og “metric-driven” Robust Design-Proces kan
understøttes. Strukturelle og funktionelle robusthedsanalyser er blevet inkorporeret ved modellering og
fornuftig dekomposition af det (komplekse) produkt via sammenhænge med forskellige grader af nøjagtighed.
VFM værktøjet understøtter ingeniørerne, så de kan opnå en omfattende funktionel forståelse og muliggør
effektiv robusthedskvantificering igennem hele designprocessen. To casestudier blev gennemført, som viste
værdien og anvendeligheden af værktøjet, som også blev bekræftet via kvalitativ feedback fra deltagende
ingeniører i case-virksomhederne.
iii
Acknowledgements
This thesis concludes my 3 year PhD research project conducted from 2014-2017 at the Technical University of
Denmark Department of Mechanical Engineering in the section of Engineering Design and Product
Development. The project has been a part of and made possible by the Novo Nordisk – DTU Robust Design
Program.
First of all, I would like to thank my academic supervisor Associate Professor Thomas Howard. I am grateful for
you giving me the chance to take on this interesting research project. Thanks for your continuous guidance and
great support.
Further, I owe great thanks to my academic co-supervisor Assistant Professor Tobias Eifler for countless great
discussions and valuable feedback over the course of the 3 years.
I would also like to thank my industrial supervisor Niels-Aage Hansen. Thanks for always having an open ear
and for your continuous support and feedback. Thanks also to all colleagues at Novo Nordisk who I had the
pleasure to collaborate with.
A big thank you also to all current and former members of the Robust Design Group at DTU for great teamwork
and valuable discussions, Martin Ebro Christensen, Søren Nygaard Pedersen, Srinivasa Murthy Boorla, Kristian
Bjarklev, Aryan Christiansen, Andreas Rafn and Laura Elvira Stokbro. It has been a pleasure and great
experience to work with you. Thank you!
Special thanks also to Dr. Anna Thornton as well as Professor Daniel D. Frey and Professor Steven D. Eppinger
at MIT for hosting me for the inspiring and valuable research stay at MIT in Boston.
Deep thanks go to all my incredible former and present colleagues at the section of Engineering Design and
Product Development at DTU for great discussions, an inspiring environment to do research in and fun times in
and outside the office.
Last but not least I would like to thank my family and especially my better half Susanne who gave me strength
and supported me throughout the endeavor of doing this PhD project.
Simon Moritz Göhler Kgs. Lyngby, February 2017
iv
List of papers
Paper A Mechanisms and coherences of robust design methodology: a robust design process proposal Göhler, S.M.; Ebro, M. & Howard, T. J. (2016). In Total Quality Management & Business Excellence. Paper B Robustness Metrics: Consolidating the Multiple Approaches to Quantify Robustness Göhler, S.M.; Eifler, T. & Howard, T. J. (2016). In Journal of Mechanical Design. Paper C The Contradiction Index: a new Metric combining System Complexity and Robustness for early Design Stages Göhler, S.M. & Howard, T. J. (2015). In ASME 2015 International Design Engineering Technical Conferences and Computers and Information in Engineering Conference. American Society of Mechanical Engineers. Paper D A model-based approach to associate complexity and robustness in engineering systems Göhler, S.M.; Frey, D. D. & Howard, T. J. (2016). In Research in Engineering Design. Paper E The Translation between Functional Requirements and Design Parameters for Robust Design Göhler, S.M.; Husung, S. & Howard, T. J. (2016).In Procedia CIRP. Paper F The Variation Management Framework (VMF) Tool for Robust Design Göhler, S.M.; Mathiasen, M. R.; Nielsen, M. B.; Eifler, T. & Howard, T. J. (2017). Submitted to Journal of Engineering Design.
List of supplementary papers Paper G Design to Process Capabilities: challenges for the use of Process Capability Databases (PCDBs) in development Eifler, T.; Göhler, S.M. & Howard T. J. (2014). In 25th Symposium Design for X. Paper H A visual interface Diagram for mapping Functions in integrated Products Ingerslev, M.; Jespersen, M. O.; Göhler, S. M. & Howard, T. J. (2015). In Proceedings of the 20th International Conference on Engineering Design (ICED 15). Paper I The Variation Management Framework (VMF): A Unifying Graphical Representation of Robust Design Howard, T. J.; Eifler, T.; Pedersen, S. N.; Göhler, S. M.; Boorla, S. M. & Christensen, M. E. (2017). In Quality Engineering.

v
Table of contents
1. Introduction ......................................................................................................................................................1
1.1. Problem Description and Motivation for this Research ...........................................................................1
1.2. State of the Art Robust Design .................................................................................................................3
1.3. Aim and Objectives ...................................................................................................................................4
1.4. Research Questions and Hypotheses .......................................................................................................4
1.5. Novo Nordisk - DTU Robust Design Program ...........................................................................................6
1.6. Outline of Thesis .......................................................................................................................................8
2. Research Approach ........................................................................................................................................ 10
2.1. Research Methodology .......................................................................................................................... 10
2.1.1. Problem-based, Theory-based (PbTb) research approach ................................................................ 11
2.1.2. Design Research Methodology (DRM) .............................................................................................. 12
2.2. Research Methods ................................................................................................................................. 13
2.3. Verification and validation of the results of this research .................................................................... 14
2.4. Research Design .................................................................................................................................... 16
2.4.1. Research line of argument ................................................................................................................ 16
2.4.2. Studies and research plan ................................................................................................................. 16
2.5. Other influences on the research .......................................................................................................... 19
3. Theoretical Basis ............................................................................................................................................ 20
3.1. Product Development Processes ........................................................................................................... 20
3.2. Robust Design theory and definition ..................................................................................................... 21
3.2.1. Quality loss function .......................................................................................................................... 22
3.2.2. Robustness definition ........................................................................................................................ 23
3.2.3. Transfer function model .................................................................................................................... 25
3.3. Frameworks related to Robust Design .................................................................................................. 26
3.3.1. The Taguchi method .......................................................................................................................... 26
3.3.1.1. Signal – Noise-Ratio ....................................................................................................................... 26
3.3.1.2. Phases ............................................................................................................................................ 27
3.3.2. Axiomatic Design ............................................................................................................................... 28
3.3.3. Variation Risk Management (VRM) ................................................................................................... 30

vi
3.3.4. Variation Management Framework .................................................................................................. 32
3.4. Structural complexity in engineering systems ....................................................................................... 33
3.5. Numerical model building ..................................................................................................................... 35
4. Results and Discussion ................................................................................................................................... 37
4.1. Study 1 – Paper A................................................................................................................................... 37
4.1.1. Publication ......................................................................................................................................... 37
4.1.2. Summary of results ............................................................................................................................ 37
4.1.3. Discussion and reflection ................................................................................................................... 39
4.1.4. Study evaluation ................................................................................................................................ 40
4.2. Study 2 – Paper B ................................................................................................................................... 40
4.2.1. Publication ......................................................................................................................................... 41
4.2.2. Summary of results ............................................................................................................................ 41
4.2.3. Discussion and reflection ................................................................................................................... 42
4.2.4. Study evaluation ................................................................................................................................ 43
4.3. Study 3 – Paper C ................................................................................................................................... 43
4.3.1. Publication ......................................................................................................................................... 44
4.3.2. Summary of results ............................................................................................................................ 44
4.3.3. Discussion and reflection ................................................................................................................... 46
4.3.4. Study evaluation ................................................................................................................................ 47
4.4. Study 4 – Paper D .................................................................................................................................. 47
4.4.1. Publication ......................................................................................................................................... 48
4.4.2. Summary of results ............................................................................................................................ 48
4.4.3. Discussion and reflection ................................................................................................................... 50
4.4.4. Study evaluation ................................................................................................................................ 51
4.5. Study 5 – Paper E ................................................................................................................................... 51
4.5.1. Publication ......................................................................................................................................... 52
4.5.2. Summary of results ............................................................................................................................ 52
4.5.3. Discussion and reflection ................................................................................................................... 53
4.5.4. Study evaluation ................................................................................................................................ 54
4.6. Study 6 – Paper F ................................................................................................................................... 54

vii
4.6.1. Publication ......................................................................................................................................... 54
4.6.2. Summary of results ............................................................................................................................ 54
4.6.3. Discussion and reflection ................................................................................................................... 57
4.6.4. Study evaluation ................................................................................................................................ 57
4.7. Hypothesis testing ................................................................................................................................. 58
4.8. Evaluation of the research ..................................................................................................................... 58
4.8.1. Evaluation relative to the existing body of knowledge ..................................................................... 58
4.8.2. Research verification and validation ................................................................................................. 59
4.8.3. Limitations ......................................................................................................................................... 60
5. Conclusion ..................................................................................................................................................... 61
5.1. Core contributions ................................................................................................................................. 61
5.2. Value and impact of the research ......................................................................................................... 62
5.2.1. Academic ........................................................................................................................................... 62
5.2.2. Industrial ............................................................................................................................................ 62
5.3. Suggestions for further research ........................................................................................................... 62
5.3.1. Process and application of VMF tool ................................................................................................. 63
5.3.2. Further development of VMF software tool ..................................................................................... 63
5.3.3. Variation management process ........................................................................................................ 63
5.3.4. Integration of Robust Design and reliability engineering .................................................................. 63
5.3.5. Economical perspective on variation management .......................................................................... 63
5.4. Concluding remarks ............................................................................................................................... 64
References ............................................................................................................................................................. 65
Appended Papers .................................................................................................................................................. 71

viii
List of figures
Figure 1: Committed life-cycle cost against time ((11) p. 15) ..................................................................................2
Figure 2: Mapping of variation through the customer, design and production domain (42) ..................................7
Figure 3: Impact model for Robust Design ...............................................................................................................8
Figure 4: Design research model: Problem-based, Theory-based research approach (after Jørgensen (46)) ...... 11
Figure 5: DRM framework redrawn from (40) ...................................................................................................... 12
Figure 6: The Validation Square redrawn from Pedersen et al. (51) ..................................................................... 15
Figure 7: Research line of argument ..................................................................................................................... 16
Figure 8: Research Plan ......................................................................................................................................... 17
Figure 9: Product development Process by Pahl and Beitz (25) ............................................................................ 21
Figure 10: V-model redrawn from Blanchard and Fabrycky (58) .......................................................................... 21
Figure 11: a) Step Quality Loss function; b) Quadratic Quality Loss function (18,19) ........................................... 22
Figure 12: a) Quality loss function Smaller-the-better, b) Quality loss function Larger-the-better ..................... 23
Figure 13: P-diagram (19) ...................................................................................................................................... 24
Figure 14: Transfer Function model redrawn from Ebro (28) ............................................................................... 26
Figure 15: Design domains following Suh with characteristic vectors {x} (redrawn from (29)) ............................ 28
Figure 16: Common Range, redrawn from Suh (29) p. 41 ..................................................................................... 30
Figure 17: KC flow-down for a car door (redrawn from Thornton (31,68)) .......................................................... 31
Figure 18: The VMF: modelling an example of a pen lid removal force from Howard et al. (32) ......................... 32
Figure 19: Structured system representation a) matrix-based and b) graph-based (redrawn from Eifler (73)) .. 34
Figure 20: House of Quality (Example from Hauser and Clausing (38)) ................................................................ 35
Figure 21: Proposal of a Robust Design process.................................................................................................... 39
Figure 22: Robust Design framework to represent the propagation of variation ................................................. 41
Figure 23: Coupled functional requirements of the kind "nominal-the-best" ...................................................... 44
Figure 24: Negatively coupled functional requirements of the kind "larger-the-better" ..................................... 45
Figure 25: Positively coupled functional requirements of the kind "larger-the-better" ....................................... 45
Figure 26: No. of Part Design Iterations vs Part CI ................................................................................................ 46
Figure 27: No. of demanding Tolerances vs Part CI ............................................................................................... 46
Figure 28: Scatter plot of normalized yield against no. of couplings .................................................................... 49
Figure 29: Association between normalized yield and contradiction ................................................................... 50
Figure 30: Mapping between FR and DP (left) and generic P-Diagram (right) ...................................................... 52
Figure 31: Holistic Variation Management Tool .................................................................................................... 56
Figure 32: VMF Tool sensitivity view ..................................................................................................................... 57
ix
List of tables
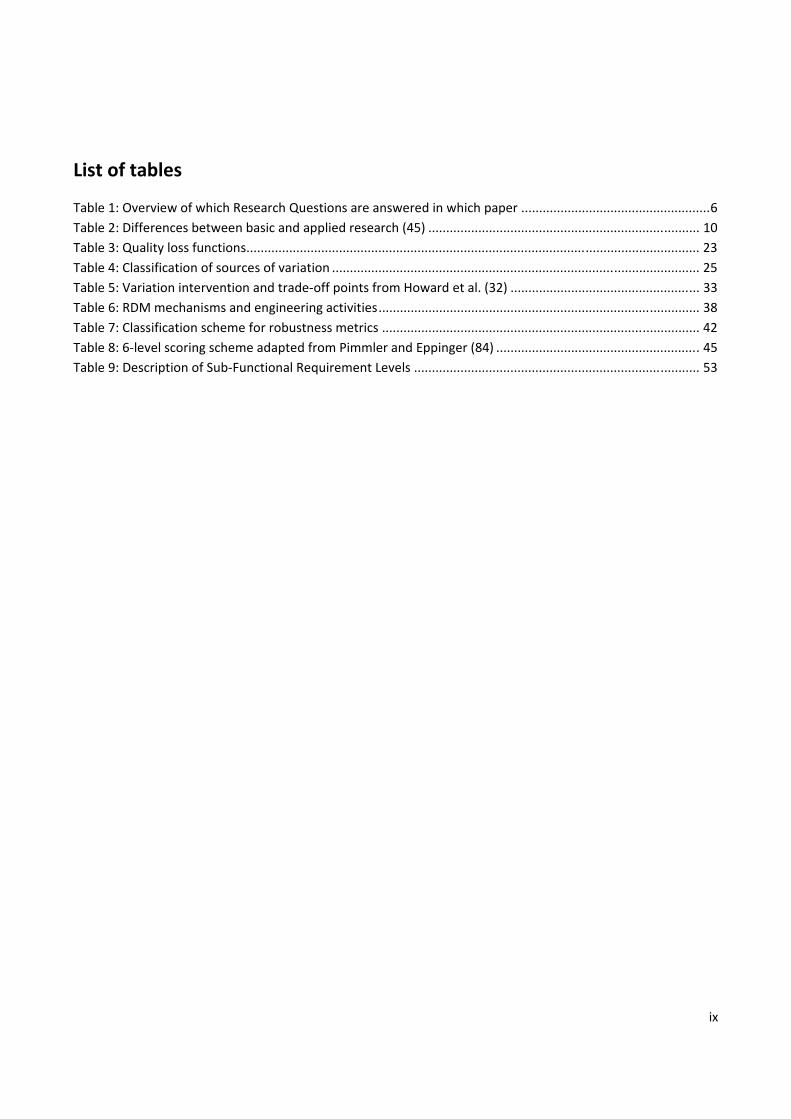
Table 1: Overview of which Research Questions are answered in which paper .....................................................6
Table 2: Differences between basic and applied research (45) ............................................................................ 10
Table 3: Quality loss functions ............................................................................................................................... 23
Table 4: Classification of sources of variation ....................................................................................................... 25
Table 5: Variation intervention and trade-off points from Howard et al. (32) ..................................................... 33
Table 6: RDM mechanisms and engineering activities .......................................................................................... 38
Table 7: Classification scheme for robustness metrics ......................................................................................... 42
Table 8: 6-level scoring scheme adapted from Pimmler and Eppinger (84) ......................................................... 45
Table 9: Description of Sub-Functional Requirement Levels ................................................................................ 53

1 of 71
1. Introduction This chapter provides an introduction to this PhD research project. Starting with the description of the problems experienced in industry regarding the development of robust complex products, the motivation and relevance for the research are outlined. This is followed by the presentation of the current state of the art in Robust Design engineering which builds the foundation of the work at hand. The aims and objectives of this PhD project are then laid out and the research questions and initial hypotheses presented. The introduction concludes with the description of the DTU-Novo Nordisk Robust Design research project and the outline of this thesis.
1.1. Problem Description and Motivation for this Research In 2013, the management consulting firm McKinsey estimated the cost of quality in the medical device industry
to be between 17 and 26 billion dollar per year, equaling 12 to 18% of the industry’s total revenue (1). A study
by Mahmood & Kureshi (2) found that this value can be even higher and up to 40% of the total revenue in
other industries. Variation is omnipresent and a major factor for reduced quality as well as an essential driver
for cost, both in the form of prevention and appraisal cost but also costs related to internal and external failure
(3). An example for the latter is the recall of 2.3 million cars by Toyota in conjunction with a variation sensitive
gas pedal in 2010, costing several fatalities and about $3.1 billion in settlement and change costs (4). Another
study by Reynolds (5) showed that the cost of rework related to variation “accounts for approximately 40% of
the direct labor to build an airplane”.
Robust Design, originally promoted by Japanese quality engineer Genichi Taguchi in the 1950s, is an
acknowledged way to develop products that are inherently insensitive to variation. The merits are evident:
robust systems behave more consistently benefitting the customer with improved reliability and durability.
Robust systems, furthermore, allow more variation in production, resulting in higher yield rates and reduced
demands on quality control, without adversely affecting the performance of the product (6). Addressing and
managing variation from the initial conceptual design to production and use is essential for the quality and
success of a product or engineering system.
With the emergence of systems engineering and multi-disciplinary development projects in recent decades, the
complexity of products and engineering systems has steadily increased (7) and with it the difficulty to manage
variation. Particularly in hardware and mechanical products the augmentation and integration of new and
additional functionality as well as diversification are drivers for this trend and can be seen in all kinds of
products and systems from insulin injection pens to smartphones, cars and airplanes (8). In addition to the
increased complexity, further demands for performance, reliability and quality now exist to ensure customer
satisfaction at any time. Moreover, companies face stronger competition in a globalized world which pushes
the companies to shorter development times and reduced costs.
Nonetheless, the product needs to perform consistently and reliably despite variation and, to a certain extent,
also under unintended use conditions. An efficient development process considering uncertainty and variation
is essential to ensure quality and capture potential problems as early as possible. This is even more important,
since the majority of costs in a product development project are committed to in the early development stages

2 of 71
(Figure 1). Efforts and activities to improve the quality of the design and to save costs therefore have a larger
potential the earlier they are executed (9). The development process, methods and paradigms need to support
the companies right from the first sketch until the design freeze, throughout engineering change management
and even for product/module modification for new variants. The “right first time” philosophy, along with
virtual validation and verification strategies has seen great progress, as seen in the automotive industry, now
aiming to launch new vehicles in under 20 months (10).
Figure 1: Committed life-cycle cost against time ((11) p. 15)
Yet many companies still experience major issues and costs during ramp up or while in production and use that
are concerned with unwanted functional variation and non-conformance (12). Common practice is that
problems related to variation and unpredictable performance are not recognized until very late in the
development project leading to valuable resources being wasted – R&D/design engineers are re-assigned to
“firefighting” activities, inspection and quality control is heightened and non-conforming parts/assemblies are
scraped or re-worked. Failures of the product in the market can lead to even higher costs due to product
recalls, customers compensation and loss of brand value, etc. (12).
A major issue is the lack of functional understanding and awareness when developing and designing products
and systems (13) which is essential to cope with downstream uncertainty and variation. During the course of
this PhD project this was confirmed by engineers at case companies as the following three examples show:
1. The chief engineer of a company developing medical devices mentioned that he had noticed that failed
design milestones are oftentimes related to failing functionality even though structural indicators and
kinematic constraint requirements were met.
2. An engineer responsible for the investigation of in-service failures of a large ship engine company
reported that they experienced unexpected critical wear patterns. It turned out that geometrical and

3 of 71
use variations were not adequately taken into account during design due to a lack of functional
understanding.
3. The lead engineer of another medical device company named the complexity of the product and lack of
a functional overview as the main challenges to Robust Design.
The functional modeling and quantification of how robust a design solution is to perturbations and variation, as
a measure for concept and design quality, is essential to objectively evaluate, monitor and improve functional
performance. This is especially valuable during product development to avoid costly, late changes and/or
failures in service.
1.2. State of the Art Robust Design Robust Design is an acknowledged strategy to address aforementioned problems related to variation and has
received more and more attention with diverse success with the implementation into companies’ product
development processes (14–17). In contrast to traditional quality initiatives that address variation in
production, Robust Design aims to address variation already in the development phase. The paradigm shifts
from addressing the source of variation to the propagation of the same which is an inherent characteristic of
the design (18). It also follows that the focus changes from geometry to function.
In the Robust Design Methodology, different methods and strategies exist for the different design stages and
information available. Traditional Robust Design methods as promoted by Taguchi exploit theories from the
field of design of experiments, statistics and optimization to set the levels and tolerances of the design
parameters for optimal robustness (6,18–22). The nature of the methods require, however, very mature
models or prototypes for their application, which first become available considerably late in the design process.
To address this limitation, other methods build upon a different approach. Robustness is therein fostered
through the use of generic good design practice in the embodiment design stage (23,24) as also in part
described by Pahl and Beitz (25). This includes among others constraint theory (26), kinematic design and
design clarity (27), as well as other design features to damp or restrict variation propagation (23,28). Only little
attention has been given to the investigation of complexity of the design solution as an indicator for
robustness. Nam P. Suh formulated two design axioms claiming the transcendence of uncoupled designs with
the least information content (29,30). Utilizing complexity as a predictor for robustness is especially valuable
since it enables a consideration of robustness as early as in the conceptual design stage.
All in all, the different Robust Design efforts throughout the conceptual, embodiment and detailed design
stages are not coherent and oftentimes uncoordinated following the maxim “the more robustness the better”.
In complex products this is not always possible due to limited resources (31). Different approaches exist to
manage variation (31–35). Often a key characteristic (KC) approach is utilized limiting the number of
parameters that need to be modelled and controlled in design and production, respectively. The view on
complexity also opens up the opportunity for a holistic evaluation of robustness which is the prerequisite for an
efficient metric-driven Robust Design and variation management. Existing frameworks and tools often

4 of 71
capitalize only on a fraction of the available information or have other limitations which can be summarized
with the following points:
- Geometry-centric instead of function-driven variation management and Robust Design (Variation Risk
Management (VRM) (31), tolerancing tools)
- Simplification to single functions instead of holistic systems perspective (Taguchi Method (18,19),
Variation Mode and Effect Analysis (VMEA) (36,37), single-objective robustness optimization)
- Simplification to linear correlations between functions and parameters (Axiomatic Design (29), VRM
(31), VMEA (36,37), other approaches to map products using stiffness matrices)
- Focus on EITHER structural (complexity related) OR functional, quantitative information (House of
Quality (38), matrix-based approaches like DSM and MDM, multi-objective robustness optimization)
1.3. Aim and Objectives The aim of this research was to support metric-driven Robust Design of complex products and engineering
systems by providing a basis for the quantification of robustness throughout the development. The objective
quantification of robustness lays the ground for metric-driven prioritization, monitoring, concept selection and
optimization. Citing a common saying in quality engineering: “You can only improve what you can measure”
(39).
This PhD project researched complexity as a predictor for robustness continuing the work of Axiomatic Design
by Nam P. Suh (29) and investigated into possibilities of a holistic, coherent, function-driven robustness
quantification. The detailed objectives can be summarized as follows:
Objectives:
1. Clarification and evaluation of robustness quantification in the context of Robust Design activities
2. Investigation of the influence of product complexity on robustness
3. Exploration and derivation of a new metric to quantify or estimate robustness based on 2
4. Proposal of a tool to quantify robustness throughout the development of complex products and
systems
1.4. Research Questions and Hypotheses Following research questions (RQ) and hypotheses have been developed from the research objectives after an
initial literature review and formulated to guide and structure the individual studies.
The first research question aims at the analysis of the current suite of Robust Design tools, methods,
frameworks and processes – what tools and frameworks exist in academia and industry and what are the
coherences between them based on their utilization by the development engineers in their daily design
activities.

5 of 71
Research Question 1
a) What Robust Design methods, frameworks and processes exist to analyze and synthesize robustness?
b) How can a coherent Robust Design process be prescribed?
The answer to this research question shall lead to a clarification of the placement of robustness analysis and
quantification in the product development process. This is especially interesting in terms of how a support for
the development of robust complex engineering systems can be developed.
The general idea of a robust designs being insensitive to variation is widely acknowledged among academics
and practitioners. However, there are different notions of robustness also reflected by the actual metrics used
to quantify robustness in various situations like for example concept selection and robustness optimization.
Research Question 2 addresses this ambiguity.
Research Question 2
What robustness indices and metrics and ways to derive these exist and what are their differences and
limitations?
The development of robust complex products and engineering systems bears a lot of challenges also with
respect to the quantification of robustness especially in earlier design stages. This leads to Research Question
3.
Research Question 3
What is the impact of complexity on robustness?
To cope with the complexity of the product or engineering system, an efficient decomposition is necessary
leading to Research Question 4.
Research Question 4
How can functional requirements efficiently be decomposed to support robustness and tolerance management
of complex products?
6 of 71
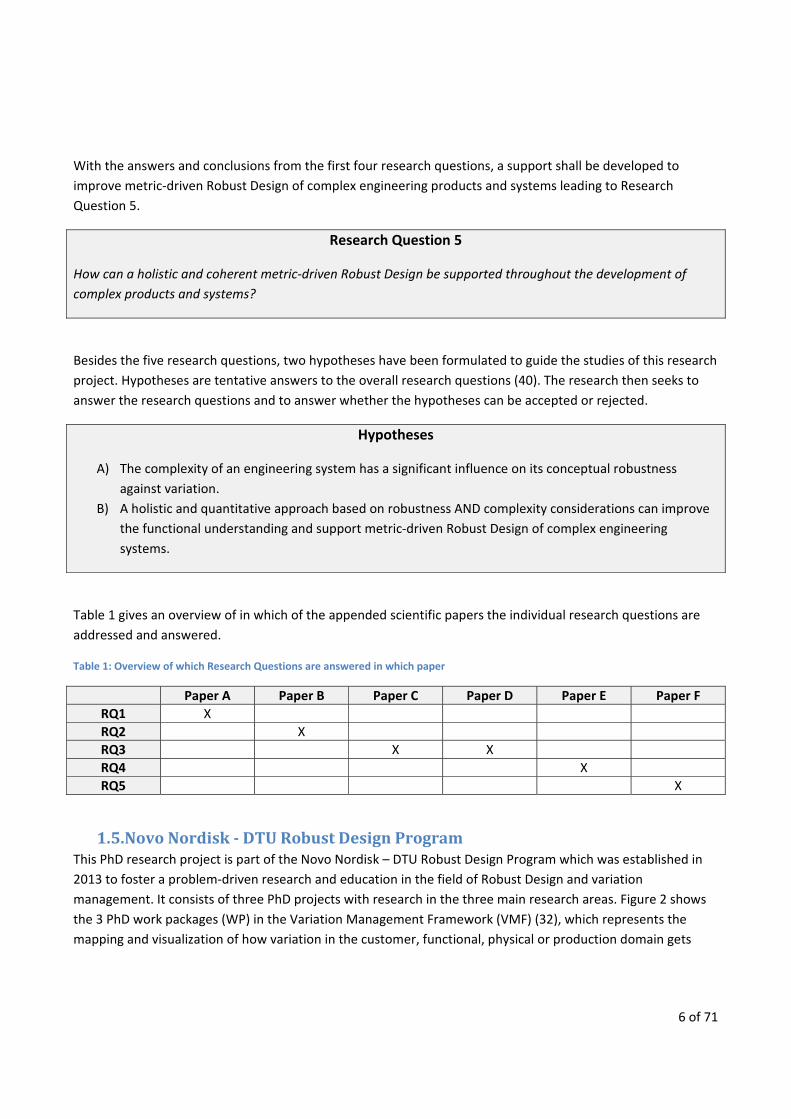
With the answers and conclusions from the first four research questions, a support shall be developed to
improve metric-driven Robust Design of complex engineering products and systems leading to Research
Question 5.
Research Question 5
How can a holistic and coherent metric-driven Robust Design be supported throughout the development of
complex products and systems?
Besides the five research questions, two hypotheses have been formulated to guide the studies of this research
project. Hypotheses are tentative answers to the overall research questions (40). The research then seeks to
answer the research questions and to answer whether the hypotheses can be accepted or rejected.
Hypotheses
A) The complexity of an engineering system has a significant influence on its conceptual robustness
against variation.
B) A holistic and quantitative approach based on robustness AND complexity considerations can improve
the functional understanding and support metric-driven Robust Design of complex engineering
systems.
Table 1 gives an overview of in which of the appended scientific papers the individual research questions are
addressed and answered.
Table 1: Overview of which Research Questions are answered in which paper
Paper A Paper B Paper C Paper D Paper E Paper F
RQ1 X
RQ2 X
RQ3 X X
RQ4 X
RQ5 X
1.5. Novo Nordisk - DTU Robust Design Program This PhD research project is part of the Novo Nordisk – DTU Robust Design Program which was established in
2013 to foster a problem-driven research and education in the field of Robust Design and variation
management. It consists of three PhD projects with research in the three main research areas. Figure 2 shows
the 3 PhD work packages (WP) in the Variation Management Framework (VMF) (32), which represents the
mapping and visualization of how variation in the customer, functional, physical or production domain gets

7 of 71
propagated to the respective other domains and either dampened or amplified (41). This visualization has
proven to be very useful in describing the different levers and possibilities of Robust Design (32). The individual
projects are summarized in the following.
WP1: Work package 1 deals with the customer domain of variation, which describes the relation between the
perceived quality (Q) by the customer to the functional requirements (FR) of the product. The estimation and
modeling of the quality associated with functional variation from the nominal constitute the core of this work
package.
WP2: The research presented in this PhD thesis is related to the second work package investigating robustness
in the functional domain. It addresses the propagation of variation between functional requirements (FR) and
design parameters. Robustness and complexity analyses are combined to support the development of complex
products and systems to be robust against variation.
WP3: The research project in work package 3 seeks to adapt the Robust Design paradigm to the production
domain and to utilize the information generated from the various analyses in product design. The goal is to
support variation management in production by adjustment and optimization of the processes based on the
insights from the development of the product.
Figure 2: Mapping of variation through the customer, design and production domain (42)
Figure 3 shows the impact model (methodology adapted from Blessing and Chakrabarti (40)) for Robust Design.
It depicts in a simplified manner how the process, design and perceptual sensitivity influence the propagation
of variation and connects this quality characteristic to measurable financial metrics resulting in a “Profit” for a

8 of 71
developing and producing company. The areas of research and contribution of this PhD projects are highlighted
with red arrows and red boxed.
Figure 3: Impact model for Robust Design
1.6. Outline of Thesis This PhD project and the thesis at hand is so-called “paper-based”. As opposed to classic conventional
monograph dissertations, a paper-based thesis has its focus on scientific publications over the span of the 3-
year research project. The thesis itself is therefore only a short description and summary of the work and
contribution of the research. The details of the single studies can be found in the attached journal and
conference articles. All of those have been peer-reviewed and have undergone a rigorous evaluation by a
specialist committee before publication (note that Paper F has been in review at the time of the submission of
this thesis). In that way, the quality and also acceptance of the work by the scientific community is ensured.
The thesis is organized as follows.
This introduction is followed by chapter 2, the “Research Approach” for this PhD project, summarizing the
methodology assuring a rigorous and scientific conduction of the research.
Chapter 3, the “Theoretical basis”, presents the established knowledge and theories that are essential for this
research and which this work is built upon.

9 of 71
Chapter 4, “Results and Discussion”, summarizes and discusses the results of the different studies of this PhD
project. The chapter closes with an evaluation of the PhD research as a whole.
The thesis concludes with Chapter 5, the “Conclusion”, which entails a reflection on the research project, its
academic and industrial contributions as well as its impact and value. Finally, suggestions for further research
are given.

10 of 71
2. Research Approach This chapter describes the scientific approach to this research project. It entails the overall research methodology, methods and activities as well as a description of the strategies to verify and validate the outcomes of the research but also the research itself. The goal is to present the approach to assure the scientific rigor of this work. The chapter is concluded with the actual research plan and overview with the stages, studies and methods.
This research was conducted in the context of product development and engineering design. The study of
natural systems and artificial systems is inherently different and needs different approaches and
methodologies (43). According to van Aken (44) a differentiation can be made between explanatory science
and design science. Explanatory science aims at describing causal dependencies in nature, whereas design
science is more pragmatic and solution-oriented. Other researchers like Kothari et al. (45) talk about Basic
research as opposed to Applied research (see Table 2) meaning similar things. The notion of relevance is crucial
in design science i.e. applied research. One of the main goals of this research project is the applicability in real-
world problems. The main focus is on mechanical design in product development.
Table 2: Differences between basic and applied research (45)
Basic research Applied research
Seeks generalization Studies individual or specific cases without the objective to generalize
Aims at basic processes Aims at any variable which makes the desired difference
Attempts to explain why things happen Tries to say how things can be changed Tries to get all the facts Tries to correct the facts which are problematic Reports in technical language of the topic Reports in common language
2.1. Research Methodology The overall guiding stars for this PhD project were the Research Questions and Hypotheses that have been laid
out in the previous chapter. The goal of this thesis was to answer the questions and whether the hypotheses
can be accepted or rejected. The proper formulation of the research questions and hypotheses was an
essential portion of the research methodology.
The work described in this thesis has elements of explanatory science but is mainly oriented towards design
science and applied product development. The research was influenced by the research methodologies
described by Jørgensen (46) as well as the one proposed by Blessing and Chakrabarti (40), which are common
in design science. These methodologies were chosen due to the nature of the research project being
quantitative and in design science.

11 of 71
2.1.1. Problem-based, Theory-based (PbTb) research approach The PbTb research approach was proposed by Jørgensen (46) and essentially builds upon two ways to conduct
research. As illustrated in Figure 4, research can have its origin in a problem statement but also in an existing
theory or hypothesis that needs to be proven or disproven. Both are valid motivations to start a research
project. However, the ways of approaching the research are different. In the case of a problem-based research,
an analysis of the problem is required to find patterns and causalities. This can involve conducting experiments,
simulations or other empirical studies. Building on the diagnosis for the problem, solutions can be developed
and evaluated to finally arrive at new scientific knowledge. On the other hand, in a theory-based research
approach, the starting point is the synthesis from the theory. Exploiting patterns leads to a model that then
again is tested against the reality. The novel scientific contribution lies within a valid and useful model. The
results from either approach - from the problem-based as well as the theory-based approach - might need
further development and an implementation to industry to generate practical value. In practice both
paradigms are used in research. New theories can be generated while working on a problem, but also new
problems can be discovered while working on a theory.
This framework was seen relevant, because it reflects not only the design science part but can also be used to
address the explanatory part of this research project.
Problem basis Theory basis
Analysis:Discovery of patterns, causalities,
empirical evidence, etc.
Synthesis:Development through patterns,
internal consistency, etc.
Diagnosis Model
Synthesis:Generation of solutions,
evaluation, decision
Analysis:Validity, external consistency,
usefulness, etc.
New scientific knowledge
New scientific knowledge
Knowledge transfer:Adjustment of methods,
implementation, etc.
Practical Results
Re
sear
chD
eve
lop
men
t
Figure 4: Design research model: Problem-based, Theory-based research approach (after Jørgensen (46))

12 of 71
2.1.2. Design Research Methodology (DRM) Research in engineering design is often in the realm of applied research as discussed in the outline of this
chapter where results can be difficult to quantify. Blessing and Chakrabarti (40) developed DRM to structure
the research in this field to have a consistent and coherent methodology and framework for the formulation,
execution and evaluation of the project. Figure 5 shows the different stages of DRM, the basic means and the
main outcomes. After an initial Research Clarification, descriptive and prescriptive studies are altered to
generate knowledge, build theories and models to then again test those. The goal is to find and develop means
to support engineering designers in their work. A more detailed description of the stages will be laid out in the
following.
Figure 5: DRM framework redrawn from (40)
Stage 1: Research Clarification (RC)
The Research Clarification stage is the initial stage of the research project and lays the grounds and scope for
the actual research. It is important on the one hand to get to know the field to an extent where “white-spots”
and gaps in knowledge become evident but also on the other hand to delimit the research. Experience shows
that especially in design research, this is a critical stage due to the sheer endless opportunities and spins the
research could take and to an extent will take anyway. Generally, literature analyses are used in this stage with
the outcome of clearly defined goals that are challenging but realistic and, when achieved, give value to
research and society. An overall research plan should emerge including the research questions and hypotheses
as well as the expected contribution and potential success criteria.

13 of 71
Stage 2: Descriptive Study I (DS I)
The Descriptive Study I builds upon the Research Clarification and seeks to explore, describe and explain the
design phenomena in focus. Empirical studies, but also deeper investigations and analyses, are the basic
means. The studies can either be theory- or data-driven and be of quantitative (“degree to which phenomena
occur”) or qualitative (“nature of phenomena”) nature. As main outcome, this stage delivers a thorough
understanding of the problem, its influencing factors and causes. This lays the basis and gives the insights for
an effective development of a support and how the support can be evaluated.
Stage 3: Prescriptive Study (PS)
Based on the knowledge and understanding gained in DS I, new solutions or other support are developed
addressing the identified key factors to solve the problem and improve the current situation. Common means
in this stage are assumption, experience and synthesis. The proposal of new approaches or methods as support
is the main outcome. Furthermore, a first evaluation of the support in terms of functionality and consistency is
required. Also, success criteria and measureable success criteria should be determined to be able to fully
evaluate the impact of the support.
Stage 4: Descriptive Study II (DS II)
The aim of the Descriptive Study II is to evaluate the support. It answers the question, whether the support
addresses the key factors and has the intended impact on the success criteria. The means are the same as for
DS I and include empirical studies and analyses. Based on the results and the experiences made during the test,
potential necessary improvements and alterations to the support itself or to how it is implemented and used
are put forth. Follow up studies might be necessary to conduct the final validation and verification of the
support.
2.2. Research Methods Depending on the research field and the research question to be answered, different research methods exist.
The nature of research studies is usually categorized as exploratory, explanatory (causal inquiries) or
descriptive (47). A further distinction can be made between qualitative and quantitative methods to describe
different shades of a phenomenon. A short overview over relevant research methods and activities for this PhD
project are given in the following.
Archival Analyses
The analysis of available material – in the context of product development and engineering design for example
drawings, models, change notes, simulation and experiment data, etc. – to explore and describe a
phenomenon yields valuable information to build or test theories, models or hypotheses.

14 of 71
Case studies
In the realm of applied research (design research) as previously discussed in this chapter, case studies build an
essential link to the real-world investigating phenomena empirically. Case studies are often “used for
exploratory research or for pre-testing some research hypotheses” (40). They are the “preferred method when
the investigator has little control over events and the focus is on a contemporary phenomenon” (47). Complex
phenomena can be investigated from a holistic standpoint within a real-life context.
Experiments
In classical natural science like physics and chemistry, experiments constitute the standard method to do
research. But also in other fields, experiments that are of physical nature or in the form of computer
simulations are a common way to test hypotheses and models.
(Systematic) literature reviews
The review of the literature serves several purposes. On the one hand, it is an indispensable tool to establish a
knowledge base that enables the researcher to make a contribution in the first place but also to set the
research into perspective to the work and knowledge of the rest of the research community. On the other
hand, literature reviews can yield new insights and trends that are not obvious from the single contributions.
Executed in a systematic and therefore reproducible manner with an aprioristically defined protocol
furthermore ensures the completeness, rigor and credibility of the study (48).
Survey questionnaires
Surveys are a method to capture “thoughts, beliefs, opinions, reasons etc.” (40) and allow for exploratory and
descriptive studies but also for feedback and evaluation studies. Questions can be formulated in a closed
(multiple choice) or open form. There are some challenges with questionnaires such as preventing biases,
asking a representative group of people etc. that need to be accounted for to ensure reliable and meaningful
results. Furthermore, there are high demands regarding the formulation of the questions for understandability
to secure the least room for interpretation (49).
2.3. Verification and validation of the results of this research The validation and verification (V&V) of the results are an essential part of the reflection on the research. In the
following, different models and argumentations on how the V&V of the results of this research have been
conducted are discussed.
The use of the terms “Validation” and “Verification” is very inconsistent across different research fields and
disciplines and can be used in reversed ways. For this research, the notion from system modelling (50) is taken.
1. Verification refers to the internal consistency
2. Validation refers to the justification of knowledge claims
15 of 71
In systems modelling as well as in classical natural science (Basic research) a “formal, rigorous and quantitative
validation” is required (50,51). A distinction can be made between causal (theory-like) models and non-causal
(statistical/correlational) models which again demand different ways of verification and validation (50).
However, in the field of design research a quantitative validation can be challenging and is not always possible
due to for example qualitative output or little empirical evidence. Still, the internal consistency and value
(usefulness) of the research/support need to be shown. There are different verification and validation
strategies that have been proposed in the field of engineering design that address this difficulty.
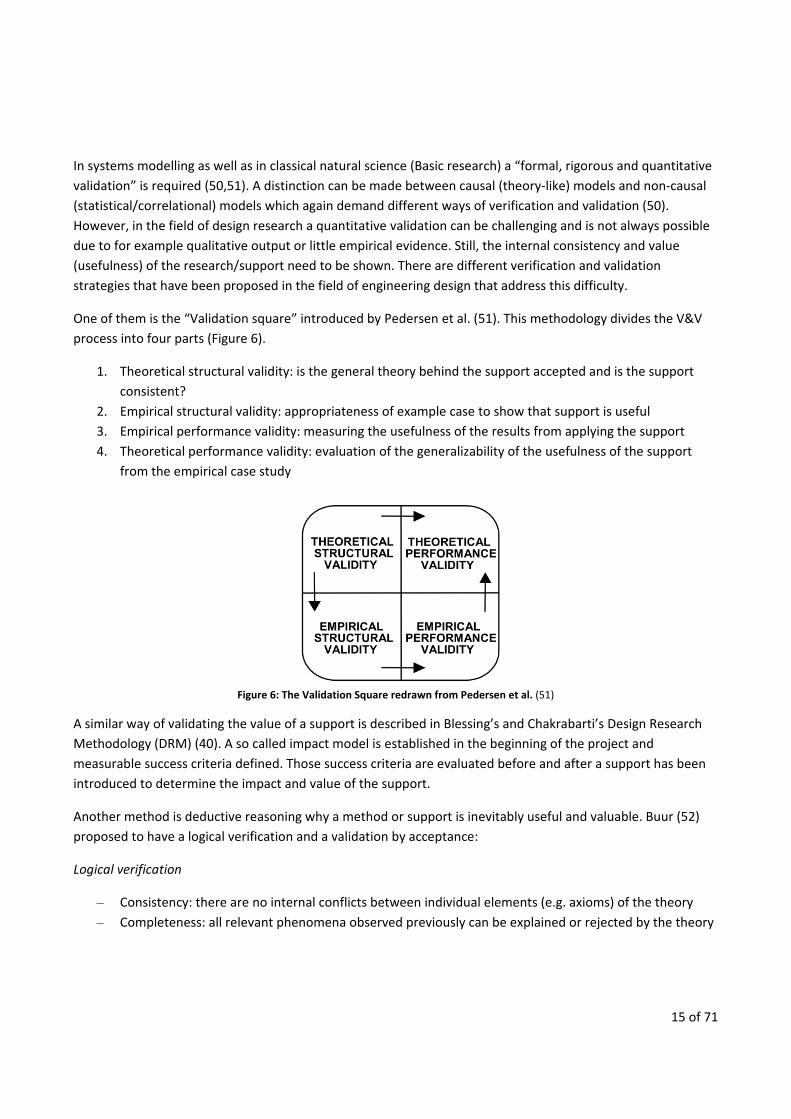
One of them is the “Validation square” introduced by Pedersen et al. (51). This methodology divides the V&V
process into four parts (Figure 6).
1. Theoretical structural validity: is the general theory behind the support accepted and is the support
consistent?
2. Empirical structural validity: appropriateness of example case to show that support is useful
3. Empirical performance validity: measuring the usefulness of the results from applying the support
4. Theoretical performance validity: evaluation of the generalizability of the usefulness of the support
from the empirical case study
Figure 6: The Validation Square redrawn from Pedersen et al. (51)
A similar way of validating the value of a support is described in Blessing’s and Chakrabarti’s Design Research
Methodology (DRM) (40). A so called impact model is established in the beginning of the project and
measurable success criteria defined. Those success criteria are evaluated before and after a support has been
introduced to determine the impact and value of the support.
Another method is deductive reasoning why a method or support is inevitably useful and valuable. Buur (52)
proposed to have a logical verification and a validation by acceptance:
Logical verification
– Consistency: there are no internal conflicts between individual elements (e.g. axioms) of the theory
– Completeness: all relevant phenomena observed previously can be explained or rejected by the theory

16 of 71
– Cases (i.e. particular design projects) and specific design problems can be explained by means of the
theory
Validation* by acceptance (*has been changed from verification to maintain consistency for this thesis)
– Statements of the theory (axioms, theorems) are acceptable to experienced designers
– Models and methods derived from the theory are acceptable to experienced designers
2.4. Research Design The methodologies introduced in the previous sections give the basis for the research design and serve for a
structured approach. Nevertheless, research is not always linear, sequential and plannable as described in
those methodologies. Opportunistic research guided by the methodology can be the more realistic and also
more fruitful research. Opportunities arrive through case studies, projects with companies, master’s projects,
other assignments and simply through the development of interest finding the right niche for the research.
The different methods and V&V strategies were used to conduct and evaluate the different studies of this PhD
project. The remainder of this section illustrates the line of argument of this research, summarizes how the
studies were conducted as well as the general time plan including publications.
2.4.1. Research line of argument As described in the introduction chapter of this thesis, the aim of this research project is to shed light on the
robustness quantification and variation management of complex mechanical systems and to develop a support
for people involved in the development of such systems to evaluate and monitor the level of robustness
throughout the development process. Figure 7 visualizes the line of argument for this research. The starting
point is the current practice and the establishing of a frame of reference for further investigations. The term
“quantification” implies the use of metrics. The second part of the research therefore deals with metrics from
quantitative as well as qualitative models supporting the general assessment of robustness. Lastly, a supporting
tool incorporating the gained knowledge is to be developed and tested.
Figure 7: Research line of argument
2.4.2. Studies and research plan For this research project, several separate studies were conducted to answer the research questions. New
insights but also new problems arose more or less directly from the studies influencing the succeeding studies.
Current practice + frame of reference, potential problems (RQ1)
1. Quantitative modelmetrics (RQ2) 2. Qualitative model metrics
- Influence of complexity (RQ3)
Development and evaluation of support (RQ4+5)
Project title: Metric-driven Robust Design – Robustness Quantification of Complex Engineering Systems

17 of 71
Figure 8 shows the research plan - the general timing of the different stages and studies concluding with a
scientific publication in a journal or conference proceedings. The overview, furthermore, includes the
associated research questions.
Figure 8: Research Plan
Study 1:
To create a frame of reference to place the efforts of evaluating and quantifying robustness in the greater
picture of Robust Design a “Research Clarification” stage was conducted as the first study following the DRM
methodology by Blessing and Chakrabarti (40). This study was influenced by the observation of the product
development process at Novo Nordisk device R&D who have been a generous sponsor but also case company
for this research. Tools and methods commonly associated with Robust Design in industry and academia were
collected and reviewed to find mechanisms and coherences and to be able to set the “robustness evaluation”
activity into context.
Stage: Research Clarification
Methods: Literature review, archival analyses (industry Robust Design toolboxes, feedback from
academic workshops)
2014 2015 2016
Research Question 1
Research Clarification
DS-I / Problem-based research
DS I / PS
Theory-based research
PS
PS / DS II
Study 1: Robust Design in Industry, Academia and Literature
Study 2: Different ways to quantify robustness
Study 3: Robustness vs complexity- A case study
Study 4: Robustness vs complexity – systems modelling and analysis
Study 5: Functional system decomposition
Paper A
Paper B
Paper C
Paper D
Paper E
Paper F Study 6: Variation management support for Robust Design
Research Question 2
Research Question 3
Research Question 4
Research Question 5

18 of 71
V&V: Logical verification / deductive reasoning and validation by acceptance
Study 2:
While analyzing the different tools to evaluate robustness in study 1, it became clear that there is no commonly
accepted metric to quantify robustness. A consolidation of the term robustness and an overview over the
different metrics was necessary and was addressed by this study.
Stage: DS-I / Problem-based research
Methods: Systematic literature review
V&V: Deductive reasoning
Study 3:
Industrial projects revealed that there was a need to take the functional complexity of products into
consideration when evaluating the robustness. Study 3 was a case study analyzing the complexity and
robustness of one of Novo Nordisk’s insulin injection devices to get an idea about the hypothesized influence of
complexity on robustness.
Stage: DS-I / Problem-based research
Methods: Case study, archival analysis
V&V: Validation Square, Correlational model
Study 4:
The modelling of complex systems in study 4 was conducted to investigate the level of generalizability of the
findings from study 3.
Stage: Theory-based research
Methods: Numerical systems modelling
V&V: Correlational model, logical verification and validation by acceptance
Study 5:
A support tool to help developers of complex systems managing robustness and variation requires a model to
structure and decompose the system. The goal of this study was to prescribe a model to achieve a
comprehensive functional mapping of a complex system.
Stage: Prescriptive study
Methods: Literature review, deductive reasoning
V&V: Logical verification, deductive reasoning and validation by acceptance

19 of 71
Study 6:
In this study, a tool was developed based on the research results from studies 1 to 5 to capture, process and
present structural as well as functional information to support holistic robustness quantification and variation
management. The tool was tested and its usefulness and applicability evaluated with two case studies.
Stage: PS, DS-II
Methods: Tool development and case studies
V&V: Deductive reasoning, experiments, surveys
2.5. Other influences on the research Experience and the sharing of knowledge among colleagues and fellow researchers significantly influence the
reasoning and interpretation of results as well as the direction of the research project itself. Also, assignments
and courses apart from the actual research have their impact. Different factors influenced me as the researcher
in this project.
- Experience as a practitioner of Robust Design in the aviation industry
- Consultancy work in the realm of reliability engineering
- Education as Lean Six Sigma Black Belt
- Research stay at the Massachusetts Institute of Technology
- Project work at Novo Nordisk
- Visits of the engineering consultancies Cooper Perkins and Dragon Innovation
- Supervision of Master’s projects with various companies
- Attendance and presentation at the Design 14, ASME 15 and CIRP CAT 16 conferences
20 of 71
3. Theoretical Basis In the following chapter, the underlying theoretical basis for this research project will be described. The state of the art and most relevant theories and methods for this research will be presented. The aim is to assist the reader in understanding the contribution and relevance of the research and the individual scientific articles that are contained as well as position the results in the body of existing knowledge. Starting with the description of generic product development processes, the chapter continues with theory and definition of Robust Design and the frameworks related to it. The chapter concludes with the introduction of complexity in engineering systems and the basics in numerical model building. Note that the theoretical basis will only be described to the extent necessary to understand and follow the research conducted in this PhD project. For further and more detailed information the reader is referred to the given references.
3.1. Product Development Processes This research lies in the domain of product development and engineering design. To be able to place the work
and the contribution of it in its context, common product development processes will be discussed in the
following. Process models are used in academia and industry to describe and prescribe how to approach product
development systematically to ensure a most efficient and effective execution of the task. The utilization of a
product development process depends on the nature, complexity, novelty and criticality of a product or system
that is to be developed. Most common are linear models prescribing a sequential flow of tasks and stages from
an initial idea for a product to the production of it. However, it is widely acknowledged that product
development is not a linear but rather an iterative process (53). Most developing companies use linear process
models due to their capability to house stage gates to manage, plan and control the development efforts (54).
Various linear process models have been proposed. Among those are the models by Pahl and Beitz (25), Ulrich
and Eppinger (55), Andreasen and Hein (56) as well as Hubka and Eder (57). A comprehensive list of engineering
design process models can be found in Howard et al. (54). The mentioned linear models have a common
structure of the process entailing a concept stage, an embodiment stage and a detailed design stage. Figure 9
shows exemplarily the process model by Pahl and Beitz. The Systems Engineering approach takes a step back and
decomposes the development of a system to the development of sub-systems down to components. The V-
model is often used additionally to a stage gate model to organize integrational tasks and to link validation and
verification on the different levels to their associated requirements (11,58). Figure 10 illustrates the V-model.
Time and maturity advances from left to right.
Robust Design is not a development process itself but merely an approach and methodology to ensure product
quality alongside the generic product development process. Generic processes are therefore of relevance to
place Robust Design activities like the quantification of robustness as researched in this PhD project relative to
all other activities. A generic evaluation of a design solution can already be found in the displayed process
models. The quantification of quality characteristics like robustness is essential for the improvement,
optimization, benchmarking and verification of the design solution and to foster metric-driven decision making
utilizing also the ever emerging power of Computer-aided Engineering (CAE).

21 of 71
Figure 9: Product development Process by Pahl and
Beitz (25) Figure 10: V-model redrawn from Blanchard and Fabrycky (58)
3.2. Robust Design theory and definition Robust Design is the central concept and foundation for this research project. In the following, the theories of
Robust Design, on which the current work is based, are presented and discussed. Robust Design was first
introduced by Japanese quality engineer Genichi Taguchi in the 1950s who was at the time employed at the
electrical communications laboratory of Japan’s telephone and telegraph company and challenged with low
quality raw materials and manufacturing equipment after World War II (19). Rather than trying to eliminate
variation he developed a methodology addressing the sensitivity to variation of the products. As Robust Design
became a major success factor in Japan’s quality engineering, he popularized the ideas to the US at AT&T Bell
laboratories in the 1980s followed by uptakes in major companies like Ford Motors and Xerox Corporation
(18,19,39). His motivation for robust design arises from his notion of quality to be twofold:
1. “Product quality: what consumers desire (e.g., functions or appearance)
2. Engineering quality: what consumers do not want (e.g., functional variability, running cost, pollution)”
(10)

22 of 71
In Taguchi’s eyes the best solution to a problem is the one meeting the customer requirements with the lowest
cost to society (39). Variability and inconsistent functional performance is therein seen as major cost for
society.
3.2.1. Quality loss function The essential difference between Robust Design and conventional quality initiatives is its quality maxim, which
says that not all items that lie within specification limits are equally good (39). This paradigm can be explained
with the quality loss function which describes how a deviation of the functional performance from a target
value impacts the perception of quality, i.e. loss to the society.
In traditional quality assurance and control, a quality characteristic is checked against some defined
specification limits and judged to be either acceptable/pass (being inside the limits) or not acceptable/reject
(outside the limits). The notion of quality loss can therefore be described with a step function as shown in
Figure 11a. In contrast, Taguchi associates a loss of quality with any deviation from the target (Figure 11b). The
implications are evident. For a company that follows the step-wise quality loss paradigm, two products that
have almost the same performance, one just inside and one just outside the specification limit, have the two
opposite quality outcomes pass and reject. This veils potential quality problems and lowers the willingness to
pursue quality improvement. It further bears the risk of sudden drops in yield for minimal process drifts or
other changes. Taguchi’s quality loss paradigm fosters efforts to produce products performing on target which
prevents the mentioned risks.
Figure 11: a) Step Quality Loss function; b) Quadratic Quality Loss function (18,19)

23 of 71
Figure 12: a) Quality loss function Smaller-the-better, b) Quality loss function Larger-the-better
Generally, Taguchi differentiates between three different types of requirements (18):
1. Nominal-the-best (Figure 11a, Figure 11b)
2. Smaller-the-better (Figure 12a)
3. Larger-the-better (Figure 12b)
m denotes the target value for a functional performance and A0 the (monetary) loss to society at a variation Δ0
from m, “where the product would fail half of the applications” (19). The quality loss function relates the
functional variation to a loss to society and therefore engineering to economics (39). Table 3 summarizes the
mathematical expressions for the quality loss L of a functional performance y for the three requirement types.
The table also includes the average loss for a population of n functional performances which can be
derived from the mean square deviation. and denote the variance and mean of the functional
performances respectively.
Table 3: Quality loss functions
Nominal-the-best Smaller-the-better Larger-the-better
Loss ∆
∆
∆1
Average loss ∆
∆
∆1 1
3.2.2. Robustness definition The quality loss function as presented in the preceding section illustrates the differences between the
traditional and Taguchi’s paradigm of quality engineering.

24 of 71
There are several definitions for “robustness” from various sciences including engineering, computer, natural
and social sciences. The IEEE (59) defines robustness as “the degree to which a system or component can
function correctly in the presence of invalid inputs or stressful environmental conditions.” Another definition of
robustness by Holmgren (60) states that “Robustness signifies that the system will retain its system structure
(function) intact (remains unchanged or nearly unchanged) when exposed to perturbations”. Kitano (61)
phrases the robustness as “property that allows a system to maintain its functions against internal and external
perturbations”. Gribble (62) adds that system robustness is “the ability of a system to continue to operate
correctly across a wide range of operational conditions, and to fail gracefully outside of that range.” Taguchi et
al (18) define Robust Design as “designing a product that can function properly under various conditions of
use.” A more comprehensive definition is given by Fowlkes and Creveling (39):
“A product is said to be robust when it is insensitive to the effects of sources of variability, even though the
sources themselves have not been eliminated.”
Robust Design is therefore a methodology for designing products, devices, and production equipment to
perform as intended, despite variation. In the literature, differentiation is made between three types of Robust
Design:
- Type I: insensitive to variations in the noise factors as classically promoted by Taguchi (21)
- Type II: insensitive to variations in the product’s design parameters (21)
- Type III: insensitive to variability and uncertainty in the system models (63)
The P-diagram (Figure 13) is commonly used to illustrate the different influencing factors of the behavior
(response) of a product or process.
Figure 13: P-diagram (19)
A comprehensive discussion about the different notions of robustness was conducted in study 2 of this
research (64) and will be presented in Chapter 4 of this thesis.
While the definitions mentioned above relate to the use phase which is most important to the customer, it
needs to be stressed that variability is omnipresent in all stages of the product life and a major cost driver also

25 of 71
in product development and production. The different sources of variation can be classified as shown in Table
4.
Table 4: Classification of sources of variation
Maintaining functional performance under variation in the input and environmental condition is common in
the definitions stated above. This notion of robustness is closely related to the concept of reliability which is
defined as “the ability of an item to perform a required function under stated conditions for a specified period
of time.” (ISO 8402). The concept of reliability is based on the occurrence of failures and clearly limited to a
predefined mission profile and time which entails variability which is a major driver for performance
deterioration and finally for failure. Robustness can therefore be seen as a prerequisite and strategy to ensure
reliability (19).
3.2.3. Transfer function model The Transfer function is a mathematical description to relate the functional performance of a product to its
influencing parameters usually in the form:
, … ,
Where f denotes the functional performance and xi the n influencing parameters, which can be noise, signal or
control factors (design parameters) (see Figure 13).
The graphical representation of the model can be used to illustrate, place and describe Robust Design efforts.
The gradient of the graph represents the sensitivity of the functional performance to the respective design
parameter (Figure 14). In the case of a non-linear transfer function, this gradient is dependent on the target
value of the design parameter. With information about the variation (probability distribution) of the design
parameter, for example from process capability databases (see for example (65)), the variation in the
Howard et al (32) Fowlkes & Creveling (39), Phadke (19), Taguchi et al.
(18)
Material
Unit-to-unit noise Manufacturing
Assembly
Load (use) Outer / External noise
Environment / ambient conditions
Time-dependent (creep, wear, corrosion) Inner / deterioration noise

26 of 71
functional performance can be calculated. The slope of the transfer function determines the spread (width) of
the functional performance probability distribution. From a production perspective a low sensitivity is
appreciated allowing wider tolerances without compromising the variance of the functional performance, i.e.
product quality. Influencing the propagation of variation is a central concept of Robust Design as discussed in
the previous section.
Figure 14: Transfer Function model redrawn from Ebro (28)
3.3. Frameworks related to Robust Design
3.3.1. The Taguchi method The so-called Taguchi method was the first framework incorporating the ideas and mind-sets of Robust Design
with quality loss occurring with any deviation from the target performance and is still used in developing
companies. The goal is to achieve an optimal trade-off between functional performance and cost, where cost
includes the cost to society due to variation from the target performance.
Another paradigm shift is promoted in the focus and sequence of designing for performance and quality. In
contrast to the conventional approach in which a function is first designed to its performance target and then
checked for its variance in practice, the sequence is turned around in the Taguchi method with the variance of
a function being addressed first before adjusting to target. Taguchi argues that in that way a costly trial and
error development can be avoided (18).
3.3.1.1. Signal – Noise-Ratio A central metric for robustness in the Taguchi method is the Signal-to-Noise ratio (SN ratio). The SN ratio is a
quality metric from the communication industry setting the power of the signal in relation to the power of the
noise for example for receivers (66).

27 of 71
Taguchi adapted the SN ratio for the evaluation of functions and processes with respect to their influencing
factors. In the Taguchi method it is distinguished between the dynamic and static SN ratio. The dynamic SN
ratio describes the ratio of the power of proportionality between control and output to the power of variability
for the entire range of a parameter. It therefore evaluates a dynamic quality characteristic over a range of
values where the target is adjustable like for example the tone scale for printers (39). It aims to “optimize the
function rather than just a single result” ((39) p. 119).
The static signal to noise ratio is used for fixed target problems (66) and describes the ratio between the power
of mean to the power of variability around the mean (39). As previously described, there are three classes of
requirements – smaller-the-better (STB), larger-the-better (LTB) and nominal-the-best (NTB). Depending on the
type of requirement, the SN-ratio can be derived with the respective mean square deviation (MSD). are the
observed n functional responses, and μ the population variance and mean respectively.
1. Smaller-the-better
10 log 10 log1
10 log
2. Larger-the-better
10 log 10 log1
1/
3. Nominal-the-best
10log 10log 10log
The SN ratio is inversely proportional to the quality loss and makes a monetary evaluation possible (18,66). The
logarithmic transformation magnifies the differences between parameters and changes the units to decibels.
Another advantageous property is that multiplicative changes become additive, “thus making the metric
proportional to relative quality” (39).
3.3.1.2. Phases Taguchi distinguishes between 3 main phases of Robust Design: System design, Parameter design and
Tolerance design (18,19,39).
1) System Design relates to the concept and embodiment of a design solution addressing the functional
requirements of the product. Tools which are often associated with this phase are Quality Function
Deployment (QFD), dynamic Signal-to-noise ratio optimization, theory of inventive problem solving, DoE,
competitive technology assessment and Pugh concept selection.

28 of 71
2) In the Parameter Design phase the design is optimized for robustness. Designed experiments are used to
gain understanding about the system behavior and the sensitivity of design parameters and noise factors,
followed by the optimization of the static signal-to-noise (SN) ratio. The core idea is to utilize non-linearities
and interactions between control and noise factors (11) with the aim to find the best control parameter setting
that minimizes the functions’ sensitivities to noise without negatively influencing the (manufacturing) costs
(19). Couplings, i.e. interactions between control factors add complexity which “is harmful in Quality
Engineering” since it complicates models and experiments and therefore increases the risks for inconsistent
and non-reproducible results (66).
3) The third phase is the Tolerance Design which entails the optimization of the tolerances with respect to
manufacturing costs and cost due to quality loss. This phase is therefore characterized by monetary trade-offs.
Regularly used tools are quality loss functions, Design of Experiments and ANOVA (18,67).
All three phases can be applied in design, manufacturing process design and manufacturing. The Taguchi
approach focuses mainly on type I Robust Design to optimize the robustness against noise factors utilizing
systematic experimentation following orthogonal arrays in the Parameter Design phase. System Design and
Tolerance Design play a less important role since Taguchi sees them as “specialist’s territory” and “last
countermeasure”, respectively, to ensure a robust performance(18).
3.3.2. Axiomatic Design Axiomatic Design is another influential theory in engineering design which connects design principles with
Robust Design and system complexity considerations. Axiomatic design was originally proposed by Nam P. Suh.
Following Suh, the design process comprises the mapping through four design domains: from the customer
domain through the functional and physical domain to the process domain (Figure 15). The customer attributes
(CA), functional requirements (FR), design parameters (DP) and process variables (PV) are characteristic vectors
in their respective domain.
Figure 15: Design domains following Suh with characteristic vectors {x} (redrawn from (29))
Mathematically, the mapping is described with a linear system of equations in the form:
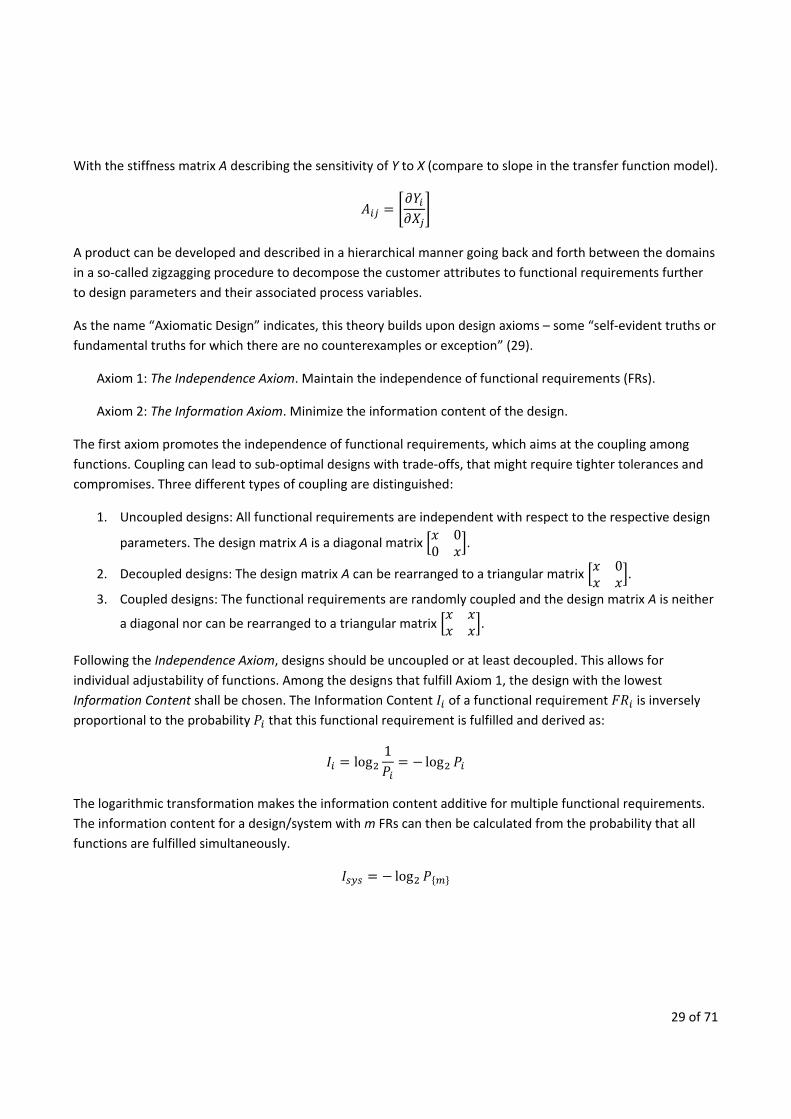
29 of 71
With the stiffness matrix A describing the sensitivity of Y to X (compare to slope in the transfer function model).
A product can be developed and described in a hierarchical manner going back and forth between the domains
in a so-called zigzagging procedure to decompose the customer attributes to functional requirements further
to design parameters and their associated process variables.
As the name “Axiomatic Design” indicates, this theory builds upon design axioms – some “self-evident truths or
fundamental truths for which there are no counterexamples or exception” (29).
Axiom 1: The Independence Axiom. Maintain the independence of functional requirements (FRs).
Axiom 2: The Information Axiom. Minimize the information content of the design.
The first axiom promotes the independence of functional requirements, which aims at the coupling among
functions. Coupling can lead to sub-optimal designs with trade-offs, that might require tighter tolerances and
compromises. Three different types of coupling are distinguished:
1. Uncoupled designs: All functional requirements are independent with respect to the respective design
parameters. The design matrix A is a diagonal matrix 0
0.
2. Decoupled designs: The design matrix A can be rearranged to a triangular matrix 0
.
3. Coupled designs: The functional requirements are randomly coupled and the design matrix A is neither
a diagonal nor can be rearranged to a triangular matrix .
Following the Independence Axiom, designs should be uncoupled or at least decoupled. This allows for
individual adjustability of functions. Among the designs that fulfill Axiom 1, the design with the lowest
Information Content shall be chosen. The Information Content of a functional requirement is inversely
proportional to the probability that this functional requirement is fulfilled and derived as:
log1
log
The logarithmic transformation makes the information content additive for multiple functional requirements.
The information content for a design/system with m FRs can then be calculated from the probability that all
functions are fulfilled simultaneously.
log

30 of 71
With
For statistically independent FRs
| For statistically dependent FRs
This probability of success can be visualized as the area of the common range in a probability distribution
diagram (Figure 16), i.e. by the overlap of the Design Range (success criterion) with actual System Range
(output distribution).
Figure 16: Common Range, redrawn from Suh (29) p. 41
A good design can accommodate large amounts of variation and still function as intended. This requires a
robust design with low stiffness values in the design matrix A and a minimum bias. Both result in a low
information content for the design. Similarities can be drawn to the Taguchi method as discussed in the
previous section which aims to reduce variance and set to target in a two-step approach.
3.3.3. Variation Risk Management (VRM) Variation risk management (VRM) was proposed by Anna Thornton as an approach to identify, address and
manage risks due to variation in a holistic, process oriented and data-driven manner (31). The prioritization of
quality efforts is in the core of the framework with “the ultimate goal […] to improve product quality,
operational efficiency and productivity” (31). VRM is based upon quantitative and qualitative assessments of

31 of 71
the influence of variability in production including robustness and process capabilities considerations, which
makes it highly relevant for the research at hand. The framework consists of three main stages.
1. Risk identification
The aim of this phase is to gain a holistic and comprehensive view on variation starting from establishing what
determines quality for the product. From there on, so-called Key Characteristics (KC) – “quantifiable features
[…] whose expectable variation from target has an unacceptable impact on the cost, performance or the safety
of the product” – are identified and decomposed in a “variation flow-down” procedure consisting of five levels:
Product KCs, System KCs, Assembly KCs, Part KCs and Process KCs. Figure 17 shows an exemplary and simplified
KC flow-down for a car door.
Figure 17: KC flow-down for a car door (redrawn from Thornton (31,68))

32 of 71
2. Risk assessment
In this stage, the probability and cost of variation in the identified product KCs is assessed. For that the
associated child KCs, i.e. part and process KCs are analyzed based on the predicted or measured defect rates
and their cost in development and production, respectively. This assessment can be quantitative or qualitative
(31). Pareto and contribution analysis are then used to prioritize efforts in the following mitigation phase. The
data can be utilized to predict the final product quality by summing up the individual part variations or
allocating allowable variations to single features in the form of tolerances.
3. Risk mitigation
The risk mitigation stage builds upon the information acquired in the risk assessment stage with the goal to
reduce and optimize cost through design changes and process improvements. Generally, two strategies are
followed: on the one hand the reduction of variation at the source and on the other hand the reduction of the
design’s sensitivity to variation. Common practices are cost/benefit trade-offs, Robust Design and
manufacturing quality plans.
3.3.4. Variation Management Framework The Variation Management Framework (VMF) was originally developed by Howard et al. (32) to explain and
visualize Robust Design efforts. It consists of the four domains proposed by Suh in Axiomatic Design, namely
the Customer, Functional, Physical and Process domain. The mapping between the domains describes the
value, functional and structural composition of the product. The main visualization of the VMF is a coordinate
system view similar to the one proposed by Whitney (41) with the domains on either ends of the axes. Utilizing
Transfer Functions between the domains, variation in one domain can be mapped and propagated to the other
domains. Figure 9 shows an example mapping for a pen lid removal force.
Figure 18: The VMF: modelling an example of a pen lid removal force from Howard et al. (32)

33 of 71
Seven different strategies exist to address variation in the different domains marked (0)-(6) in Figure 18. A
successful and efficient variation management in product development and production is a monetary trade-off
between the strategies. A short description of the variation intervention and trade-off points is given in Table
5.
Table 5: Variation intervention and trade-off points from Howard et al. (32)
0 Accept variation in the marketplace
1 Reduce sensory/perceptual robustness
2 Reduce outgoing variation by increasing outgoing quality control (product sampling)
3 Reduce the sensitivity of the design
4 Reduce ingoing variation by increasing ingoing quality control (part measurement)
5 Reduce production sensitivity
6 Reduce production variation
3.4. Structural complexity in engineering systems In the field of product development, the notion of complexity plays an essential role. Especially with the
emergence of large scale interdisciplinary engineering systems and ever more integrated products, the need
for modeling and managing complexity has risen to increase the understanding and to prescribe a superior
design (69). Besides the optimization of the system architecture utilizing modularization (clustering) and
sequencing, the assessment of change and uncertainty propagation is of crucial importance. In that way
complexity investigations become interesting from robustness point of view as dealt with in this research.
Following the International Council on Systems Engineering (INCOSE) complexity is formally defined as
“the degree of difficulty in predicting the properties of a system if the properties of the system's parts are
given” (70) p. 72.
This definition of complexity lays a common ground for the various definitions by scholars from this field of
study. Summers and Shah (53) distinguish three different notions of complexity. Firstly, complexity related to
the “information that is contained within a problem”, which is in line with the “Information Content” in Suh’s
Axiomatic Design as discussed in section 3.3.2. Suh defines complexity “as a measure of uncertainty on
achieving the specified Functional Requirements”. “A design is called complex when its probability of success
is low” (29) p. 40. The second notion of complexity discussed by Summers and Shah is related to the coupling
and interconnectivity of a problem. Following this notion, Magee and de Weck (71) describe a complex system
as “a system with numerous components and interconnections, interactions or interdependence […]”. Further,
Summers and Shah present the solvability of a problem as a measure for complexity. Different approaches
exist to measure and quantify complexity including complexity theory, entropy and information theory (72).
Various scholars acknowledge that complexity is a large contributing factor to the robustness of a system.
INCOSE notes that for complex products “(un-measurably) small perturbations in inputs or environmental
conditions may result in unpredictable changes in behavior.” (70) p. 72. Gribble writes that “small changes to a
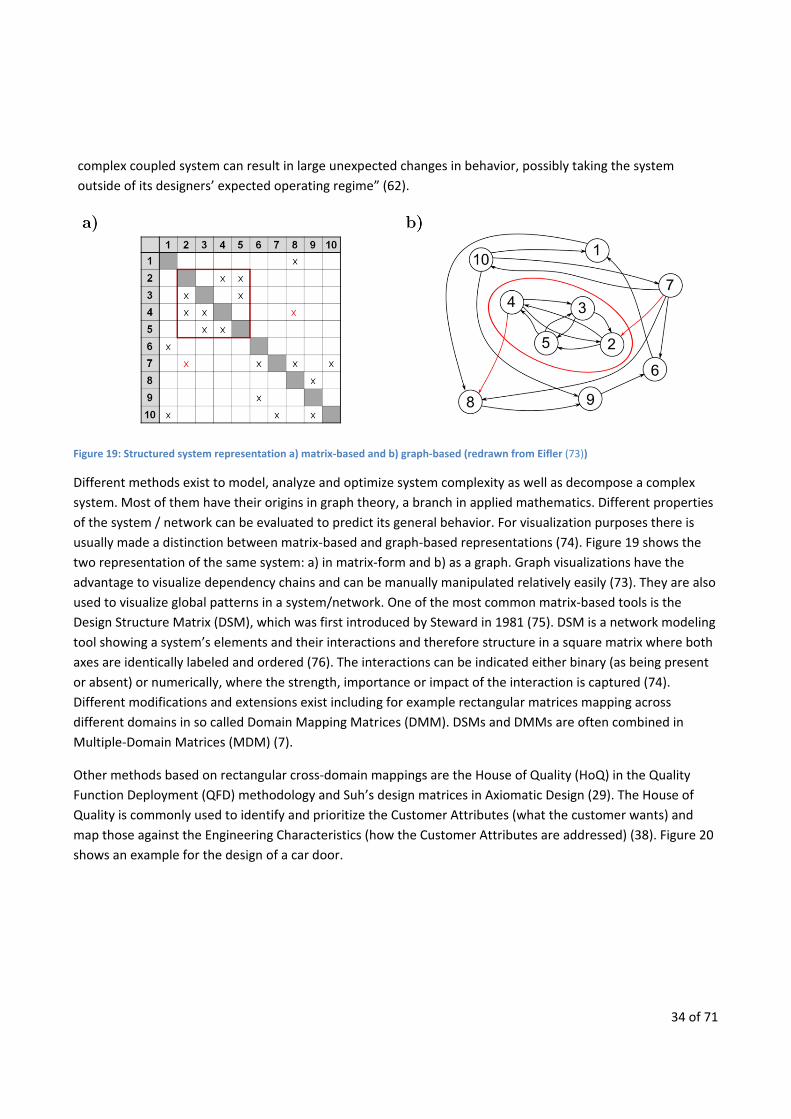
34 of 71
complex coupled system can result in large unexpected changes in behavior, possibly taking the system
outside of its designers’ expected operating regime” (62).
Figure 19: Structured system representation a) matrix-based and b) graph-based (redrawn from Eifler (73))
Different methods exist to model, analyze and optimize system complexity as well as decompose a complex
system. Most of them have their origins in graph theory, a branch in applied mathematics. Different properties
of the system / network can be evaluated to predict its general behavior. For visualization purposes there is
usually made a distinction between matrix-based and graph-based representations (74). Figure 19 shows the
two representation of the same system: a) in matrix-form and b) as a graph. Graph visualizations have the
advantage to visualize dependency chains and can be manually manipulated relatively easily (73). They are also
used to visualize global patterns in a system/network. One of the most common matrix-based tools is the
Design Structure Matrix (DSM), which was first introduced by Steward in 1981 (75). DSM is a network modeling
tool showing a system’s elements and their interactions and therefore structure in a square matrix where both
axes are identically labeled and ordered (76). The interactions can be indicated either binary (as being present
or absent) or numerically, where the strength, importance or impact of the interaction is captured (74).
Different modifications and extensions exist including for example rectangular matrices mapping across
different domains in so called Domain Mapping Matrices (DMM). DSMs and DMMs are often combined in
Multiple-Domain Matrices (MDM) (7).
Other methods based on rectangular cross-domain mappings are the House of Quality (HoQ) in the Quality
Function Deployment (QFD) methodology and Suh’s design matrices in Axiomatic Design (29). The House of
Quality is commonly used to identify and prioritize the Customer Attributes (what the customer wants) and
map those against the Engineering Characteristics (how the Customer Attributes are addressed) (38). Figure 20
shows an example for the design of a car door.
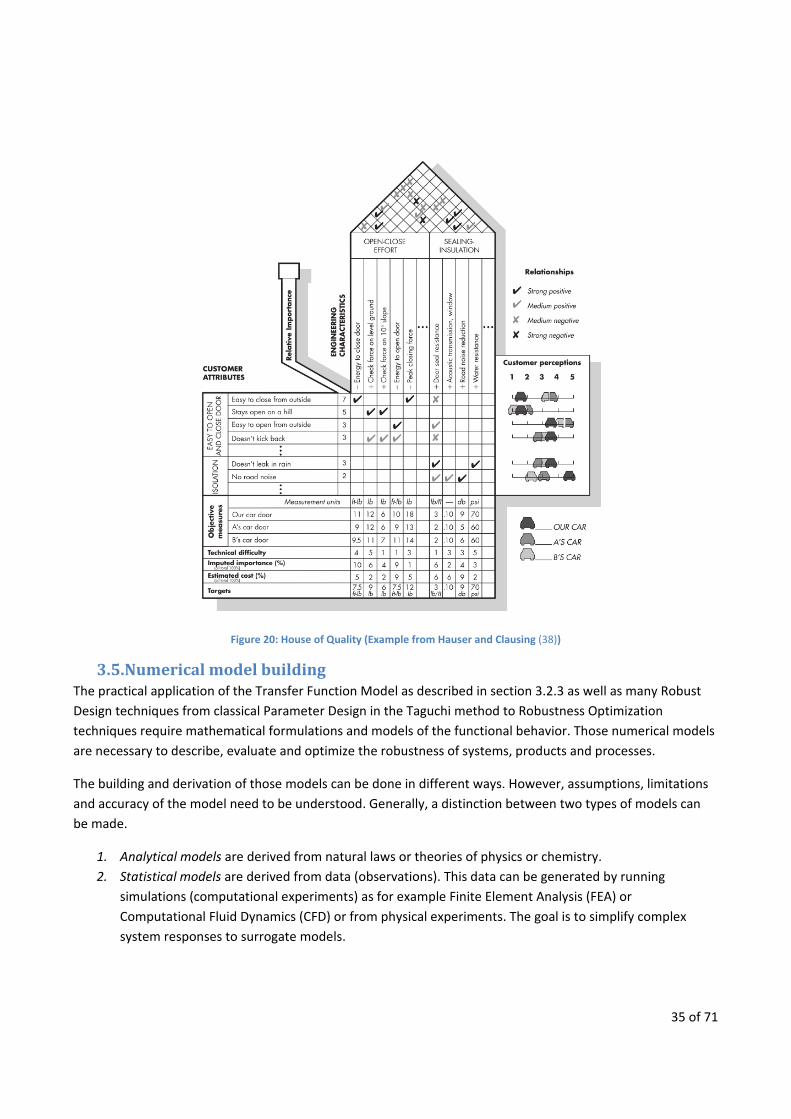
35 of 71
Figure 20: House of Quality (Example from Hauser and Clausing (38))
3.5. Numerical model building The practical application of the Transfer Function Model as described in section 3.2.3 as well as many Robust
Design techniques from classical Parameter Design in the Taguchi method to Robustness Optimization
techniques require mathematical formulations and models of the functional behavior. Those numerical models
are necessary to describe, evaluate and optimize the robustness of systems, products and processes.
The building and derivation of those models can be done in different ways. However, assumptions, limitations
and accuracy of the model need to be understood. Generally, a distinction between two types of models can
be made.
1. Analytical models are derived from natural laws or theories of physics or chemistry.
2. Statistical models are derived from data (observations). This data can be generated by running
simulations (computational experiments) as for example Finite Element Analysis (FEA) or
Computational Fluid Dynamics (CFD) or from physical experiments. The goal is to simplify complex
system responses to surrogate models.

36 of 71
An efficient data gathering, i.e. experiment planning, and model deduction from the data is essential for the
applicability of statistical models and will be described in the following.
Experiments (physical or computational) are means to generate knowledge about a functional response with
one particular parameter setting. To identify correlations and to build a model, multiple data points need to be
collected. The number of experimental runs depends on the complexity of the problem (i.e. how many
influencing factors exist and how these are coupled) and the requirements on the model accuracy. Simple one-
factor-at-a-time screening procedures can be used to investigate how the functional response changes due to
one parameter. However, interaction effects between factors cannot be captured in this way. So called full
factorial experimental designs, where every combination of parameter levels is tested, exhaustively capture
the entire parameter space also yielding all interaction effects. However, full factorial experimental designs
become very costly and time consuming with an increasing number of parameters and parameter levels due to
the number of required experiments.
m: number of levels
n: number of parameters
In most cases where functional responses are mainly driven by main effects rather than high-order
interactions, this method is very inefficient. To address this inefficiency, fractional factorial experimental
designs were developed. The idea is to design experiments that efficiently cover the parameter space while
yielding information about the effects of factors and interactions to a certain order. As a result, certain
interactions are deliberately confounded with other interactions or main effects, which means that not all
factor interactions can be distinguished from the generated data. Data from designed experiments also bare
other favorable properties with respect to subsequent modeling like mathematical independence of the factor
effects due to the balance in the experimental design (39).
The first work on Experimental Design dates back to the 1920s conducted by Sir R. A. Fisher in the 1920s ("The
Arrangement of Field Experiments" (1926) and “The Design of Experiments” (1935)) (77). Since then, Design of
Experiments has been subject to deliberate research. Besides the classical statistical approach by Fisher,
orthogonal arrays promoted by Taguchi, the variables search approach by Dorian Shainin (78) and the work by
Box et al. (79,80) have influenced the research in this field (77).
Based on the generated data, different techniques can be used to build a surrogate model. The size, i.e. the
amount of observations, and the limitations introduced by the experimental plan in the case of fractional
factorial designs needs to be taken into consideration for modeling efforts. A common technique to generate a
surrogate model is the response surface methodology (RSM) by Box and Wilson (81) which utilizes regression
analysis fitting the data to a polynomial model. More recent are machine-learning techniques in the form of for
example decision trees and artificial neural networks.

37 of 71
4. Results and Discussion This PhD project comprises six single studies which jointly sought to answer the research questions and prove or disprove the hypotheses laid out in the introduction. All of them have been described in detail and published in scientific journals or peer-reviewed conference proceedings. The purpose of this chapter is to summarize and discuss the key results of the studies. This includes the discussion on whether the research questions have been answered and whether the research hypotheses can be accepted or rejected. This is followed by a validation and verification of the research project as a whole and a reflection on the limitations.
This research set out to investigate the quantification of robustness in complex products and the influence of
complexity on robustness. This investigation is twofold including on the one hand metrics and indicators for the
quantification and on the other hand the methods and approaches on how to quantify robustness. Different
objectives, research questions and hypotheses have been formulated for this PhD project (see introduction
chapter) to structure and guide the research.
4.1. Study 1 – Paper A The first aim of this research project was to investigate and clarify the quantification of robustness. Study 1
comprised an investigation and analysis of the suite of Robust Design methods and tools to address Research
Question 1:
Research Question 1 a) What Robust Design methods, frameworks and processes exist to analyze and synthesize robustness? b) How can a coherent Robust Design process be prescribed?
4.1.1. Publication Title: Mechanisms and coherences of robust design methodology: a robust design process proposal
Journal: Total Quality Management & Business Excellence
Citation: Simon Moritz Göhler, Martin Ebro and Thomas J. Howard (2016). “Mechanisms and coherences
of robust design methodology: a robust design process proposal”, Total Quality Management
& Business Excellence, DOI: 10.1080/14783363.2016.1180952
4.1.2. Summary of results The paper presents a Robust Design Process based on the mechanisms and coherences of the methods and
tools associated with Robust Design. It is argued that eight different mechanisms exist of how a Robust Design
method influences, interacts or describes the design to foster robustness against variation. A further
classification with respect to the actual activity of the design or development engineer revealed four governing
activities:
1. Firstly, Conceptual Design which addresses the actual composition of the design. This entails the choice
of working principles that robustly fulfill the functional requirements of the product. It furthermore

38 of 71
includes other design choices related to the level of functional integration and complexity implicitly
affecting the robustness of the design solution.
2. Secondly, the Measuring and Modeling of the system response. While conceptual design must include
certain knowledge about how a particular functionality can be realized, the detailed understanding of
the functional performance and behavior is in the core of Robust Design and the objective of this
activity.
3. Processing and Evaluating the system response is a third kind of activity that is undergone in the
process of Robust Design.
4. Another activity comprises the Detailing and Optimization of the design for robustness and minimal
cost.
Table 6: RDM mechanisms and engineering activities
No Mechanisms of RDM Tools/Methods What the designer does (Design Activities)
I Robust concept design Selection of the working principle and the conceptual design solution
1. Conceptual Design In this context, conceptual design is understood as defining a new solution to a design problem, as opposed to scaling (see below).
II Reduction of couplings between functions
Axiomatic Design Axiom 1
Separation/Integration of functions III Reduction of number of
influencing factors Axiomatic Design Axiom 2
Design Clarity
Kinematic Design
Locating Schemes
Tolerance Chains IV Design with robustness
margins Safety factors wrt. structural and
process capability data
V Measuring of system response
Design of Experiments (DOE) 2. Data collection (measuring) and modelling of the system response
VI Modelling of system response
Analytical Transfer Function Modelling
Design Matrix
Response Surface Methodology and other data fitting methods
Variation Mode and Effects Analysis
VII Processing and evaluation of system response
Design Structure Matrix (DSM) 3. Process and Evaluate (Graphs, metrics, visualizations and deciding on further actions)
Error Transmission Formula
Ishikawa / Fishbone Diagram
Monte-Carlo-Analysis (MCA)
P-Diagram
Pareto Analysis
Sensitivities Analysis
VIII Scaling (optimization) of design parameters
Optimization of transfer function or S/N-Ratio
4. Detailed design and scaling (optimization) of parameters and tolerances Tolerance Management

39 of 71
Table 6 summarizes the results of the analysis of the Robust Design toolbox with its 23 methods and tools. It
lists their underlying mechanisms and relations to the engineers’ activities.
From the design activities, it was concluded that there is an underlying inherent sequence in which the
activities and therefore the methods are linked together. “The coherences of the methods and activities form
the process”, i.e. the four activities can be arranged in a logical order of application forming an iterative
reoccurring process that is undergone in every stage of the development process (see Figure 21).
Figure 21: Proposal of a Robust Design process
4.1.3. Discussion and reflection The research question is formulated open and includes a familiarization with the overall topic of Robust Design
acting as support for the Research Clarification stage (40). The analysis revealed that there is currently no
coherent Robust Design process available. Robust Design is rather seen as part of a larger strategy like in
Design for Six Sigma or Variation Risk Management. Various methods were identified which are associated with
Robust Design but are perceived as single standing patchwork of efforts for the improvement of robustness.
The proposed process, with synthesis and analysis activities being conducted in an alternating manner, has
some similarities to Property-driven design (PDD) by Weber (82) that features so-called “Synthesis-Analysis-
Evaluation Cycles” that are conceptually similar to the activities 1-3. Optimization (part of activity 4) is not
explicitly discussed in PDD. The framework of Characteristics-Properties Modelling (CPM) / PDD was developed
as an overarching theory to integrate many existing approaches to product development. It is interesting to
note that the research at hand, even though taking the departure from a different view point, namely analyzing
Robust Design methods and tools, arrived at a similar process description.

40 of 71
The study also shows that the evaluation and quantification of a design’s robustness plays an essential role in
checking and improving a design to achieve a variation insensitive design. “You cannot improve what you
cannot measure” (39). The results of the study answer research question 1 and lay the basis for the remaining
PhD studies in the form of an understanding of the state of the art Robust Design and the different
mechanisms that are utilized to influence, explore and describe robustness.
4.1.4. Study evaluation To evaluate study 1, the methodology of logical verification and deductive reasoning as well as validation by
acceptance (52) is applied. Logical verification is shown with:
Consistency: The model of the Transfer Function was used to analyze the methods in an objective and
consistent manner. The succeeding categorization and derivation of a Robust Design process
was conducted through logic and deductive reasoning to ensure consistency.
Completeness: For this study, four different sources were utilized to gather methods and frameworks related
to Robust Design. A clear definition and delimitation of a “Robust Design tool” ensured a
rigorous and complete selection of the methods. With respect to the categorization, it could be
shown that the defined categories are mutually exclusive and collectively exhaustive meaning
that all methods could be categorized without ambiguity into one and only one category.
To validate the usefulness, different application cases are discussed in the article. This includes the use of the
categorization and Robust Design process to increase the engineers’ understanding and awareness of their
current Robust Design efforts. This is especially important for the successful implementation and integration in
developing companies, since it was found that a tool-pull from the practitioners has a higher chance for an
uptake than a tool-push from management (83). Another possible application was presented with respect to
the building and establishing of a company Robust Design toolbox.
4.2. Study 2 – Paper B Motivated by the ambiguity of the term “robustness” and the various ways that robustness is quantified in the
literature and in practice, in this study, a systematic literature review was conducted to investigate into
analyses and quantification of robustness to address Research Question 2:
Research Question 2 What robustness indices and metrics and ways to derive these exist and what are their differences and limitations?

41 of 71
4.2.1. Publication Title: Robustness Metrics: Consolidating the Multiple Approaches to Quantify Robustness
Journal: Journal of Mechanical Design
Citation: Simon Moritz Göhler, Tobias Eifler, and Thomas J. Howard. "Robustness metrics: Consolidating
the multiple approaches to quantify robustness." Journal of Mechanical Design 138.11 (2016):
111407.
4.2.2. Summary of results From the systematic literature review, 38 unique robustness metrics were identified and analyzed based on the
model of the Transfer Function with its three main entities, namely (1) the relationship between independent
and dependent variables, (2) the functional limits and (3) the variation in the independent variables as shown
in Figure 22.
Figure 22: Robust Design framework to represent the propagation of variation
In addition to the information entities necessary to derive the individual metrics, the level of complexity that
the metrics reflect, i.e. the number of functions and independent variables, has been investigated. The results
are summarized in Table 7. The analyses revealed four different types of robustness metrics which each
promote a different notion of robustness:
1) Sensitivity robustness metrics that quantify the influence of one or more design parameters or noise
factors (independent factors) to the functional output
robustness of a concept
2) Metrics that describe the size of the feasible design space as measure for the robustness
robustness of a design

42 of 71
3) Metrics that evaluate different expectancy and dispersion measures of the functional output
robustness of a function
4) Metrics that evaluate the probability of functional compliance meaning that all functions are
satisfactorily fulfilled under the influence of ingoing variation
robustness of a product
This means that besides the general classical concept of “robustness” as the insensitivity to the influence of
variation, there are several other concepts and meanings of “robustness” that are used especially when
attempting to quantify robustness.
Table 7: Classification scheme for robustness metrics
Robustness Metric Class Sensitivity Size of feasible design space
Functional expectancy and
dispersion
Probability of functional
compliance
Meaning in the TFM
Necessary information
entities
Model / Experiment Functional limits - -
Expected / measured variation
- -
Level of complexity (# of functions / # of
independent variables)
1 / 1 1 / n ()
n / n -
4.2.3. Discussion and reflection In the preceding study, it was established that measuring and quantifying robustness plays an essential role in
Robust Design to prioritize efforts, make metric-driven design decisions, judge risks, predict yield and as cost
functions in robustness optimization. The second study continued the research further investigating the
different ways of robustness quantification and their associated interpretation for robustness.
From this study, it can be concluded that although the insensitivity to variation is in the core of the
“robustness” definition, there is a further practical differentiation depending on the application and the
information available, i.e. when in the development process the robustness is evaluated. The sheer sensitivity
of a dependent variable on one or more independent variables is an important measure to evaluate the
robustness of a concept or a design solution addressing a certain function. However, the practical implication
with respect to the expected variation in the independent variables and the actual functional limits are
neglected. Also, the interplay with other functions of the product and how these are coupled are not reflected.

43 of 71
The conceptual robustness (sensitivity) and design robustness (size of feasible design space) are independent
of the (expected) variation. As companies are mostly interested in high yield rates and total functional
variance, these metrics might not matter too much if process capabilities are sufficiently strong and ingoing
variation can be controlled. In that case, functional (functional expectancy and dispersion) and product
robustness (probability of functional compliance) metrics are more useful. However, products with low
functional sensitivities to variation are more robust against unexpected variation and erroneous definitions of
specification limits. This categorization of robustness metrics has practical implications on when to use what
metric and what this means. The authors believe that this removes the ambiguity around term “robustness”
supporting the use and communication of it in practice as for example in the formal introduction of robustness
requirements to specification documents and design targets.
With the comprehensive list and categorization of robustness metrics from this study, Research Question 2 is
considered answered.
4.2.4. Study evaluation By applying a systematic literature review, a rigorous and comprehensive study was ensured. A deductive
reasoning approach was used to explain the differences between the metrics and to explain their meaning and
application based on the Transfer Function model. This also led to the categorization with the four different
sorts of robustness metrics as presented. The fact that all metrics could unambiguously be placed in one and
only one of the proposed categories indicates a viable categorization.
This study is furthermore deemed to be useful in academia and industry since it comprehensively clarifies the
different facets of quantifying robustness which is especially important to conduct successful and efficient
application of simulation-based and computer-aided design and design optimization. It also supports data-
driven and objective decision making.
4.3. Study 3 – Paper C From the author’s experience in the aviation industry and from project work at Novo Nordisk device R&D - the
main case company of this PhD project - a critical correlation between increasing complexity and robustness
could be seen - especially in terms of contradicting requirements and successive necessary trade-offs.
Designers and lead engineers reported in multiple instances the robustness challenges arising from coupling
and functional integration. This led to the investigation of the influence of coupling, and further, the influence
of contradictions on robustness with a case study at Novo Nordisk to address Research Question 3:
Research Question 3 What is the impact of complexity on robustness?

44 of 71
4.3.1. Publication Title: The Contradiction Index - a new Metric combining System Complexity and Robustness for early
Design Stages
Conference: ASME 2015 International Design Engineering Technical Conferences & Computers and
Information in Engineering Conference, Boston, MA
Citation: Simon Moritz Göhler, and Thomas J. Howard. "The Contradiction Index (CI): A New Metric
Combining System Complexity and Robustness for Early Design Stages." ASME 2015
International Design Engineering Technical Conferences and Computers and Information in
Engineering Conference. American Society of Mechanical Engineers, 2015.
4.3.2. Summary of results With the integration of ever more functionality in (mechanical) products, the risk of functional coupling and
contradicting requirements rises making trade-offs necessary. This kind of complexity can lead to robustness
issues which then again lead to tight tolerances. Small defects and variations can have knock-on effects
throughout the product resulting in failure or non-compliance. The study revealed three different situations of
coupling.
Figure 23: Coupled functional requirements of the kind "nominal-the-best"
Firstly, in the case of two nominal-the-best requirements, the acceptable range of the coupling parameter is
potentially greatly restricted by each of the functions’ upper and lower specification limits, making in most
cases trade-offs necessary (Figure 23). Coupled functions with “nominal-the-best” requirements are therefore
by nature contradicting.
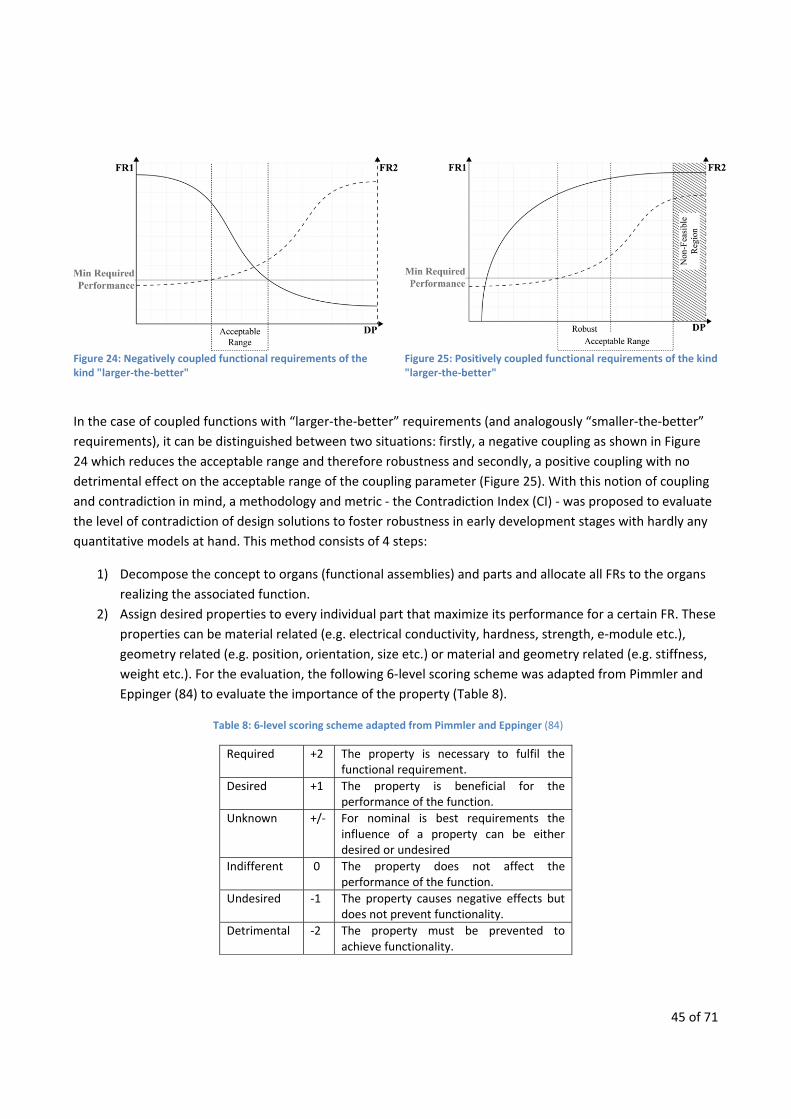
45 of 71
Figure 24: Negatively coupled functional requirements of the kind "larger-the-better"
Figure 25: Positively coupled functional requirements of the kind "larger-the-better"
In the case of coupled functions with “larger-the-better” requirements (and analogously “smaller-the-better”
requirements), it can be distinguished between two situations: firstly, a negative coupling as shown in Figure
24 which reduces the acceptable range and therefore robustness and secondly, a positive coupling with no
detrimental effect on the acceptable range of the coupling parameter (Figure 25). With this notion of coupling
and contradiction in mind, a methodology and metric - the Contradiction Index (CI) - was proposed to evaluate
the level of contradiction of design solutions to foster robustness in early development stages with hardly any
quantitative models at hand. This method consists of 4 steps:
1) Decompose the concept to organs (functional assemblies) and parts and allocate all FRs to the organs
realizing the associated function.
2) Assign desired properties to every individual part that maximize its performance for a certain FR. These
properties can be material related (e.g. electrical conductivity, hardness, strength, e-module etc.),
geometry related (e.g. position, orientation, size etc.) or material and geometry related (e.g. stiffness,
weight etc.). For the evaluation, the following 6-level scoring scheme was adapted from Pimmler and
Eppinger (84) to evaluate the importance of the property (Table 8).
Table 8: 6-level scoring scheme adapted from Pimmler and Eppinger (84)
Required +2 The property is necessary to fulfil the functional requirement.
Desired +1 The property is beneficial for the performance of the function.
Unknown +/- For nominal is best requirements the influence of a property can be either desired or undesired
Indifferent 0 The property does not affect the performance of the function.
Undesired -1 The property causes negative effects but does not prevent functionality.
Detrimental -2 The property must be prevented to achieve functionality.

46 of 71
3) Estimate the number and nature of design parameters of a part towards a FR.
4) Evaluate the contradiction index on part and FR level.
max | 0 min | 0
.
A case study with the FlexTouch®, one of Novo Nordisk’s insulin injection devices, was conducted to test the
“Contradiction Index” and the hypotheses regarding conflicting couplings and robustness. As measures for
design complexity and robustness, the number of design iterations and challenging tolerances for the individual
parts was investigated, respectively. The analyses showed a positive correlation between the number of part
design iterations and the CI (Figure 26) and a statistically significant correlation between the number of
demanding tolerances and the CI (Figure 27).
Figure 26: No. of Part Design Iterations vs Part CI Figure 27: No. of demanding Tolerances vs Part CI
4.3.3. Discussion and reflection In this study, the implications of functional coupling in general and negative coupling (contradiction) in
particular are discussed on a theoretical basis and then investigated in a case study. The case study showed
that the level of functional contradiction that can be measured already in early design stages has an effect on
design difficulty and robustness of the final product. These are promising results. However, different aspects
can be challenged and discussed: firstly, whether coupling in general and contradiction in particular are good
measures for complexity. In the literature, different ways to quantify complexity are used. Those can be
categorized in metrics that describe the information content, metrics that describe the coupling and
interconnectivity and metrics that describe the solvability of the problem (53). The CI is a derivative and special
case of coupling as a metric for complexity and therefore seen to be in line with the common understanding of
complexity. The second aspect worth discussing is the use of number of part design iterations and challenging
tolerances as measure for robustness in the case study. While the number of part design iterations can also be
a measure of general design difficulty, the number of challenging tolerances is in the author’s opinion a good
indicator for robustness. Tolerances are set to control the ingoing variation to the final assembled product. The

47 of 71
widths of the tolerance windows are a direct consequence of the robustness of the design and reflect the size
of the feasible design space as discussed in study 2. The results of the case study show a clear correlation
between the CI and the number of challenging tolerances. Tolerances are defined relatively late in the
development process whereas contradictions in many cases can already be found in the conceptual design
phase. This gives good potentials to use the CI as an early predictor and proxy to estimate robustness. The
proposed methodology, furthermore, helps increasing the functional understanding of the design solution,
which can be altered depending on the results and the judgment of whether critical functions should be
uncoupled. However, the described case study is only a single data point finding these correlations and needs
further studies to back-up the claims discussed.
4.3.4. Study evaluation Following the validation square approach by Pedersen (51) as discussed in chapter 3, the study and its results
can be evaluated by discussing the subsequent four points:
1. Theoretical structural validity: is the general theory behind the support accepted and is the support consistent?
As discussed in the associated article and the preceding section, the consistency and acceptance of the theory as well as the CI have been ensured. 2. Empirical structural validity: appropriateness of example case to show that support is useful. The Novo Nordisk FlexTouch® insulin injection pen was chosen for the chase study consisting of “enough” functions and complexity (coupling) to conduct the analyses whilst not being over-complicated. Generally, the authors judge the example as appropriate. 3. Empirical performance validity: measuring the usefulness of the results from applying the support. The correlational model associating the CI with the number of challenging tolerances gives a clear indication of the performance and potential of the proposed metric. As discussed before, this study nevertheless needs follow-up studies to confirm the findings.
4. Theoretical performance validity: evaluation of the generalizability of the usefulness of the support
from the empirical case study. Based on the comprehensive theoretical background and rational presented in the paper, the authors are confident in the generalizability of the method. This was further confirmed by the acceptance of the method by the designers and engineers at Novo Nordisk.
4.4. Study 4 – Paper D Study 4 is a continuation and follow-up of the previous study to investigate the relation between complexity
and robustness (Research Question 3). Study 3 was built upon a qualitative evaluation of contradiction and
comprised only a single case study limiting the generalizability of the results. This follow-up study uses a
model-based approach to investigate the association between complexity and robustness in a population of
complex systems.
Research Question 3 What is the impact of complexity on robustness?

48 of 71
4.4.1. Publication Title: A model-based approach to associate complexity and robustness in engineering systems
Journal: Research in Engineering Design
Citation: Simon Moritz Göhler, Daniel D. Frey, and Thomas J. Howard. "A model-based approach to
associate complexity and robustness in engineering systems." Research in Engineering Design
(2016): 1-12.
4.4.2. Summary of results For this study, the hierarchical probability model (HPM) by Frey and Li (85) was adapted and extended to
model complex systems. The model builds upon three characteristics and regularities of systems that have
been observed in empirical studies of real-word systems.
1. Sparsity of effects:
There are usually only a small number of factors or parameters in systems that are actually influencing
the performance of the functions.
2. Hierarchy:
Main effects are typically stronger than second-order interactions which are usually larger than third-
order interactions and so on.
3. Inheritance:
Interaction effects are more likely to be active if the interacting parameters’ main effects are active.
The system model consists of l third-order polynomial equations representing the l functions of the system. The
performance y is a function of the n influencing parameters xi and their interactions up to third order.
, , … , ∈ 1…
The coefficients β describe the strengths of the individual main effects and interactions on the function. They
are derived following probabilities as seen in real-word systems concurring to the three characteristics
mentioned above. To evaluate the robustness of a system, the system common range (yield, i.e. fulfilling all
functional requirements simultaneously) was calculated from a Monte-Carlo simulation of 106 runs with
uniformly distributed variation of 10% around the nominal of the influencing parameters.
250 systems were simulated with this model and the robustness evaluated. Furthermore, the number of
couplings and the degree of contradiction were assessed to investigate associations between robustness and
coupling as well as contradiction.
The analysis of the data shows no correlation between the normalized yield (robustness) and the number of
couplings (Figure 28 shows a scatter plot). With p values of 0.13 and 0.11, the Pearson’s and Spearman’s tests

49 of 71
suggest independence between the two. However, as can be seen from the scatter plot in Figure 29 there is
strong correlation between the yield, i.e. robustness of the system, and the degree of contradiction. A linear
least square fit with its 95% confidence bounds has been added to the plot.
∙
0.50
64.08
The association is statistically significant (p = 1.4e-36). This also confirmed by the Pearson’s and Spearman’s
test.
Figure 28: Scatter plot of normalized yield against no. of couplings

50 of 71
Figure 29: Association between normalized yield and contradiction
4.4.3. Discussion and reflection To the authors’ knowledge, the presented study is the first attempt to relate robustness and complexity
quantitatively using a model-based probabilistic approach. As in the previous study, complexity was
interpreted as the degree of coupling and interconnectivity following Summers and Shah (53). In contrast, Nam
Suh, the author of the Axiomatic Design theory which is prevailing in this research area, defines complexity as
“a measure of uncertainty […] in achieving a functional requirement” (86). This is synonymous with the
information content defined in Axiom 2 which is derived from the probability that the design and system range
overlap. This definition of complexity is in itself closely related to measures of reliability (i.e. the probability
that a product fails) as well as the probability of functional compliance robustness metrics as discussed in Paper
B. Suh limits complexity to the functional domain. However, even though Suh does not consider coupling as a
measure for complexity, Axiom 1 – the independence axiom – addresses it. With respect to robustness, Suh
showed that un- and de-coupled designs are inherently more robust than coupled designs for nominal-the-best
requirements (29) p.124 ff. In this contribution, coupling was further specified with the notion of contradiction
as defined in this study. It was found that for smaller/larger-the-better requirements it is actually not the
degree of coupling but the degree of contradiction that is the main complexity related driver for non-
robustness. This extends and differentiates the acknowledged view on coupling and robustness provided by
Suh’s Axiomatic Design (29). The knowledge about coupling and contradiction has some interesting and useful
implications for the evaluation of the design solution especially in conceptual and early design. Assessments of
the level of contradictions of design concepts give clues about the robustness of the final product. This insight
can be used for concept selection, prioritization and focus of development efforts and resources as well as to
assess the risk for non-robustness.

51 of 71
The results of this study confirm observations and results from the robustness and reliability analyses of
complex products that report that even though some products are highly integrated (coupled) and therefore
complex, they can be extraordinary robust and reliable (87). The maturity and evolution of those products are
mentioned as the main driver for that. Linking these results to the results of the research at hand, a possible
relation is that mature technical systems have undergone many design iterations where contradictions have
been designed out and positive couplings have been more and more utilized.
In summary, this study has shown that complexity has a large influence on the robustness to variation of a
product. However, the perception of robustness is slightly different than in the classical case where robustness
is related to the functional performance being insensitive to variation. Complexity adds the dimension of
specification limits which reduces the size of the design space as another limiting factor to how much variation
is allowed. Suh (29) showed that this is generally true for coupled functions with nominal-the-best
requirements. In this contribution, we showed that for smaller-the-better and larger-the-better requirements
the level of contradiction determines the robustness together with the individual sensitivities of the functions.
This study contributed with new insights to answer the research question regarding the influence of complexity
on robustness.
4.4.4. Study evaluation The systems model used for this study was derived from the hierarchical probability model by Frey & Li (85)
which builds upon empirical data for real-world engineering systems. The characteristics of the model
therefore reflect the ones of systems observed in reality. Prevalent theories regarding “sparsity of effects”,
“hierarchy” and “inheritance” were followed. Due to the prescribed and stringent model structure, consistency
is ensured.
4.5. Study 5 – Paper E In practice, Robust Design but also variation management including tolerancing is often limited to individual,
single functions and parts, respectively. Comprehensive and product spanning efforts are especially difficult in
multi-disciplinary development projects of complex products. In this study, a sensible and comprehensible way
to decompose a complex product from its functional requirements to the design parameters was investigated
to address Research Question 4:
Research Question 4 How can functional requirements efficiently be decomposed to support robustness and tolerance management of complex products?

52 of 71
4.5.1. Publication Title: The Translation between Functional Requirements and Design Parameters for Robust Design
Conference: 14th CIRP Conference on Computer Aided Tolerancing (CAT)
Citation: Simon Moritz Göhler, Stephan Husung, and Thomas J. Howard. "The Translation between
Functional Requirements and Design Parameters for Robust Design." Procedia CIRP 43 (2016):
106-111.
4.5.2. Summary of results In the study, the practical aim was to address the lack of transparency and traceability of tolerances in complex
and multi-disciplinary products. For this, a sensible decomposition of functional requirements (FR) to design
parameters (DP) was proposed. Especially in cases where the functional requirements are of high abstraction
level, relating those to the single design parameters can be extremely complicated, cumbersome and tedious.
Figure 30: Mapping between FR and DP (left) and generic P-Diagram (right)
The top speed of a car, for example, depends on uncountable parameters. For efficient tolerancing and
variation management, however, a thorough functional understanding and decomposition is necessary. A
decomposition of functional requirements (FR) through sub-functional requirements (SFR) all the way to design
parameters was proposed based on different sources of variation structured according to the P-Diagram
(Figure 30). This yielded different levels of abstraction to describe a functional requirement top-down or
bottom-up. Table 9 summarizes the 6 levels of sub-functional requirements. Level 1 to 3 relate solely to control
factors including geometrical and material related properties. For level 4 and 5 sub-functional requirements,
use and time are added as influencing parameters, respectively. Finally, level 6 consists of emerging functional
requirements that combine level 1 to 5. The example case of a glue gun was used to demonstrate the strengths
of the proposed decomposition. By posing requirements on the highest SFR level possible, no unnecessary
constraints are introduced restricting the development process downstream. This enables an efficient
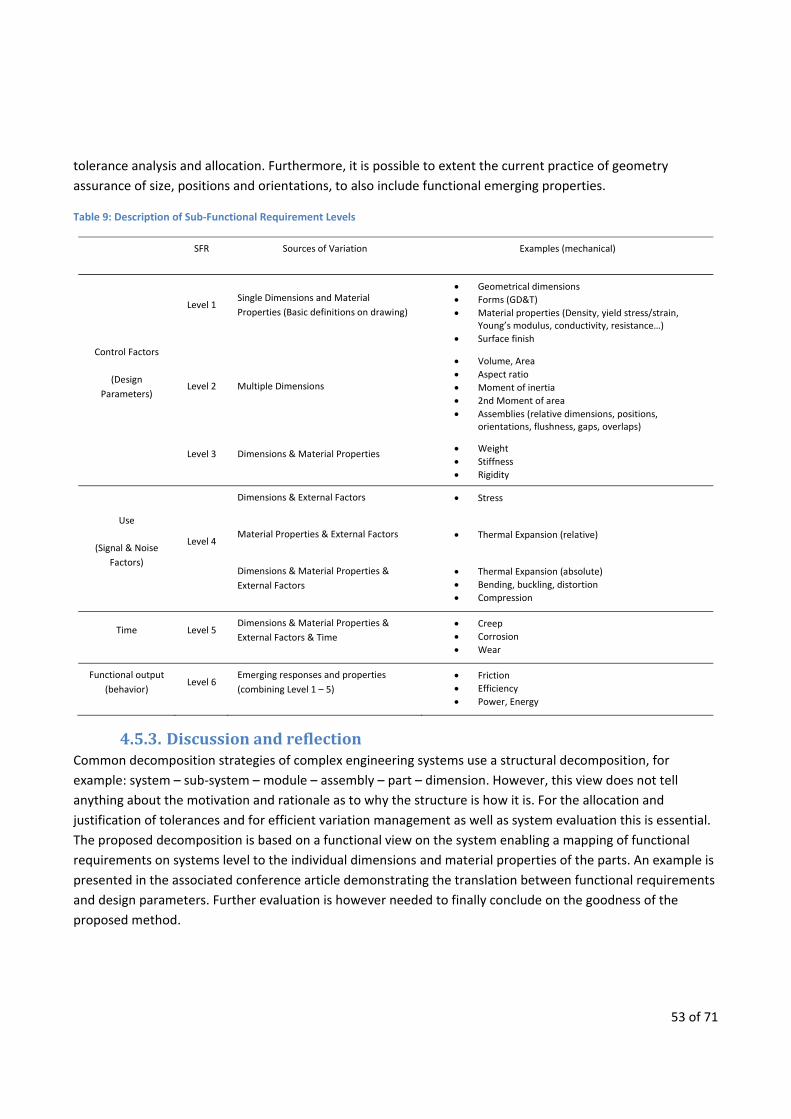
53 of 71
tolerance analysis and allocation. Furthermore, it is possible to extent the current practice of geometry
assurance of size, positions and orientations, to also include functional emerging properties.
Table 9: Description of Sub-Functional Requirement Levels
SFR Sources of Variation Examples (mechanical)
Control Factors
(Design
Parameters)
Level 1 Single Dimensions and Material
Properties (Basic definitions on drawing)
Geometrical dimensions
Forms (GD&T)
Material properties (Density, yield stress/strain, Young’s modulus, conductivity, resistance…)
Surface finish
Level 2 Multiple Dimensions
Volume, Area
Aspect ratio
Moment of inertia
2nd Moment of area
Assemblies (relative dimensions, positions, orientations, flushness, gaps, overlaps)
Level 3 Dimensions & Material Properties Weight
Stiffness
Rigidity
Use
(Signal & Noise
Factors)
Level 4
Dimensions & External Factors Stress
Material Properties & External Factors Thermal Expansion (relative)
Dimensions & Material Properties &
External Factors
Thermal Expansion (absolute)
Bending, buckling, distortion
Compression
Time Level 5 Dimensions & Material Properties &
External Factors & Time
Creep
Corrosion
Wear
Functional output
(behavior) Level 6
Emerging responses and properties
(combining Level 1 – 5)
Friction
Efficiency
Power, Energy
4.5.3. Discussion and reflection Common decomposition strategies of complex engineering systems use a structural decomposition, for
example: system – sub-system – module – assembly – part – dimension. However, this view does not tell
anything about the motivation and rationale as to why the structure is how it is. For the allocation and
justification of tolerances and for efficient variation management as well as system evaluation this is essential.
The proposed decomposition is based on a functional view on the system enabling a mapping of functional
requirements on systems level to the individual dimensions and material properties of the parts. An example is
presented in the associated conference article demonstrating the translation between functional requirements
and design parameters. Further evaluation is however needed to finally conclude on the goodness of the
proposed method.

54 of 71
In the wider sense, this decomposition can furthermore support the mapping of complex products to increase
the functional understanding, also with respect to how changes or variation propagates through the product
and which parameters might be coupled. It enables a holistic view on trade-offs, variation and robust design on
systems level. This contribution therefore lays the basis for an efficient variation management and answers
Research Question 4.
4.5.4. Study evaluation The novel approach to map between functional requirements and design parameters proposed in this study is
built upon deductive reasoning from a functional view on the engineering system. Consistency in the method
and theory were ensured by structuring the decomposition by sources of variation following the commonly
used P-diagram. In that way, internal conflicts in the theory were avoided. Furthermore, the authors are
confident that any product and engineering system can be decomposed in that way. The proposed
decomposition was applied to an example case. However, as mentioned before, further testing and
development is needed.
4.6. Study 6 – Paper F Informal conversations with industry partners and experience from project work hinted that although Robust
Design and Systems Engineering are recognized and applied, variation related issues nevertheless are
experienced especially in complex products. Silo thinking (i.e. insufficient collaboration and sharing of
information between departments and disciplines), unquantified decision making and the uncertainty of the
impact of change and variation in complex products are often named as causes leading to non-optimal designs
and non-robust products. With the managerial push for “right first time” development and the associated
enhanced virtual validation and verification, the holistic understanding of the product and how variation
influences the functions has become even more important. All insights from the preceding studies of this PhD
project have been combined to address Research Question 5:
Research Question 5 How can a holistic and coherent metric-driven Robust Design be supported throughout the development of complex products and systems?
4.6.1. Publication Title: The Variation Management Framework (VMF) Tool for Robust Design
Journal: Journal of Engineering Design
Status: Submitted and in review
4.6.2. Summary of results In this paper, a comprehensive study is presented investigating and addressing problems related to Robust
Design and variation management for complex products. Firstly, a survey was conducted among Robust Design
practitioners from industry at the Robust Design Day 2016 asking them to judge the severity of the issues
postulated in the introduction of this section. It showed that between 55 and 70% of the delegates “agreed” or
55 of 71
“strongly agreed” with the statements confirming the authors’ experiences. The question arose of how the
aforementioned problems can be addressed and Robust Design of complex products be supported.
Based on the results from the preceding studies of this PhD research project the following 5 requirements
towards a tool were formulated. The tool would need to…
1. …have a holistic approach to include marketing and production considerations to Robust Design to
address issues related to silo-thinking.
2. …support a Key Characteristic approach to ensure applicability.
3. …support various fidelities of Transfer Function models including qualitative as well as linear and non-
linear quantitative models to support type II Robust Design (63).
4. …exploit structural (complexity related) information to capture interaction related robustness issues
arising from coupling (29) as well as trade-offs and contradictions (8,88) to support Robust Design from
conceptual design onwards.
5. …enable and supply metrics like sensitivities (89), functional variance (64,89), size of design space (64),
and yield rates (64) to monitor and prioritize efforts and make quantified, objective decision for metric-
driven Robust Design.
Various tools and strategies to support Robust Design and variation management exist and were reviewed with
respect to the 5 requirements listed above. However, even though they are very useful in various situations in
the development process, none of them support Robust Design in a holistic and metric-driven way from the
initial to the final design including structural and functional information. Based on the Variation Management
Framework with its holistic approach to variation including marketing, design and production a tool was
developed to comprehensively capture, process and present information and models of different fidelities to
support metric-driven Robust Design. The VMF Tool is based upon an object-relational database linking market,
functional, design and process parameters. This allows capitalizing on structural and functional information to
evaluate the robustness of a design as described in studies 2, 3 and 4 of this research. Figure 31 shows the
structure of the proposed VMF Tool. Different visualizations and presentations of the data in matrix or graph
form are offered to enhance the functional understanding of the engineers.

56 of 71
Figure 31: Holistic Variation Management Tool
Two case studies were conducted to test and evaluate the VMF Tool. The first one was run in a workshop
format at the Robust Design Day 2016. It aimed to broadly evaluate the tool and its ability to address the issues
around “silo-thinking”, “unquantified decision making”, “uncertainty of impact of change and variation” as well
as “non-optimal designs and trade-offs” as outlined in the opening of this section. Five tasks were completed
related to scenarios in detailed design and production and the participants asked in a survey to rate the
suitability of the VMF Tool to solve above mentioned issues. 78% of the 40 responses that were returned
“agreed” or “strongly agreed” that the VMF Tool could be a solution.
The second case study was an in-depth study of a sensor development for a medical device measuring a
patient’s levels of different parameters in the blood. From interviews and practice it became clear that due to
the complexity of the product no one person had a comprehensive overview nor was there a central repository
for the information leading to inefficient design iterations with potentially unwanted effects. More than 400
functional, design and process parameters were identified and mapped in the VMF Tool. In most cases,
relationship and influences were known but not quantified. The strength of the VMF Tool is that it integrates
the different fidelities of information. Figure 32 shows a matrix-view of the mapping of the sensor visualizing
relations with “X”, positive and negative influences with a “+” and a “-“, respectively and the Nominal-range
sensitivity (NRS) as relative measure for the propagation of variation (64).

57 of 71
An experiment with four engineers testing the usefulness and applicability of the VMF Tool showed an
increased understanding of the product and a faster and more complete identification of influencing
parameters to a function from a patchwork of analysis results compared to their current method of using
spreadsheets. Positive feedback was also given to the ability of the tool to communicate between team
members from different departments and backgrounds.
Figure 32: VMF Tool sensitivity view
4.6.3. Discussion and reflection This study sought to investigate how holistic and coherent metric-driven Robust Design can be supported for
complex products. The VMF Tool proposed in this contribution is an attempt to assist Robust Design by
capturing, processing and presenting the data and information from a patchwork of analyses and expertise.
The strength of the tool lies within the integration and conflation of all available information to all members of
the development team. The holistic understanding of the product and the influence of variation propagating
through the production, design and marketing domain is seen as key to “right first time” development of
robust designs.
The tool enables the enhanced utilization of robustness metrics and indicators to increase the efficiency of
variation management and Robust Design. It provides thereby also a quantifiable and objective basis for design
decisions as well as for analysis and resource allocation. However, the filling and maintaining of the VMF Tool
adds an additional step to the development process. The question arises when the extra effort pays off. A cost-
benefit analysis as for other variation management initiatives is necessary. Generally, the level of complexity of
the product and the criticality of robustness for manufacturing and for quality in the market have to be
considered. It needs to be noted that the insight attained from the tool is dependent on and only as good as
the information that is put in.
4.6.4. Study evaluation The tool proposed in this study is based upon the body of knowledge of Robust Design and variation
management. The theory is therefore established and consistent. Two case studies were run to test the
applicability and usefulness of the tool in practice.

58 of 71
The first one was conducted in the form of a Robust Design workshop with specialist participants from industry
who evaluated the VMF Tool positively in a survey following the workshop. Although the group of delegates
was not representative, the results still indicate a good potential of the tool. The second case study showed the
applicability and usefulness of the tool in the development of a complex product.
Even though only tested in these two case studies, the authors are confident that the usefulness of the tool
would also be apparent in other applications. However, further testing and development of the tool itself and
the software demonstrator including the improvement of the user interface are necessary.
4.7. Hypothesis testing Two hypotheses were formulated in the opening of this PhD project, namely:
Hypotheses A) The structural complexity of an engineering system has a significant influence on its conceptual
robustness against variation. B) A holistic and quantitative approach based on robustness AND complexity considerations can improve
the functional understanding and support metric-driven Robust Design of complex engineering systems.
In the following, the hypotheses are tested utilizing the findings from this PhD research as presented and
discussed in the preceding sections.
As the results from studies 3 and 4 showed, the structural complexity of an engineering system has an
influence on its robustness to variation. It was shown that for smaller-the-better and larger-the-better
requirements, a higher degree of contradiction related to a reduced robustness. Together with the results from
Nam P. Suh who showed that for nominal-the-best requirements coupling in general results in a lower
robustness, it can be concluded that hypothesis A can be accepted.
With respect to hypothesis B, studies 1 and 2 laid out the procedural and metric-related basis to develop the
approach and tool proposed and tested in studies 5 and 6. The initial evaluation of the tool indicated a positive
effect and good potential. Therefore, hypothesis B is considered to be tentatively accepted. However, further
development and testing is required to fully accept it.
4.8. Evaluation of the research In the following, it will first be laid out how the research fits in the existing body of knowledge thereafter
further reflections will be given on how the research has been conducted as well as on its validity and
usefulness.
4.8.1. Evaluation relative to the existing body of knowledge In this PhD research project, the quantification of robustness and the associated support of Robust Design
throughout the development and production stages have been investigated. A special focus was put on the

59 of 71
influence of complexity, i.e. coupling and contradiction, to enable earlier predictions of robustness. Various
researchers have worked on this topic more or less explicitly. Some of the greatest contributions were made by
Nam P. Suh (29) who proposed two design axioms, namely the Independence and the Information Axiom,
emphasizing the importance of designing functionally superior products and systems to not only reduce
complexity but also increase robustness. He writes that (30) (real) complexity arises from many different
reasons:
1. Coupling of FRs
2. Decrease in the allowable tolerance due to the presence of coupling terms
3. Lack of robustness (i.e., too large “stiffness” of the design matrix)
4. Wrong choice of DPs
5. Wrong decomposition of FRs and DPs
The results of the research at hand augment and extend these insights. Where Axiomatic Design is seen as a
more abstract and higher level design paradigm, we combined and related it to quantitative methods as for
example used in the Taguchi method (18), Robust Design Optimization (20) and generic sensitivity analyses
(89). Also qualitative measures were considered benefitting from research done by Ebro (12). An application-
driven research and approach to variation management was conducted by Thornton (31) and Dantan et al.
(33), who utilized key characteristics identification and problem decomposition to reduce the intricacy of the
problem and risk assessment, and mitigation to address it. The work at hand is seen as an extension to their
frameworks in that way that the variation management is not only limited to the realm of geometry insurance
and tolerances but supports metric-driven Robust Design.
In summary, the results of this research are in line with and extend the current body of knowledge. The core
contributions of this research will be further discussed in the succeeding conclusion chapter.
4.8.2. Research verification and validation The verification of this research is done by reflecting on the criteria completeness, coherence and consistency
(52):
Completeness: As laid out in the preceding sections, all research questions guiding this research were
answered and the hypotheses tested. Various methods were used to investigate the topic of
quantifying robustness from different angles including the review of literature, archival
analysis, case studies, system modeling and deductive reasoning to propose new solutions and
approaches. Through this manifold investigation, we are confident that the field was
thoroughly covered and researched, both in the academic and industrial sense.
Coherence: The studies contained in this PhD research project were carefully chosen and organized led by
the research questions and hypotheses. Studies 1 and 2 investigated the procedural placement
of robustness quantification in Robust Design and the different ways to quantify and define
robustness, respectively. With that knowledge and the insights from studies 3 and 4 regarding

60 of 71
the influence of complexity on robustness, the approach and tool as described and tested in
studies 5 and 6 were developed.
Consistency: The methods and approaches proposed in this research are in themselves consistent and do
not conflict with each other. Also, the knowledge and insights generated are consistent with
current body of knowledge as discussed in the previous section.
The validity of the knowledge claims and results of this research were ensured by the rigorous use of a research
methodology and triangulation using different sources and methods including the review of and comparison
with the current body of knowledge. Furthermore, the usability, applicability and usefulness of the research
results were discussed to validate the results as proposed by Blessing and Chakrabarti (40).
4.8.3. Limitations The research presented in this thesis was conducted with a background and training in aerospace and
mechanical engineering and at the Department of Mechanical Engineering at the Technical University of
Denmark. With this in mind, the results and insights are limited to mechanical products and mechanical
engineering systems. However, it is thought that many of the aspects coming from and discussed in this
research are applicable also in other fields of engineering like electrical, chemical and software engineering.
From the content point of view, the process on how to generate and fill-in the data to the VMF as well as the
procedural interactions with generic product development processes in practice were not entirely included in
this research and need further investigation. Also, incomplete data and uncertainty as factors in robustness
quantification and variation management require further research.
Another limitation is that the proposed methods and approaches have only undergone an initial evaluation
with single case studies as discussed by Blessing and Chakrabarti for the Descriptive Study II (40). Further
research and testing on the usability, applicability and usefulness are necessary to ensure generalizability. Also
the implementation in industry requires assessment.

61 of 71
5. Conclusion This chapter concludes this PhD thesis and includes a reflection on the research project as a whole. Starting with the presentation of the core contributions in an academic and industrial context the chapter continues with the impact and value of the research. Finally, suggestions for further research are presented and personal concluding remarks are given.
Designing products robust to variation is the key to reduce the cost of quality while still ensuring consistent and
reliable products to the customers’ satisfaction. The robustness evaluation and quantification from the early
design stages onwards plays an essential role in this process enabling metric-driven design decisions and
selections, prioritization of tasks and resources as well as monitoring and optimization of the design solution’s
robustness against variation. However, the analysis and evaluation of complex products and engineering
systems is challenging especially early in the development. This does also apply to the quantification of
robustness, which is a prerequisite for an efficient metric-driven Robust Design as well as for variation
management.
In this PhD research project, the quantification of robustness has been studied from different angles. Among
others, the different metrics and facets of robustness were researched and the influence of a design’s
complexity on the product’s robustness investigated. It could be shown that the complexity of a design,
manifested in the degree of coupling and contradiction, in fact has an impact on the robustness which allows
robustness estimations already on conceptual level. Successively, the VMF tool was developed to
comprehensively capture, present and analyze structural (complexity related) and functional information to
support a holistic, metric-driven Robust Design and variation management throughout the development
process and in production. The core contributions as well as the impact and value of this research are
summarized in the following.
5.1. Core contributions This research sought to shed light onto the quantification of robustness for complex products and engineering
systems and contributes to the body of knowledge in various ways. The following core contributions have been
made.
Explanation of the mechanisms of Robust Design tools and methods – how do different tools influence
and describe the design solutions they are applied to
Prescription of a Robust Design process
Summary and evaluation of metrics to quantify robustness
Removal of the ambiguity around and clarification of the term robustness – nuances of and differences
in the use of the term robustness
Description of the relationship between robustness and complexity of a product
The Contradiction Index as a method to qualitatively measure the level of contradiction of a design
solution

62 of 71
A method and framework to comprehensively decompose functional requirements to design
parameters
The augmentation and extension of the VMF to an operational tool to capture, communicate and
analyze information to support metric-driven Robust Design for complex products
5.2. Value and impact of the research In the following, the value and impact of this research are discussed from an academic and industrial
perspective. What implications follow from the results and how can the results be applied?
5.2.1. Academic The academic value of this research is seen in the clarification of the impact of complexity, and contradiction in
particular, on the robustness of a complex product. Also, the description of the different facets of robustness
as well as the mechanisms of Robust Design tools contribute to the understanding of Robust Design as well as
robustness analyses and lay the basis for further research and development of methods and processes to
support Robust Design and variation management.
5.2.2. Industrial The industrial value and application of the results of this research are manifold. With the description of the
mechanisms of Robust Design tools and methods and their categorization, it is possible to establish an
organized and company specific Robust Design toolbox to ease the introduction and application of the methods
and tools. This is furthermore supported by the proposed Robust Design process linking the tools to the
individual activities of the engineers. Generally, the contributions made to the understanding of Robust Design
and robustness metrics in particular have the potential to ease the communication and uptake of Robust
Design in industry. With the removal of the ambiguity around the term robustness, the formal integration of
robustness target to specification and requirements documents is conceivable.
Another value is seen in the Contradiction Index and the insights from the studies regarding complexity and
robustness which enables the evaluation of design solutions in early development stages to support the
concept selection. The case company Novo Nordisk continued assessing the contradiction of functions in
further development projects after the case study was completed. It could also be seen that a paradigm shift
occurred to include “function assurance” to the “geometry assurance” at Novo Nordisk.
The case companies also showed great interest in the VFM Tool and the capabilities of the software
demonstrator. A strengthened communication about variation and robustness and a holistic approach to tackle
related problems throughout the development and production of a product is seen as a promising extension to
their product development processes.
5.3. Suggestions for further research A PhD project is a time limited research and cannot follow all interesting and useful leads and ideas that are
worth investigating to the end. While many aspects of robustness quantification for complex products and

63 of 71
systems have been researched and touched upon in this project, different new research questions and ideas
were generated. In the following, a few suggestions for further research in this field are presented.
5.3.1. Process and application of VMF tool In this research, it was shown that the VMF tool offers great potentials to support the metric-driven Robust
Design capitalizing on structural (complexity related) and functional information about the design solution. For
the successful implementation, further research on the process on how to apply the VMF Tool as well as
supporting case studies are required. Furthermore, the way to deal with incomplete data and uncertainty
(aleatory and epistemic) plays an essential role for a full-fetched application of the tool in industry and needs
investigation.
5.3.2. Further development of VMF software tool In study 6, a software demonstrator for the VMF Tool was presented. Especially the scalability and automation
potentials of a software solution make the tool interesting and applicable in an industrial context. However,
further development of the software is necessary to include more features and improve the user interface. The
integration to commonly used PLM systems with links to the individual analysis software can be of further
benefit.
5.3.3. Variation management process With increasing level of customization and complexity of products but also decentralized organization and
global competition, an efficient variation management becomes necessary. The experiences from the research
showed that the cooperation and communication regarding targets, specification limits and priorities across
the departments of marketing, design, production and aftersales have great potentials for improvements.
Often, competing KPIs (Key Performance Indicators) for the different departments hinder an efficient variation
management. Research into the process on how to coordinate across the different departments to gather and
utilize the available information in the most efficient way is seen as a great opportunity to support holistic and
data-driven decision making. Initial ideas have been discussed and presented by Howard et al (32); however, a
detailed description and prescription for a successful implementation is missing.
5.3.4. Integration of Robust Design and reliability engineering Reliability engineering and design for reliability have a strong tradition especially in the aviation and
automotive industry. However, the capabilities and opportunities of Robust Design with all its methods and
tools have so far not really been utilized. A suggestion for further research is to investigate into the integration
of Robust Design and Reliability engineering but also to find potential synergies between the two. Robustness
against time and usage induced variations that result in performance degradation as well as failure is an
essential goal for the design of the product.
5.3.5. Economical perspective on variation management As an extension to the suggested research on a holistic variation management approach and process,
investigations into the economical dimension of the problem would be highly relevant. Cost-benefit analyses
between the different levers (32) to approach variation in marketing, design and production are especially

64 of 71
interesting. The selection of the customer target group and the outsourcing of production can for example
have a tremendous impact on how to allocate and evaluate efforts and resources.
5.4. Concluding remarks This PhD project has been an exciting endeavor with many challenges and joys led by curiosity and the striving
for learning new things. It gave me a great opportunity to dive deep into the material of Robust Design,
Reliability Engineering and Quality Engineering in general. The project featured an interesting variety of case
companies and other side projects alongside the actual PhD project from small start -up companies to global
players in the shipping, oil and gas as well as the medical industry.
On a personal note, with hindsight to the time as a practitioner of Robust Design in my previous position in the
aviation industry, I only got to appreciate the value of Robust Design to a certain extent. In many cases, Robust
Design is seen as a good practice of engineering design or at the other extreme as complex optimization of
surrogate models. Robustness in its entirety as quality characteristic is oftentimes underestimated. Of course, a
product needs to fulfill its functional requirements, and performance matters a lot, but from a quality point of
view having a robust product and system is in many dimensions the key to high quality products: from an
easier production and predictable performance and looks to a reliable performance and graceful failure.
Besides the professional and academic learning, taking on a PhD project also promotes the personal
development in terms of having a systematic and methodological working approach, self-organization and
motivation, abstract problem solving abilities and presentation as well as writing skills.

65 of 71
References 1. Fuhr T, George K, Pai J. The Business Case for Medical Device Quality The Business Case for Medical
Device Quality. 2013.
2. Mahmood S, Kureshi NI. A Literature Review of the Quantification of Hidden Cost of Poor Quality in the Historical Perspective. J Qual Technol Manag. 2015;XI(I):1–24.
3. Crosby PB. Quality is free: The art of making quality certain. New York: New American Library. 1979. p. 309.
4. Journal TW. Toyota in $1.1 Billion Gas-Pedal Settlement. (2015, Sept. 23) [Internet]. 2012 [cited 2017 Jan 15]. Available from: http://www.wsj.com/articles/SB10001424127887324669104578203440990704994
5. Reynolds RL. The Cost of Variation and a Process to Reduce Variation in the Assembly of Mature Aircraft Designs. Massachusetts Institute of Technology; 1994.
6. Ford RB. Process for the conceptual design of robust mechanical systems: going beyond parameter design to achieve world-class quality. 1996.
7. Maurer MS. Structural Awareness in Complex Product Design. Dissertation. [Munich]: Technical University Munich; 2007.
8. Göhler SM, Frey DD, Howard TJ. A model-based approach to associate complexity and robustness in engineering systems. Res Eng Des. Springer London; 2016;
9. Thornton A. Variation Risk Management Using Modelling and Simulation. J Mech Des. 1999;121(2):297–304.
10. SAE International. Volvo’s Rapid Strategy aims at 20-month vehicle development [Internet]. 2014. Available from: http://articles.sae.org/13621/
11. Haskins C, Forsberg K, Krueger M. Systems engineering handbook. INCOSE Version. 2006;
12. Ebro M. Applying Robust Design in an Industrial Context. Kgs Lyngby; 2015.
13. McPherson C, Radkowski R. Tangible Augmented Reality and Engineering Product Dissection. In: Virtual, Augmented and Mixed Reality VAMR 2016. 2016.
14. Krogstie L, Ebro M, Howard TJ. How to implement and apply robust design: insights from industrial practice. Total Qual Manag Bus Excell. 2014 Jul 23;26(11–12):1–19.
15. Thornton AC, Donnelly S, Ertan B. More than Just Robust Design: Why Product Development Organizations Still Contend with Variation and its Impact on Quality. Vol. 12, Research in Engineering Design. 2000. p. 127–43.
16. Araujo CS, Benedetto-Neto H, Campello AC, SEGRE FM, Wright IC. The Utilization of Product Development Methods: A Survey of UK Industry. Vol. 7, Journal of Engineering Design. 1996. p. 265–77.

66 of 71
17. Arvidsson M, Gremyr I, Johansson P. Use and knowledge of robust design methodology: A survey of Swedish industry. J Eng Des. 2003 Jun;14(2):129–43.
18. Taguchi G, Chowdhury S, Wu Y. Taguchi’s quality engineering handbook. Hoboken, NJ: John Wiley & Sons; 2005.
19. Phadke MS. Quality Engineering using Robust Design. Englewood Cliffs, NJ: Prentice Hall; 1989.
20. Beyer H-G, Sendhoff B. Robust optimization – A comprehensive survey. Comput Methods Appl Mech Eng. 2007 Jul;196(March 2007):3190–218.
21. Chen W, Allen JK, Tsui K-L, Mistree F. A Procedure for Robust Design: Minimizing Variations Caused by Noise Factors and Control Factors. Vol. 118, Journal of Mechanical Design. 1996. p. 478–85.
22. Zang C, Friswell MI, Mottershead JE. A review of robust optimal design and its application in dynamics. Vol. 83, Computers & Structures. 2005. p. 315–26.
23. Matthiassen B. Design for Robustness and Reliability: Improving the Quality Consciousness in Engineering Design. Technical University of Denmark; 1997.
24. Mørup M. Design for Quality. Technical University of Denmark; 1993.
25. Pahl G, Beitz W, Feldhusen J, Grote K-H. Engineering design: a systematic approach. A NASA STI/Recon Technical Report. London, UK: Springer Science & Business Media; 2007.
26. Söderberg R, Lindkvist L, Carlson JS. Managing physical dependencies through location system design. J Eng Des. 2006 Aug;17(4):325–46.
27. Ebro M, Howard TJ, Rasmussen JJ. The foundation for robust design: Enabling robustness through kinematic design and design clarity. In: Proceedings of International Design Conference, DESIGN. 2012. p. 817–26.
28. Ebro M, Howard TJ. Robust design principles for reducing variation in functional performance. J Eng Des. 2016;1–18.
29. Suh NP. Axiomatic Design: Advances and Applications. New York: Oxford University Press; 2001.
30. Suh NP. Complexity in Engineering. CIRP Ann Manuf Technol. 2005;54(2):46–63.
31. Thornton AC. Variation risk management: focusing quality improvements in product development and production. Hoboken, NJ: John Wiley & Sons; 2004.
32. Howard TJ, Eifler T, Pedersen SN, Göhler SM, Boorla SM, Christensen ME. The Variation Management Framework (VMF): A Unifying Graphical Representation of Robust Design. Qual Eng. 2017;
33. Dantan JY, Hassan A, Etienne A, Siadat A, Martin P. Information modeling for variation management during the product and manufacturing process design. Int J Interact Des Manuf. 2008;2(2):107–18.
34. Etienne A, Dantan JY, Qureshi J, Siadat A. Variation management by functional tolerance allocation and manufacturing process selection. Int J Interact Des Manuf. 2008;2(4):207–18.

67 of 71
35. Etienne A, Mirdamadi S, Mohammadi M, Babaeizadeh Malmiry R, Antoine JF, Siadat A, et al. Cost engineering for variation management during the product and process development. Int J Interact Des Manuf. Springer Paris; 2016;1–12.
36. Chakhunashvili A, Johansson P, Bergman B. Variation mode and effect analysis. In: Reliability and Maintainability, 2004 Annual Symposium-RAMS IEEE. 2004. p. 364–9.
37. Johansson P, Chakhunashvili A, Barone S, Bergman B. Variation mode and effect analysis: a practical tool for quality improvement. Qual Reliab Eng Int. 2006;22:865–76.
38. Hauser JR, Clausing DON. The House of Quality. In Harvard Business Review; 1988. p. 63–74.
39. Fowlkes WY, Creveling CM. Engineering Methods for Robust Product Design. Reading, MA: Addison-Wesley; 1995.
40. Blessing L, Chakrabarti A. DRM, a design research methodology. Springer; 2009.
41. Whitney DE. Mechanical Assemblies: Their Design, Manufacture, and Role in Product Development. Advanced Manufacturing. Oxford University Press; 2004.
42. Howard TJ. Novo Nordisk - DTU Robust Design Program [Internet]. 2013. Available from: http://www.robustdesign.mek.dtu.dk/Research1/PhD-projects
43. Simon H. The sciences of the Artificial. The MIT Press; 1996.
44. Van Aken JE. Management research as a design science: Articulating the research products of mode 2 knowledge production in management. Br J Manag. 2005;16(1):19–36.
45. Kothari C, Kumar R, Uusitalo O. Research Methodology. New Age Int. 2014;418.
46. Jørgensen KA. Videnskabelige arbejdsparadigmer. Ålborg Universitet; 1992.
47. Yin RK. Case study research : design and methods. Vol. 5, Applied social research methods series ; SAGE Publications; 2009.
48. Biolchini J, Mian PG, Natali ACC, Travassos GH. Systematic Review in Software Engineering. Vol. 679, System Engineering and Computer Science Department COPPE/UFRJ. 2005.
49. Dillman DA, Smyth JD, Christian LM. Internet, mail, and mixed-mode surveys: The tailored design method. Vol. 3rd ed., Internet Mail and MixedMode Surveys The tailored design method. John Wiley and Sons; 2008. 499 p.
50. Barlas Y, Carpenter S. Philosophical roots of model validation : two paradigms. Syst Dyn Rev. 1990;6(2):148–66.
51. Pedersen K, Bailey R, Allen JK, Mistree F. Validating Design Methods & Research: the Validation Square. ASME Des Eng Tech Conf. 2000;(January):1–12.
52. Buur J. A Theoretical Approach to Mechatronics Design. Technical University of Denmark; 1990.

68 of 71
53. Summers JD, Shah JJ. Mechanical Engineering Design Complexity Metrics: Size, Coupling, and Solvability. Vol. 132, Journal of Mechanical Design. 2010. p. 21004.
54. Howard TJ, Culley SJ, Dekoninck E. Describing the creative design process by the integration of engineering design and cognitive psychology literature. Des Stud. 2008;29(2):160–80.
55. Ulrich KT, Eppinger SD. Product Design and Development. Vol. 5, Mcgraw-Hill Education. 2012. 432 p.
56. Andreasen MM, Hein L. Integrated Product Development. Lundtofte: IPU; 2000.
57. Hubka V, Eder WE. Principles of Engineering Design. London: Butterworth Scientific; 1982.
58. Blanchard BS, Fabrycky WJ. Systems engineering and analysis. Third edition. Other Information: PBD: 1998. 1998. Medium: X; Size: 752 p.
59. Geraci A, Katki F, McMonegal L, Meyer B, Porteous H. IEEE Standard Computer Dictionary. A Compilation of IEEE Standard Computer Glossaries. IEEE Std 610. 1991. 1 p.
60. Holmgren ÅJ. A framework for vulnerability assessment of electric power systems. In: Critical Infrastructure - Reliability and Vulnerability. Berlin Heidelberg: Springer; 2007. p. 31–55.
61. Kitano H. Biological robustness. Nat Rev Genet. 2004;5(November):826–37.
62. Gribble SD. Robustness in complex systems. In: Proceedings Eighth Workshop on Hot Topics in Operating Systems. 2001. p. 17–22.
63. Allen JK, Seepersad C, Choi H, Mistree F. Robust Design for Multiscale and Multidisciplinary Applications. J Mech Des. 2006;128(July 2006):832–43.
64. Göhler SM, Eifler T, Howard TJ. Robustness Metrics: Consolidating the Multiple Approaches to Quantify Robustness. J Mech Des. 2016;(November).
65. Tata MM, Thornton AC. Process capability database usage in industry: myth vs. reality. Des Manuf Conf ASME Des Techical Conf. 1999;1–17.
66. Wu Y, Wu A. Taguchi methods for robust design. New York: American Society of Mechanical Engineers; 2000.
67. Yang G. Reliability Improvement Through Robust Design. In: Life Cycle Reliability Engineering. 2007. p. 122–93.
68. Thornton a. A Mathematical Framework for the Key Characteristic Process. Res Eng Des. 1999;11:145–57.
69. Browning TR. Process Integration Using the Design Structure Matrix. J Syst Eng. 2002;5(3):180–93.
70. Incose. The Guide to the Systems Engineering Body of Knowledge ( SEBoK ). Insight. 2011;
71. Magee CL, de Weck OL. Complex System Classification. Incose. 2004;18.
72. Elmaraghy W, Elmaraghy H, Tomiyama T, Monostori L. Complexity in engineering design and
69 of 71
manufacturing. CIRP Ann - Manuf Technol. CIRP; 2012;61(2):793–814.
73. Eifler T. Modellgestützte Methodik zur systematischen Analyse von Unserheit im Lebenslauf technischer Systems. Technical University Darmstadt; 2014.
74. Eppinger SD, Browning TR. Design structure matrix methods and applications. Vol. 1. Cambridge, MA: The MIT Press; 2012. 334 p.
75. Steward D V. The design structure system: A method for managing the design of complex systems. IEEE Trans Eng Manag. 1981;EM-28(3):71–4.
76. Browning TR. Applying the design structure matrix to system decomposition and\nintegration problems: a review and new directions. IEEE Trans Eng Manag. 2001;48(3):292–306.
77. Antony J. Design of Experiments for Engineers and Scientists. International Journal of Engineering. 2003. 152 p.
78. Shainin D, Shainin P. Better than Taguchi orthogonal tables. Qual Reliab Eng Int. 1988;4(2):143–9.
79. Box GEP, Hunter JS. Multi-Factor Experimental Designs for Exploring Response Surfaces. Vol. 28, The Annals of Mathematical Statistics. 1957. p. 195–241.
80. Box GEP, Meyer RD. An analysis for unreplicated fractional factorials. Vol. 28, Technometrics. 1986. p. 11.
81. Box GEP, Wilson KB. On the Experimental Attainment of Optimum Conditions. J R Stat Soc. 1951;13(1959):1–45.
82. Weber C. Modelling products and product development based on characteristics and properties. An Anthol Theor Model Des [Internet]. 2014;(2007):327–52. Available from: http://link.springer.com/10.1007/978-1-4471-6338-1
83. Fazl Mashhadi A, Alänge S, Roos L-U. Introducing robust design in product development: Learning from an initiative at Volvo. Total Quality Management & Business Excellence. 2012. p. 1–15.
84. Pimmler TU, Eppinger SD. Integration analysis of product decompositions. ASME Des Theory Methodol Conf. 1994;(September):1–10.
85. Frey DD, Li X. Using hierarchical probability models to evaluate robust parameter design methods. J Qual Technol. 2008;40(1):59–77.
86. Suh NP. Complexity: Theory and Applications. Oxford: Oxford University Press; 2005. 312 p.
87. Frey D, Palladino J, Sullivan J, Atherton M. Part count and design of robust systems. Syst Eng. 2007;10(3):203–21.
88. Göhler SM, Howard TJ. The Contradiction Index: a new Metric combining System Complexity and Robustness for early Design Stages. In: Proceedings of the ASME 2015 International Design Engineering Technical Conferences & Computers and Information in Engineering Conference. 2015. p. 1–10.

70 of 71
89. Saltelli A, Ratto M, Andres T, Campolongo F, Cariboni J, Gatelli D, et al. Global Sensitivity Analysis: The Primer. Global Sensitivity Analysis. The Primer. Chichester, UK: John Wiley & Sons; 2008.

71 of 71
Appended Papers
Paper A
Mechanisms and coherences of robust design methodology: a robust design process proposal
Paper B
Robustness Metrics: Consolidating the Multiple Approaches to Quantify Robustness
Paper C
The Contradiction Index: a new Metric combining System Complexity and Robustness for early Design Stages
Paper D
A model-based approach to associate complexity and robustness in engineering systems
Paper E
The Translation between Functional Requirements and Design Parameters for Robust Design
Paper F
The Variation Management Framework (VMF) Tool for Robust Design


Mechanisms and coherences of robust design methodology: a robustdesign process proposal
Simon Moritz Gohlera∗, Martin Ebroa,b and Thomas J. Howarda
aDepartment of Mechanical Engineering, Technical University of Denmark, Kgs. Lyngby,Denmark; bValcon A/S, Hoersholm, Denmark
Although robust design (RD) methods are recognised as a way of developingmechanical products with consistent and predictable performance and quality, theydo not experience widespread success in industry. One reason being the lack of acoherent RD process (RDP). In this contribution we analyse commonly used RDmethods to identify their mechanisms and coherences and propose a RDP that isconnected to the actual design tasks of the design engineer. The presented RDPcomprises four main activities: (1) design and modification of the conceptual designsolution, (2) measuring and modelling the robustness of the design, (3) processingand evaluation of the robustness data and (4) scaling of the design to optimiseparameter and tolerance values. For each of the activities, the set of relevant RDmethods is presented. The main objective of the RDP is to provide the design teamwith a better overview and understanding of the RD toolbox and to support theapplication of RD continuously throughout the product development by providing asequential description of when to apply the methods and how they affect therobustness of the design.
Keywords: robust resign; process; product development; variation; implementation
1. Introduction
The reliable and predictable functional performance of products is of crucial importance to
companies that develop and produce (mechanical) products. Failures in meeting this can
lead to non-satisfied customers, scrap, loss of brand value, product recalls, etc. A recog-
nised way of obtaining a high and consistent level of product quality is through the use
of robust design methodology (RDM). Essentially, the aim of Robust Design (RD) is to
develop products with an optimised functional performance that is insensitive to variations
in the noise factors (NFs) as classically promoted by Taguchi (often referred to as type I
RD) and to variations in the product’s design parameters (DPs) (type II RD) (Chen, Allen,
Tsui, & Mistree, 1996). Especially in early design phases, type II RD plays an important
role to ensure flexibility in the design space later on. The IEEE (Geraci, Katki, McMone-
gal, Meyer, & Porteous, 1991) defines robustness as ‘the degree to which a system or com-
ponent can function correctly in the presence of invalid inputs or stressful environmental
conditions’ (p. 174). The uptake of RDM in industry is very diverse. Many example cases
of applications of RD can be found in the literature (see e.g. Bertini, Credi, Marconcini, &
Giovannini, 2012; Kang, Heo, Kim, Choi, & Kim, 2012). Krogstie, Ebro and Howard also
describe the successful implementation of RD in four well-established companies (2014).
Other studies have shown that various methods that fall into the suite of RD are regularly
applied in industry (Araujo, Benedetto-Neto, Campello, Segre, & Wright, 1996; Fujita &
# 2016 Informa UK Limited, trading as Taylor & Francis Group
∗Corresponding author. Email: [email protected]
Total Quality Management, 2016
http://dx.doi.org/10.1080/14783363.2016.1180952
Dow
nloa
ded
by [
DT
U L
ibra
ry]
at 0
1:27
30
May
201
6

Matsuo, 2005). Especially tolerance design is a very common method to ensure functional
robustness (Chase & Parkinson, 1991). However, surveys conducted in the UK, Sweden
and USA suggest that both in terms of knowledge and usage the concept of RD is still
not experiencing widespread success (Araujo et al., 1996; Gremyr, Arvidsson, & Johans-
son, 2003; Thornton, Donnelly, & Ertan, 2000). The lack of a RD process (RDP) – a
coherent approach structuring and arranging all individual methods in the RDM land-
scape – has been reported to be one reason (Krogstie et al., 2014). Seen from the
design engineer’s point-of-view, an extensive toolbox is provided by the literature, but
it is relatively unclear how the methods are connected, in which order they should be
used and how to transfer the mind-set of RD into an ordered set of activities. However,
the current research streams do not seem to address this issue.
This contribution has two objectives. Firstly, to clarify the mechanisms of RD: that is,
what are the mechanisms of the available RD methods? Secondly, to find coherences
between the methods, and identify how these relate to the activities of the design engineers
and propose a coherent RDP. The RDP shall be a ‘next step’ guide on where the single
tools can be positioned. It should fulfil the following requirements:
Req 1: The process should house all RD methods.
Req 2: The process should provide a sequence of use of all RD methods.
Req 3: The process should link to the activities of the design engineers.
Robust Design is a method and tool-driven field. To reach the objectives, we therefore
analyse methods commonly associated with RD to derive how they work. We then
describe their coherences and propose a RDP based on general design activities, which
supports the design engineer’s pursuit of a robust design throughout the product develop-
ment process (PDP). The application of the RDP in specific contexts is out of scope for this
study. Figure 1 summarises the methodology.
It is the intention that the RDP should be applicable in all design stages and that it can
be used not only as an analysis toolbox, but rather act as a complete framework containing
synthesis tools as well. The underlying assumption for this study is that the RDM can be
represented by its methods and tools. Due to the authors’ background in mechanical engin-
eering the focus is mainly on the RD of mechanical products.
Figure 1. Deriving the RDP.
2 S.M. Gohler et al.
Dow
nloa
ded
by [
DT
U L
ibra
ry]
at 0
1:27
30
May
201
6

The outline of the article is as follows. In Section 2 we present a literature study on the
most recent research in the field of RD to get an idea of current research streams in that
area and if the identified issues regarding the application of RD in industry are being
addressed. In the proceeding chapter we analyse the methods and tools commonly associ-
ated with RD and elaborate on the applicability of available processes and frameworks fol-
lowed by our proposal of the RDP. The article closes with a discussion and a conclusion.
2. Current research in RD
RD has been subject to numerous research projects and has therefore also led to many pub-
lications in the past decades. To judge current trends within the field, recent publications
since 2010 have been reviewed. The Google Scholar search engine has been used to
extract 80 relevant papers. The selection of relevant papers was done by screening of
the titles and abstracts and solely based on the authors’ opinion about the papers’ relevance
to RD. The selection is comprehensive but selective.
2.1. RD methods
RD has its origins in Taguchi’s ideas of quality loss occurring with any deviation from the
target performance and the so-called Taguchi method consisting of System, Parameter and
Tolerance Design (Taguchi, Chowdhury, & Wu, 2005).
Recently, Ebro, Howard, and Rasmussen (2012) promoted the use of Kinematic
Design and Design Clarity to ensure the right number and way of constraining parts in
an assembly for an improved System Design.
However, the largest share of recent publications deals with RD Optimisation (RDO).
RDO is directly related to Taguchi’s Parameter Design where experimental data and the
signal-to-noise ratio (SNR) are used to measure and optimise the robustness of single func-
tions. Eifler et al. (2011) and Hutcheson and Mcadams (2012) present further sensitivity
measures and indices to quantify robustness. Yadav, Bhamare, and Rathore. (2010) and
Yang and Du (2014) utilise the total quality loss as cost function in the optimisation to
account for multiple objectives. Other scholars, such as Saha and Ray (2011), focused
on the improvement of the efficiency and performance of the optimisation algorithms
themselves. Another stream within RDO is reliability-based RDO (RBRDO) and probabil-
istic RD taking the uncertainties and the probability of the occurrence of variation into
account to optimise the robustness and reliability of products as opposed to the determi-
nistic original approach by Taguchi. Many contributions on novel and improved algor-
ithms for RBRDO can be found in the recent literature (see e.g. Steenackers, Versluys,
Runacres, & Guillaume, 2011; Tang, Chen, & Wei, 2012; Shahraki & Noorossana,
2014). Lijuan, Jun, and Yu (2011) propose a method to integrate RD, Axiomatic Design
and reliability-based design to improve the efficiency of the optimisation. Various case
studies on RDO were conducted. Among those are, for example, the robust optimisation
of a low-pressure turbine of a jet engine and a suspension system (Bertini et al., 2012;
Kang et al., 2012).
The simulation and prediction of geometric variations for assemblies is another
research field within RD that is related to Taguchi’s Tolerance Design. Schleich,
Walter, Wartzack, Anwer, and Mathieu (2012) use skin models to incorporate manufactur-
ing data to increase the detail and accuracy of geometric variation simulation. Other
studies seek to extent geometric variation simulations by, for example, including the influ-
ence of welding on the final assembly (Pahkamaa, Warmefjord, Karlsson, Soderberg, &
Total Quality Management 3
Dow
nloa
ded
by [
DT
U L
ibra
ry]
at 0
1:27
30
May
201
6

Goldak, 2012) or by regarding deformable, slender parts such as cables and hoses (Her-
mansson, Carlson, Bjo, & Soderberg, 2013).
2.2. RD frameworks
Apart from the mentioned research on RD methods, some recent publications deal with the
general organisation and framing of RDM to increase the understanding and the efficiency
of the application. Howard et al. (2014) proposed a framework to structure RD efforts,
introducing a mapping of the influences of variation from the production all the way to
the customer perception of the final product. Gohler and Howard (2014) introduced a
way to classify tools and methods associated with RD to clarify their purposes for a
more efficient application.
2.3. Application of RD in industry
Other recent studies looked at the use of RD in industry. Gremyr and Hasenkamp (2011)
investigated the application of RD (especially design of experiments) in a medium-sized
Swedish company. They found that RDM tools are applied regularly but that ‘the principle
of insensitivity to noise factors has not fully permeated the general way of thinking’ (p. 56)
and therefore hindered the optimal use of the tools. Fazl Mashhadi, Alange, and Roos
(2012) and Fazl Mashhadi, Alange, Gustafsson, and Roos (2015) studied the introduction
of RD at Volvo. The first attempt of ‘tool-pushing’ by management did not find acceptance
and failed. Based on the experiences, a second initiative was developed founded on ‘prac-
tice-pulling through local learning processes in the organization’, which turned out to be
successful.
The literature review on recent publications associated with RD suggests that current
research activities mostly focus on the improvement and extension of RD methods –
especially RDO in various forms. Deterministic and probabilistic optimisations taking
the reliability perspective into consideration contribute with a large proportion of the
latest publications. Case studies on robust optimisation constitute another large share of
the publications. Generally speaking, the current research streams within RD are rather
method dominant and do not address the issue of implementation and application of RD
in industry. Only 5 of the 80 reviewed papers deal with framing RDM or the application
of RDM in industry. There is still a lack of a coherent and structured RDP putting available
and established as well as new methods into context and thereby easing the application in
industry.
3. Analysis of RD methods
In this section we analyse common RD methods and tools to derive their mechanisms and
working principles. The goal is to establish a common base to evaluate existing frame-
works and processes in the area of RD against the requirements of a coherent RDP as
defined in the introduction.
3.1. Selection of tools
There are numerous tools and methods being used in product development to support the
design engineers in their work covering various fields within the Design for X spectrum.
For this investigation, only the tools and methods commonly associated with RD were
4 S.M. Gohler et al.
Dow
nloa
ded
by [
DT
U L
ibra
ry]
at 0
1:27
30
May
201
6

taken into account. However, some of them are not exclusively RD tools but are also used
in other contexts and fields not focusing on reducing sensitivities and functional variation.
The tools were selected from four sources.
(1) RD methods in industry
To reflect the actual application of RDM in industry, four large companies in product
development and engineering consultancy were asked to share their RD tool boxes. The
companies are not representative but were chosen for their rigorous implementation and
application of RDM. The aim of this contribution is neither to compare different tool
boxes nor their frequencies of use. This short survey shall rather give an idea about
which methods are actually being used and ensure their capturing in the derivation of
the RDP.
(2) RDM reviews and surveys in literature
To consider a wide range of different methods and tools, the list from (1) was augmen-
ted by additional tools extracted from the RD literature. Existing reviews and classifi-
cations of RD methods were used as sources (Eifler, Ebro, & Howard, 2013;
Hasenkamp, Arvidsson, & Gremyr, 2009; Matthiassen, 1997). Furthermore, methods men-
tioned in surveys about the industrial use of RD in various regions of the world were also
included (Araujo et al., 1996; Gremyr et al., 2003; Thornton et al., 2000).
(3) RD special interest group (SIG) workshops and surveys
The RD SIG ran workshops and surveys on the ICED13, Design14 and ISoRD14 con-
ferences asking participants from academia and industry to name and place RD methods
and tools they actively apply.
(4) Authors’ experience
The authors have worked as RD consultants and as development engineer within an
aerospace company, totalling 15+ years of experience working with applied RD and there-
fore have hands-on experience with many of the RD methods.
3.2. Delimitation
Any given body of methods will be surrounded by somewhat related methods. Therefore a
delimitation of the field is necessary. We follow our working definition of RD methods as
stated in the introduction. Some methods that are often mentioned in the RD literature do
not fall into this category and are therefore excluded from the process model. These
include the following.
3.2.1. Methods for identifying customer and functional requirements
Although the starting point for an analysis of the robustness of a design would typically be
the identification of the functional requirements, this is regarded as out-of-scope in this
context, as requirements management is regarded as a separate topic typically carried
out by other people than the design engineers, which are the target audience for this pub-
lication. Therefore, methods such as quality function deployment (QFD), voice-of-the-
customer (VOC), etc. are not included in the process model.
3.2.2. Methods relating to reliability and risk management
In a design project, there are numerous risks that can affect the performance of the product
and the project: disturbances in the supply chain, misuse of the product, components being
mixed up or forgotten during assembly, etc. All entail a risk, but can be said to be out of the
Total Quality Management 5
Dow
nloa
ded
by [
DT
U L
ibra
ry]
at 0
1:27
30
May
201
6
hands of the design engineer, that is, these risks have to be dealt with by other people and
by other means than changing the features of the design. Furthermore, although failure
modes and effects analysis (FMEA) and fault tree analysis (FTA) are often mentioned
in literature as belonging to the suite of RD methods, it is the opinion of this research
that they do not belong there.
Table 1 lists commonly used RD methods and tools in alphabetical order, including
short descriptions. The list is not complete but comprehensive from the authors’ point
of view.
3.3. Mechanisms and working principles of RD methods and tools
As shown in Figure 1 step 1, it is our goal to increase the understanding of the inherent
mechanisms and working principles of the RD methods and tools to, then in the next
step, be able to assign them to specific activities of the engineer. A way to describe
how RD methods work is through the model of the transfer function (TF). The TF is
the mathematical description of the functional performance dependent on the influencing
parameters (usually in the form f = f (x1, . . . , xn)). Although methods have different
names and may have minor differences in the way they are described or applied, they
can ultimately be categorised based on how they affect the TF. Using the TF as a reference
to analyse each of the RD methods listed in Table 1, eight different independent mechan-
isms related to RD have been identified. In the following, the identified mechanisms of the
RDM, that is, the interactions of the methods with the TF and therefore the robustness of
the design, are described. The results are summarised in Table 3.
3.3.1. Robust concept design
Following design guidelines and best practices can influence the robustness already in the
conceptual stage. The selection of the working principle and the conceptual system design
solution can have a major effect on the robustness of the concept and subsequently the final
design. Taguchi et al. (2005) as well as Andersson (1996) stress the importance of system
design, especially conceptual design. Generally, different working principles yield very
different system and function responses, that is, TFs, and can therefore differ greatly in
terms of robustness against variation.
3.3.2. Reduction of couplings between functions
In the case of a multi-function design, it is likely that different functions share the same
influencing parameters – so-called DPs. The functions are therefore said to be coupled.
However, the functional response and also the sensitivity towards the DP can be very
different or even contradicting. Also, the DP’s target values and design ranges differ in
most cases which makes trade-offs necessary compromising the overall performance.
The Independence Axiom (Axiom 1) of Suh’s Axiomatic Design (2001) addresses the
coupling of functions and its implications. He proposes to un- or decouple the functions
from each other to obtain independent functions that can be adjusted by a set of DPs
that do not interfere with other functions. Matthiassen (1997) describes the differentiation
and separation of functions as means to avoid compromising the performance due to con-
flicting or contradicting demands (functional requirements).
6 S.M. Gohler et al.
Dow
nloa
ded
by [
DT
U L
ibra
ry]
at 0
1:27
30
May
201
6

Table 1. List of commonly used methods in RD.
Methods and tools Short descriptionIndustry RD
toolboxes
RDMreviews/surveys
RD SIGworkshops
Authors’experience
1. Analytical TF modelling Usage of analytical mathematical expressions to (simplifyand) model functional responses
3 3
2. Axiomatic design Axiom 1 Striving for the independence of functions (decoupling,uncoupling) can yield robustness
3 3 3
3. Axiomatic design Axiom 2 Maximisation of the probability of fulfilling the functionalrequirements by reducing the number of influencing factors
and designing to process capabilities
3 3
4. Design clarity Design for unambiguous interfaces and force transmission 3 3 3 3
5. Design matrix Linear mapping between functional output and DPs in matrixform
3
6. DoE Statistically designed experiments to maximise informationand minimise number of required experiments
3 3 3 3
7. DSM Matrix representation of structures and correlations incomplex systems
3
8. Error transmission formula Calculation of the variance of a function utilising sensitivitiesand variances of the influencing factors
3
9. Ishikawa/Fishbone diagram Systematical decomposition of influencing factors to afunction in a fishbone-like graphical representation
3 3 3
10. Kinematic design Design for ideally constrained mechanisms 3 3 3 3
11. Locating schemes Design for ideally constraining all 6 degrees of freedom inassemblies
3 3 3
12. Monte Carlo analysis Statistical evaluation of repeated model simulations based onrandom sampling of input parameters following predefined
probability distributions
3 3 3
13. Optimisation of transferfunction or SNR
Derivation and optimisation of cost functions relating tofunctional performance and variance
3 3 3
14. P-diagram Graphical representation of a function or process 3 3 3
(Continued)
To
tal
Qu
ality
Ma
na
gem
ent
7
Dow
nloa
ded
by [
DT
U L
ibra
ry]
at 0
1:27
30
May
201
6

Table 1. Continued.
Methods and tools Short descriptionIndustry RD
toolboxes
RDMreviews/surveys
RD SIGworkshops
Authors’experience
distinguishing between (1) signal/input factors, (2) controlfactors, (3) NFs and (4) output
15. Pareto analysis Derivation and ranking of most influencing factors towards afunctional output
3 3
16. Response surfacemethodology and other datafitting methods
Statistical fitting of a surrogate model to experimental data 3 3
17. Safety factors wrt. structuralproperties and processcapability data
Include safety factors to account for variations anduncertainties
3 3 3 3
18. Selection of robust workingprinciple and conceptualdesign solution
Inherently more robust working principles shall be exploited 3 3 3 3
19. Sensitivity analysis Assessment of sensitivities of functions to variation in singleor multiple parameters
3 3 3
20. Separation/integration Separation/integration of functions to reduce functionalvariance
3 3 3
21. Tolerance chains Derivation of the influence of tolerances on resulting gaps oroverlaps in assemblies. Strive for short tolerance chains to
reduce variation of the gap or overlap
3 3 3 3
22. Tolerance management Optimisation of tolerance allocations to reduce functionalvariation and cost
3 3 3
23. Variation mode and effectsanalysis
Subjective quantification of the occurrence and impact ofvariation on the functional performance
3 3
8S
.M.
Go
hler
etal.
Dow
nloa
ded
by [
DT
U L
ibra
ry]
at 0
1:27
30
May
201
6

3.3.3. Reduction of number of influencing factors
A product’s functions are defined by the correlation of DPs and NFs to the function
response or output. The model of the TF captures all of these influencing factors. In the
light of robustness, that is, variability, of the functional response, all the influencing
factors contribute with their variation. Assuming the independence of the DPs and NFs
and a normal distribution, the Taylor Series expansion gives
s2f =
∑n
i=1
∂f
∂xi
( )2
s2i ,
where si and sf are the standard deviations of the ith influencing factor and the functional
performance, respectively. As a result, the total possible variance of the resulting func-
tional output increases with the number of influencing factors (or remains the same at
best). Suh (2001) describes this with the Information Axiom (Axiom 2 in Axiomatic
Design). The probability of fulfilling the functional requirement is inversely proportional
to the information content. In other words, the lower the information content the higher the
probability of achieving the desired functional response. Many researchers, including
Pahl, Beitz, Feldhusen, and Grote (2007), Matthiassen (1997) and Mørup (1993), elabo-
rated over the use of design guidelines and principles to ultimately lower the number of
influencing factors for an increase in predictability and robustness. Examples are to
avoid long tolerance chains, utilise self-adjustment, unambiguous loading and many
more (22 in total). The tools of Location Schemes, Design Clarity and Kinematic
Design facilitate the principles of ideally constrained interfaces and mechanisms and,
hence, reduce the number of influencing factors, to obtain unambiguous force flows
(Ebro et al., 2012; Soderberg, Lindkvist, & Carlson, 2006).
3.3.4. Design with robustness margins
A common and widely used approach especially in the first iteration loop of product devel-
opment is to build in margins. This might be costly in the way that the design is over-
dimensioned; however, margins do not only cover uncertainty in the calculations and
assumptions but also uncertainties in production and use, hence robustness. Typical and
established margins are structural safety factors, where, for example, the maximum allow-
able stress or strain is a factor smaller than the actual material properties in order to allow
for variation.
3.3.5. Measuring of system response
The measuring of robustness represents a large fraction of the RDM. The central point is
the measurement of the system or function response in the design space and how it changes
due to a change in one or more of the DPs and NFs. Simple one-factor-at-the-time screen-
ing procedures become costly very quickly for an increased number of experiments or
simulations due to changing parameters and levels and do not capture interaction
effects. Structured planning of experiments and simulations helps exploring the design
space in an effective and efficient manner. Design of experiments (DoE) has its roots in
the 1920s starting with work from Fisher and reaches up to today (Antony, 2003).
Taguchi operationalised orthogonal arrays, which were further developed by Welch,
Total Quality Management 9
Dow
nloa
ded
by [
DT
U L
ibra
ry]
at 0
1:27
30
May
201
6
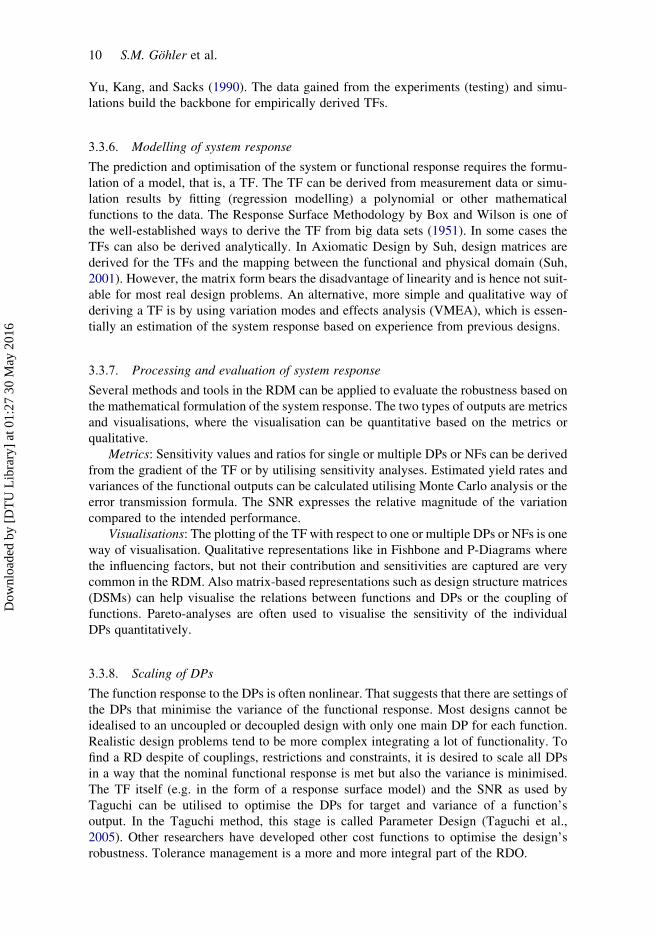
Yu, Kang, and Sacks (1990). The data gained from the experiments (testing) and simu-
lations build the backbone for empirically derived TFs.
3.3.6. Modelling of system response
The prediction and optimisation of the system or functional response requires the formu-
lation of a model, that is, a TF. The TF can be derived from measurement data or simu-
lation results by fitting (regression modelling) a polynomial or other mathematical
functions to the data. The Response Surface Methodology by Box and Wilson is one of
the well-established ways to derive the TF from big data sets (1951). In some cases the
TFs can also be derived analytically. In Axiomatic Design by Suh, design matrices are
derived for the TFs and the mapping between the functional and physical domain (Suh,
2001). However, the matrix form bears the disadvantage of linearity and is hence not suit-
able for most real design problems. An alternative, more simple and qualitative way of
deriving a TF is by using variation modes and effects analysis (VMEA), which is essen-
tially an estimation of the system response based on experience from previous designs.
3.3.7. Processing and evaluation of system response
Several methods and tools in the RDM can be applied to evaluate the robustness based on
the mathematical formulation of the system response. The two types of outputs are metrics
and visualisations, where the visualisation can be quantitative based on the metrics or
qualitative.
Metrics: Sensitivity values and ratios for single or multiple DPs or NFs can be derived
from the gradient of the TF or by utilising sensitivity analyses. Estimated yield rates and
variances of the functional outputs can be calculated utilising Monte Carlo analysis or the
error transmission formula. The SNR expresses the relative magnitude of the variation
compared to the intended performance.
Visualisations: The plotting of the TF with respect to one or multiple DPs or NFs is one
way of visualisation. Qualitative representations like in Fishbone and P-Diagrams where
the influencing factors, but not their contribution and sensitivities are captured are very
common in the RDM. Also matrix-based representations such as design structure matrices
(DSMs) can help visualise the relations between functions and DPs or the coupling of
functions. Pareto-analyses are often used to visualise the sensitivity of the individual
DPs quantitatively.
3.3.8. Scaling of DPs
The function response to the DPs is often nonlinear. That suggests that there are settings of
the DPs that minimise the variance of the functional response. Most designs cannot be
idealised to an uncoupled or decoupled design with only one main DP for each function.
Realistic design problems tend to be more complex integrating a lot of functionality. To
find a RD despite of couplings, restrictions and constraints, it is desired to scale all DPs
in a way that the nominal functional response is met but also the variance is minimised.
The TF itself (e.g. in the form of a response surface model) and the SNR as used by
Taguchi can be utilised to optimise the DPs for target and variance of a function’s
output. In the Taguchi method, this stage is called Parameter Design (Taguchi et al.,
2005). Other researchers have developed other cost functions to optimise the design’s
robustness. Tolerance management is a more and more integral part of the RDO.
10 S.M. Gohler et al.
Dow
nloa
ded
by [
DT
U L
ibra
ry]
at 0
1:27
30
May
201
6

4. RD processes and frameworks
In the literature, different descriptions of method classifications, frameworks and pro-
cesses related to RD can be found. RD was first introduced by Taguchi in the 1950s.
The so-called Taguchi method was the first framework incorporating the ideas and
mind-sets of RD and is still used in developing companies. Taguchi distinguished
between three main phases of RD: (1) the system design which corresponds to concept
and embodiment of a design solution addressing the functional requirements of the
product, (2) the parameter design phase in which the design is optimised for robustness
– designed experiments are used to gain understanding about the system behaviour and
the sensitivity of DPs and NFs, followed by the actual optimisation of the SNR and (3)
the setting of tolerances optimising the design with respect to manufacturing costs
(Yang, 2007). The Taguchi approach focuses on type I RD to optimise the robustness
against NFs utilising systematic experimentation following orthogonal arrays in the par-
ameter design phase. System design and tolerance design play a less important role
since Taguchi sees them as ‘specialist’s territory’ and last ‘countermeasure’ to ensure a
robust performance, respectively (Taguchi et al., 2005).
In recent years, design for Six Sigma (DfSS) has become relatively successful in indus-
try (Goh, 2002). The mind-set of DfSS is similar to the approach found in the Six Sigma
paradigm of continuous improvement. But where Six Sigma is aimed at improving an
existing process, the objective of DfSS is to design a reliable product from the ground-
up (Creveling, Slutsky, & Antis, 2002). In DfSS, the approach is typically called IDOV
(or something similar) comprising a series of steps each containing suggested methods.
The IDOV steps are (1) Identify customer and product requirements using, for example,
QFD and VOC, (2) Design conceptual solutions and identify risks using, for example,
FMEA, (3) Optimise the design using process capability information, RD methods,
Monte Carlo simulations and tolerance management and, finally, (4) Validate the design
by testing and reviewing, using, for example, highly accelerated lifetime tests, reliability
engineering and FMEA. DfSS is meant to be a comprehensive ‘concept aiming at Six
Sigma performance by improved design activity’ (Hasenkamp, 2010, p. 317) to give a
high-level guidance for quality and reliability activities of a developing company.
However, RD is only seen as a subset of this as part of the Optimise step and although
it is not described in great detail it is noticeable that it is seen as a late-stage analysis
and optimisation of the design.
Other frameworks associated with RD deal with variation management. Variation risk
management (VRM) proposed by Thornton is one of them (2004). VRM is a framework to
structure efforts to reduce risks caused by variation. It includes 22 industry practices that
are applied in 3 general stages. (1) The risk identification stage, where a system of so-
called variation risk factors is created. This includes the identification of key character-
istics (KCs) in a risk flow down manner comprising four levels: Product KCs, Sub
System KCs, Part KCs and Process KCs. (2) The risk assessment with two general
approaches – one being the prediction of the final quality by summing up all individual
process variations. The second one utilises a top-down approach allocating allowable vari-
ation to the single features in the form of tolerances. In that approach the assigned toler-
ances are compared to the predicted process capability (Cpk) values to predict the final
quality. The risk assessment builds upon the variation modelling, the feedback of pro-
duction capabilities and the estimation of capability uncertainty. And (3) the risk mitiga-
tion through design changes and process improvements. This includes the practices of
cost/benefit trade-offs, RD and manufacturing quality plans. For RD, Thornton refers to
Total Quality Management 11
Dow
nloa
ded
by [
DT
U L
ibra
ry]
at 0
1:27
30
May
201
6

the Taguchi method. The VRM framework addresses the entire variation problem, includ-
ing ingoing variation, that is, the capability of the production processes as well as the sen-
sitivity of the design to variation. In VRM, RD is seen as part of the risk mitigation
activities. VRM focuses more on the production side and on allocating parameter variation
and predicting functional variation, than supporting the design engineer in the effort of
designing an inherently robust design by changing the geometry and features of the design.
Hasenkamp et al. (2009) made an attempt to frame the RDM answering the questions:
Why should RD be used? What should be done and how should it be done? They dis-
tinguish between (1) principles, (2) practices and (3) tools of RD. As principles they
mention ‘Awareness of Variation’, ‘Focus on the Customer’ and ‘Continuous Applica-
bility’ explaining the overall mind-set of a continuous focus on variation. Practices give
a high-level, fundamental input on how robustness can be achieved and cover design
rules, insensitivity to NFs and robust optimisation. The actual RD activities and
methods are summarised in tools including mainly analysis tools such as VMEA, P-
Diagram, TF and DoE in an unstructured manner. Fazl Mashhadi et al. (2015) extended
the framework based on their experiences in industry. The main aim of this framework
is to convey the goal and mind-set of RD facilitated by certain practices and tools to
assist the implementation, acceptance and application of RD in industry.
Gohler and Howard (2014) provide a more detailed classification of RD methods, cate-
gorising the methods based on the objective or purpose of applying them. The methods are
classified as supporting one or more of the four categories: (1) RD principles, (2) RD
evaluation, (3) robustness optimisation and (4) robustness visualisation. These categories
are not stitched together to a coherent process, but shall rather give practitioners a gui-
dance and understanding of what certain methods in RD are used for and what they can
deliver.
The axiomatic design framework by Suh introduces two axioms, namely the Indepen-
dence and the Information Axiom. The main idea is to reduce the coupling of functions in a
design (independence of functions) and to strive for minimised information content. The
robustness of a design is measured with the probability of fulfilling all functional require-
ments simultaneously. This probability is inversely proportional to the information content
(Suh, 2001). In practice this framework can be seen as design guideline which provides
heuristics for a good and RD.
Howard et al. (2014) propose the Variation Management Framework (VMF) for RD. It
maps the variation of production variables through transfer and quality loss functions to
the customer satisfaction of the product on the market. The VMF is a simplification of
the mapping of variations through the production, design and customer domain. It has
its strengths in the simple and easy description and visualisation of the need and influence
of RD.
4.1. Gaps in existing frameworks
The presented frameworks pursue different objectives in framing and prescribing RD.
Their main shortcomings are discussed below and summarised in Table 2:
. Lack of low-level guidance and connection to design activities of design engineers.
From the review, we found that the majority of frameworks and processes address man-
agerial and organisational or theoretical and academic aspects of RD. The frameworks
provide a high-level overview of how RD fits into the overall development process. But
12 S.M. Gohler et al.
Dow
nloa
ded
by [
DT
U L
ibra
ry]
at 0
1:27
30
May
201
6

seen from the design engineer’s or project manager’s point-of-view, the frameworks do
not provide detailed guidance on the specific activities of RD or are very focused on
single methods (like Taguchi method and Axiomatic Design). In DfSS, VRM and
VMF, RD is merely a subset of the overall framework and not described in great detail.
The lack of understanding of applicability of the methods and their coherences is not
addressed. Further, there is no prescribed sequence for the application of RDM.
. Synthesis tools missing.
Another finding is that most of the frameworks do not address the whole landscape and
mechanisms of RD as identified in Section 3. The synthesis part is often neglected and
RD is mainly seen as an analysis and optimisation tool, that is, the frameworks provide
methods that can be used to analyse the current level of robustness and optimise it
within the constraints of the given concept, but they do not provide any guidance for
the design engineer at the point-of-design, that is, during the actual sketching and model-
ling. As a consequence, the final design may simply end up as being a sub-optimised
version of the initial concept, rather than an inherently robust concept, based on guidelines
and principles for obtaining robust concepts. This is especially unfortunate, since the
actual measuring and modelling of the robustness can be challenging and costly.
. Unordered and unsorted list of RD methods.
The frameworks describe an array of relevant methods, but do not go into details about
which order to apply the tools in and what the objective of the individual tool is. A coher-
ent RDP is lacking. The foci and objectives of methods are often missing leaving the prac-
titioners with a potentially overwhelming toolbox.
5. Proposing a RDP
As outlined earlier in this paper, although broadly acknowledged, the current uptake and
application of RD in industry is rather unsatisfactory. One reason being the gap between
academic research and the practical application in industry. Another reason is the fuzzi-
ness of the RD toolbox with no coherent RDP as identified in the previous section.
5.1. Derivation of a RDP
The assumption behind the proposal of the RDP is that a process is inherently built and
structured by the activities and methods it comprises. Reversing the argumentation, the
coherences of the methods and activities form the process.
The eight mechanisms of RDM give a semi-structured description of the RD toolbox.
However, from the design engineer’s point of view, it is not always clear how the methods
fit into the everyday activities in a development project. The engineer is shifting back and
forth between synthesis and analysis on both conceptual and detailed design levels and
therefore the RDP should support this way of working. The RDP should, furthermore,
addresses the requirements as stated in the introduction: (1) housing of all RD methods,
(2) provision of an application sequence and (3) linking the RD methods to the activities
of the design engineers. Table 3 summarises the results from the previous section and con-
nects the methods to the design activities of the engineer.
Total Quality Management 13
Dow
nloa
ded
by [
DT
U L
ibra
ry]
at 0
1:27
30
May
201
6

Table 2. Summary of existing RD frameworks.??
Categories of RD methods and tools Target group
Framework
Robustconceptdesign
Reductionof
couplingsbetweenfunctions
Reductionof number
ofinfluencing
factors
Designwith
robustnessmargins
Measuringof systemresponse
Modellingof systemresponse
Evaluationof systemresponse
Scalingof
designfactors Engineers Managers
Prescribedsequence
Suppliesmotivation
ofapplication
Linksmethodsto designactivities
Taguchi 3 3 3 3 3 3 3 3 3
DfSS RD is a subset and not specified further 3 3
VRM RD is a subset and not specified further 3 3
Hasenkamp 3 3 3 3 3 3 3 3 3 3
Gohler 3 3 3 3 3 3 3 3 3 3 3
Axiom.Des 3 3 3 3 3 3 3
VMF RD is a subset and not specified further 3
14
S.M
.G
oh
leret
al.
Dow
nloa
ded
by [
DT
U L
ibra
ry]
at 0
1:27
30
May
201
6

To derive a RDP the underlying activities that are performed by the design engineers
need to be understood (Figure 1 step 2). The analysis of the eight mechanisms revealed
four governing activities. Firstly, there are mechanisms that address the actual design of
the product: these are robust concept design, reduction of couplings and influencing
factors and designing with margins. Other mechanisms aim at the assessment and descrip-
tion of the functional performance (measuring and modelling of system response). Further,
the last two mechanisms address the processing of the results and the optimisation which
again are two very different activities. In summary, the RD efforts can be grouped in four
different design steps: (1) using relevant principles and guidelines for obtaining a robust
conceptual design, (2) measuring and modelling the robustness of the design, (3) proces-
sing the results and either redesigning (back to 1) or (4) optimising the design. Based on
these coherences and design activities associated with the methods of RD presented in this
paper, we propose a RDP to describe the RD efforts and its methods and tools in a
Table 3. RDM mechanisms and engineering activities.
No Mechanisms of RDM Tools/methodsWhat the designer does (design
activities)
I Robust concept design Selection of the workingprinciple and theconceptual designsolution
1. Conceptual design In this context,conceptual design is understoodas defining a new solution to adesign problem, as opposed toscaling (see below)II Reduction of
couplings betweenfunctions
Axiomatic design Axiom 1Separation/integration of
functionsIII Reduction of number
of influencingfactors
Axiomatic design Axiom 2Design clarityKinematic designLocating schemesTolerance chains
IV Design withrobustness margins
Safety factors wrt. structuraland process capabilitydata
V Measuring of systemresponse
DoE 2. Data collection (measuring) andmodelling of the system response
VI Modelling of systemresponse
Analytical transfer functionmodelling
Design matrixResponse surface
methodology and otherdata fitting methods
Variation mode and effectsanalysis
VII Processing andevaluation of systemresponse
DSM 3. Process and evaluate (graphs,metrics, visualisations anddeciding on further actions)
Error transmission formulaIshikawa/Fishbone diagramMonte Carlo analysisP-diagramPareto analysisSensitivities analysis
VIII Scaling (optimisation)of DPs
Optimisation of transferfunction or SNR
4. Detailed design and scaling(optimisation) of parameters andtolerancesTolerance management
Total Quality Management 15
Dow
nloa
ded
by [
DT
U L
ibra
ry]
at 0
1:27
30
May
201
6
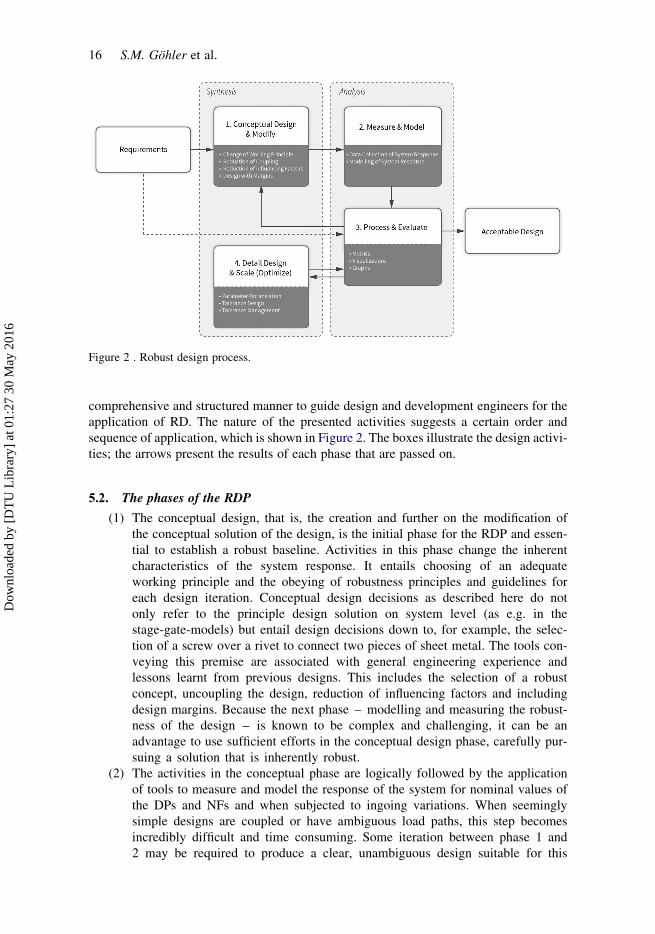
comprehensive and structured manner to guide design and development engineers for the
application of RD. The nature of the presented activities suggests a certain order and
sequence of application, which is shown in Figure 2. The boxes illustrate the design activi-
ties; the arrows present the results of each phase that are passed on.
5.2. The phases of the RDP
(1) The conceptual design, that is, the creation and further on the modification of
the conceptual solution of the design, is the initial phase for the RDP and essen-
tial to establish a robust baseline. Activities in this phase change the inherent
characteristics of the system response. It entails choosing of an adequate
working principle and the obeying of robustness principles and guidelines for
each design iteration. Conceptual design decisions as described here do not
only refer to the principle design solution on system level (as e.g. in the
stage-gate-models) but entail design decisions down to, for example, the selec-
tion of a screw over a rivet to connect two pieces of sheet metal. The tools con-
veying this premise are associated with general engineering experience and
lessons learnt from previous designs. This includes the selection of a robust
concept, uncoupling the design, reduction of influencing factors and including
design margins. Because the next phase – modelling and measuring the robust-
ness of the design – is known to be complex and challenging, it can be an
advantage to use sufficient efforts in the conceptual design phase, carefully pur-
suing a solution that is inherently robust.
(2) The activities in the conceptual phase are logically followed by the application
of tools to measure and model the response of the system for nominal values of
the DPs and NFs and when subjected to ingoing variations. When seemingly
simple designs are coupled or have ambiguous load paths, this step becomes
incredibly difficult and time consuming. Some iteration between phase 1 and
2 may be required to produce a clear, unambiguous design suitable for this
Figure 2 . Robust design process.
16 S.M. Gohler et al.
Dow
nloa
ded
by [
DT
U L
ibra
ry]
at 0
1:27
30
May
201
6

phase. The understanding of the system response and the mathematical descrip-
tion is necessary for the evaluation and processing of the data (phase 3) as well
as for prediction and optimisation of the design (phase 4).
(3) The third phase comprises the processing and evaluation of the robustness data
of the current design. The information can be conveyed in the form of metrics,
graphs or illustrations. Checking the results against the requirements gives the
basis to decide whether the design is acceptable as is or needs further improve-
ments. This could entail a modification or redesign of the conceptual design sol-
ution or a scaling (optimisation) of the existing solution. A re-evaluation of the
changed design is necessary to proceed. Note that the evaluation of the market
as well as the quality loss associated with variation in functional performance
and therefore the setting of functional requirements is not included in the
RDP as delimited in Section 3. This information is assumed to be known and
available.
(4) In the case that the conceptual robustness has been judged to be satisfactory, the
correlations gained in phase 2 can be utilised to optimise the robustness of the
design. DPs are scaled to meet the target functional requirements but also to
optimise the design for a minimised variance of the overall functional
performance.
In a design process, these are recurring activities from the initial sketch to the final design.
It is important to note that not all methods and tools associated with the four phases can be
or are sensible to be applied in each iteration. Instead it shall be stressed that the proposed
RDP gives structured guidance on when, which and how methods can be used and what
their underlying mechanisms are.
6. Discussion
When proposing a new process, the usefulness, applicability and interaction with existing
processes is of critical importance. In this section we discuss and reflect on some of the
most important questions. However, this does not replace a rigorous validation.
6.1. How would the RDP be applied in a real product development situation?
Development engineers of any kind face very specific tasks and deliverables every day.
Realising what phase of the RDP a given task lays in is of high importance to systemati-
cally address the robustness of the product. Are certain phases skipped? Have all options in
the conceptual design phase been exhausted to achieve the highest possible level of
inherent robustness? Can we go ahead with the measuring (experimentation, prototyping,
etc.) and modelling of the system or are there, for example, too many ambiguities increas-
ing the complexity of the model, which are costly and time consuming? The same applies
for the processing/evaluation and optimisation phase. Are we sure that the current activity
is the most efficient and effective one to achieve the most RD in a given situation? What
tools and methods are available for my specific task and deliverable?
Being able to place one’s activity in the RDP and selecting an appropriate method
enables the engineer to systematically address robustness considerations in the most effec-
tive and efficient manner.
From the managerial perspective, the RDP offers the possibility to establish an organ-
ised toolbox including only methods and tools appropriate for the company or department.
Total Quality Management 17
Dow
nloa
ded
by [
DT
U L
ibra
ry]
at 0
1:27
30
May
201
6
The selection can be done based on the typical engineering tasks in the context of the
product, organisation, expertise, etc. A reduced toolbox with the knowledge about the
mechanisms of the individual methods will increase the clarity and therefore the speed
and effectiveness of the application.
6.2. How does the RDP relate to generic PDPs, for example the stage/gate or V-models?
It is widely acknowledged that product development is an iterative rather than a linear
process (Summers & Shah, 2010). Iterative process models like the V-model or agile
product development are well established in industry. In practice, certain functions in
the product are either reused from previous products or are chosen to be frontloaded to
give a proof-of-concept, which makes the development process highly nonlinear. To
support this, the RDP is defined in a way that it is decoupled from existing generic devel-
opment models and it is the intent that the RDP is applicable at any stage of the develop-
ment process. In agreement with that, work by Hasenkamp, Adler, Carlsson, and
Arvidsson (2007) shows that certain RD methods can be used in various phases of a
generic PDP.
6.3. How should RDP be implemented in industry?
The way of applying RDM in practice varies very much – from non-existent but acknowl-
edged to highly integrated. Also the reasons for application differ from company to
company. Krogstie et al. (2014) assessed four companies that have successfully integrated
RD. The approaches for integrating RD in their general PDPs differ from robustness
metrics for milestones, common understanding in DfSS reviews to specific requests of
RD activities by the management and integration into lean processes. The iterative RDP
as proposed in this paper covers all these approaches. Studies and experiences have
shown that ‘tool-pushing’ from the management for specific RD tools was unsuccessful
(Fazl Mashhadi et al., 2012). The answers to ‘Why?’ and ‘How?’ to apply RDM are criti-
cal for the understanding of the practitioners, that is, the engineers, and therefore the suc-
cessful integration. The RDP is therefore thought as a framework for companies to
establish their individual RD toolbox and practices. The companies’ individual foci are
reflected in the model. The assessment and quantification of robustness as well as the visu-
alisation and communication play an essential role in the RD work of these companies.
7. Conclusion
The field of RD includes a wide range of tools and methods. However, a clear process con-
necting these and supporting the application does not exist. It is still being reported that the
integration of RD in industry is not widely spread and that tools and methods for RD are
perceived to be too complex and unorganised with no actual guidance for application. This
leads to great efforts for implementation, including excessive training and tool pushing
rather than a natural pull from the design engineers based on the benefits of using RD.
In this study we analysed 23 methods commonly associated with RD and found 8 under-
lying independent mechanisms of how these methods work. Based on those, we propose a
novel RDP with four main phases covering the actual activities of the design engineer: (1)
conceptual design, (2) measure and model, (3) process and evaluate and (4) optimise. The
goal is to support the application by clarifying and structuring the use and application of RD
18 S.M. Gohler et al.
Dow
nloa
ded
by [
DT
U L
ibra
ry]
at 0
1:27
30
May
201
6

methods. Keeping in mind that PDPs are very non-linear in real life as opposed to the
descriptions in many academic publications, the nature of the RDP also supports an iterative
approach, and is applicable in all design stages. We show that there is a logical sequence for
the application and address the applicability to the design engineers. The comparison with
RD efforts in the industrial context shows that an application of the proposed process is poss-
ible. The RDP is of interest for engineers, lead engineers and management to understand and
manage the efforts made to increase, manage and control robustness. Also the training of RD
and the creation of company RD Toolboxes can be built upon the proposed framework. The
structured and systematic approach to RD by means of a coherent process is needed to
increase the uptake in industry.
7.1.Future work
The aim of the RDP proposed in this article is to support the application of RD in industry
and provide a better overview and understanding of the RD toolbox. However, the actual
usefulness and usability of the process has only been reflected on briefly (Section 6). Vali-
dation studies are necessary on project and corporate level. Does the RDP improve the
understanding and foster the efficient use of RD methods and tools in practice? To
answer that question a study could be run to assess the selection and application of RD
methods with and without support of the RDP. On corporate level the benefits of using
the RDP could be studied for building a balanced RD toolbox or consolidate and organise
an existing one. Another interesting study could be on the integration of quantifiable
metrics to steer and measure the robustness of a product.
Acknowledgements
The authors would like to thank Novo Nordisk and the Valcon Robust Design Consultancy for theirsupport for this research project.
Disclosure statement
No potential conflict of interest was reported by the authors.
References
Andersson, P. (1996). A process approach to robust design in early engineering design phases.Lund, Sweden: Lund Institute of Technology.
Antony, J. (2003). Design of experiments for engineers and scientists. Oxford: Elsevier.Araujo, C. S., Benedetto-Neto, H., Campello, A. C., Segre, F. M., & Wright, I. C. (1996). The util-
ization of product development methods: A survey of UK industry. Journal of EngineeringDesign. doi:10.1080/09544829608907940
Bertini, F., Credi, M., Marconcini, M., & Giovannini, M. (2012). A path toward the aerodynamicrobust design of low pressure turbines. Journal of Turbomachinery, 135, 021018. doi:10.1115/1.4007519
Box, G. E. P., & Wilson, K. B. (1951). On the experimental attainment of optimum conditions.Journal of the Royal Statistical Society, 13(1959), 1–45. doi:10.1007/978-1-4612-4380-9_23
Chase, K. W., & Parkinson, A. R. (1991). A survey of research in the application of tolerance analy-sis to the design of mechanical assemblies. Research in Engineering Design, 3(1), 23–37.doi:10.1007/BF01580066
Chen, Wei, Allen, J. K., Tsui, K-L., & Mistree, F. (1996). A procedure for robust design: Minimizingvariations caused by noise factors and control factors. Journal of Mechanical Design. doi:10.1115/1.2826915
Total Quality Management 19
Dow
nloa
ded
by [
DT
U L
ibra
ry]
at 0
1:27
30
May
201
6

Creveling, C. M., Slutsky, J., & Antis, D. (2002). Design for Six sigma in technology and productdevelopment. Englewood Cliffs, NJ: Prentice Hall.
Ebro, M., Howard, T. J., & Rasmussen, J. J. (2012). The foundation for robust design: Enablingrobustness through kinematic design and design clarity. Proceedings of InternationalDesign Conference (Design 2012), Dubrovnik, Croatia, DS, Vol. 70, pp. 817–826.
Eifler, T., Ebro, M., & Howard, T. J. (2013). A classification of the industrial relevance of robustdesignmethods. International Conference on Engineering Design (ICED13), Seoul, SouthKorea, pp. 427–436.
Eifler, T., Mathias, J., Engelhardt, R., Kloberdanz, H., Bohn, A., & Birkhofer, H. (2011). Evaluationof solution variants in conceptual design by means of adequate sensitivity indices.International Conference on Engineering Design (ICED11), Copenhagen, Denmark,Vol.9, pp. 314–323.
Fazl Mashhadi, A., Alange, S., Gustafsson, G., & Roos, L-U. (2015). The Volvo robust engineeringsystem: How to make robust design work in an industrial context. Total Quality Management& Business Excellence, 1–19. doi:10.1080/14783363.2015.1039938
Fazl Mashhadi, A., Alange, S., & Roos, L-U. (2012). Introducing robust design in product develop-ment: Learning from an initiative at Volvo. Total Quality Management & BusinessExcellence. doi:10.1080/14783363.2012.728847
Shahraki, A.F., & Noorossana, R. (2014). Reliability-based robust design optimization: A generalmethodology using genetic algorithm. Computers & Industrial Engineering, 74, 199–207.doi:10.1016/j.cie.2014.05.013
Fujita, K., & Matsuo, T. (2005). Utilisation of product development tools and methods. InternationalConference on Engineering Design (ICED05), Melbourne, Australia, pp. 1–14.
Geraci, A., Katki, F., McMonegal, L., Meyer, B., & Porteous, H. (1991). IEEE standard computerdictionary. A compilation of IEEE standard computer glossaries. IEEE Std 610. doi:10.1109/IEEESTD.1991.106963
Goh, T. N. (2002). A strategic assessment of six sigma. Quality and Reliability EngineeringInternational, 18, 403–410. doi:10.1002/qre.491
Gohler, S. M., & Howard, T. J. (2014). A framework for the application of robust design methods andtools. 1st International Symposium on Robust Design, Copenhagen, Denmark, pp. 123–133.doi: 10.4122/dtu:2099.
Gremyr, I., Arvidsson, M., & Johansson, P. (2003). Robust design methodology: Status in theSwedish manufacturing industry. Quality and Reliability Engineering International, 19(4),285–293. doi:10.1002/qre.584
Gremyr, I., & Hasenkamp, T. (2011). Practices of robust design methodology in practice. The TQMJournal. doi:10.1108/17542731111097489
Hasenkamp, T. (2010). Engineering design for Six Sigma – a systematic approach. Quality andReliability Engineering International. doi:10.1002/qre.1090
Hasenkamp, T., Adler, T., Carlsson, A., & Arvidsson, M. (2007). Robust design methodology in ageneric product design process. Total Quality Management & Business Excellence, 18(4),351–362. doi:10.1080/14783360701231294
Hasenkamp, T., Arvidsson, M., & Gremyr, I. (2009). A review of practices for robust design meth-odology. Journal of Engineering Design, 20(6), 645–657. doi:10.1080/09544820802275557
Hermansson, T., Carlson, J. S., Bjo, S., & Soderberg R. (2013). Geometric variation simulation androbust design for flexible cables and hoses. Journal of Engineering Manufacture, 227(5),681–689. doi:10.1177/0954405413476627
Howard, T. J., Ebro, M., Eifler, T., Petersen, S., Gohler, S. M., Christiansen, A., & Rafn, A. (2014).The variation management framework (VMF) for robust design. 1st International Symposiumon Robust Design, Copenhagen , Denmark pp. 1–9. doi:10.4122/dtu
Hutcheson, R. S., & Mcadams, D. A. (2012). Sensitivity measures for use during conceptual design.International Journal of Design Engineering, 5(1). 1–20
Kang, D. O., Heo, S. J., Kim, M. S., Choi, W. C., & Kim, I. H. (2012). Robust design optimization ofsuspension system by using target cascading method. International Journal of AutomotiveTechnology, 13(1), 109–122. doi:10.1007/s12239-012-0010-y
Krogstie, L., Ebro, M., & Howard, T. J. (2014). How to implement and apply robust design: Insightsfrom industrial practice. Total Quality Management & Business Excellence, 1–19. doi:10.1080/14783363.2014.934520
20 S.M. Gohler et al.
Dow
nloa
ded
by [
DT
U L
ibra
ry]
at 0
1:27
30
May
201
6
Lijuan, S., Jun, Y., & Yu, Z. (2011). An integration design optimization framework of robust design,axiomatic design, and reliability-based design. Quality and Reliability EngineeringInternational, 27, 959–968. doi:10.1002/qre.1188
Matthiassen, B. (1997). Design for robustness and reliability: Improving the quality consciousnessin engineering design. Kongens Lyngby, Denmark: Technical University of Denmark..
Mørup, M. (1993). Design for quality. Kongens Lyngby, Denmark: Technical University ofDenmark.
Pahkamaa, A., Warmefjord, K., Karlsson, L., Soderberg, R., & Goldak, J. (2012). Combining vari-ation simulation with welding simulation for prediction of deformation and variation of a finalassembly. Journal of Computing and Information Science in Engineering, 12, 021002. doi:10.1115/1.4005720
Pahl, G., Beitz, W., Feldhusen, J., & Grote, K-H. (2007). Engineering design: A systematic approach(A NASA STI/Recon Technical Report). Springer Science & Business Media. doi:10.1007/978-1-84628-319-2
Saha, A., & Ray, T. (2011). Practical robust design optimization using evolutionary algorithms.Journal of Mechanical Design, 133, 101012. doi:10.1115/1.4004807
Schleich, B., Walter, M., Wartzack, S., Anwer, N., & Mathieu, L. (2012). A comprehensive frame-work for skin model simulation. Proceedings of the ASME 2012 11th Biennial Conference onEngineering Systems Design and Analysis, Nantes, France, pp. 567–576.
Soderberg, R., Lindkvist, L., & Carlson, J. S. (2006). Managing physical dependencies throughlocation system design. Journal of Engineering Design, 17(4), 325–346. doi:10.1080/09544820500275685
Steenackers, G., Versluys, R., Runacres, M., & Guillaume, P. (2011). Reliability-based designoptimization of computation-intensive models making use of response surface models.Quality and Reliability Engineering International, 27, 555–568. doi:10.1002/qre.1166
Suh, N. P. (2001). Axiomatic design: Advances and applications. New York, NY: Oxford UniversityPress.
Summers, J. D., & Shah, J. J. (2010). Mechanical engineering design complexity metrics: Size, coup-ling, and solvability. Journal of Mechanical Design. doi:10.1115/1.4000759
Taguchi, G., Chowdhury, S., & Wu, Y. (2005). Taguchi’s quality engineering handbook. Hoboken,NJ: John Wiley & Sons.
Tang, Y., Chen, J., & Wei, J. (2012). A sequential algorithm for reliability-based robust designoptimization under epistemic uncertainty. Journal of Mechanical Design, 134, 014502.doi:10.1115/1.4005442
Thornton, A. C. (2004). Variation risk management: Focusing quality improvements in productdevelopment and production. Hoboken, NJ: John Wiley & Sons.
Thornton, A. C., Donnelly, S., & Ertan, B. (2000). More than just robust design: Why product devel-opment organizations still contend with variation and its impact on quality. Research inEngineering Design. doi:10.1007/s001630050028
Welch, W. J., Yu, T-K., Kang, S. M., & Sacks, J. (1990). Computer experiments for quality controlby parameter design. Journal of Quality Technology, 22, 15–22.
Yadav, O. P., Bhamare, S. S., & Rathore, A. (2010). Reliability-based robust design optimization: Amulti-objective framework using hybrid quality loss function. Quality and ReliabilityEngineering International, 26, 27–41. doi:10.1002/qre.1027
Yang, C., & Du, X. (2014). Robust design for multivariate quality characteristics using extremevalue distribution. Journal of Mechanical Design, 136. doi:10.1115/1.4028016
Yang, G. (2007). Reliability improvement through robust design. In Life cycle reliability engineering(pp. 122–193). Hoboken, NJ: John Wiley & Sons. doi:10.1002/9780470117880.ch5
Total Quality Management 21
Dow
nloa
ded
by [
DT
U L
ibra
ry]
at 0
1:27
30
May
201
6


Simon Moritz G€ohler1
Department of Mechanical Engineering,
Technical University of Denmark,
Produktionstorvet,
Building 426,
Kongens Lyngby 2800, Denmark
e-mail: [email protected]
Tobias EiflerDepartment of Mechanical Engineering,
Technical University of Denmark,
Produktionstorvet,
Building 426,
Kongens Lyngby 2800, Denmark
e-mail: [email protected]
Thomas J. HowardDepartment of Mechanical Engineering,
Technical University of Denmark,
Produktionstorvet, Building 426,
Kongens Lyngby 2800, Denmark
e-mail: [email protected]
Robustness Metrics:Consolidating the MultipleApproaches to QuantifyRobustnessThe robustness of a design has a major influence on how much the product’s performancewill vary and is of great concern to design, quality, and production engineers. While vari-ability is always central to the definition of robustness, the concept does contain ambigu-ity, and although subtle, this ambiguity can have significant influence on the strategiesused to combat variability, the way it is quantified and ultimately, the quality of the finaldesign. In this contribution, the literature for robustness metrics was systematicallyreviewed. From the 108 relevant publications found, 38 metrics were determined to beconceptually different from one another. The metrics were classified by their meaningand interpretation based on the types of the information necessary to calculate the met-rics. Four different classes were identified: (1) sensitivity robustness metrics; (2) size offeasible design space robustness metrics; (3) functional expectancy and dispersionrobustness metrics; and (4) probability of compliance robustness metrics. The goal wasto give a comprehensive overview of robustness metrics and guidance to scholars andpractitioners to understand the different types of robustness metrics and to remove theambiguities of the term robustness. By applying an exemplar metric from each class to acase study, the differences between the classes were further highlighted. These classesform the basis for the definition of four specific subdefinitions of robustness, namely the“robust concept,” “robust design,” “robust function,” and “robust product.”[DOI: 10.1115/1.4034112]
Keywords: robust design, robustness, sensitivity, metric, classification, review
1 Introduction
There is much need to clarify the term robustness. Whilerobustness is a property of a design or product that is consideredof great importance in many industries, the term robustness willseldom appear in a requirement specification, partly due to itsambiguity, confusion, and misrepresentation. The term has a com-pletely different meaning in common parlance, where consumerswill often consider it to be synonymous with strength or durabil-ity. In this article, we seek to remove the ambiguity surroundingthe technical interpretation of robustness, which is broadly consid-ered by engineers as a property that reduces variability. “RobustDesign” (verb) is, therefore, a methodology for designing prod-ucts, devices, and production equipment to perform as intended,despite variation in manufacturing, assembly, material properties,ambient conditions, loading scenarios, or time-related factors[1–3]. Unlike the majority of design and analysis techniques thatare based on nominal values [1], Robust Design provides an eco-nomical approach to address product quality in complement to thecontrol of manufacturing performance by means of production-focused quality initiatives, such as total quality management, leanmanufacturing, or Six Sigma.
While the basic paradigm and the fundamental benefits ofrobust design are widely accepted by scholars and practitioners,the implementation of a consistent robust design strategy is cum-bersome for many organizations [4–6]. Robust design is a very
tool/method-centric discipline with vaguely a defined robustdesign process [7], and as a consequence, only experts know whatto apply and when. Furthermore, the term robustness is frequentlyused almost interchangeably with sensitivity in a wide rangeof related, but not clearly delimited research areas, such assensitivity analysis, computational model building, optimization,etc., [8–10].
A reason for the lack of coherence in terminology is perhapsdue to the broad range of robust design activities, from systematicidentification of key characteristics [11] through benchmark andcomparison of products and processes [2,12,13] to the optimiza-tion of robustness and computer-aided tolerancing [8]. Such activ-ities require metrics and indicators that typically differ to suitthe activity and are frequently not straight forward to interpret.Previous reviews of robustness optimization techniques indirectlydiscuss different robustness metrics, however, without reflectingon the different implications of the choice of specific metrics foroptimization [8,14–16].
To foster a better understanding of the wide range of availableapproaches to quantify robustness, this research addresses theambiguity surrounding the term robustness. The goal of thisreview is to classify robustness metrics based on their meaningand interpretation.
The remainder of this article is organized as follows. The searchcriteria and review process for the systematic literature review isdescribed in Sec. 2. In order to organize the metrics uncovered, atheoretical framework is proposed underpinned by the informationentities relevant to the basic robust design paradigm in Sec. 3. Theunique robustness metrics are then classified and analyzed inSec. 4, and exemplar metrics from each class are described andapplied to a case example to illustrate the differences. In Sec. 5,
1Corresponding author.Contributed by the Design Automation Committee of ASME for publication in
the JOURNAL OF MECHANICAL DESIGN. Manuscript received February 29, 2016; finalmanuscript received July 7, 2016; published online September 12, 2016. Assoc.Editor: Zissimos P. Mourelatos.
Journal of Mechanical Design NOVEMBER 2016, Vol. 138 / 111407-1Copyright VC 2016 by ASME
Downloaded From: http://mechanicaldesign.asmedigitalcollection.asme.org/ on 09/14/2016 Terms of Use: http://www.asme.org/about-asme/terms-of-use

the verification and validity of the classification scheme as well asthe interpretation of the different classes with respect to differentfacets of robustness are discussed, before concluding the resultsand the potential of this research in Sec. 6.
2 Systematic Literature Review Process
The quantification of parameter sensitivities plays a large rolein almost all scientific fields that use models to describe, analyze,and predict phenomena and synthesize products and systems. As aresult, there exist a very large number of scientific manuscripts onsensitivity analysis and metrics with focus on special applicationscenarios. However, the concept of robustness is not entirely con-gruent with that of sensitivity. Since these terms are often used asantonyms of one another, a thorough review of the related metricsmay help with clarifying the distinction between the terms.
For this purpose, a systematic literature review [17] wasconducted to create a comprehensive collection of robustness andsensitivity metrics that can be used in the realm of robust design.The objective of this extraction was to collect as many fundamen-tally different metrics as possible. Throughout this article the termmetric will be used and is unless otherwise stated referring to ameasure or quantification of the robustness of a design or product.A review protocol was established prior to the study to ensure arigorous execution [17].
To establish a general understanding of robustness and sensitiv-ity metrics, six primary publications were reviewed covering sen-sitivity analysis in general terms [9,10,18] and focused onsampling-based methods [19] as well as sensitivity indices partic-ularly for the use in robust design [13,20]. Based on this initialreview, the relevant keywords and search strings for the studywere defined as follows:
� robust design, robust engineering, robustness to variation,design for robustness, robust product design, Taguchi, sensi-tivity to variation, insensitivity to variation, sensitive to vari-ation, insensitive to variation, functional variationAnd
� indicator, indicator" OR “quantifier” OR “metric” OR“sensitivity measure” OR “index” OR “indices” OR“sensitivity information” OR “score”
To include potential metrics outside of the field of robust designbut yet applicable for this purpose, a second search for reviews ofsensitivity analysis methods in general has been conducted. Assources, the databases of Scopus and Web of Science wereselected due to their comprehensive collection of scientific articlesrelevant to this research. The search was limited to peer-reviewedjournal articles to ensure a high level of quality. Furthermore,only publications in the english language and in the field of engi-neering were considered. The inclusion criteria were the proposal,application, or review of robustness metrics to evaluate the robust-ness/sensitivity to variation. Excluded were studies on robustnessoptimization and process capabilities that did not specificallydescribe novel ways and ideas to describe robustness.
For each of the different robustness metrics the mathematicaldescription was taken from the article in order to gain a true
understanding of the metric which was less reliant on the authors’terminology or explanation. Overall, the terminology used in theliterature is very inconsistent. Every metric was only recordedonce by discarding duplicates and minor variations of a metric. Aminor variation of a metric would be one which only differs fromanother metric in the way the normalizing or averaging is con-ducted for example. Table 1 shows the extraction statistics of thesystematic literature review. At the end of the selection process,90 relevant articles were identified. The list of references alsoincludes 18 additional references that were identified during read-ing for extensions and clarification of metrics. The review revealed38 different metrics for robustness (Table 5 in the Appendix).
3 Theoretical Framework
While robustness metrics have a very broad range of applica-tions in all areas, in this article, the review is conducted in thecontext of product development and engineering design. The clas-sic categorization of robust design methods and metrics has beendone differentiating between different types and sources of uncer-tainties. Historically, there is a distinction made between type Iand type II robust design addressing variations in noise factors(uncontrollable) and design parameters (DP) (controllable),respectively [21]. A third type was introduced later by Allen et al.[22] to include variability and uncertainty in the system models. Afourth type was mentioned by Beyer and Sendhof [8] addressingthe “uncertainties concerning the fulfillment of constraints thedesign variables must obey”. These uncertainties can further becategorized being deterministic, probabilistic (aleatory), or possi-bilistic (epistemic) in nature [8]. Aleatory uncertainty is the“stochastic intrinsic variability associated with a physical systemor environment.” The epistemic uncertainty is related to incom-plete knowledge [23].
In this study, the transfer function model (TFM), as describedin robust design methodology, was selected as a basis for the anal-ysis of the metrics. The TFM is a means to relate DPs (and noisefactors) to the functional performance and is used effectively topromote good design practice in Axiomatic Design [24] and theVariation Management Framework [25].
Figure 1 shows the classical representation of describing thepropagation of variation from the physical domain to the func-tional domain. The different entities are as follows:
(1) A model or an experiment. When using a model, the rela-tions within the process need to be understood in order tocalculate the robustness, whereas using an experimenttreats the process as a black box taking just inputs and out-put to calculate sensitivities.
(2) Functional specification limits or quality loss characteris-tics defined by the voice of the customer and the businessunit’s profile for the product.
(3) Quantified ingoing variation or uncertainty, such as DPvariation, capability data, and variation in use case ornoise described in the mission profile (deterministic orprobabilistic). The incorporation of epistemic uncertaintybears further challenges to uncertainty modeling utilizing
Table 1 Extraction statistic of the systematic literature review
Database Scopus Web of Science
Searchstrings
Robust designa
þ indicatorsa“Sensitivity analysismethods”þ review
Robust designa
þ indicatorsa“Sensitivity analysismethods”þ review
Total hits 252 38 418 34Extracted 55 16 36 12
#Total unique references 90 (Scopus/ISI WoS)þ 18 (additional sources)
aSearch strings as described in the text.
111407-2 / Vol. 138, NOVEMBER 2016 Transactions of the ASME
Downloaded From: http://mechanicaldesign.asmedigitalcollection.asme.org/ on 09/14/2016 Terms of Use: http://www.asme.org/about-asme/terms-of-use
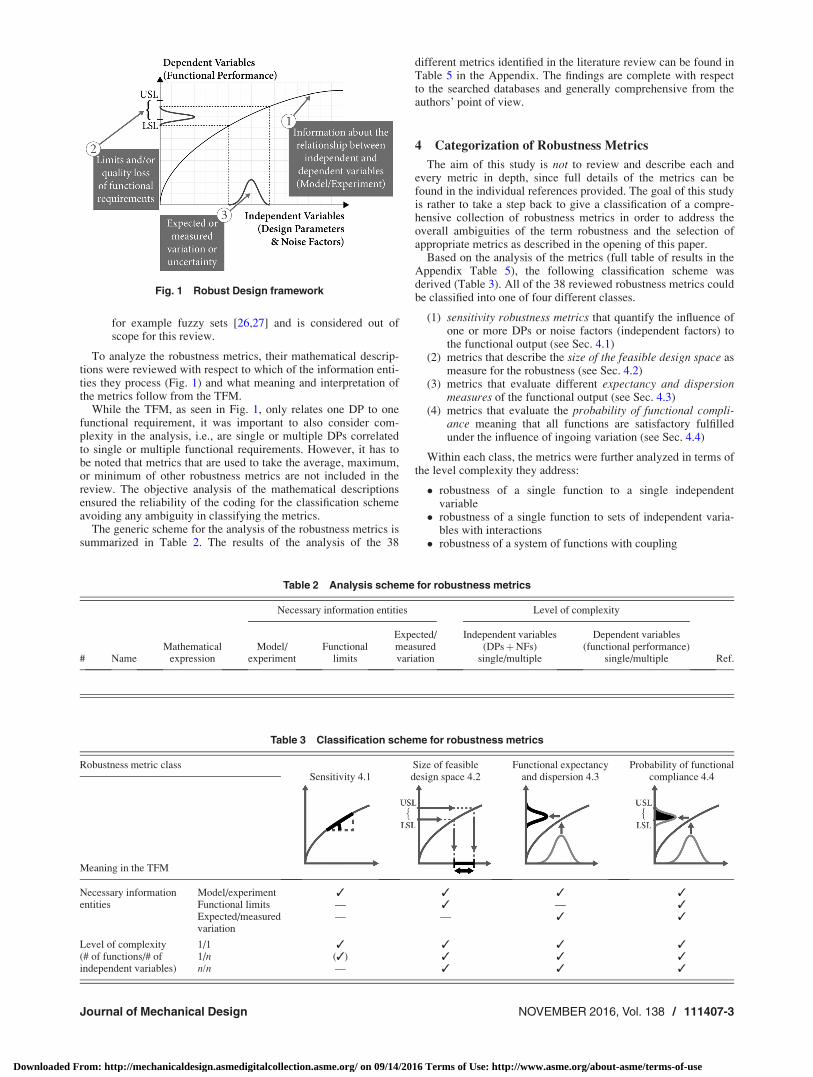
for example fuzzy sets [26,27] and is considered out ofscope for this review.
To analyze the robustness metrics, their mathematical descrip-tions were reviewed with respect to which of the information enti-ties they process (Fig. 1) and what meaning and interpretation ofthe metrics follow from the TFM.
While the TFM, as seen in Fig. 1, only relates one DP to onefunctional requirement, it was important to also consider com-plexity in the analysis, i.e., are single or multiple DPs correlatedto single or multiple functional requirements. However, it has tobe noted that metrics that are used to take the average, maximum,or minimum of other robustness metrics are not included in thereview. The objective analysis of the mathematical descriptionsensured the reliability of the coding for the classification schemeavoiding any ambiguity in classifying the metrics.
The generic scheme for the analysis of the robustness metrics issummarized in Table 2. The results of the analysis of the 38
different metrics identified in the literature review can be found inTable 5 in the Appendix. The findings are complete with respectto the searched databases and generally comprehensive from theauthors’ point of view.
4 Categorization of Robustness Metrics
The aim of this study is not to review and describe each andevery metric in depth, since full details of the metrics can befound in the individual references provided. The goal of this studyis rather to take a step back to give a classification of a compre-hensive collection of robustness metrics in order to address theoverall ambiguities of the term robustness and the selection ofappropriate metrics as described in the opening of this paper.
Based on the analysis of the metrics (full table of results in theAppendix Table 5), the following classification scheme wasderived (Table 3). All of the 38 reviewed robustness metrics couldbe classified into one of four different classes.
(1) sensitivity robustness metrics that quantify the influence ofone or more DPs or noise factors (independent factors) tothe functional output (see Sec. 4.1)
(2) metrics that describe the size of the feasible design space asmeasure for the robustness (see Sec. 4.2)
(3) metrics that evaluate different expectancy and dispersionmeasures of the functional output (see Sec. 4.3)
(4) metrics that evaluate the probability of functional compli-ance meaning that all functions are satisfactory fulfilledunder the influence of ingoing variation (see Sec. 4.4)
Within each class, the metrics were further analyzed in terms ofthe level complexity they address:
� robustness of a single function to a single independentvariable
� robustness of a single function to sets of independent varia-bles with interactions
� robustness of a system of functions with coupling
Fig. 1 Robust Design framework
Table 2 Analysis scheme for robustness metrics
Necessary information entities Level of complexity
# NameMathematical
expressionModel/
experimentFunctional
limits
Expected/measuredvariation
Independent variables(DPsþNFs)
single/multiple
Dependent variables(functional performance)
single/multiple Ref.
Table 3 Classification scheme for robustness metrics
Robustness metric classSensitivity 4.1
Size of feasibledesign space 4.2
Functional expectancyand dispersion 4.3
Probability of functionalcompliance 4.4
Meaning in the TFM
Necessary informationentities
Model/experiment � � � �Functional limits — � — �Expected/measuredvariation
— — � �
Level of complexity(# of functions/# ofindependent variables)
1/1 � � � �1/n (�) � � �n/n — � � �
Journal of Mechanical Design NOVEMBER 2016, Vol. 138 / 111407-3
Downloaded From: http://mechanicaldesign.asmedigitalcollection.asme.org/ on 09/14/2016 Terms of Use: http://www.asme.org/about-asme/terms-of-use

The different classes will be explained in the following, includ-ing the application of one robustness metric of each class on theexample of the Toyota gas pedal case.
4.1 Example—Toyota Gas Pedal. One of most extensiverecalls in automotive history occurred in 2009/10, when the carmanufacturer Toyota had to recall several million cars due to anoverly sensitive gas pedal which in some instances failed to returnafter being pressed causing the vehicle to continually accelerate,resulting in numerous serious accidents and fatalities [28]. Themechanism of the gas pedal is supposed to limit the torquerequired by the driver to hold the pedal in a constant position.This function is realized by a rocker that creates a friction on thepedal head to damp the return moment driven by a spring mountedbetween the other side of the rocker and the pedal. A simplifieddescription of the problem (Fig. 2) will be used as an example toshow the differences between the different classes of robustnessmetrics.
The return moment M is a function of the dimensions a, b, c, d,s, the coefficient of friction lf, and the spring constant k and canbe derived using the balance of forces and moments. This givesfollowing simplified expression for the return moment:
M ¼ Fspring � b� c
d� lf � a
� �with Fspring ¼ k � s (1)
M always needs to be greater than zero to ensure a release ofthe throttle and below 500 N mm to limit the effort for the driverto push the throttle. A second functional requirement shall be theintegrity of the friction shoe, where the bending stress rb needs tobe below the material’s yield stress rmax at all times to prevent afailure. A simplified analytical expression for the bending stresscan be written as follows, where w and h are the width and theheight of the friction shoe, respectively
rb ¼6 � Fspring � c
w � h2(2)
Table 4 summarizes the nominal dimensions and the expected(manufacturing) variation. Note that while the model for themechanism is an accurate description, the limits and dimensionshave been fabricated for example purposes.
4.2 Sensitivity Robustness Metrics. Sensitivity measuresplay an important role in model building and corroboration aswell as parameter prioritization [9]. They also build the simplestform of robustness metric and are a well-established way to relatethe change of an independent variable to the change of a depend-ent variable. In the context of engineering design, this relates tothe correlation between DPs or noise factors as independent/inputvariables to the functional requirements (dependent/output varia-bles). The metrics are based on the evaluation of finite quotientsof the form
f x1ð Þ � f x2ð Þx1 � x2
orf xþ Dð Þ � f xð Þ
D(3)
For the limit of the interval D! 0, the latter expression yieldsthe formal definition of the derivative of a function f toward avariable x (Eq. (4)). In the case of multiple independent variables,it becomes the partial derivative (Eq. (5))
f0 xð Þ ¼ limD!0
f xþ Dð Þ � f xð ÞD
(4)
@f Xð Þ@xi
¼ limD!0
f x1;…; xi þ D;…; xnð Þ � f Xð ÞD
(5)
The robustness metrics in this class are either point or rangebased, which induces certain assumptions and limitations thatshall not be further discussed here. There are numerous ways tonormalize the metrics to make the measures comparable betweendifferent functions and variables.
A simple example for this category is the nominal-range sensi-tivity (NRS) metric. For the gas pedal example introduced earlier,the metric yields 2.6 for the dimension d with a 5% variationinterval (Eq. (6)).
NRSd ¼
k � s � b� c
d � 1þ 0:05ð Þ � l � a� �
Mnominal
� 1
0:05� 2:6 (6)
The NRS describes the amplifying or damping effect of aparameter toward a function. In this case, a variation in the dimen-sion d leads to a relative change in the return moment that is �2.6times larger than the ingoing variation for d.
Sensitivity robustness metrics are independent of accurate(realistic) information about variation in the independent variables(information entity 3 Fig. 1). However, range-based metricsrequire bounds for the evaluation which are in some cases takenfrom the expected variation but don’t have to be. Also, no infor-mation about requirements (functional limits) is necessary (infor-mation entity 2 Fig. 1).
Sensitivity robustness metrics usually evaluate the robustnessof one function with respect to one independent variable (DP ornoise factor). The coefficients in linear regression modeling whichbelong to this class of robustness metrics can (in a limited fash-ion), however, also be derived for interaction effects with multipleindependent variables. There are no metrics in this categoryaddressing multiple functions other than taking the minimum,maximum, or any kind of average neglecting interaction effects.
Fig. 2 Schematic diagram of the Toyota gas pedal [28] (Cour-tesy of Guardian News & Media, Ltd.)
Table 4 Nominal dimensions and material properties andvariation data for the Toyota gas pedal input parameters
Nominal Estimated variation (6) Probability distribution
a 10 mm 0.04 mm Normalb 16 mm 0.0483 mm Normalc 10 mm 0.04 mm Normald 6 mm 0.035 mm Normalk 4 N/mm 1 N/mm Uniforms 16 mm 0.1 mm Normallf 0.7 0.5 Uniformw 4 mm 0.03 mm Normalh 5 mm 0.032 mm Normalrmax 50 MPa 5 MPa Normal
111407-4 / Vol. 138, NOVEMBER 2016 Transactions of the ASME
Downloaded From: http://mechanicaldesign.asmedigitalcollection.asme.org/ on 09/14/2016 Terms of Use: http://www.asme.org/about-asme/terms-of-use

Summary:
Necessary information entities
Level of complexity(# of functions/# of
independent variables)
Model/experiment
Functionallimits
Expected/measured variation
1 / 1 1 / n n / n
� – – � (�) –
4.3 Size of Feasible Design Space Robustness Metrics. Thisclass of robustness metrics is based upon the evaluation of the sizeof the feasible design space. The metrics require in addition toinformation about the relationship between independent anddependent variables (information entity (1)), the functional limits(information entity (2)). They, therefore, put sensitivities into per-spective to the requirements on the associated function. Functionscan be extremely sensitive when evaluating robustness using themeasures presented in 4.1 but yet could be robust in the sense thatthe requirements on the associated function are rather loose.
Two principles are behind the robustness metrics in this class.The first addresses the question of how much variation (across allindependent variables) can be allowed ensuring that the functionwill always be within the limits, i.e., what is the closest “distance”to the most constraining limit?
The second principle is measuring the entire feasible designspace as a metric for robustness. This relates to a distance,area, volume, and polyhedron volume in 1D, 2D, 3D, and nD,respectively. The first principle is dependent on the nominalconfiguration and reflects a pessimistic approach; the latter isindependent of the nominal and reflects an averaging approachto measure robustness. Size of feasible design space robustnessmeasures is generally independent of information about thevariation in the ingoing parameters. However, metrics like theMahalanobis distance [29] use variance–covariance matrices toalso address the likelihood of violating a constraint. In thatcase, the distance is scaled with the magnitude of the varianceand covariance.
In the one-dimensional case that the size of the feasible designspace is to be derived for one independent variable x toward onefunctional requirement f(x) with an upper and lower specificationlimit, the calculation reduces to the trivial expressions:
1) Robustness radius:
rR ¼ minðjðxjf ðxÞ ¼ fmaxÞ � xnominalj; jðxjf ðxÞ ¼ fminÞ � xnominaljÞ(7)
2) Feasible space:
Vol ¼ jðxjf ðxÞ ¼ fmaxÞ � ðxjf ðxÞ ¼ fminÞj (8)
Figure 3 visualizes the difference between the two concepts ofrobustness measures in this class. On the one hand, the distancefrom the nominal to the closest constraint, and on the other hand,the total feasible design space is shown.
In the 1D case with the independent variable being a DP, thismetric can directly be compared to the associated productioncapabilities to determine the expected yield. Interactions and addi-tive effects are not considered. The metrics can be used to com-pare the influences of independent variables on the function.
For the example of the Toyota gas pedal and its return moment,the size of the feasible design space of the dimension d neglectinginteraction and additive effects is
rRd¼ minðjðdjf ðdÞ ¼ fmaxÞ � xnominalj; jðdjf ðdÞ ¼ fminÞ � xnominaljÞ¼ minðj8:55 mm� 6 mmj; j4:375 mm� 6 mmjÞ ¼ 1:625 mm
(9)
Vold ¼ jðxjf ðxÞ ¼ fmaxÞ � ðxjf ðxÞ ¼ fminÞj¼ 8:55 mm� 4:375 mm ¼ 4:175 mm (10)
The dimension d is, therefore, allowed to vary by 1.625 mm inthe worst case. The total allowed variation is 4.175 mm. Theresults have a direct influence on the setting of tolerances and thequestion whether those need to be symmetric.
For the multi-dimensional and multi-functional requirementproblem, the robustness radius can be calculated analogously; forexample, using the definition of the Euclidean distance
rR ¼ min
ffiffiffiffiffiffiffiffiffiffiffiffiffiffiffiffiffiffiffiffiffiffiffiffiffiffiffiffiffiffiffiffiffiffiffiffiffiffiffiffiffiffiffiffiffiffiffiffiffiffiffiffiffiffiffiffiffiffiffiffiffiffiffiffiffiffiXn
i
ðxnominali � ðxijf ðXÞ ¼ flimitÞÞ2s0@
1A (11)
The volume of the feasible space, which Suh calls design range[24], for n independent variables and n functional requirements isa metric that describes the entire solution space that fulfills theconstraints imposed onto the design by the functional require-ments. This volume can be empty if there is no solution or infiniteif one or more independent variables are unbounded. In the lattercase, it makes sense to constrain the independent variables toreasonable values. Furthermore, the volume is dependent on thenumber and selection of DPs. Figure 4 shows an example in thecase of 2 DPs and 2 functional requirements.
Frey et al. [30] discuss various methods to compute the volumeof this polytope that forms the feasible design space. One of themis a method proposed by Lasserre [31], which evaluates a set oflinear inequalities of the form Ax � b
Fig. 3 Size of feasible design space robustness measure (1D) Fig. 4 Example for a feasible design space in 2D
Journal of Mechanical Design NOVEMBER 2016, Vol. 138 / 111407-5
Downloaded From: http://mechanicaldesign.asmedigitalcollection.asme.org/ on 09/14/2016 Terms of Use: http://www.asme.org/about-asme/terms-of-use

Vol n;A; bð Þ ¼ 1
n
Xm
p¼1
bp
jAp;qj� Vol n� 1; ~A; ~b
� �(12)
The calculation is done recursively with ~Ax � ~b representingthe system reduced by xq,where the indices m, n are the dimen-sions of the matrix A. Using Lasserre’s theorem for the Toyotagas pedal case with the two functional requirements of the returnmoment and the bending stress yields a feasible space of
Vol � 7500 Nmm6 (13)
This volume of the feasible space is independent of the nominalconfiguration of the DPs which means that it cannot be used forparameter design optimization. However, the metric can be usedto determine the influence of a constraint and to compare designswith a similar composition of influencing DPs. Further, the valuecan be normalized with the system range to make it comparablebetween designs or to calculate the likelihood of fulfilling therequirements under the assumption of uniform distribution of theDPs [30].
The metrics based upon allowed variation give the possibilitiesto analyze not only the robustness of a function toward a singleand sets of independent variables but also the robustness of aproduct or system consisting of multiple functions that need to befulfilled simultaneously. The information about couplings isimplicitly included in the formulation of the constraints imposedby the functional requirements.
Summary:
Necessary information entities
Level of complexity(# of functions/# of
independent variables)
Model/experiment
Functionallimits
Expected/measuredvariation
1 / 1 1 / n n / n
� � – � � �
4.4 Functional Expectancy and Dispersion RobustnessMetrics. The robustness metrics of this class are based on theevaluation of the two statistical moment measures expectancy anddispersion (variance) to describe the robustness of a function. Forexample, robust design pioneer Taguchi proposed the Signal-to-Noise ratio as robustness metric which builds upon the relatedideas of quality loss and the mean square deviation [1,2,12],which again refer to the expectancy and variance of the functionalperformance. As opposed to metrics based on the size of the feasi-ble design space as described in 4.2, these metrics do not requireinformation about the functional requirements (limits).
To evaluate the expected functional performance, variance, andassociated robustness metrics in this category, a model or experi-ment and probabilistic information (in the form of probabilitydensity functions) of the stochastic variation of the independentvariables (DP and noise factors) are necessary (informationentities (1) and (3)). However, “calculating these measures [func-tional expectancy and variance] analytically is almost alwaysimpossible” [8]. An alternative way is, therefore, to use approxi-mations usually using Taylor expansion [32]. In the case that mea-surement data are available for the performance of a function orcan be generated by an experiment or an adequate surrogatemodel, the expectancy and dispersion measures can be calculatedfrom the data samples. The ingoing variation can either be natural(known or unknown from the observed process) or estimated. Themean, variance, and standard deviation can be calculated as fol-lows (Eqs. (14)–(16), respectively):
lðyÞ ¼ð
f ðXÞ � pðXÞdX (14)
VðyÞ ¼ððf ðXÞ � EðyÞÞ2 � pðXÞdX (15)
r ¼ffiffiffiffiVp¼
ffiffiffiffiffiffiffiffiffiffiffiffiffiffiffiffiffiffiffiffiffiffiffiffiffiffiffiffiffiffiffiffiffiffiffiffiffiffiffiffiffiffiffiffiffiffiffiffiffiffiffiffiððf ðXÞ � EðyÞÞ2 � pðXÞdX
s(16)
In classical robustness optimization algorithms, the mean’s dis-tance to the target and the variance of a function are optimizedsimultaneously, where weighting factors determine the prioritiza-tion between these two objectives. If the maximum and minimumvariations of the independent variables are known, for example,due to quality control and subsequent scrap, the probabilisticproblem becomes a deterministic one and the maximum spread ofthe function performance can be calculated.
Functional expectancy and dispersion robustness metrics can beevaluated to describe the robustness of a function overall and to vari-ation in single or sets of independent variables (DPs or noise factors).In those cases, the conditional expectancy or variance is calculated.
To illustrate these different levels consider again the case of theToyota gas pedal case. To determine the influence of the dimensionh on the bending stress of the friction shoe, or in other words todetermine the robustness of the part integrity toward variation in thedimension h, the conditional variance can be calculated as the varia-tion of the average of the bending stress for constant values of h
VhðE�hðrbjhÞÞ ¼ 0:3ðMPaÞ2 (17)
From the analysis of variance (ANOVA), high-dimensionalmodel representation (HDMR) decomposition follows that the sumof all conditional variances—of the main effects plus all existinginteractions effects—gives the total variance of the function [9]
VðyÞ ¼Xn
i¼1
Vi þXn�1
i¼1
Xn
j¼iþ1
Vij þ � � � þ V12…n (18)
VðrbÞ ¼ 31:1 ðMPaÞ2 (19)
VðMreturnÞ ¼ 98434 ðN mmÞ2 (20)
The value of robustness metrics that are based on the expect-ancy measure indicates if a functional performance is on targetand can be used to calculate the bias. The variance on the otherhand—as calculated in Eqs. (19) and (20) for the bending stressand the return moment, respectively—is difficult to put into per-spective without knowledge about the functional requirementsand their quality loss away from the target. However, valid com-parisons of the robustness of two concepts or for different sets ofvariations in the independent variables are possible.
Summary:
Necessary information entities
Level of complexity(# of functions/# of
independent variables)
Model/experiment
Functionallimits
Expected/measuredvariation
1/1 1/n n/n
� — � � � �
4.5 Probability of Functional Compliance RobustnessMetrics. Robustness metrics belonging to this class evaluate theprobability that one or more functions fulfill their requirements
111407-6 / Vol. 138, NOVEMBER 2016 Transactions of the ASME
Downloaded From: http://mechanicaldesign.asmedigitalcollection.asme.org/ on 09/14/2016 Terms of Use: http://www.asme.org/about-asme/terms-of-use

under stochastic variation in the independent variables. For theassessment of the probabilities, detailed knowledge about thedependencies between independent variables and functions aswell as information about the functional limits (LSL and USL)and the variation of the independent variables in the form of prob-ability density functions is necessary (information entities (1), (2),and (3), respectively).
Under the assumption that the functional output is normally dis-tributed, the probability of functional compliance (or yield rate ina production setting) can directly be calculated from the mean andvariance. With knowledge about conditional variances, it is possi-ble to derive the probability of compliance of a function j depend-ing on the variation in single or sets of independent variables(Eqs. (21) and (22)). Further, in the case that the coupling betweenfunctions is known, the conditional probabilities can be derived tocalculate the joint probability, i.e., the likelihood of functionsbeing satisfactory fulfilled simultaneously (Eq. (23)). In that way,the robustness of multifunctional systems can be evaluated
Pij ¼ Pr½LSLj � fjðxiÞ � USLj� (21)
Pj ¼ Pr½LSLj � fjðXÞ � USLj� (22)
P ¼ Pr½LSLj � fjðXÞ � USLjjLSLk 6¼j � fk 6¼jðXÞ � USLk 6¼jj…�(23)
Taking the Toyota gas pedal with described dimensions andstochastic variations, the following probabilities and conditionalprobabilities can be calculated as examples to describe their impli-cations and differences:
Pr½rb � rmaxnom� ¼ 0:99 (24)
Pr½rb � rmax� ¼ 0:94 (25)
Pr½0 � Mreturn � Mreturnmax� ¼ 0:71 (26)
Pr½0 � Mreturn � Mreturnmaxjrb � rmax� ¼ 0:68 (27)
The probabilities in Eqs. (24) and (25) describe the likelihoodof the bending stress being below rmax as functional requirementneglecting and considering the variation in the yield stress, respec-tively. The difference of 5% relates to the increase in probabilityof functional compliance, if the yield stress was not subject to var-iation. Equation (26) describes the likelihood that the returnmoment is within the limits. Both, the probability of functionalcompliance for the bending stress and the return moment, wereevaluated independently without taking the coupling betweenthem into consideration. The last probability (Eq. (27)) is the con-ditional probability that both requirements are fulfilled simultane-ously, which is lower than the independent probabilities. Thisdemonstrates the error for the assumption of functionalindependence.
Summary:
Necessary information entities
Level of complexity(# of functions/# of
independent variables)
Model/experiment
Functionallimits
Expected/measuredvariation
1/1 1/n n/n
� � � � � �
5 Discussion
This section reflects on the verification and validation of theclassification scheme offered. This is followed by a summary of
the classes of robustness metrics in terms of their implications fordefining robustness.
5.1 Verification and Validation of Classification Scheme.By assessing the different robustness metrics by their meaning inthe TFM, it was possible to place them into the four classes with-out ambiguity. The fact that the classes were mutually exclusivemeaning that no metrics fit in more than one class is a sign of thestrength of the classification scheme and can be considered as aform of verification [33]. The classification scheme was alsodeemed verified in terms of its “completeness,” in the sense thatall metrics were able to be classified into one of the four classes.The fact that the classification scheme was derived from the TFMenables the metrics to be easily interpreted during the robustdesign process, thus ensuring the applicability of the scheme.
In extension to this theoretical verification, the validity of theclassification scheme was furthermore evaluated based on theexample of the Toyota gas pedal. Its robustness could be easilyand clearly quantified using metrics from each of the four classes.It was found that the individual classes represent different inter-pretations and facets of robustness which have different fields ofapplication within robust design.
5.2 Facets of Robustness. The analysis of the differentrobustness metrics mentioned in literature revealed the fourclasses: sensitivity, size of the feasible design space, functionalexpectancy and dispersion, and Probability of functional compli-ance robustness metrics.
Sensitivity robustness metrics address the general robustness ofa concept independent of the specified functional requirementsand expected variation. The metrics measure the general capabil-ity of a design to dampen or amplify variation. This view onrobustness is favorable in earlier design stages when requirementsas well as mission profiles and means of production are stillunfixed and flexible. Especially, in the concept selection phase,quantified knowledge about the inherent robustness of the differ-ent design solutions is of high value.
Metrics from the class of size of feasible design space includeinformation about the final requirements which the functions areevaluated against. They quantify the design feasibility taking allfunctional requirements into consideration and measure, therefore,the robustness of a design itself, independent of the variation it isexposed to.
Robustness metrics using functional expectancy and dispersionmeasures, on the other hand, address the spread of the perform-ance of functions resulting from variation in the influencingfactors and, therefore, the robustness of a function.
Finally, robustness metrics using the probability of fulfillingthe functional requirements under the influence of variation mea-sure the robustness of the product itself and reflect the sum of thesensitivity, requirements, and ingoing variation.
6 Concluding Remarks and Outlook
In this contribution, we systematically reviewed the literature toextract all the different metrics to describe robustness in connec-tion with product development and engineering design. 38 uniquemetrics were identified and their mathematical descriptions ana-lyzed with respect to their required information and level ofaddressed complexity. The analysis revealed four distinct mean-ings of robustness metrics which describe four different facets ofquantifying robustness:
1. sensitivity robustness metrics! robustness of a concept2. size of the feasible design space robustness metrics !
robustness of a design3. functional expectancy and dispersion robustness metrics!
robustness of a function4. probability of functional compliance robustness metrics !
robustness of a product
Journal of Mechanical Design NOVEMBER 2016, Vol. 138 / 111407-7
Downloaded From: http://mechanicaldesign.asmedigitalcollection.asme.org/ on 09/14/2016 Terms of Use: http://www.asme.org/about-asme/terms-of-use

The authors believe that this categorization removes the ambi-guity of the term “robustness” ensuring an unambiguouscommunication allowing the formal introduction of robustnessrequirements to specification documents and design targets.
Another important contribution of this research is the list ofmetrics and how they are calculated which gives a comprehensiveoverview for scholars and practitioners of how robustness can bequantified. The choice of adequate metrics is especially importantfor simulation-based and computer-aided design and design opti-mization to ensure viable solutions. Also, the derivation of newmetrics can be guided and driven by the classification of metricsand the differentiation of facets of quantifying robustness pre-sented in this paper.
Further research is necessary to close the gap between theseobjective, quantifiable metrics to proxies (or leading indicators)that are based on good design practice [34,35], such as the variationrisk priority number [36,37], the number of over-constraints [3,38]as well as the contradiction index [39]. These proxies play a partic-ularly important role in early design phases where there are nomathematical descriptions of the functions available. The develop-ment of further proxies based on objective robustness metrics, asdescribed in this article, would be of high value for engineeringdesigners for the quick estimation of robustness without the needof high-fidelity models.
Acknowledgment
The authors would like to thank Novo Nordisk for their insightsand financial support of the DTU-NN robust design program.
Nomenclature
A0 ¼ maximum loss at variation D0
ANOVA ¼ analysis of varianceD ¼ diagonal matrix
DP ¼ design parameterE ¼ expected valuef ¼ function
FR ¼ functional requirementHDMR ¼ high-dimensional model representation
J ¼ Jacobian matrixLRL ¼ lower requirement limitLSL ¼ lower specification limitLTB ¼ larger-the-better requirement
m ¼ functional targetNF ¼ noise factor
NTB ¼ nominal-the-best requirementp(.) ¼ probability density function
Pr ¼ probabilitySTB ¼ smaller-the-better requirementTFM ¼ transfer function modelURL ¼ upper requirement limitUSL ¼ upper specification limit
V ¼ variationVol ¼ volume of n-dimensional polyhedron
w ¼ weighting factorxi ¼ ith independent variableX ¼ vector of i independent variablesy ¼ functional output, dependent variablek ¼ eigenvaluel ¼ meanr ¼ standard deviation
ra ¼ adjusted standard deviationDi ¼ perturbationR ¼ covariance matrix
Appendix
Tab
le5
Lis
to
fro
bu
stn
ess
metr
ics
Nec
essa
ryin
form
atio
nen
titi
esL
evel
of
com
ple
xit
y
#N
ame
Mat
hem
atic
alex
pre
ssio
nM
odel
/ex
per
imen
tF
unct
ional
lim
its
Expec
ted/
mea
sure
dvar
iati
on
Indep
enden
tvar
iable
s(s
ingle
/mult
iple
)
Dep
enden
tvar
iable
s(s
ingle
/mult
iple
)
Robust
nes
sm
etri
ccl
ass
Ref
eren
ce
1N
RS
rela
tive
toper
turb
atio
nN
RS
i¼
fx 1;…
;xi�
1þ
Di
ðÞ ;
…;x
nð
Þf
XðÞ
�1
Di
�—
—si
ngle
single
Sen
siti
vit
y[1
0]
2N
RS
abso
lute
NR
Si¼
fx 1;…
;xiD
1þ
Di
ðÞ ;
…;x
nð
Þf
XðÞ
�1
�� �1
00%
�—
—si
ngle
single
Sen
siti
vit
y[1
0]
3E
lem
enta
ryef
fect
s/nom
inal
infl
uen
ceE
Eab
si¼
1 r
Xr j¼1
jEE
j ijw
ithjE
Ej ij
¼f
x 1;…
;xi�
1þ
Dj
�� ;…
;xn
�� �
fXðÞ
x i�D
j
�—
—si
ngle
single
Sen
siti
vit
y[9
,40]
4P
arti
alder
ivat
ive
S i¼@
f
@x i
XðÞ
�—
—si
ngle
single
Sen
siti
vit
y[9
,13,2
0,4
1]
111407-8 / Vol. 138, NOVEMBER 2016 Transactions of the ASME
Downloaded From: http://mechanicaldesign.asmedigitalcollection.asme.org/ on 09/14/2016 Terms of Use: http://www.asme.org/about-asme/terms-of-use

Table 5. Continued
Necessary information entities Level of complexity
# Name Mathematical expressionModel/
experimentFunctional
limits
Expected/measuredvariation
Independentvariables
(single/multiple)
Dependentvariables
(single/multiple)
Robustnessmetricclass Reference
5 Normalized partialderivative/sensitivity
coefficient
Si mean ¼@f
@xiXð Þ � xi
f Xð Þ� — — single single Sensitivity [10,20,40]
Si Std ¼@f
@xiXð Þ �
r xið Þr fð Þ
� — (�) single single Sensitivity [10,13,40]
6 Importance factor
Ii ¼
@f
@xiXð Þ
� �2
XN
j¼1
@f
@xjXð Þ
� �2
� — — single single Sensitivity [42]
7 FAST Index
SðiÞxl ¼
Xp
jA ið Þpxlj
2 þ jB ið Þpxlj
2� �
Xj
jA ið Þj j
2 þ jB ið Þj j
2� �
� — — multiple single Sensitivity [9,43,44]
8 Regressioncoefficients
bi ¼
Xj
xij � lxið Þ � y� lyð Þ� � 2X
j
xij � lxið Þ2
� — (�) single/(multiple)
single Sensitivity [13,19,32]
9 Standardized regressioncoefficients
SRC y; xið Þ ¼ birxi
ry� — (�) single single Sensitivity [45]
10 Spearman robustnessindex SRI ¼ min
���� 1
qxi� bxi� lxi
���� � — (�) single single Sensitivity [19,46]
11 Spearman robustnessindex 2
SRI ¼ 1
rqrbxi�lxi
� — (�) single single Sensitivity [46]
12 Robustness indexg ¼ 1
N
XN
i¼1
f x1;…; xi � 1þ Dð Þ;…; xn
� �� f Xð Þ
f Xð Þ� — — single single Sensitivity [47]
13 Euclidean normof Jacobian
kJk2¼ffiffiffiffiffiffiffiffiffiffiffiffiffiffiffiffiffiffiffiffiffikmaxðATAÞ
p� — — multiple single Sensitivity [48,49]
14 Frobenius normof Jacobian
kJ kF¼X
i;j
jaijj2� �1
2 � — — multiple single Sensitivity [48]
15 Condition number j ¼kJ k2 k J�1 k 2 � — — multiple single Sensitivity [48–50]
16 Objective robustnessindex maxDp R Dpð Þ ¼
Xn
i¼1
���� fi X0 þ Dð Þ � fi Xð ÞDfi;limit
����" #1
2 � — — single single Sensitivity [51]
17 Euclidean distance(robustness radius)
rE ¼ minXj :ðfijðXjÞ¼fmaxÞV ðfijðXjÞ¼fminÞffiffiffiffiffiffiffiffiffiffiffiffiffiffiffiffiffiffiffiffiffiffiffiffiffiffiffiffiffiffiffiffiffiffiffiffiffiffiffiffiffiffiffiffiffiffiffiffiffiffiffiffiffiffiffiffiffi
ðXj � XnomÞD�1ðXj � XnomÞTq
� � — multiple multiple Feasibledesignspace
[52,53,54]
Jo
urn
alo
fM
ech
an
icalD
esig
nN
OV
EM
BE
R2016,V
ol.
138
/111407-9
Downloaded From: http://mechanicaldesign.asmedigitalcollection.asme.org/ on 09/14/2016 Terms of Use: http://www.asme.org/about-asme/terms-of-use

Table 5. Continued
Necessary information entities Level of complexity
# Name Mathematical expressionModel/
experimentFunctional
limits
Expected/measuredvariation
Independentvariables
(single/multiple)
Dependentvariables
(single/multiple)
Robustnessmetricclass Reference
18 Mahalanobisdistance
rM ¼ minXj :ðfijðXjÞ¼fmaxÞ V ðfijðXjÞ¼fminÞffiffiffiffiffiffiffiffiffiffiffiffiffiffiffiffiffiffiffiffiffiffiffiffiffiffiffiffiffiffiffiffiffiffiffiffiffiffiffiffiffiffiffiffiffiffiffiffiffiffiffiffiffiffiffiffiffi
ðXj � XnomÞR�1ðXj � XnomÞTq
� � — multiple multiple Feasibledesignspace
[29,52,55]
19 Feasible volumeVol n;A; bð Þ ¼ 1
n
Xm
p¼1
bp
jAp;qj� Volðn� 1; ~A; ~bÞ
� � — multiple multiple Feasibledesignspace
[30,53,56]
20 Min–max interval MMI ¼ fmax � fmin � — � multiple single Functionalexpectancy
and dispersion
[8,57]
21 Sensitivity index (2) SI ¼ fmax�fmin
fmax
� — � multiple single Functionalexpectancy
and dispersion
[32]
22 Percentile difference Dy95%5%¼ y95% � y5% � — � multiple single Functional
expectancyand dispersion
[58]
23 Variance VðyÞ ¼Ððf ðXÞ � EðyÞÞ2 � pðXÞdX � — � multiple single Functional
expectancyand dispersion
[8,9,13,19,59]
V yð Þ ¼Pni¼1
@f
@xi
� �2
V Xið Þ; for independent Xi
VðyÞ ¼Xn
i¼1
Vi þXn�1
i¼1
Xn
j¼iþ1
Vij þ � � � þ V12…n
ðvariance decomposition ðHDMRÞÞ
24 Standard deviationr ¼
ffiffiffiffiVp¼
ffiffiffiffiffiffiffiffiffiffiffiffiffiffiffiffiffiffiffiffiffiffiffiffiffiffiffiffiffiffiffiffiffiffiffiffiffiffiffiffiffiffiffiffiffiffiffiffiffiffiÐðf ðXÞ � EðyÞÞ2 � pðXÞdX
q� — � multiple single Functional
expectancyand dispersion
[9]
25 Conditional variance Vi1…is ¼ VXi1…isðEX�i1…is
ðyjXi1…isÞÞ � — � multiple single Functionalexpectancy
and dispersion
[9,43,44]
26 Sensitivity index/Sobol indexSi1…is ¼
Vi1…is
V
� — � multiple single Functionalexpectancy
and dispersion
[9,43]
27 Uncertainty importance Ii ¼ffiffiffiffiffiffiffiffiffiffiffiffiffiffiffiffiffiffiffiffiffiffiffiffiffiffiffiffiffiffiffiffiffiffiffiVðyÞ � E½VðyjxiÞ�
p� — � multiple single Functional
expectancyand dispersion
[9]
28 Design preference indexDPI ¼ E½PðyÞ� ¼
ðyþDy
y�Dy
PðyÞf ðyÞdy� — � multiple single Functional
expectancyand dispersion
[60]
111407-1
0/
Vol.
138,N
OV
EM
BE
R2016
Tra
nsactio
ns
of
the
AS
ME
Downloaded From: http://mechanicaldesign.asmedigitalcollection.asme.org/ on 09/14/2016 Terms of Use: http://www.asme.org/about-asme/terms-of-use
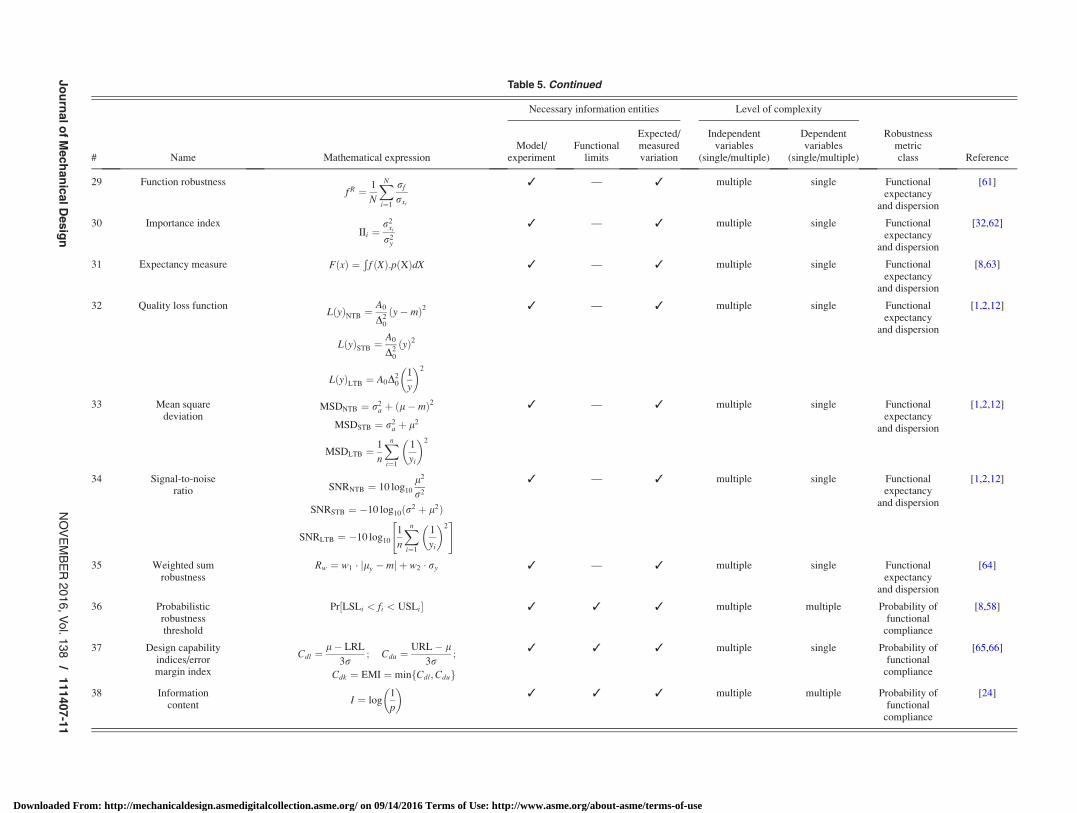
Table 5. Continued
Necessary information entities Level of complexity
# Name Mathematical expressionModel/
experimentFunctional
limits
Expected/measuredvariation
Independentvariables
(single/multiple)
Dependentvariables
(single/multiple)
Robustnessmetricclass Reference
29 Function robustnessf R ¼ 1
N
XN
i¼1
rf
rxi
� — � multiple single Functionalexpectancy
and dispersion
[61]
30 Importance indexIIi ¼
r2xi
r2y
� — � multiple single Functionalexpectancy
and dispersion
[32,62]
31 Expectancy measure FðxÞ ¼Ð
f ðXÞ:pðXÞdX � — � multiple single Functionalexpectancy
and dispersion
[8,63]
32 Quality loss functionLðyÞNTB ¼
A0
D20
ðy� mÞ2 � — � multiple single Functionalexpectancy
and dispersion
[1,2,12]
LðyÞSTB ¼A0
D20
ðyÞ2
LðyÞLTB ¼ A0D20
1
y
� �2
33 Mean squaredeviation
MSDNTB ¼ r2a þ ðl�mÞ2 � — � multiple single Functional
expectancyand dispersion
[1,2,12]
MSDSTB ¼ r2a þ l2
MSDLTB ¼1
n
Xn
i¼1
1
yi
� �2
34 Signal-to-noiseratio SNRNTB ¼ 10 log10
l2
r2
� — � multiple single Functionalexpectancy
and dispersion
[1,2,12]
SNRSTB ¼ �10 log10ðr2 þ l2Þ
SNRLTB ¼ �10 log10
1
n
Xn
i¼1
1
yi
� �2" #
35 Weighted sumrobustness
Rw ¼ w1 � jly �mj þ w2 � ry � — � multiple single Functionalexpectancy
and dispersion
[64]
36 Probabilisticrobustnessthreshold
Pr½LSLi < fi < USLi� � � � multiple multiple Probability offunctional
compliance
[8,58]
37 Design capabilityindices/errormargin index
Cdl ¼l� LRL
3r; Cdu ¼
URL� l3r
;
Cdk ¼ EMI ¼ min Cdl;Cduf g
� � � multiple single Probability offunctional
compliance
[65,66]
38 Informationcontent I ¼ log
1
p
� �� � � multiple multiple Probability of
functionalcompliance
[24]
Jo
urn
alo
fM
ech
an
icalD
esig
nN
OV
EM
BE
R2016,V
ol.
138
/111407-1
1
Downloaded From: http://mechanicaldesign.asmedigitalcollection.asme.org/ on 09/14/2016 Terms of Use: http://www.asme.org/about-asme/terms-of-use
References
[1] Taguchi, G., Chowdhury, S., and Wu, Y., 2005, Taguchi’s Quality EngineeringHandbook, Wiley, Hoboken, NJ.
[2] Phadke, M. S., 1989, Quality Engineering Using Robust Design, Prentice Hall,Englewood Cliffs, NJ.
[3] Ebro, M., Howard, T. J., and Rasmussen, J. J., 2012, “The Foundation forRobust Design: Enabling Robustness Through Kinematic Design and DesignClarity,” International Design Conference, DESIGN, Vol. DS 70, pp. 817–826.
[4] Gremyr, I., Arvidsson, M., and Johansson, P., 2003, “Robust Design Methodol-ogy: Status in the Swedish Manufacturing Industry,” Qual. Reliab. Eng. Int.,19(4), pp. 285–293.
[5] Thornton, A. C., Donnelly, S., and Ertan, B., 2000, “More Than Just RobustDesign: Why Product Development Organizations Still Contend With Variationand Its Impact on Quality,” Res. Eng. Des., 12(3), pp. 127–143.
[6] Krogstie, L., Ebro, M., and Howard, T. J., 2014, “How to Implement and ApplyRobust Design: Insights From Industrial Practice,” Total Qual. Manag. Bus.Excellence, 26(11–12), pp. 1–19.
[7] G€ohler, S. M., Ebro, M., and Howard, T. J., 2016, “Mechanisms and Coher-ences of Robust Design Methodology: A Robust Design Process Proposal,”Total Qual. Manage. Bus. Excellence, 3363, pp. 1–21.
[8] Beyer, H.-G., and Sendhoff, B., 2007, “Robust Optimization—A Comprehen-sive Survey,” Comput. Methods Appl. Mech. Eng., 196(33–34), pp. 3190–3218.
[9] Saltelli, A., Ratto, M., Andres, T., Campolongo, F., Cariboni, J., Gatelli, D.,Saisana, M., and Tarantola, S., 2008, Global Sensitivity Analysis: The Primer,Wiley, Chichester, UK.
[10] Frey, C., Patil, S. R., Frey, C. H., and Patil, S. R., 2002, “Identification andReview of Sensitivity Analysis Methods,” Risk Anal., 22(3), pp. 553–578.
[11] Thornton, A. C., 2004, Variation Risk Management: Focusing Quality Improve-ments in Product Development and Production, Wiley, Hoboken, NJ.
[12] Fowlkes, W. Y., and Creveling, C. M., 1995, Engineering Methods for RobustProduct Design, Addison-Wesley, Reading, MA.
[13] Eifler, T., Mathias, J., Engelhardt, R., Kloberdanz, H., Bohn, A., and Birkhofer,H., 2011, “Evaluation of Solution Variants in Conceptual Design by Means ofAdequate Sensitivity Indices,” ICED 11—18th International Conference onEngineering Design—Impacting Society Through Engineering Design, Vol. 9,pp. 314–323.
[14] Zang, C., Friswell, M. I., and Mottershead, J. E., 2005, “A Review of RobustOptimal Design and Its Application in Dynamics,” Comput. Struct., 83(4–5),pp. 315–326.
[15] Murphy, T. E., Tsui, K.-L., and Allen, J. K., 2004, “A Review of Robust DesignMethods for Multiple Responses,” Res. Eng. Des., 15(4), pp. 201–215.
[16] Robinson, T. J., Borror, C. M., and Myers, R. H., 2004, “Robust ParameterDesign: A Review,” Qual. Reliab. Eng. Int., 20(1), pp. 81–101.
[17] Biolchini, J., Mian, P. G., Candida, A., and Natali, C., 2005, “SystematicReview in Software Engineering,” System Engineering and Computer ScienceDepartment COPPE/UFRJ, Technical Report ES, 679(05), 45.
[18] Hamby, D., 1995, “A Comparison of Sensitivity Analysis Techniques,” HealthPhys., 68(2), pp. 195–204.
[19] Helton, J. C., Johnson, J. D., Sallaberry, C. J., and Storlie, C. B., 2006, “Surveyof Sampling-Based Methods for Uncertainty and Sensitivity Analysis,” Reliab.Eng. Syst. Saf., 91(10–11), pp. 1175–1209.
[20] Hutcheson, R. S., and Mcadams, D. A., 2012, “Sensitivity Measures for UseDuring Conceptual Design,” Int. J. Des. Eng., 5(1), pp. 1–20.
[21] Chen, W., Allen, J. K., Tsui, K.-L., and Mistree, F., 1996, “A Procedure forRobust Design: Minimizing Variations Caused by Noise Factors and ControlFactors,” ASME J. Mech. Des., 118(4), pp. 478–485.
[22] Allen, J. K., Seepersad, C., Choi, H., and Mistree, F., 2006, “Robust Design forMultiscale and Multidisciplinary Applications,” ASME J. Mech. Des., 128(4),pp. 832–843.
[23] Dantan, J. Y., Gayton, N., Qureshi, A. J., Lemaire, M., and Etienne, A., 2013,“Tolerance Analysis Approach Based on the Classification of Uncertainty(Aleatory/Epistemic),” Procedia CIRP, 10, pp. 287–293.
[24] Suh, N. P., 2001, Axiomatic Design: Advances and Applications, OxfordUniversity Press, New York.
[25] Howard, T. J., Ebro, M., Eifler, T., Petersen, S., G€ohler, S. M., Christiansen, A.,and Rafn, A., 2014, “The Variation Management Framework (VMF) for RobustDesign,” 1st International Symposium on Robust Design, Kobenhavn, Den-mark, Aug. 14–15.
[26] Dai, Z., Scott, M. J., and Mourelatos, Z. P., 2003, “Incorporating EpistemicUncertainty in Robust Design,” ASME Paper No. DETC2003/DAC-48713.
[27] Hu, Z., Du, X., Kolekar, N. S., and Banerjee, A., 2013, “Robust Design WithImprecise Random Variables and Its Application in Hydrokinetic TurbineOptimization,” Eng. Optim., 46(3), pp. 393–419.
[28] The Guardian, 2010, “Toyota’s Sticky Accelerator Problem,” accessed Feb. 23,2016, http://www.theguardian.com/business/interactive/2010/feb/04/toyotaau-tomotive-industry
[29] Mahalanobis, P. C., 1936, “On the Generalised Distance in Statistics,” Proc.Natl. Inst. Sci. India, 12(1), pp. pp. 49–55.
[30] Frey, D. D., Jahangir, E., and Engelhardt, F., 2000, “Computing the InformationContent of Decoupled Designs,” Res. Eng. Des.—Theory, Appl. ConcurrentEng., 12(2), pp. 90–102.
[31] Lasserre, J. B., 1983, “An Analytical Expression and an Algorithm for the Volumeof a Convex Polyhedron in Rn,” J. Optim. Theory Appl., 39(3), pp. 363–377.
[32] Hamby, D. M., 1994, “A Review of Techniques for Parameter Sensitivity Analysisof Environmental Models,” Environ. Monit. Assess., 32(2), pp. 135–154.
[33] Minto, B., 2009, The Pyramid Principle: Logic in Writing and Thinking,Pearson Education, London.
[34] Pahl, G., Beitz, W., Feldhusen, J., and Grote, K.-H., 2007, Engineering Design:A Systematic Approach, Springer Science & Business Media, London.
[35] Matthiassen, B., 1997, “Design for Robustness and Reliability: Improving theQuality Consciousness in Engineering Design,” Technical University ofDenmark, Kongens Lyngby, Denmark.
[36] Chakhunashvili, A., Johansson, P., and Bergman, B., 2004, “Variation Modeand Effect Analysis,” Reliability and Maintainability, 2004 Annual Sympo-sium-RAMS, IEEE, Jan. 26–29, pp. 364–369.
[37] Johannesson, P., Bergman, B., Svensson, T., Arvidsson, M., L€onnqvist, A.,Barone, S., and De Mar�e, J., 2013, “A Robustness Approach to Reliability,”Qual. Reliab. Eng. Int., 29(1), pp. 17–32.
[38] Ebro, M., and Howard, T. J., 2016, “Robust Design Principles for ReducingVariation in Functional Performance,” J. Eng. Des., pp. 1–18.
[39] G€ohler, S. M., and Howard, T. J., 2015, “The Contradiction Index—A NewMetric Combining System Complexity and Robustness for Early DesignStages,” ASME Paper No. DETC2015-47255.
[40] Charzy�nska, A., Nalecz, A., Rybi�nski, M., and Gambin, A., 2012, “SensitivityAnalysis of Mathematical Models of Signaling Pathways,” Biotechnologia,93(3), pp. 291–308.
[41] Han, J. S., and Kwak, B. M., 2004, “Robust Optimization Using a GradientIndex: MEMS Applications,” Struct. Multidiscip. Optim., 27(6), pp. 469–478.
[42] Bhattacharjya, S., and Chakraborty, S., 2011, “Improved Robust Design Opti-misation of Structures,” Proc. ICE—Eng. Comput. Mech., 164(1), pp. 47–57.
[43] Sobol, I. M., 2001, “Global Sensitivity Indices for Nonlinear MathematicalModels and Their Monte Carlo Estimates,” Math. Comput. Simul., 55(1–3),pp. 271–280.
[44] Cukier, R. I., Levine, H. B., and Shuler, K. E., 1978, “Nonlinear SensitivityAnalysis of Multiparameter Model Systems,” J. Comput. Phys., 26(1), pp. 1–42.
[45] Manache, G., and Melching, C. S., 2008, “Identification of Reliable Regression- andCorrelation-Based Sensitivity Measures for Importance Ranking of Water-QualityModel Parameters,” Environ. Model. Software, 23(5), pp. 549–562.
[46] Lee, M. C. W., Kelly, D. W., Degenhardt, R., and Thomson, R. S., 2010, “AStudy on the Robustness of Two Stiffened Composite Fuselage Panels,” Com-pos. Struct., 92(2), pp. 223–232.
[47] Kwag, S., and Ok, S.-Y., 2013, “Robust Design of Seismic Isolation SystemUsing Constrained Multi-Objective Optimization Technique,” KSCE J. Civ.Eng., 17(5), pp. 1051–1063.
[48] Caro, S., Bennis, F., and Wenger, P., 2005, “Tolerance Synthesis of Mecha-nisms: A Robust Design Approach,” ASME J. Mech. Des., 127(1), pp. 86–94.
[49] Caro, S., Bennis, F., and Wenger, P., 2005, “Comparison of Robustness Indicesand Introduction of a Tolerance Synthesis Method for Mechanisms,” Can.Congr. Appl. Mech., pp. 3–4.
[50] Ting, K.-L. L., and Long, Y., 1996, “Performance Quality and Tolerance Sensi-tivity of Mechanisms,” ASME J. Mech. Des., 118(1), pp. 144–150.
[51] Li, M., Azarm, S., and Boyars, A., 2006, “A New Deterministic ApproachUsing Sensitivity Region Measures for Multi-Objective Robust and FeasibilityRobust Design Optimization,” ASME J. Mech. Des., 128(4), pp. 874–883.
[52] Eslamnour, B., and Ali, S., 2009, “Measuring Robustness of Computing Sys-tems,” Simul. Model. Pract. Theory, 17(9), pp. 1457–1467.
[53] Gunawan, S., and Azarm, S., 2004, “Non-Gradient Based Parameter SensitivityEstimation for Single Objective Robust Design Optimization,” ASME J. Mech.Des., 126(3), pp. 395–402.
[54] Kang, Z., and Bai, S., 2013, “On Robust Design Optimization of Truss StructuresWith Bounded Uncertainties,” Struct. Multidiscip. Optim., 47(5), pp. 699–714.
[55] Frey, D. D., 1999, “Application of Wavelets and Mahalanobis Distances toRobust Design of an Image Classification System,” ASI’s 17th Annual TaguchiMethods Symposium, pp. 198–209.
[56] Zhu, J., and Ting, K.-L. L., 2001, “Performance Distribution Analysis andRobust Design,” ASME J. Mech. Des., 123(1), pp. 11–17.
[57] Lamberti, P., and Tucci, V., 2007, “Interval Approach to Robust Design,”COMPEL Int. J. Comput. Math. Electr. Electron. Eng., 26(20, pp. 280–292.
[58] Du, X., Sudjianto, A., and Chen, W., 2004, “An Integrated Framework for Opti-mization Under Uncertainty Using Inverse Reliability Strategy,” ASME J.Mech. Des., 126(4), pp. 562–570.
[59] Ren, X., and Rahman, S., 2013, “Robust Design Optimization by PolynomialDimensional Decomposition,” Struct. Multidiscip. Optim., 48(1), pp. 127–148.
[60] Chen, W., and Yuan, C., 1999, “A Probabilistic-Based Design Model forAchieving Flexibility in Design,” ASME J. Mech. Des., 121(1), pp. 77–83.
[61] Jin, Y., and Sendhoff, B., 2003, “Trade-Off Between Performance and Robustness:An Evolutionary Multiobjective Approach,” International Conference on Evolu-tionary Multi-Criterion Optimization, Springer Berlin, Heidelberg, pp. 237–251.
[62] Cheng, Q., Xiao, C., Zhang, G., Gu, P., and Cai, L., 2013, “An AnalyticalRobust Design Optimization Methodology Based on Axiomatic DesignPrinciples,” Qual. Reliab. Eng. Int., 30(7), pp. 1059–1073.
[63] Otto, N., and Antonsson, E. K., 1994, “Design Parameter Selection in the Pres-ence of Noise,” Res. Eng. Des., 6(4), pp. 234–246.
[64] Du, X., 2012, “Toward Time-Dependent Robustness Metrics,” ASME J. Mech.Des., 134(1), p. 011004.
[65] Chen, W., Simpson, T. W., Allen, J. K., and Mistree, F., 1999, “SatisfyingRanged Sets of Design Requirements Using Design Capability Indices as Metri-cs,” Eng. Optim., 31(5), pp. 615–639.
[66] Heidari, A., Yoon, Y.-J., Son, H., and Choi, H.-J., 2012, “Simulation BasedDesign of Disk Resonator Biosensors Under Fabrication Uncertainty,” ASMEJ. Mech. Des., 134(4), p. 041005.
111407-12 / Vol. 138, NOVEMBER 2016 Transactions of the ASME
Downloaded From: http://mechanicaldesign.asmedigitalcollection.asme.org/ on 09/14/2016 Terms of Use: http://www.asme.org/about-asme/terms-of-use

1 Copyright © 2015 by ASME
Proceedings of the ASME 2015 International Design Engineering Technical Conferences & Computers and Information in Engineering Conference
IDETC/CIE 2015 August 2-5, 2015, Boston, Massachusetts, USA
DETC2015-47255 THE CONTRADICTION INDEX (CI): A NEW METRIC COMBINING SYSTEM COMPLEXITY AND ROBUSTNESS FOR EARLY DESIGN STAGES
Simon Moritz Göhler Department of Mechanical Engineering
Technical University of Denmark Kgs. Lyngby, Denmark
Email: [email protected]
Thomas J. Howard Department of Mechanical Engineering
Technical University of Denmark Kgs. Lyngby, Denmark
Email: [email protected]
ABSTRACT For complex and integrated products, companies
experience difficulties in achieving a satisfactory and consistent functional performance. When a design has “contradicting” parameter/property requirements it often requires fine tuning with numerous design iterations and complex optimizations to find the “sweet spot” where all functional requirements are fulfilled. This often leads to a lack of robustness, where tight tolerances are required and small defects have knock-on effects throughout the product. In this article we propose the Contradiction Index (CI) to gauge how contradicting the requirements of the different parts are with respect to the different functions. This article provides a step-by-step guide for how to estimate the CI for a design. The method is applied to a case study - the FlexTouch®, a Novo Nordisk insulin injection device. When analyzing the CI for each part, against the number of part design iterations, a positive correlation was found. Furthermore, when correlating the CI against the number of challenging tolerances statistical significance was found (p=0.01). It is envisaged that the CI will be a powerful approach to estimate and compare development difficulty and to guide development and design improvements. INTRODUCTION
The inherent nature of competitive markets drives a trend towards increased functionality with every new product generation. Particularly in hardware and mechanical devices, this implies a higher complexity and level of integration within the product. At the same time, a high and consistent quality and performance throughout the life cycle is of high importance. Performance refers in this context to meeting the functional requirements on a satisfactory level. Secondly, having also a consistent performance despite of any variations determines the success of the product. Ebro et al. [1] classified variations (also sometimes called noise factors) in 5 principle categories being manufacturing, assembly, ambient conditions, load and time dependent variations. Robust design
methodology (RDM) is a well acknowledged way of taking these variations into account. Design engineers of the developing companies are consequently challenged to find a design that fulfils all functional requirements but is also robust to variation. However, in particular in the case of complex and highly integrated products, design teams experience difficulties finding the “sweet spot” where all functional requirements are satisfactory met and functional robustness is ensured. Gribble states that “small changes to a complex coupled system can result in large unexpected changes in behavior, possibly taking the system outside of its designers’ expected operating regime” [2]. Compromises and trade-offs in numerous design iterations as well as increased costs for manufacturing and quality control is the result. The implications of the complexity and the level of integration on the performance and the robustness consequently need to be well understood. Whereas, in practice, increased efforts are experienced first and foremost in detailed design stages, e.g. computer simulations and excessive test campaigns to verify and optimize the design, the relevance of the conceptual design phase is frequently neglected. While optimization techniques can greatly improve a design during the detailing phases, it is the design concept that places constrains and ultimately limits the achievable performance and robustness of a product [3, 4]. “A poor concept can rarely be manipulated to achieve commercial success” [5]. It is therefore desired to evaluate the complexity and robustness of a given concept in the beginning of the design process to make the right decisions and to identify potential risks in development and robustness to save development time and cost. State of the art There are various methods to describe and evaluate the complexity and/or robustness of concepts and designs. El Maraghy et al. [6] name complexity theory, entropy or information theory as the basis for common complexity metrics. The Design Structure Matrices (DSMs) and the House of Quality (HoQ) in Quality Function Deployment (QFD) [7]

2 Copyright © 2015 by ASME
are two of the most common tools for the development of complex systems. Eppinger and Browning [8] describe various examples related to complex system development addressing problems like modularity, outsourcing, system integration, etc. DSMs are subject to many research projects and have been developed further and augmented to improve the visualization, optimization and analysis. In QFD the House of Quality is another matrix approach that supports product development [9]. Customer requirements are mapped against engineering characteristics. In the ‘roof of the house’ engineering characteristics are compared against each other to find contradictions. Based on DSM and HoQ Mocko et al. [10] derived a modelling scheme to map and analyze relationships between requirements, functions, components and engineering characteristics. Shafiei-Monfared et al. [11] use graph theory and DSMs to measure the complexity of development projects. The metric is based on estimated man-hours per project with respect to technical and managerial aspects. However, the method needs experiences from previous similar projects and knowledge about required skills of the engineers. Robustness considerations in the conceptual design phase are rather uncommon. That holds for single functions and on systems level. Robust Design tools to evaluate the concept robustness are rare. Robust concept exploration techniques have been proposed to screen the design space for a robust concept [12-14]. Other recent contributions in the field of robust design focus on robust design optimization [15-17] addressing designs in later stages of the development. However, there are design rules conveying robustness such as Suh’s Axiomatic Design [18]. Uncoupling of functions and the reduction of the information content for the concept enhance the robustness of the final product. The information content is also a measure of the complexity of the design comparing the design range with the common range. Kinematic Design and Design Clarity aim at the definition of the right set of constraints imposing more robustness due to more predictable interfaces of the individual parts [1]. However, in the case of Kinematic Design only the right mobility is ensured. Design Clarity is only applicable for more mature designs since the interfaces are assessed on a detailed level. Moreover, only few contributions address the complexity in the context of robustness. Grussenmeyer et al. present a framework for the influence of complexity and robustness on production performance [19]. De Biagi et al. propose a measure for quantifying the complexity and robustness of a frame structure based on graph theory [20]. Overall, in particular for designs that cannot be designed exclusively under robustness considerations a new approach is needed. The lack of methods evaluating the complexity and robustness in early design stages leads to the question of how a concept can be evaluated in terms of minimal risk for poor performance and robustness in the case of a complex and highly integrated product, where many functions are dependent on the same parts and design parameters.
Objective and Scope In this paper we propose a methodology to analyze a concept’s complexity and design parameters. The technique is based on an evaluation of whether the functional requirements (FRs) imposed on organs and parts are in conflict. The level of conflict or ‘contradiction index’ is used as an indicator for potential compromises and trade-offs later in the detailed design stage that will penalize the performance and robustness of the final product. This approach augments common methods like DSM and QFD. We applied and validated the proposed approach in development projects for prefilled insulin injection devices at Novo Nordisk. For this article the FlexTouch® insulin pen has been used as an example. It combines a high level of functional integration with demanding requirements and a high volume production with an automated assembly line. High and consistent performance, reliability and robustness are of crucial importance to maintain compliance to FDA standards and control costs due to scrap, quality control and redesign efforts. The goal is to support the concept selection for complex and integrated products by helping to foresee potential issues and risks related to functional performance and robustness in later development stages. Furthermore, the output of the method suggests areas of potential design improvements and can be used for task prioritization and design optimization. PROPOSAL OF A NEW APPROACH
In the following we will describe the rational and application of the new method. Rational From the Axiomatic Design framework [18] follows that an uncoupled design yields better robustness opportunities (Independence Axiom). Also, the fewer (coupled) design parameters (DPs) a function has the more robust it is (Information Axiom). However, in many cases these axioms cannot be obeyed due to restrictions of other kinds (business case, platform architecture, other DfX areas). The results are complex and integrated products. It is understood that uncoupled designs are easier to optimize and to find the “sweet spot” that fulfills all functional requirements. Further, robust concepts yield more possibilities of achieving a robust product. Figure 1 shows the transfer functions of two functional requirements FR1 and FR2 that are coupled through a design parameter (DP). The requirements are of the kind “nominal-is-best”. For the ease of the diagram the FRs are scaled such that their required nominal and upper and lower limits match. As can be seen from the diagram, there is a range of the design parameter that fulfills both FRs in a satisfactory manner. However, the acceptable variation of the design parameter to fulfill both FRs at the same time is smaller than the acceptable variation for the single FRs.
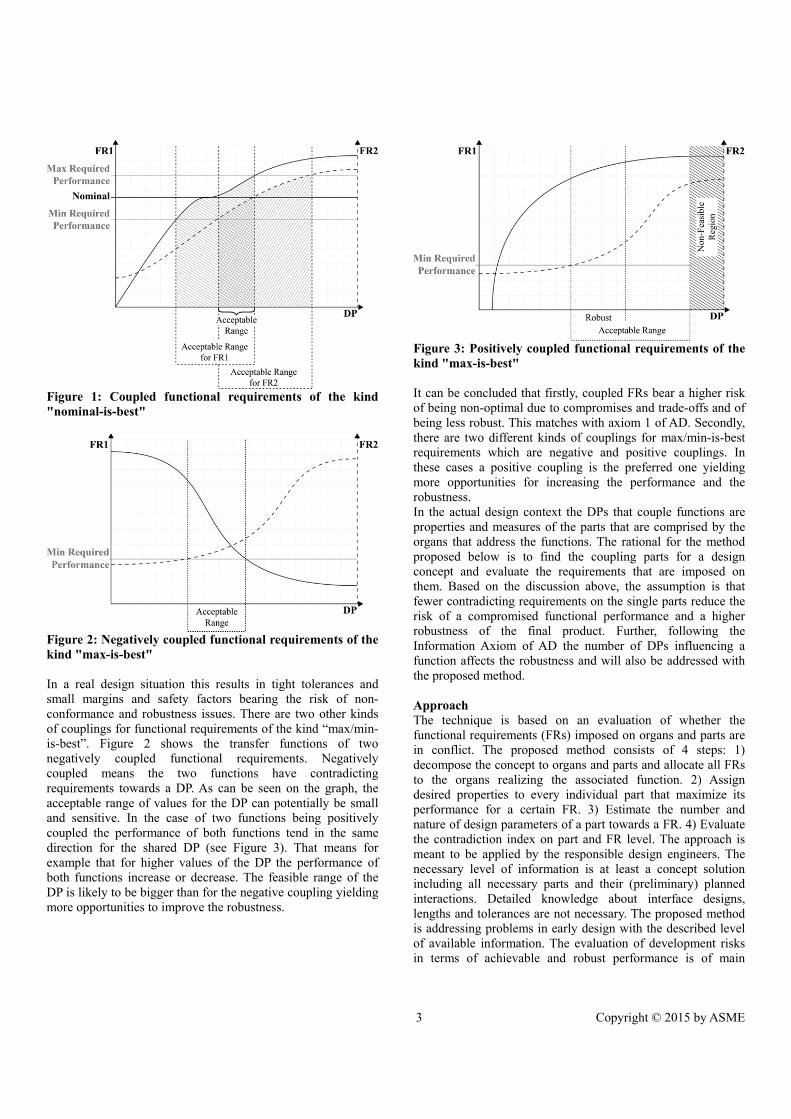
3 Copyright © 2015 by ASME
Figure 1: Coupled functional requirements of the kind "nominal-is-best"
Figure 2: Negatively coupled functional requirements of the kind "max-is-best" In a real design situation this results in tight tolerances and small margins and safety factors bearing the risk of non-conformance and robustness issues. There are two other kinds of couplings for functional requirements of the kind “max/min-is-best”. Figure 2 shows the transfer functions of two negatively coupled functional requirements. Negatively coupled means the two functions have contradicting requirements towards a DP. As can be seen on the graph, the acceptable range of values for the DP can potentially be small and sensitive. In the case of two functions being positively coupled the performance of both functions tend in the same direction for the shared DP (see Figure 3). That means for example that for higher values of the DP the performance of both functions increase or decrease. The feasible range of the DP is likely to be bigger than for the negative coupling yielding more opportunities to improve the robustness.
Figure 3: Positively coupled functional requirements of the kind "max-is-best" It can be concluded that firstly, coupled FRs bear a higher risk of being non-optimal due to compromises and trade-offs and of being less robust. This matches with axiom 1 of AD. Secondly, there are two different kinds of couplings for max/min-is-best requirements which are negative and positive couplings. In these cases a positive coupling is the preferred one yielding more opportunities for increasing the performance and the robustness. In the actual design context the DPs that couple functions are properties and measures of the parts that are comprised by the organs that address the functions. The rational for the method proposed below is to find the coupling parts for a design concept and evaluate the requirements that are imposed on them. Based on the discussion above, the assumption is that fewer contradicting requirements on the single parts reduce the risk of a compromised functional performance and a higher robustness of the final product. Further, following the Information Axiom of AD the number of DPs influencing a function affects the robustness and will also be addressed with the proposed method. Approach The technique is based on an evaluation of whether the functional requirements (FRs) imposed on organs and parts are in conflict. The proposed method consists of 4 steps: 1) decompose the concept to organs and parts and allocate all FRs to the organs realizing the associated function. 2) Assign desired properties to every individual part that maximize its performance for a certain FR. 3) Estimate the number and nature of design parameters of a part towards a FR. 4) Evaluate the contradiction index on part and FR level. The approach is meant to be applied by the responsible design engineers. The necessary level of information is at least a concept solution including all necessary parts and their (preliminary) planned interactions. Detailed knowledge about interface designs, lengths and tolerances are not necessary. The proposed method is addressing problems in early design with the described level of available information. The evaluation of development risks in terms of achievable and robust performance is of main

4 Copyright © 2015 by ASME
interest. Non-functional (non-technical) requirements as for example budget or launch date requirements are neglected for this evaluation. Step 1 As for complexity methods like DSM and QFD (House of Quality) the concept is first decomposed into its organs and subsequently into its parts. Organs are the means which address the physical realization of the functions. For the designing engineers this task should be straight forward. Secondly, the functional requirements are assigned to the associated organs. Generally speaking, the selection of functions under investigation depends very much on the product. We suggest to limit the number of functions to the active functionalities defined by the overall product specification and to exclude passive functions like “provide support”-functionality as defined by Scalice [21]. Following Tjalve [22] the “provide support”-functionality is not considered a part of the functional structure of the part. Table 1 shows exemplarily the system decomposition.
Fun
ctio
nal
Req
uire
men
t
Par
t 1
Par
t 2
…
Organ 1 FR 1
x FR 2
Organ 2 FR 3
x x FR 4
…
…
Table 1: System decomposition An organ is defined by the parts and part-interfaces that create a function. The function is the “organ’s ability to create an active effect” [23]. The functional requirements are therefore linked only to one organ. The underlying assumption is that a functional requirement stretching over multiple organs can be broken down to sub-functional requirements for the individual organs. Multiple FRs addressed by one organ is possible. Finally, the requirements for each organ should be clearly defined. Obviously, these can change but for the time of the concept assessment they are assumed to be fixed. It was found practical to include the measure (unit) and sort (max, min, nominal is best) of the functional requirements and to verbally describe influencing phenomena for each of the FRs (e.g. friction, spring characteristics, position, orientation, size etc.). The goal is to be able to map functional dependencies and specify these in step 2. Step 2 The second step is the main evaluation. The intention is to evaluate the level of contradiction in the functional requirements projected onto the single parts. The conceptual
layout and more precise the organs of the product addressing the functional requirements, determine the requirements on the properties and attributes of the single parts. These properties can be material related (e.g. electrical conductivity, hardness, strength, e-module etc.), geometry related (e.g. position, orientation, size etc.) or material and geometry related (e.g. stiffness, weight etc.). These properties and attributes having an influence on the functional performance differ from product to product and can also differ from part to part depending on the nature of the organ (mechanical, electrical, etc.). For the evaluation of the functional requirements, the properties need to be of a kind that can be judged desirable or undesirable from functional point of view. The idea is to cover the most important aspects that can influence the performance of the functions in the final product. This can go as far as a property being necessary or detrimental to achieve the functionality. The important thing here is only the independence of the properties to prevent double accounting of contradictions. Pimmler and Eppinger [24] introduced a scoring scheme to address and map the influence and importance of interactions in complex products. They used the evaluation of interactions to “define the product architecture and to organize the development teams”. They rated product specific interactions on a 5-level scale from required (+2) to detrimental (-2) to quantify the relative importance for the single interactions. Building upon this idea we developed a scoring scheme evaluating certain part properties and characteristics with respect to their importance for a functional requirement. We augmented the scale by a sixth level to account for unknown imposed requirements on the part due to functional requirements of the kind “nominal-is-best”. Table 2 shows the six categories required, desired, unknown, indifferent, undesired and detrimental and their explanations. Required +2 The property is necessary to fulfil the
functional requirement. Desired +1 The property is beneficial for the
performance of the function. Unknown +/- For nominal is best requirements the
influence of a property can be either desired or undesired
Indifferent 0 The property does not affect the performance of the function.
Undesired -1 The property causes negative effects but does not prevent functionality.
Detrimental -2 The property must be prevented to achieve functionality.
Table 2: 6-level scoring scheme The main task in this step is to choose appropriate properties and rate the importance with the scores shown in Table 2. The scoring should be done by the responsible design and development engineers. Every part shall be rated individually towards a specific functional requirement regardless of other requirements or imposed behaviors etc. Part properties affecting functions with requirements in the category nominal-is-best are

5 Copyright © 2015 by ASME
rated with +/- since the nominal performance and the sensitivities are unknown at this stage. In the case of mechanical designs and geometry dependent properties it was also found to be useful to differentiate between different independent directions. The requirements on stiffness in one direction can for example be independent of those in another direction. For the investigations of a cylindrical insulin pen described in this article, cylinder coordinates (directions z, r, phi) have been used. However, the choice of the coordinate system should be taken depending on the product. Step 3 To further estimate the contribution of a part towards the robustness of a function, the number of influencing parameters (design parameters) is being assessed. Following the second axiom of Suh’s Axiomatic Design, the information content and therefore the probability of success of a function is dependent on the number of design parameters. The assessment of influencing parameters can be difficult for certain functions. Especially in the early design phase were details have not been worked out yet and only a rough idea of the structure and the interactions between parts exists, only estimations are possible. For incremental designs, derivatives or in companies that have experience and expertise in designing the product type under investigation a more accurate number can be derived. It makes sense to differentiate between different directions what also reflects in most cases the way the part is machined. However, the main purpose is to estimate the number to get an overview as early as possible. Considerations of the kind of functional requirement, interfaces, active surfaces as well as whether a force or torque is being transmitted through the part help to estimate the number of influencing parameters. Step 4 The fourth step is the derivation of the contradiction index. Part Level: To derive the contradiction index on part level, the requirements from the functions on the parts as evaluated in step 3 need to be compared for each of the properties in each of the directions. A contradiction is present if there are two opposing requirements. For the applied scoring scheme (Table 2) this translates to opposing signs of the scores for the properties for a direction. The contradiction score is in that case the difference between the highest and the lowest score. For +/- entries +1 or -1 is chosen to give the highest contradiction score to indicate that in a worst case scenario there might be a contradiction. For example, if one functional requirement desires (+1) a high stiffness of a part in radial direction which is detrimental (-2) for another function and undesired (-1) for a third function the contradiction score is 3, which is the highest difference between the scores. In the case that a part’s property does not matter for a certain function (indifferent, score = 0) or all dependent functions require it to be in the same way (for example +2 for
FR1 and +1 for FR2) there is no contradiction and the contradiction score is zero. Table 3 shows some examples for the calculation of the contradiction score. Note that the score is always positive and cannot be higher than 4. Multiple requirements on a property in a direction do not increase the score further. Part 1 Property: Stiffness in r- direction Example FR 1 FR 2 FR 3 Contradiction
1 +2 -1 -1 3 2 -2 +2 -1 4 3 +1 -1 +1 2 4 +2 +1 0 0 5 -1 -1 -1 0 6 -1 0 +/- 2
Table 3: Examples For the number of influencing factors only the highest number of a direction is taken to reflect the fact that surfaces (and therefore also the DPs) can be used for multiple functions. Once the contradiction scores have been calculated for all functions and directions the part contradiction index (CI) is calculated as the sum of all contradictions and all influencing parameters combining both of Suh’s design axioms to a metric.
.
Organ Level: Analogously it is possible to calculate the contradiction index for every organ by summing up the part CIs contributing to a certain organ.
In that way it is possible to identify organs, i.e. solutions to functional requirements that are at risk of a high level of trade-offs compromising the performance and the robustness. Different solutions and alternatives for addressing a functional requirement can be evaluated. Functional Requirements Level: The same technique can be applied to derive the CI for the functional requirements. The CI implicitly considers the impact of the length of tolerance chains by summing up the shared influencing parameters (design parameters). To identify conflicting couplings of different functional requirements, the imposed requirements on the parts can be evaluated for any two functions. In this instance the contradiction level of the contributing parts is not derived taking all FRs into consideration but only the two under

6 Copyright © 2015 by ASME
investigation. The CI for the first order coupling of two functional requirements is then:
1, 2
A DSM for the functional requirements can be generated giving an overview of first order functional couplings and contradictions. It gives a symmetrical matrix since the coupling is the same from FR1 to FR2 and the other way around. Table 4 shows exemplarily a functional requirements DSM. It is important to remember that the functions are only coupled because their organs share parts. Before designing the organ structure, all functions are uncoupled by definition [25]. Information about the criticality and the actual tolerance of the single FRs can be used to evaluate the risk of having certain couplings. Alternative solutions for decoupled FRs can be derived. Expert knowledge and experiences from previous projects for a similar product can be used to judge if a risk can be taken or not. FR1 FR2 FR3 FR4 FR1 x Conflicts
between FR1 and FR2
Conflicts between FR1 and FR3
Conflicts between FR1 and FR4
FR2 x Conflicts between FR2 and FR3
Conflicts between FR2 and FR4
FR3 x Conflicts between FR3 and FR4
FR4 x Table 4: Functional Requirements DSM
A CASE STUDY
The approach presented in this article has been applied to various development projects for prefilled insulin injection devices at Novo Nordisk. The case study for this paper is the FlexTouch® pen. It has an integrated design, where single parts contribute to multiple organs and functions. The requirements on the performance of the pen are strict to comply with FDA standards. With a production volume of multiple million units per year, a robust design is of high importance. For this study, an early stage design iteration of the FlexTouch® has been analyzed with the proposed method to derive the contradiction index of the concept. Figure 4 shows exemplarily a conceptual sketch of the FlexTouch®. The CI is used to challenge the solution and to estimate development difficulties and robustness issues in the transition to the embodiment phase.
Figure 4: Conceptual sketch of the FlexTouch®
For the first step of the proposed method the concept shall be decomposed into organs, their parts and the functional requirements they address. The pen’s engine module in the conceptual stage consists of 8 organs addressing the functional requirements. The organs comprise 14 parts in total including 2 springs from external suppliers. Table 8 (Appendix A) shows a matrix representation of the pen. Detailed information about materials, specific dimensions or tolerances are yet unknown. For the second step we firstly reviewed the functional requirements to judge the general properties of the parts that influence the final performance of each function. As described earlier, the properties can be divided into three categories: 1) geometry related, 2) material related and 3) geometry + material related. The choice of the properties to be evaluated also depends on the available information and knowledge about the concept. For the example case of the FlexTouch® insulin pen, it has been found that the stiffness and the play of the single components are the most important conceptual properties of the pen with respect to the functional performance. The stiffness was chosen due to requirements on delivering torque and reliable positioning without distortion or bending. Also, stiffness relates to the jamming of mechanisms when geometric variations occur. The play or clearance of parts is important for the positioning requirements but also has an influence on the friction between parts for too tight clearances and interferences. Cylindrical coordinates have been used for the evaluation to distinguish between directions. The Piston Rod will now be taken as an example to illustrate the contradiction index. The Piston Rod is ultimately driven by the motor module of the pen to translate the rotational input to an axial translation, driving the plunger in the cartridge to deliver the insulin. High demands on the dose accuracy put strict requirements on the position of the Piston Rod, whereas the required delivery torque needs to be maintained even for geometrical variations of the associated parts. From Table 8 (Appendix A) it can be read off that the Piston Rod has an influence on the EOC System and the Linear Actuator organ. We will examine the Actuator organ with its functional requirements on the delivery torque and the dosing accuracy. Table 5 and Table 6 summarize the evaluation of the functional requirements imposed onto the Piston Rod in the three directions. To maximize the delivery torque a high stiffness around phi and play in all three directions to reduce potential problems with friction is desired. The dose accuracy requires a stiff Piston Rod and ideally no play in z- and phi-direction to meet the requirements. The third step of the method addresses the number of influencing parameters which are in the case of the Piston Rod one in each direction due to the thread.

7 Copyright © 2015 by ASME
FR 1: Delivery Torque Direction z r Phi Stiffness 0 0 1 Play 1 1 1 No of influencing parameter 1 1 1 Table 5: Functional Requirements on the Piston Rod for the
Delivery Torque FR 2: Dosing Accuracy Direction z r Phi Stiffness 1 1 Play -2 -2 No of influencing parameter 1 1 Table 6: Functional Requirements on the Piston Rod for the
Dosing Accuracy In the fourth step the contradiction index is evaluated. The requirements on the properties of the Piston Rod are compared as described earlier in the article. Contradiction Index (CI) Direction z r Phi Stiffness 0 0 0 Play 3 0 3 No of influencing parameter 1 0 1 Table 7: Resulting Contradiction Index for the Piston Rod Table 7 summarizes the contradictions for the Piston Rod. The total contradiction score is 3 + 3 = 6 (coming only from the contradiction on the play requirements). With the 2 shared influencing parameters it results in a CI of 8 for the Piston Rod. The results increase the awareness of the designer for this coupling of FRs for the Piston Rod. The resulting implications are high demands on tolerances for the thread of the Piston Rod and the mating nut and a compensation of potential friction issues by selecting an appropriate torque spring. Table 9 (Appendix A) shows the resulting functional DSM summarizing the functional couplings and their level of contradictions for the FlexTouch®. It highlights the potential risks of not meeting requirements robustly by showing the CI. Based on the matrix design engineers and the chief engineer can judge risks and plan mitigations. VALIDATION
To validate the usefulness of the Contradiction Index (CI) and the proposed method, the results for the early concept of the FlexTouch® as described above have been compared against actual development data of the pen. The question to answer is whether the risks suggested by the method reflect the actual development, performance and robustness of the pen. The assumptions are that for parts and functions with a higher CI and coupling more iterations and tighter tolerances are likely to be necessary to fulfil the functional requirements nominally but also robustly. Contradictions imply that compromises and trade-offs are probable, which have an effect on the
performance but also on the robustness of a function as discussed in this paper. For this study, change notes and the final drawings of the pen have been reviewed to correlate the number of design iterations as well as the number of demanding (< IT13 for injection moulded parts) and challenging tolerances (< IT12 for injection moulded parts) to the CI of the parts.
Figure 5: No. of Part Design Iterations vs Part CI
Figure 6: No. of challenging Tolerances vs Part CI
Furthermore, design engineers and the chief engineer were asked for the usefulness and applicability of the method and its output. Figure 5 and Figure 6 show the correlations between the number of part design iterations and challenging tolerances versus the part CI respectively. Note that the 2 springs from external suppliers have been excluded here. From the plot in Figure 5 there seems to be a tendency towards a correlation between the number of part design iterations and the part CI; however, the correlation was not statistically significant in a linear regression model (p=0.25). In contrast, we found a statistical significant correlation between the number of challenging tolerances and the part CI (p=0.01), which can also be seen in the plot in Figure 6. However, it also has to be mentioned that there is a correlation between the number of functions a part contributes to, to the number of challenging tolerances (p=0.03), which is a bias. Nevertheless, the analysis suggests a stronger correlation with the CI. After all the number of data points is quite small, weakening the statistical

8 Copyright © 2015 by ASME
analysis and can lead to false correlations. The prerequisite for linear modelling of having normally distributed values for the variables can also only be assumed for this few observations. More case studies are necessary to improve the validity of the analysis. Also a more detailed analysis of the change notes and tolerances is required to reduce the mentioned bias. To judge the correlation of the CI to the robustness of the final product, production data like scrap rates and market failures need to be analysed. Generally speaking, the validation is difficult since the development of a product is a complex activity with various influencing factors. Furthermore, the proposed method evaluates the risk for a given concept, which is difficult to validate with only one case study as proposed here. However, the design engineers applying the method to other development projects and the chief engineer gave positive feedbacks for the usability and applicability of the method. The increased awareness of couplings and contradictions helped making design decisions and concept selections. DISCUSSION
The proposed method addresses the complexity and robustness of concepts by evaluating the level of contradiction of the requirements on the parts. The goal is to estimate the risks for difficulties finding a design solution that fulfils all functional requirements in a robust manner. Especially in the early design phase this is of high value, as experience shows that substantial time is spent in the later design phases tweaking design parameters and squeezing tolerances to compensate for contradicting functional requirements. The concept decides about the performance and robustness of the final product. Potential trade-offs and compromises lower the performance and can lead to sensitive designs. Another effect could also be small margins and safety factors, which further increases the risk of product failures. However, the method has its limitations. The CI does not conclude anything about the general feasibility of the concept and whether there is “sweet spot” that fulfils all FRs. It also does not predict the final functional performance of the product and whether it will be robust in absolute terms. The CI score can slightly differ dependent on the applying engineer. The distinction between required/desired and between undesired/detrimental needs to be well defined. However, the overall message of contradicting requirements will not change. The method and the CI is therefore rather an indicator for couplings and contradictions. It can be used as a relative measure to compare concepts and to increase the designers’ understanding of the functional coupling of the design. The information about couplings of the functions and their contradictions in the context of a specific design solution is of high value for the design team. Together with the engineers’ experiences, the actual requirements on the single functions and the knowledge about production capabilities the risks on the functions can be evaluated and it can be decided whether certain risks can be accepted or a redesign is necessary. Also, tasks can be prioritized based on the output of the method. Conventional robust design methods for the conceptual design phase are rather design guidelines that can or cannot be
applied depending on other constraints which can be of engineering or business nature.
Other methods like DSM and QFD give indications about couplings of functions and designs. Especially DSMs and MDMs are used in various ways and support the designers to cluster, optimize and integrate design solutions [8]. However, the kind of coupling and whether there are inherent contradictions imposed on the design is not shown. The “roof” of the house of quality addresses interactions and conflicts but only on the level of engineering characteristics [9]. The proposed approach is seen as an augmentation to DSMs and QFD to evaluate designs not only from the pure coupling point of view but also give an indication where the problems in the design might be and which parts might have the biggest development risk. In the domain of robust design methods evaluating a concept’s robustness like robust concept exploration techniques [10-12] require a meta-model to describe the system which again needs a certain detail of system knowledge. Kinematic Design, Design Clarity [1] or Axiomatic Design [18] give the designer a good guidance of how to design for robust products but might not be applicable due to mentioned reasons. Other robust design methods like robust optimization techniques or sensitivity studies of any kind require a detailed design and are not applicable in the early phases. The presented validation is only an indication of whether the CI is meaningful or not and needs to be backed up and confirmed by further cases also from different kinds of products. However, the application on current development projects and the positive feedback from the engineers using it as well as from the chief engineer give a promising indication about the usefulness of the method. The awareness of couplings and contradictions supports design decisions with a holistic view on the system taking all functional requirements into account.
CONCLUSIONS
In this article we propose a method to evaluate the complexity and the robustness of highly integrated products on concept level by evaluating the concept with respect to contradicting requirements. The approach has proven to be useful and relevant for design engineers in the early design phase to evaluate and compare different concept solutions. The method’s output is the Contradiction Index (CI) for parts and functions measuring the level of contradiction of couplings. With this it is possible to judge risks for potential trade-offs in later design stages compromising the performance and the robustness of the design ultimately leading to costly late design changes or tight tolerances and costs on quality control. The method has been validated with Novo Nordisk’s FlexTouch® insulin injection pen. It was found that the CI has a strong correlation to the number part design iterations as well as with the number of challenging tolerances. However, further investigations and case studies also on different kinds of products are necessary to further develop the method and confirm the usefulness. More and better data is necessary to further validate the Contradiction Index. The assessment of

9 Copyright © 2015 by ASME
scrap data, market failures and other robustness indicators can further confirm the goodness of the risk evaluation of the CI with respect to functional robustness to variations.
ACKNOWLEDGMENTS We thank Novo Nordisk for sponsoring the project and
providing the described case study. Furthermore, we appreciate the insights and the support from all people involved in the research. REFERENCES
[1] Ebro, M., Howard, T. J., and Rasmussen, J. J., 2012, “The foundation for robust design: enabling robustness through kinematic design and design clarity,” Design 2012-12th International Conference on Design, pp. 817-826.
[2] Gribble, S. D., 2001, “Robustness in complex systems,” Hot Topics in Operating Systems, 2001. Proceedings of the Eighth Workshop on, pp. 21-26, IEEE
[3] Pahl, G., Beitz, W., Feldhusen, J., and Grote, K. H., 2007, Engineering design: a systematic approach (Vol. 157). Springer.
[4] Andersson, P. , 1996, “A semi-analytic approach to robust design in the conceptual design phase,” Research in Engineering Design, 8(4), 229-239.
[5] Ulrich, K. T. and Eppinger, S. D., 2012, Product design and development. Fifth Edition. McGraw-Hill.
[6] El Maraghy, W., El Maraghy, H., Tomiyama, T., and Monostori, L.,2012, “Complexity in engineering design and manufacturing,” CIRP Annals-Manufacturing Technology, 61(2), 793-814.
[7] Hauser, J. R., and Clausing, D., 1988, The house of quality.
[8] Eppinger, Steven D., and Tyson R. Browning, 2012, Design structure matrix methods and applications. MIT press.
[9] Cross, Nigel, 2008, Engineering design methods: strategies for product design. John Wiley and Sons.
[10] Mocko, Gregory M., Summers, Joshua D., Fadel, Georges M., Teegavarapu, Sudhaker, Maier, Jonathan R. A., Ezhilan, Thulasiram, 2007, “A modelling scheme for capturing and analyzing multi-domain design information: A hair dryer design example,” Proceedings of ICED 2007
[11] Shafiei-Monfared, S., and Jenab, K., 2012, “A novel approach for complexity measure analysis in design projects,” Journal of Engineering Design, 23(3), 185-194.
[12] Simpson, T. W., Chen, W., Allen, J. K., and Mistree, F., 1996, “Conceptual design of a family of products through the use of the robust concept exploration method,” Proceedings of the 6th AIAA/NASA/USAF Multidisciplinary Analysis and Optimization Symposium (pp. 1535-1545).
[13] Rippel, M., Choi, S. K., Allen, J. K., and Mistree, F., 2012, “Probabilistic collocation for simulation-based robust concept exploration,” Engineering Optimization, 44(8), 915-933.
[14] Schönberg, F., and Messer, M., 2012, “Simulation-Based Design of Wind-Turbine Sealing Solutions Using a Systematic Approach to Robust Concept Exploration,” ASME 2012 International Design Engineering Technical Conferences and Computers and Information in Engineering Conference (pp. 1125-1141). American Society of Mechanical Engineers.
[15] Shen, Lijuan, Jun Yang, and Yu Zhao, 2013, "Simultaneous Optimization of Robust Parameter and Tolerance Design Based on Generalized Linear Models," Quality and Reliability Engineering International 29.8 pp. 1107-1115.
[16] Shahraki, Ameneh Forouzandeh, and Rassoul Noorossana, 2013, "A Combined Algorithm for Solving Reliability-based Robust Design Optimization Problems," Journal of Mathematics and Computer Science, 7, 54-62.
[17] Shahraki, Ameneh Forouzandeh, and Rassoul Noorossana, 2014, "Reliability-based robust design optimization: A general methodology using Genetic Algorithm," Computers and Industrial Engineering.
[18] Suh, Nam P, 2001, Axiomatic Design: Advances and Applications, The Oxford Series on Advanced Manufacturing.
[19] Grussenmeyer, R., and Blecker, T., 2013, “Complexity and Robustness Influence on Production Performance–A Theoretical Framework,” Kompetenz, Interdisziplinarität und Komplexität in der Betriebswirtschaftslehre (pp. 57-69). Springer Fachmedien Wiesbaden.
[20] De Biagi, V., and Chiaia, B., 2013, “Complexity and robustness of frame structures,” International Journal of Solids and Structures, 50(22), 3723-3741.
[21] Scalice, R. K., de Andrade, L. F. S., and Forcellini, F. A., 2008, “A Design Methodology for Module Interfaces,” Collaborative Product and Service Life Cycle Management for a Sustainable World (pp. 297-304). Springer London
[22] Tjalve, E., 1979, Systematic Design of Industrial Products, Akademisk forlag
[23] Andreasen, M. M., 2011, “45 Years with design methodology,” Journal of Engineering Design, 22(5), 293-332.
[24] Pimmler, Thomas Udo, and Steven D. Eppinger, 1994, Integration analysis of product decompositions. Cambridge, MA: Alfred P. Sloan School of Management, Massachusetts Institute of Technology.
[25] Howard, T. J., and Andreasen, M. M., 2013, “Mind-sets of functional reasoning in engineering design,” Artificial Intelligence for Engineering Design, Analysis and Manufacturing, 27(03), 233-240.
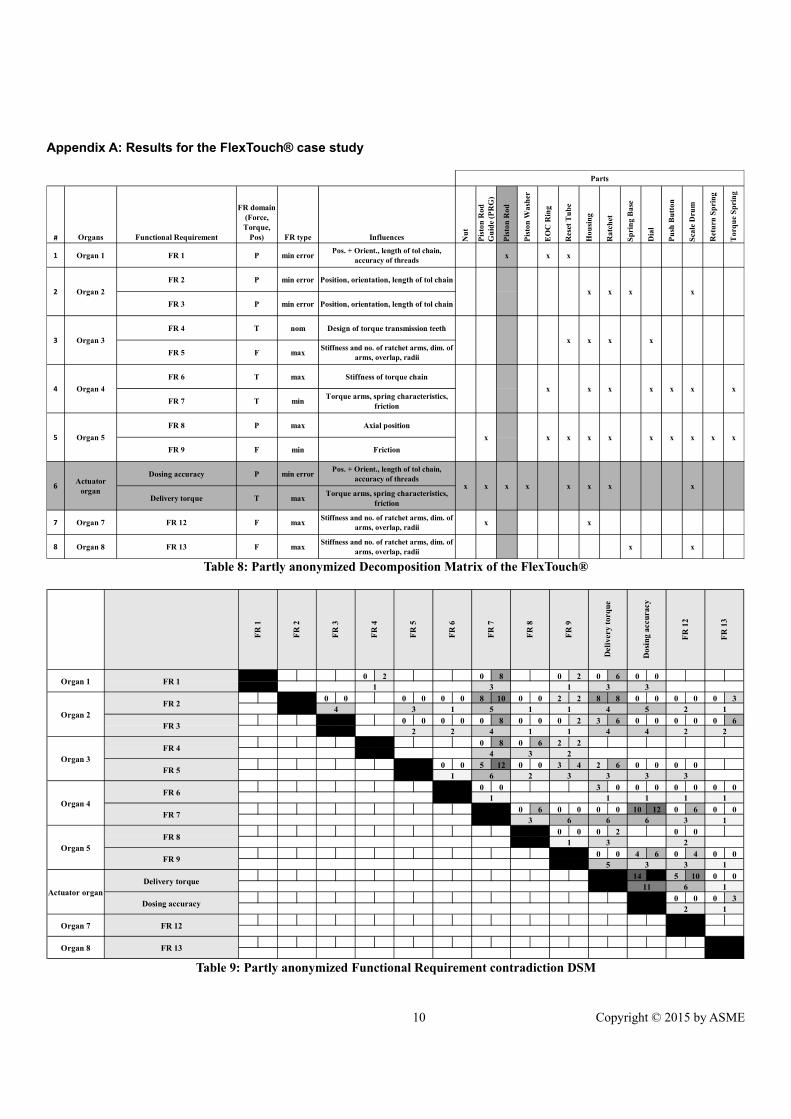
10 Copyright © 2015 by ASME
Appendix A: Results for the FlexTouch® case study
Table 8: Partly anonymized Decomposition Matrix of the FlexTouch®
Table 9: Partly anonymized Functional Requirement contradiction DSM
# Organs Functional Requirement
FR domain (Force, Torque,
Pos) FR type Influences Nu
t
Pis
ton
Rod
G
uid
e (P
RG
)
Pis
ton
Rod
Pis
ton
Was
her
EO
C R
ing
Res
et T
ub
e
Hou
sin
g
Rat
chet
Sp
rin
g B
ase
Dia
l
Pu
sh B
utt
on
Sca
le D
rum
Ret
urn
Sp
rin
g
Tor
qu
e S
pri
ng
1 Organ 1 FR 1 P min errorPos. + Orient., length of tol chain,
accuracy of threadsx x x
FR 2 P min error Position, orientation, length of tol chain
FR 3 P min error Position, orientation, length of tol chain
FR 4 T nom Design of torque transmission teeth
FR 5 F maxStiffness and no. of ratchet arms, dim. of
arms, overlap, radii
FR 6 T max Stiffness of torque chain
FR 7 T minTorque arms, spring characteristics,
friction
FR 8 P max Axial position
FR 9 F min Friction
Dosing accuracy P min errorPos. + Orient., length of tol chain,
accuracy of threads
Delivery torque T maxTorque arms, spring characteristics,
friction
7 Organ 7 FR 12 F maxStiffness and no. of ratchet arms, dim. of
arms, overlap, radiix x
8 Organ 8 FR 13 F maxStiffness and no. of ratchet arms, dim. of
arms, overlap, radiix x
Parts
2 Organ 2 x
3 Organ 3 x x
x x x
4 Organ 4 x x
x x
x
5 Organ 5 x x x x
x x x x
x
6Actuator
organx x x x x x
x x x x x
x x
0 2 0 8 0 2 0 6 0 0
0 0 0 0 0 0 8 10 0 0 2 2 8 8 0 0 0 0 0 3
0 0 0 0 0 8 0 0 0 2 3 6 0 0 0 0 0 6
0 8 0 6 2 2
0 0 5 12 0 0 3 4 2 6 0 0 0 0
0 0 3 0 0 0 0 0 0 0
0 6 0 0 0 0 10 12 0 6 0 0
0 0 0 2 0 0
0 0 4 6 0 4 0 0
14 22 5 10 0 0
0 0 0 3
FR
9
Del
iver
y to
rque
Dos
ing
accu
racy
FR
12
FR
13
FR
5
FR
6
FR
7
FR 1Organ 1
FR
8
FR
1
FR
2
FR
3
FR
4
Delivery torque
FR 9
FR 8
FR 7
FR 3
FR 2
1
FR 6
FR 5Organ 3
Organ 4
FR 13Organ 8
FR 12
Dosing accuracy
Organ 2
Organ 5
Actuator organ
Organ 7
2 2 4 1 1
1 6 2 3
3
FR 4
4 3 1 5 1 1 4 5 2 1
3 33 1
4 3 2
4 4 2 2
1 1 1 1 1
3 3 3
1
1 3 2
3 6 6 6
11 6 1
5 3 3
2
1
1

ORIGINAL PAPER
A model-based approach to associate complexity and robustnessin engineering systems
Simon Moritz Gohler1 • Daniel D. Frey2 • Thomas J. Howard1
Received: 17 January 2016 / Revised: 17 August 2016 / Accepted: 20 August 2016
� Springer-Verlag London 2016
Abstract Ever increasing functionality and complexity of
products and systems challenge development companies in
achieving high and consistent quality. A model-based
approach is used to investigate the relationship between
system complexity and system robustness. The measure for
complexity is based on the degree of functional coupling
and the level of contradiction in the couplings. Whilst
Suh’s independence axiom states that functional indepen-
dence (uncoupled designs) produces more robust designs,
this study proves this not to be the case for max-/min-is-
best requirements, and only to be true in the general sense
for nominal-is-best requirements. In specific cases, the
independence axiom has exceptions as illustrated with a
machining example, showing how a coupled solution is
more robust than its uncoupled counterpart. This study also
shows with statistical significance, that for max- and min-
is-best requirements, the robustness is most affected by the
level of contradiction between coupled functional
requirements (p = 1.4e-36). In practice, the results imply
that if the main influencing factors for each function in a
system are known in the concept phase, an evaluation of
the contradiction level can be used to evaluate concept
robustness.
Keywords Robust design � Complexity � Axiomatic
design � Coupling � Contradiction
1 Introduction
Many products from hairdryers to systems like a spacecraft
become more and more complex and integrated. Func-
tionality is being added with every product generation as
technology advances. For example, Figs. 1 and 2 show
exemplarily the evolution of car safety features and added
technology for every generation of the Apple iPhone,
respectively. The performance but also the robustness
against variation and noise factors of the functions is of
high importance.
The pursuit of robustness, i.e. insensitivity to variation
in noise (type I Robust Design) and design parameters
(type II Robust Design), challenges the developing com-
panies. ‘‘Small changes to a complex coupled system can
result in large unexpected changes in behaviour, possibly
taking the system outside of its designers’ expected oper-
ating regime’’ (Gribble 2001). The analysis of large-scale
design/engineering networks points towards the same
conclusion that complexity i.e. ‘‘design coupling’’ tends to
negatively influence system robustness (Braha and Bar-
Yam 2004, 2007). The question arises how large the impact
of complexity on robustness is and whether generalizations
can be made.
There are various design guidelines available fostering a
‘‘good’’ and robust design. One of them—axiomatic design
(AD) by Nam P. Suh (2001)—addresses the complexity
and coupling of the design. The first axiom promotes
& Simon Moritz Gohler
Daniel D. Frey
Thomas J. Howard
1 Department of Mechanical Engineering, Technical
University of Denmark, Produktionstorvet, Building 426,
2800 Kgs. Lyngby, Denmark
2 Department of Mechanical Engineering, Massachusetts
Institute of Technology, Cambridge, MA, USA
123
Res Eng Design
DOI 10.1007/s00163-016-0236-1
Author's personal copy

independence of functions which is said to produce
inherently more robust designs (Suh 2001, p. 125, 126). A
designer should first and foremost seek for an uncoupled or
decoupled design and then, in adherence to the second
axiom, minimize the information content. Slagle (2007)
investigated the influence of the system architecture on the
robustness and proposed 9 principles. Among those are the
principles of ‘‘Independence’’ and ‘‘Simplicity’’ in accor-
dance with the notion of Suh. However, it is not always
practically possible to uncouple or decouple functions due
to other conflicting DfX requirements. Furthermore, with
respect to robustness the first axiom is not always true in
reality as there are instances where a coupled design has a
lower information content, which actually produces a
higher probability of success and robustness.
Consider a machine that can position a drill with an
accuracy of 0.02 mm (l = 0, r = 0.02 mm) in the x
direction and 0.005 mm (l = 0, r = 0.005 mm) in the y
direction. Let us also say that the tolerances on the position
of the hole are ±0.04 mm in the x and ±0.03 mm in the y
direction. If the workpiece is oriented square to the axes,
the mapping from design parameter (DP) to functional
requirement (FR) is diagonal and hence the design
uncoupled (design 1). The probability of success is about
p = 95 %. However, if the part is reoriented at an angle of
about 30 degrees, the FR-DP mapping is coupled (design 2)
and the probability of success rises to about p = 97.5 %,
which is roughly a factor of 2 drop in failure rate (see
Figs. 3, 4). This example provides proof that axiom 1 is not
always true; however, the authors believe that axiom 1 is
Fig. 1 Evolution of car safety features (Jackson 2013)
Fig. 2 Added functionality for
every generation of the Apple
iPhone (Apple 2015)
Res Eng Design
123
Author's personal copy

still an incredibly valuable design principle (Ebro and
Howard 2016) that should be used and taught despite the
odd exception.
2 Research delimitation and methodology
The aim of this research is to investigate the link between
the complexity of a design and its robustness. In order to
understand this link first, several terms need to be defined.
The robustness of a design is a key factor in achieving the
desired quality of a product where yield = f (robustness,
variation). Therefore, in order to increase the yield, either
the variation (coming from manufacturing, assembly,
ambient conditions, time, load, the material and signal)
needs to be reduced, or the robustness of the design (in-
herent in the product architecture, geometry and dimen-
sions) needs to be increased.
In this research, we have chosen numerical analysis as a
means for simulating the yield values since empirical data
necessary to obtain meaningful statistical results would be
unfeasible. The variation of the different design parameters
has been modelled using a Monte Carlo simulation. By setting
up the analysis in this way, it can be deduced that the designs
that produced the greatest yield are therefore the most robust.
In order to create the designs, 250 different design
architectures have been modelled based on the hierarchical
probability model by Frey and Li (2008) (see the complex
systems modelling approach later), each with differing
complexity. In this paper, the authors define complexity to be
related to the degree of coupling of the functions in the design
(directly related to axiom 1) (Summers and Shah 2010) and
the level of contradiction of the couplings. The definitions for
coupling and contractions are best laid out in a previous
research by Gohler and Howard (2015) in the following:
• A coupling with low level of contradiction (positive
coupling): When changing a design parameter can lead
to improvements in both of its coupled functions
(Fig. 5).
• A coupling with high level of contradiction (negative
coupling): When changing a design parameter will only
positively affect one of the coupled functions as the
other will be negatively affected (Fig. 6).
From this theoretical basis, two main research
questions (RQ) arise and are addressed in this article:
RQ1 Is there an association between the degree of
coupling in a design and its robustness?
RQ2 Is there an association between the level of
contradiction in a design and its robustness?
2.1 A practical example case
To illustrate the practical implication of contradicting and
positive couplings, consider an automobile diaphragm
Fig. 3 Hole pattern for design 1 (p = 95 %)
Fig. 4 Hole pattern for design 2 (p = 97.5 %)
Fig. 5 Positive coupling of functions
Res Eng Design
123
Author's personal copy

spring clutch as shown in Fig. 7. The release bearing
pushes the diaphragm spring inwards forcing it to buckle
and release the pressure plate from pressing clutch plate
and flywheel together.
Assuming the main functional requirements and design
parameters to be the ones listed in Table 1, a simplified
model using response surface methodology (RSM)
(Box and Wilson 1951) yields the governing Eqs. (1–5).
T ¼ �69:9þ 0:01 � k þ 504:4 � sþ 121:0 � ri þ 139:2 � roð1Þ
F ¼ �247:5þ 0:1 � k þ 5068� t ð2Þ
R ¼ 0:13� 0:6 � 10�5 � k � 0:64 � t ð3Þ
W ¼ 0:002� 0:6 � 10�8 � k � 0:06 � t þ 0:04 � riþ 0:005 � ro þ 0:1 � 10�6 � kt � 0:12 � riro ð4Þ
c ¼ �29562� 10900 � ri þ 33724 � ro þ 2:6 � 106 � troþ 16 � roq ð5Þ
T "F #R #W #c "
266664
377775¼
x " x " x " x " 0
x # x # 0 0 0
x " x " 0 0 0
x " x " x # x " 0
0 x " x # x " x "
266664
377775
k
s
riroq
266664
377775þ�����*
constant
ð6Þ
In linearized and simplified form, the functional
dependencies of the five main functions of the clutch
(Eqs. 1–5) can be summarized using Suh’s design matrix
(DM) either quantitatively using partial derivatives or
qualitatively as shown in Eq. (6). The arrows next to the
FRs and the entries in the DM show the desired tendency of
the value for the FRs and associated DPs. The design is
coupled and is not easy to decouple or uncouple without
changing the whole concept. However, since many of the
requirements tend in the ‘‘same direction’’ the couplings
are supporting (positive) couplings with no negative
impact. Only the force required to disengage the clutch is
in contradiction to the other requirements. However,
solutions with for example an increased length of the lever
arm or a hydraulic actuation could decrease the maximum
required force.
3 A complex systems model
3.1 Assumptions
A product or system usually comprises of multiple func-
tions and sub-functions that interact and are more or less
coupled through the structural realization of the product or
system (compare to the simplified diaphragm spring clutch
example with its five functions which are coupled through
the design parameters). For the presented model, a system
is defined by the governing equations of its functions. All
information and dependencies between design parameters,
noise factors and functional outputs are assumed to be
known. However, for real-world examples, this would be
unrealistically resource intensive. The probabilistic mod-
elling approach used in this study enables the investigator
to generalize from a population of systems, but also easily
alter assumptions of the model to match new findings and
Fig. 7 Schematic of a diaphragm spring clutch. Adopted from Hillier
and Coombes (2004)
Fig. 6 Contradicting (negative) coupling of functions
Table 1 List of FRs and DPs for diaphragm clutch example
Functional requirements (FR) Design parameters (DP)
Transmittable torque (T) Diaphragm spring constant (k)
Force to disengage clutch (F) Thickness of friction surface (t)
Responsiveness of clutch (R) Friction surface inner radius (ri)
Wear (W) Friction surface outer radius (ro)
Heat capacity of friction
surface (c)
Friction surface density (q)
Res Eng Design
123
Author's personal copy

to check the robustness of the results. It is further assumed
that the random parameter set x1. . .xn is a valid solution to
the design problem and all m functions are satisfactory
fulfilled in that point. An optimization for maximum
robustness is out of scope for this study. In a real design
situation, there would also be weighting factors for each
function meaning certain functions are more important or
critical than others. The nature of the functions may also
differ, some being more binary in nature, either functioning
or non-functioning, where others would have a continuous
spectrum of performance. For the purpose of this study, it
is assumed that all functions are equally weighted and have
a continuous nature. It is also assumed that the relative
variation is the same for all influencing factors.
3.2 Model characteristics and set-up
In a previous study, Frey and Li (2008) adapted the
hierarchical probability model (HPM) developed by
Chipman et al. (1997) to assess the effectivity of param-
eter design methods. The HPM is solely a model for single
functions and has in this work been extended for complex
products and systems. Looking only at a small number of
systems can be misleading since there are examples for
complex but robust (aero engines, see also Carlson and
Doyle 2000) but also simple and non-robust systems (GM
ignition switch Eifler et al. 2014). The purpose of the
surrogate model presented in the following is to be able to
analyse a population of systems in a quick and inexpen-
sive manner to be able to probabilistically assess the
association between complexity and robustness. The
model builds upon the nature of functional dependencies
as observed in real-world systems. Three main character-
istics and regularities can be seen from empirical data that
have also widely been used in the design of experiment
(DoE) context (see for example Box and Meyer 1986; Wu
and Hamada 2011).
1. Sparsity of effects: Experiments have shown that ‘‘the
responses [of functions] are driven largely by a limited
number of main effects and lower-order interactions in
most of the systems, and that higher-order interactions
usually are relatively unimportant’’ (Kutner et al.
2004). In other words, there are usually only a small
number of factors or parameters in systems that are
actually influencing the performance of the functions.
These are called to be ‘‘active’’ (Lenth 1989). This
follows along with the well known Pareto’s principle,
also commonly referred to as the 80/20-rule stating
that 80 % of the effects comes from 20 % of all
influencing factors. In terms of modelling, this char-
acteristic reduces the complexity and eases the repre-
sentation of a function.
2. Hierarchy: Another common observation is that main
effects are typically stronger than second-order inter-
actions which are usually larger than third-order
interactions and so on (Wu and Hamada 2011).
3. Inheritance: Empirical data reveal that interaction
effects are more likely to be active if the interacting
parameters’ main effects are active (Wu and Hamada
2011).
To capture the entire product or system, which can be
seen as a set of coupled functions, the model of Frey and Li
(2008) has been extended. Equations (7) through (14)
describe the main structure of the hierarchical probability
systems model (HPSM). The HPSM describes functional
response hyper-surfaces of multi-factor–multi-function
systems that reflect observed functional regularities of
sparsity, hierarchy and inheritance. In the way it is set up, it
allows the investigator to adjust model parameters and
probabilities to match assumptions and empirical data.
The hierarchical probability model by Frey & Li has
been augmented by a functional dimension. There are m
functions in a system with the ith function’s performance
yl x1; . . .; xnð Þ expressed by a third-order polynomial equa-
tion that covers the effects of all n parameters x1. . .xn and
their interactions up to third order (Eq. 7). Modelling up to
the third order is a sensible way of covering the most
common effects without over-complicating the model.
x1. . .xn are the influencing parameters to the entire system
(Eq. 8). These can be design parameters or part properties
that can be controlled by the designer or environmental
effects outside of the control of the engineers. In contrast to
the model by Frey and Li, the differentiation between
design parameters and noise factors is not necessary, since
the analysis of couplings and contradictions is independent
of the nature of the influencing factor. However, the dis-
tinction can easily be reintegrated to the model. For the
remainder of the article, design parameters and noise fac-
tors will be referred to as influencing parameters (IPs).
The IPs are described by �x, a vector of continuous
variables each randomly assigned between 0…1 to be able
to vary the parameters for the assessment of the system
robustness. The hierarchical probability model by Frey &
Li has only two levels [0, 1] for x. It reflects the original
experiments the model is based on, which chose the can-
didate range for x to cover the highest and lowest antici-
pated x. The experimental error from observations e is
irrelevant for this model and has been omitted. The prob-
ability p that a main effect is active di ¼ 1ð Þ is described by
Eq. (9). p is a probability value that incorporates the
sparsity characteristic to the system. Equation (10) and
(11) provide the probabilities that second- and third-order
effects are active dependent on their parental main effects’
activity. This introduces the characteristic of inheritance to
Res Eng Design
123
Author's personal copy

the system. Lastly, Eqs. (12–14) prescribe the b coeffi-
cients, i.e. the magnitudes of the effects on the functional
output y, dependent on the associated effect being active or
not (d ¼ 1 or d ¼ 0, respectively). As opposed to IPs, the
effect magnitudes solely depend on the underlying natural
laws and are therefore theoretically unbounded (see
example Fig. 8). To reflect that, the coefficients are random
normally distributed values with mean l ¼ 0 and variance
r2 ¼ d2 for active effects and 0 for inactive effects. Note
that even active effects can have insignificant effects on the
function since the mean of b is set to zero. Inactive effects
have been omitted for this model opposed to the underlying
model to avoid coupling in all possible parameters and
allow for independence of the functions in the system as
this is good design practice. Depending on the investiga-
tion, the constant b0 can be chosen to ensure non-zero or
positive values of y or simply be set to zero without loss of
generality. The hierarchical structure of effects is described
by Eqs. (13) and (14) reducing the second- and third-order
effects by 1s1
and 1s2
, respectively.
yl x1; x2; . . .; xnð Þ ¼ b0lþXni¼1
bil xi þXni¼1
Xj¼1
n
j[ i
bijl xixj
þXni¼1
Xj¼1
n
j[ i
Xk¼1k[ i
n
k[ j
bijkl xixjxk
l 2 1. . .m
ð7Þ
xi 2 0. . .1f g i 2 1. . .n ð8ÞPr di ¼ 1ð Þ ¼ p ð9Þ
Pr dij ¼ 1jdi; dj� �
¼p00 if di þ dj ¼ 0
p01 if di þ dj ¼ 1
p11 if di þ dj ¼ 2
8<: ð10Þ
Pr dij ¼ 1jdi; dj; dk� �
¼
p000 if di þ dj þ dk ¼ 0
p001 if di þ dj þ dk ¼ 1
p011 if di þ dj þ dk ¼ 2
p111 if di þ dj þ dk ¼ 3
8>><>>:
ð11Þ
f bijdið Þ ¼ 0 if di ¼ 0
N 0; d2ð Þ if di ¼ 1
�ð12Þ
f bijdið Þ ¼ 0 if di ¼ 0
N 0; d2ð Þ if di ¼ 1
�ð13Þ
f bijkjdijk� �
¼ 1
s2
0 if dijk ¼ 0
N 0; d2ð Þ if dijk ¼ 1
�ð14Þ
3.3 Types of functional requirements
There are three types of functional requirements as descri-
bed in (Taguchi et al. 2005)—maximum is best, minimum is
best and nominal is best. The first two differ only in the sign
and can be described in the same manner. These require-
ments are functionally bound only by a minimum (for
maximum is best) or maximum (for minimum is best)
requirement. However, physical constraints limit the maxi-
mum performance. An example for a minimum-is-best
requirement is the weight of an airplane. The weight
determines the fuel consumption and the lift needed. How-
ever, since a certain payload capability is required which
again requires a certain lift and thrust the structural rigidity
sets the lower bound for the empty weight of the airplane.
An example for a maximum-is-best requirement is a simple
pair of scissors where the length of the lever arm determines
the cutting force. The lower limit of the size of the pair of
scissors is set by the minimum required cutting force, the
upper bound by the sheer size and ergonomics. Nominal-is-
best requirements are functionally constraint on the upper
and lower bound. A push button of a device, for example,
should not be too easy or too hard to push since the user
would associate both with a malfunction.
In the presented surrogate system model, the functions
have requirements of the type maximum is best and mini-
mum is best. Nominal-is-best requirements can be modelled
as two separate functions one minimum is best, the other
maximum is best with the same set of beta coefficients.
4 System evaluation
The developed surrogate model realistically describes a
product or system with multiple functions and multiple
influencing parameters. For this study, the system properties
of interest are the complexity, i.e. the couplings and their
level of contradiction, and the robustness. However, the
model is not limited to complexity and robustness studies but
can also be used for other investigations like optimization or
design of experiments investigations.
4.1 Coupling and contradiction
A system as described in the presented model consists of
multiple functions with multiple influencing parameters
and their interactions. A common way to measure the
Fig. 8 Modelling the outgoing force Fout að Þ in a principle lever
design with a third-order polynomial equation for small a gives
(theoretically unbounded) high values for ba
Res Eng Design
123
Author's personal copy

complexity of the system is to evaluate the degree of
coupling between the single functions, i.e. how many
parameters are shared and what the influence of these
parameters on the individual function is (Summers and
Shah 2010). In axiomatic design (AD), Nam P. Suh dis-
tinguishes between three different types of systems and
stresses the importance of the independence of functions
for a predictable and high performance (design axiom 1).
1. Uncoupled systems
2. Decoupled systems
3. Coupled systems
However, no further distinction between systems of the
same type is made on the conceptual level. Meaning that in
cases where uncoupling or decoupling of the system cannot
be achieved due to, for example, other DfX constraints,
there is no means to further screen and compare the
goodness of concepts. Suh’s second design axiom, the
information axiom, aims at the probability of achieving the
required performances of the designed functions, which
needs further and more detailed insights about the
requirements on the one hand and the production capabil-
ities on the other hand. A sensible extension of the inde-
pendence axiom is to assess a system’s complexity by
evaluating the level of contradiction imposed onto the
design, as discussed earlier in this paper.
In the presented study, the contradiction of a function in
a system is described by the comparison of the influences
cijk of the single parameters on the different functions
(Eq. 15). For this purpose, the weighted ratio was taken,
reflecting the correlation of two functions in a particular
parameter. The contradiction cijkl of a function l with
respect to a parameter xixjxk is then defined as the maxi-
mum of the weighted ratios evaluated against all other
functions w (Eq. 16). Note that there is minus sign to get a
positive contradiction value.
cil ¼ max� 0
�cilcilciw
� �; cijl ¼ max
� 0�cijl
cijlcijw
!; cijkl
¼ max� 0
�cijklcijklcijkw
!ð16Þ
The highest possible value of contradiction in an IP is
therefore cijkl ¼ 1 in the case that two functions share the
same IP which accounts for 100 % of the functions’ per-
formance with opposite signs on the betas and therefore
opposite requirements for this parameter or property. To
describe the contradiction of a function, the sum is taken
over all the individual contradictions in the IPs (Eq. 17).
cl ¼Xni¼1
cil þXni¼1
Xj¼1
n
j[ i
cijl þXni¼1
Xj¼1
n
j[ i
Xk¼1k[ i
n
k[ j
cijkl ð17Þ
As for the contradiction value of functions to single IPs,
the function contradiction cl is bounded to 1 (or 100 %).
cl = 100 % relates to a fully contradicted function mean-
ing that the function shares all of its IPs with other func-
tions with entirely contradicting requirements towards the
IPs. To evaluate the contradiction level of a system, the
most contradicted function was taken (Eq. 18).
cSys ¼ max clð Þ ð18Þ
The example of the diaphragm spring clutch introduced
in Sect. 2 yields a contradiction value of 0.7. The force to
disengage the clutch (F) and the responsiveness (R) have
strongly contradicting requirements with respect to the
relevant IPs (k and t). However, as mentioned before the
force to disengage the clutch can be addressed by a sup-
porting function like a lever arm or hydraulic actuator. This
essentially decouples the functions leading also to a lower
contradiction score. Neglecting the disengagement force as
a function leads to a contradiction value of 10 %.
It has to be noted that this is a simplification for the
description of a system’s contradiction level to ensure
applicability in practice. There are instances where cou-
plings and contradictions span multiple functions compli-
cating the metric significantly.
4.2 Robustness
The robustness level of a product or system describes its
functional insensitivity to variation of any kind whilst
satisfactory meeting all functional requirements. The
sources of variation can be categorized in manufacturing,
cijkl ¼bijkxixjxkPn
i¼1 bil�� ��xi þPn
i¼1
Pn
j ¼ 1
j[ i
bijl�� ��xixj þPn
i¼1
Pn
j ¼ 1
j[ i
Pn
k ¼ 1
k[ i
k[ j
bijkl�� ��xixjxk ð15Þ
Res Eng Design
123
Author's personal copy

assembly, load, environment, material, signal and time-
dependent variation (Ebro et al. 2012). Robustness can be
evaluated in many ways (Gohler et al. 2016). However,
most metrics to describe robustness only address single
functions. Among those are for example, the signal-to-
noise ratio (Taguchi et al. 2005), derivative-based and
variance-based as well regression-based sensitivities indi-
ces (Saltelli et al. 2008). In robust design optimization
(RDO), this trade-off problem is addressed with multi-ob-
jective optimization algorithms. For example, Bras and
Mistree (1993) utilize the methodology of compromise
decision support problems (cDSP).
For this study, the evaluation of the system robustness is
based on the idea that a robust system is less sensitive to
ingoing variation and therefore has a larger design space
also called common range which is the overlap between the
design range and the system range (Suh 2001). Monte Carlo
analysis (MCA) is used to alter all influencing parameters
simultaneously in order to cover the entire system range.
However, the definition of the common range is dependent
on a ‘‘goodness’’ criterion for the systems’ individual
functional performance. Using this criterion to judge if a
parameter set leads to the system being acceptable or
unacceptable is similar to reliability assessments where a
system can also only have two states: working or failed. The
number of successes in the MCA is a measure of how big
the common range is and therefore how robust the system is
to variation. In the remainder of this paper, we will refer to
this robustness score as the yield Y .
The MCA comprises of b iterations (trials) where the
parameters x1. . .xn are varied randomly in a specified
interval vDP for allowed variations to derive the varied
parameter set x0i (Eq. 19). The performance ratio prl for the
individual functions yl is computed and compared to the
yield criterion z (Eqs. 20 ? 21). If the performance ratio is
greater than or equal to the yield criterion, this iteration (in
design terms: combination of varied parameters) is con-
sider a ‘‘success’’. As discussed earlier in this article, only
max-is-best and min-is-best requirements are taken into
account for this study. In this case, z can be interpreted as
minimum required performance relative to the nominal
performance. The yield, i.e. the ratio of successes to trials,
is normalized with the number of influential factors a in the
system (Eqs. 22 ? 23). Even though a parameter is active,
its contribution can be very low. By normalizing with the
number of influencing factors, the robustness scores can be
made comparable.
x0
i ¼ 1� vDP
2
� þ rand � vDP
h i� xi ð19Þ
prl ¼yl �x
0ð Þ � yl �xð Þyl �xð Þ
ð20Þ
success prl� z for all l ð21Þ
Y ¼
ffiffiffiffiffiffiffiffiffiffiffiffiffiffiffiffiffiffiffiffiffiffiffiffiffiffiffiffiffiffiffiffiffiffiffiffiffi# of successes
# of trials
� �a
sð22Þ
a ¼ # of xijkjbijkl�� ��xijkbijkl�� ��xijk*
� 1
# of Active Paramtersð23Þ
5 Model execution
MATLAB is used to compute a data set of q systems with the
presented hierarchical probability system model and to eval-
uate their functional contradiction and robustness. Analysing
a population of systems yields the advantage to detect trends
and correlations. Due to the probabilistic set-up of the model
there is a chance of ‘‘zero’’ functions where all coefficients bare zero for a function. In that case, the product or system
would fail to accomplish one of the required functions. Those
systems are considered incomplete and erased from the data
set. Furthermore, there is a chance for the parameter set �x
being the only solution for z ¼ 0 and low numbers of influ-
encing factors. These cases have also been disregarded.
The values for the probabilities and factors for the single
functions in the model have been adapted from Frey and Li
(2008), who investigated various empirical examples to
extract those, to ensure the link to real-world systems.
Table 2 states all probabilities and factors used in the model.
Given the probabilities in Table 2, the system model has
been set up for n = 5 influencing parameters and m = 5
functions in a population of q = 250 systems. These model
parameters have been chosen to keep the computational effort
to a reasonable extent whilst ensuring well distributed data
points across the whole range of contradiction and level of
robustness and therefore ensuring the power of the data. The
dependence of the selected number of influencing parameters
and functions on the outcome will be investigated and dis-
cussed later in the paper. The MCA sample size has been
selected to b ¼ 1000000 following a study of the conver-
gence for the slope and the intercept in the linear regression
model (for the case vDP ¼ 10%, z ¼ 0) as a balance between
computational time and accuracy (see Fig. 9).
6 Results
6.1 Association between coupling and robustness
Figure 10 shows a scatter plot of the normalized yield and
therefore of the system robustness against the number of
couplings in a system for q ¼ 250 simulated systems with
a uniformly distributed variation vDP ¼ 10% in the IPs and
Res Eng Design
123
Author's personal copy
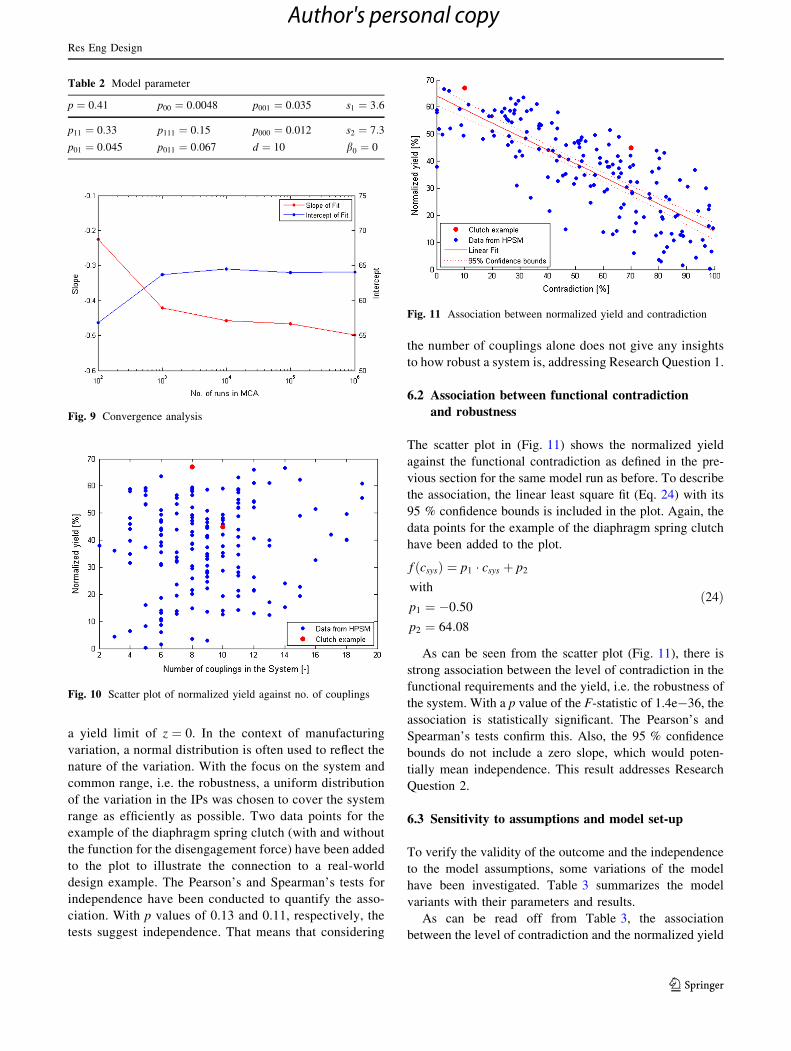
a yield limit of z ¼ 0. In the context of manufacturing
variation, a normal distribution is often used to reflect the
nature of the variation. With the focus on the system and
common range, i.e. the robustness, a uniform distribution
of the variation in the IPs was chosen to cover the system
range as efficiently as possible. Two data points for the
example of the diaphragm spring clutch (with and without
the function for the disengagement force) have been added
to the plot to illustrate the connection to a real-world
design example. The Pearson’s and Spearman’s tests for
independence have been conducted to quantify the asso-
ciation. With p values of 0.13 and 0.11, respectively, the
tests suggest independence. That means that considering
the number of couplings alone does not give any insights
to how robust a system is, addressing Research Question 1.
6.2 Association between functional contradiction
and robustness
The scatter plot in (Fig. 11) shows the normalized yield
against the functional contradiction as defined in the pre-
vious section for the same model run as before. To describe
the association, the linear least square fit (Eq. 24) with its
95 % confidence bounds is included in the plot. Again, the
data points for the example of the diaphragm spring clutch
have been added to the plot.
f ðcsysÞ ¼ p1 � csys þ p2
with
p1 ¼ �0:50
p2 ¼ 64:08
ð24Þ
As can be seen from the scatter plot (Fig. 11), there is
strong association between the level of contradiction in the
functional requirements and the yield, i.e. the robustness of
the system. With a p value of the F-statistic of 1.4e-36, the
association is statistically significant. The Pearson’s and
Spearman’s tests confirm this. Also, the 95 % confidence
bounds do not include a zero slope, which would poten-
tially mean independence. This result addresses Research
Question 2.
6.3 Sensitivity to assumptions and model set-up
To verify the validity of the outcome and the independence
to the model assumptions, some variations of the model
have been investigated. Table 3 summarizes the model
variants with their parameters and results.
As can be read off from Table 3, the association
between the level of contradiction and the normalized yield
Fig. 9 Convergence analysis
Fig. 10 Scatter plot of normalized yield against no. of couplings
Fig. 11 Association between normalized yield and contradiction
Table 2 Model parameter
p ¼ 0:41 p00 ¼ 0:0048 p001 ¼ 0:035 s1 ¼ 3:6
p11 ¼ 0:33 p111 ¼ 0:15 p000 ¼ 0:012 s2 ¼ 7:3
p01 ¼ 0:045 p011 ¼ 0:067 d ¼ 10 b0 ¼ 0
Res Eng Design
123
Author's personal copy

is statistically significant for the model variants 1–7. In
particular, the results show that the association holds also
for systems with higher numbers of IPs n and functions m.
Furthermore, the results from variant 4 suggest that the
association is independent of the setting of the variation
interval vDP. However, the yield is strongly associated with
the minimum required performance of the functions z.
Since main effects with linear correlations to the functional
performance are most likely and most powerful in the
presented model, it is expected that for decreasing yield
limits to equal or close to the magnitude of the ingoing
variation vDP, the yield increases and becomes independent
of the level of contradiction. In simple terms, this means
that as the specification window becomes wider, finding a
design solution becomes easier and easier with a huge
range of values to choose from. At a certain point, the
specification windows are so large that the contradictions
cause a relatively minor limitation to the parameter selec-
tion range and therefore have little impact on the yield. The
results for variants 5–8 confirm this. Figure 12 shows the
linear fits for a decreasing yield limit z ¼ 0. . .� 0:1. The
ingoing variation is in all cases vDP ¼ 10 %. All other
model parameters are also kept.
7 Discussion
Various scholars have investigated the relation between
robustness to variation and complexity. However, there is
no universal definition of complexity, and therefore, the
studies had often different foci and levels of detail. One of
the most influential frameworks in this field is axiomatic
design, as discussed in this paper. Suh (2001) defines
complexity ‘‘as a measure of uncertainty on achieving the
specified FRs’’. The metric of the information content,
which is defined as the logarithm of the inverse of the
probability of success, is used both as metric for robustness
but also complexity (El-Haik and Yang 1999). Magee and
de Weck (2004) describe a complex system as ‘‘a system
with numerous components and interconnections, interac-
tions or interdependence […]’’. In accordance with this
definition, some complexity metrics can be found in the
literature that are based on the part and interface count as
well as the number of part and interface types (Slagle
2007). These, however, are very simplified metrics and not
appropriate to be used in the context of robustness due to
the lack of the functional dimension. In the original robust
design approach by Taguchi, system complexity plays a
minor role. Implicitly, a less complex design can easily be
optimized in the parameter design phase. On the other
hand, a certain complexity is necessary to be able to find
more robust parameter settings (Taguchi et al. 2005).
Taguchi’s view on complexity, however, refers therefore
more to the sheer number of parameters. Summers and
Shah (2010) distinguish between complexity metrics based
on the size (‘‘information that is contained within a prob-
lem’’), coupling (‘‘connections between variables at mul-
tiple levels’’) and solvability (the difficulty of solving a
design problem) for the evaluation of parametric and
geometric embodiment design problems (see also Braha
and Maimon 1998). In this study, we define complexity
through the degree of coupling and the level of contra-
diction between functional requirements. This is an
extension of the ideas of the independence axiom. Suh
presents a mathematical argumentation showing that for
deterministic worst case considerations, the allowable
variations in the design parameters DDP for specified
variation limits of the functional requirements DFR are
greatest for uncoupled designs (Suh 2001). However, these
robustness calculations are dependent on set DFRs imply-
ing that all FRs are of the type nominal is best, which
cannot always be assumed as shown in the clutch example
case. Furthermore, an example for a more robust coupled
Fig. 12 Association between normalized yield and contradiction
dependent on yield criterion z
Table 3 Model variants
Variant n m vDP z Intercept Slope p value
Baseline 5 5 0.1 0 64.08 -0.50 1.4e-36
1 10 10 0.1 0 63.59 -0.33 1.0e-8
2 10 5 0.1 0 79.27 -0.36 1.8e-32
3 15 5 0.1 0 85.02 -0.24 2.6e-28
4 5 5 0.3 0 65.50 -0.51 1.2e-33
5 5 5 0.1 -2.5 % 70.12 -0.23 7.9e-20
6 5 5 0.1 -5 % 75.36 -0.11 1.4e-5
7 5 5 0.1 -7.5 % 84.75 -0.07 0.0005
8 5 5 0.1 -10 % 91.01 -0.04 0.12
Res Eng Design
123
Author's personal copy

design has been presented in the opening of this paper
(Figs. 3, 4).
To the authors’ knowledge, the presented study is the
first attempt to relate robustness and complexity quantita-
tively using a model-based probabilistic approach. We
found that for max- and min-is-best requirements, it is not
the coupling of functions itself, but rather the level of
contradiction of the couplings that influences robustness.
As long as contradictions in the requirements imposed on
the parameters, properties and dimensions of the system
can be avoided, coupling does not inherently harm the
robustness. Descriptive studies like the one by Frey et al.
(2007) support this finding with an empirical analysis of
complex systems. They assessed part counts and com-
plexity of airplane engines against their reliability and
found that despite the constantly increasing degree of
coupling and integration, the reliability of aero engine
improved. Braha and Bar-Yam (2007, 2013) studied the
network topology of four large-scale product development
networks. They defined coupling with the concept of
assortativity, which describes the tendency of nodes (IPs in
the case of engineering design networks) with high con-
nectivity to connect with other nodes with high connec-
tivity. Networks with high assortativity are inherently more
complex which tends to reduce system robustness. Con-
tradiction as defined in this study can be seen as a measure
of assortativity in the domain of unipartite networks. Fur-
thermore, it was found that systems are robust and error
tolerant to variation in random nodes but vulnerable to
perturbation in the highly connected central nodes (‘‘design
hubs’’) (Albert and Barabasi 2002; Braha et al. 2013; Sosa
et al. 2011). In the engineering design context, this refers to
the necessity to control the design but also the variation of
the most influential parameters with contradicting
requirements (Braha and Bar-Yam 2004, 2007). Carlson
and Doyle (2000) proposed and discussed the framework of
HOT (Highly Optimized Tolerances). They argue that
evolving complex systems which underwent numerous
generations are extremely robust to designed-for variation,
but ‘‘hypersensitive to design flaws and unanticipated
perturbations’’. The increase in robustness is driven by
continuous development and improvement including solv-
ing of known imperfections and contradictions. This view
supports the results of the presented study. An implication
of these findings is that the TRIZ contradiction matrix
(Altshuller 1996) is likely to be a suitable method for
increasing system robustness at a conceptual level. The
method suggests that the contradicting parameters are the
limiting factors of a design and inventive principles can be
identified to overcome the contradictions ‘‘without
compromise’’.
A limitation of the presented study is that as of now, the
model features only maximum-is-best and minimum-is-
best requirements. Nominal-is-best requirements have
been neglected. To extend the insight to all types of
requirements, further investigations are needed. Further,
this study is based on the analysis of a population of
complex systems generated with the model proposed in
this paper. We found clear correlations between the level
of contradiction and robustness. Whilst definite predictions
for the robustness of single systems cannot be made, it can
be concluded that the chance that a contradicted system is
less robust is high.
8 Concluding remarks
In this study, we extended the hierarchical probability
model by Frey and Li (2008) to model complex systems
and their functional responses for the case of maximum-is-
best and minimum-is-best requirements. The model was
used to assess how a system’s robustness to variation is
influenced by design complexity in terms of the degree of
functional coupling and the level of contradiction between
the functional requirements.
In answer to Research Question 1, the correlation between
the number of couplings in the system and the system
robustness was found not to be statistically significant.
In answer to Research Question 2, a statistically sig-
nificant association between the level of contradiction and
system robustness was found (p = 1.4e-36) where an
increase in contradiction is associated with a decrease in
robustness.
These results have great implications on our under-
standing of the nature of complexity and robustness. Suh
suggests two design axioms which can be, to an extent,
‘‘accepted without proof’’ (as per the definition of an axiom).
The robustness claims of the independence axiom are based
on assumptions about the fill of the design matrices and the
nature of the functional requirements, which are not always
fulfilled in real-world examples. The results in this study
challenge Suh’s theory about the negative impact of cou-
pling in systems with max- and min-is-best requirements,
stressing that it is actually the level of contradiction of the
couplings that determines the level of robustness. Uncoupled
designs are by definition free from coupling and therefore
contradictions and as a result are inherently robust relative to
coupled designs (in general). However, there are specific
examples where this does not hold, since coupling can be
used to reduce the number of influencing factors, it is pos-
sible to reduce the overall variability and therefore improve
the robustness by the introduction of positive couplings
(couplings without contradiction).
In practical terms, the knowledge of the association
between system robustness and functional coupling can be
used in early design stages. When the first concepts and
Res Eng Design
123
Author's personal copy

embodiments are produced, engineers are often able to
identify the most influential properties and dimensions for
the performance of the single functions, making it possible
to evaluate contradictions to a certain level. A robustness
evaluation can therefore be conducted on the different
concepts based on the level of contradiction identified
within the concepts. Further, the design focus and control
should lay on the coupled and contradicted parameters.
However, for precise evaluations of functional perfor-
mances, yield and reliability, detailed models and experi-
ments are necessary. Knowing about contradicting and
competing requirements provides insight into the robust-
ness characteristics of complex products or systems that
can be utilized to minimize risk and make more educated
concept selections.
Acknowledgments The authors would like to thank Novo Nordisk
for their support for this research project.
References
Albert R, Barabasi A-L (2002) Statistical mechanics of complex
networks. Rev Mod Phys 74(1):47–97. doi:10.1103/RevMod
Phys.74.47
Altshuller G (1996) And suddenly the inventor appeared: TRIZ, the
theory of inventive problem solving. Technology
Apple (2015) Apple iPhone technical specifications. https://support.
apple.com/specs/iphone
Box GEP, Meyer RD (1986) An analysis for unreplicated fractional
factorials. Technometrics. doi:10.2307/1269599
Box GEP, Wilson KB (1951) On the experimental attainment of
optimum conditions. J R Stat Soc 13(1959):1–45. doi:10.1007/
978-1-4612-4380-9_23
Braha D, Bar-Yam Y (2004) Information flow structure in large-scale
product development organizational networks. J Inf Technol
19(4):244–253. doi:10.1057/palgrave.jit.2000030
Braha D, Bar-Yam Y (2007) The statistical mechanics of complex
product development: empirical and analytical results. Manag
Sci 53(7):1127–1145. doi:10.1287/mnsc.1060.0617
Braha D, Maimon O (1998) The measurement of a design structural
and functional complexity. IEEE Trans Syst Man Cybern Part A
Syst Hum 28(4):527–535. doi:10.1109/3468.686715
Braha D, Brown DC, Chakrabarti A, Dong A, Fadel G, Maier JRA,
Wood K (2013) DTM at 25: essays on themes and future
directions. In: Proceedings of the 2013 ASME international
design engineering technical conferences & computers and
information in engineering conference IDETC/CIE. Portland,
Oregon, pp 1–17
Bras BA, Mistree F (1993) Robust design using compromise decision
support problems. Eng Optim. doi:10.1080/03052159308940976
Carlson JM, Doyle J (2000) Highly optimized tolerance: robustness
and power laws in. Complex Systems. doi:10.1103/PhysRevE.
60.1412
Chipman H, Hamada M, Wu CFJ (1997) Variable-selection Bayesian
approach for analyzing designed experiments with complex
aliasing. Technometrics 39:372–381. doi:10.1080/00401706.
1997.10485156
Ebro M, Howard TJ (2016) Robust design principles for reducing
variation in functional performance. J Eng Des. doi:10.1080/
09544828.2015.1103844
Ebro M, Howard TJ, Rasmussen JJ (2012) The foundation for robust
design: enabling robustness through kinematic design and design
clarity. In: Proceedings of international design conference,
DESIGN, vol DS 70, pp 817–826
Eifler T, Olesen JL, Howard TJ (2014) Robustness and reliability of
the GM ignition switch—a forensic engineering case. In: 1st
International symposium on robust design, pp. 51–58
El-Haik B, Yang K (1999) The components of complexity in
engineering design. IIE Trans 31(10):925–934. doi:10.1080/
07408179908969893
Frey DD, Li X (2008) Using hierarchical probability models to
evaluate robust parameter design methods. J Qual Technol
40(1):59–77
Frey D, Palladino J, Sullivan J, Atherton M (2007) Part count and
design of robust systems. Syst Eng 10(3):203–221. doi:10.1002/
sys.20071
Gohler SM, Howard TJ (2015) The contradiction index—a new
metric combining system complexity and robustness for early
design stages. In: Proceedings of the ASME 2015 international
design engineering technical conferences & computers and
information in engineering conference, pp 1–10
Gohler SM, Eifler T, Howard TJ (2016) Robustness metrics:
consolidating the multiple approaches to quantify robustness.
J Mech Des. doi:10.1115/1.4034112
Gribble SD (2001) Robustness in complex systems. In: Proceedings
eighth workshop on hot topics in operating systems, pp. 17–22.
doi:10.1109/HOTOS.2001.990056
Hillier VAW, Coombes P (2004) Hillier’s fundamentals of motor
vehicle technology. Nelson Thornes, Cheltenham
Jackson A (2013) A road to safety: evolution of car safety features.
http://visual.ly/evolution-car-safety-features
Kutner MH, Nachtsheim C, Neter J (2004) Applied linear regression
models. McGraw-Hill/Irwin, New York
Lenth R (1989) Quick and easy analysis of unreplicated factorials.
Technometrics. doi:10.2307/1269997
Magee CL, de Weck OL (2004) Complex System Classification.
Incose. doi:10.1002/j.2334-5837.2004.tb00510.x
Saltelli A, Ratto M, Andres T, Campolongo F, Cariboni J, Gatelli D,
Tarantola S (2008) Global sensitivity analysis: The primer.
Wiley, Chichester
Slagle JC (2007) Architecting complex systems for robustness. In:
Master’s Thesis, Massachusetts Institute of Technology
Sosa M, Mihm J, Browning T (2011) Degree distribution and quality
in complex engineered systems. J Mech Des 133(10):101008.
doi:10.1115/1.4004973
Suh NP (2001) Axiomatic design: advances and applications. Oxford
University Press, New York
Summers JD, Shah JJ (2010) Mechanical engineering design com-
plexity metrics: size, coupling, and solvability. J Mech Des.
doi:10.1115/1.4000759
Taguchi G, Chowdhury S, Wu Y (2005) Taguchi’s quality engineer-
ing handbook. Wiley, Hoboken
Wu CJ, Hamada MS (2011) Experiments: planning, analysis, and
optimization. Wiley, Hoboken
Res Eng Design
123
Author's personal copy
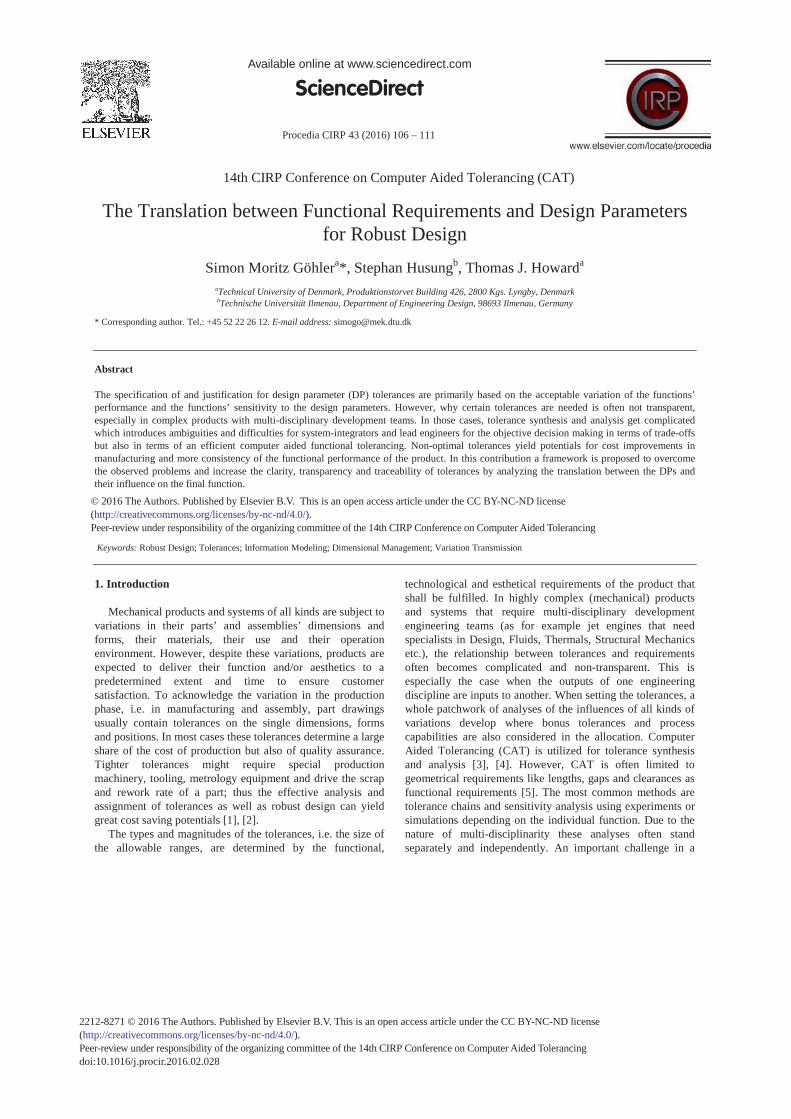
Available online at www.sciencedirect.com
2212-8271 © 2016 The Authors. Published by Elsevier B.V. This is an open access article under the CC BY-NC-ND license (http://creativecommons.org/licenses/by-nc-nd/4.0/).Peer-review under responsibility of the organizing committee of the 14th CIRP Conference on Computer Aided Tolerancingdoi: 10.1016/j.procir.2016.02.028
Procedia CIRP 43 ( 2016 ) 106 – 111
ScienceDirect
14th CIRP Conference on Computer Aided Tolerancing (CAT)
The Translation between Functional Requirements and Design Parameters for Robust Design
Simon Moritz Göhlera*, Stephan Husungb, Thomas J. Howarda aTechnical University of Denmark, Produktionstorvet Building 426, 2800 Kgs. Lyngby, Denmark bTechnische Universität Ilmenau, Department of Engineering Design, 98693 Ilmenau, Germany
* Corresponding author. Tel.: +45 52 22 26 12. E-mail address: [email protected]
Abstract
The specification of and justification for design parameter (DP) tolerances are primarily based on the acceptable variation of the functions’ performance and the functions’ sensitivity to the design parameters. However, why certain tolerances are needed is often not transparent, especially in complex products with multi-disciplinary development teams. In those cases, tolerance synthesis and analysis get complicated which introduces ambiguities and difficulties for system-integrators and lead engineers for the objective decision making in terms of trade-offs but also in terms of an efficient computer aided functional tolerancing. Non-optimal tolerances yield potentials for cost improvements in manufacturing and more consistency of the functional performance of the product. In this contribution a framework is proposed to overcome the observed problems and increase the clarity, transparency and traceability of tolerances by analyzing the translation between the DPs and their influence on the final function. © 2016 The Authors. Published by Elsevier B.V. Peer-review under responsibility of the organizing committee of the 14th CIRP Conference on Computer Aided Tolerancing.
Keywords: Robust Design; Tolerances; Information Modeling; Dimensional Management; Variation Transmission
1. Introduction
Mechanical products and systems of all kinds are subject to variations in their parts’ and assemblies’ dimensions and forms, their materials, their use and their operation environment. However, despite these variations, products are expected to deliver their function and/or aesthetics to a predetermined extent and time to ensure customer satisfaction. To acknowledge the variation in the production phase, i.e. in manufacturing and assembly, part drawings usually contain tolerances on the single dimensions, forms and positions. In most cases these tolerances determine a large share of the cost of production but also of quality assurance. Tighter tolerances might require special production machinery, tooling, metrology equipment and drive the scrap and rework rate of a part; thus the effective analysis and assignment of tolerances as well as robust design can yield great cost saving potentials [1], [2].
The types and magnitudes of the tolerances, i.e. the size of the allowable ranges, are determined by the functional,
technological and esthetical requirements of the product that shall be fulfilled. In highly complex (mechanical) products and systems that require multi-disciplinary development engineering teams (as for example jet engines that need specialists in Design, Fluids, Thermals, Structural Mechanics etc.), the relationship between tolerances and requirements often becomes complicated and non-transparent. This is especially the case when the outputs of one engineering discipline are inputs to another. When setting the tolerances, a whole patchwork of analyses of the influences of all kinds of variations develop where bonus tolerances and process capabilities are also considered in the allocation. Computer Aided Tolerancing (CAT) is utilized for tolerance synthesis and analysis [3], [4]. However, CAT is often limited to geometrical requirements like lengths, gaps and clearances as functional requirements [5]. The most common methods are tolerance chains and sensitivity analysis using experiments or simulations depending on the individual function. Due to the nature of multi-disciplinarity these analyses often stand separately and independently. An important challenge in a
© 2016 The Authors. Published by Elsevier B.V. This is an open access article under the CC BY-NC-ND license (http://creativecommons.org/licenses/by-nc-nd/4.0/).Peer-review under responsibility of the organizing committee of the 14th CIRP Conference on Computer Aided Tolerancing
107 Simon Moritz Göhler et al. / Procedia CIRP 43 ( 2016 ) 106 – 111
multi- disciplinary industrial application is that the engineers use different vocabularies for the requirement and problem specifications. Furthermore, for the specification of interface requirements often product characteristics (e.g. large width) are used instead of the required properties (e.g. high stiffness). As for the nominal dimensions that are being passed from discipline to discipline, the same happens to the tolerances and safety factors. The justification of tolerances is not very transparent making it difficult for system integrators and lead engineers to challenge the design and prioritize necessary additional analyses. Also, for drawings of parts that have been produced for years it is often the case that the justification of tolerances cannot be reconstructed and it is not understood what functions certain dimensions contribute to. In addition, the re-use of modules or components as part of a platform strategy may leave tolerance justifications running over multiple product lines. This all leads to a strong hesitation regarding changes to the parts due to unknown risks associated with those (see for example the GM ignition switch recall case [6]).
The translation between the design parameters (DPs) or external noise factors (NFs) and the functional requirements (FRs) is an established way to map the behavior of a product or system. The Robust Design Methodology (RDM) uses these transfer functions to derive sensitivities of functions to DPs and NFs to optimize the performance and predictability of the final product [2]. The setting of tolerances is directly linked to the sensitivity of the functions to the single DPs. RDM and the mapping between FRs and DPs are more or less explicitly done by the individual engineering disciplines. However, in the case of a complex and highly integral system, effects that go beyond a specific function or sub-function can be difficult to oversee. The mapping gets complicated and impractical in these instances making it difficult to have efficient tolerance design and allocation. “Information modelling is critical to the integration of design and tolerancing” [7].
The question arises of how the clarity and transparency of tolerances as well as their impact and severity on the final functional performance can be captured in a practical way.
In this contribution we address the encountered problem by proposing a framework on how to look at tolerances to support the specification and justification of tolerances for a robust design. Based on comprehensible decomposition and structuring of functional requirements and their design parameters a target-oriented communication between engineers of multi-disciplinary teams is supported. The framework enables the specification and justification of tolerances but also the setting of nominal dimensions across different disciplines and can give the basis for more advanced tolerance optimization within CAT.
2. Previous work
The idea of systematically mapping the dependencies of functions to design parameters and their tolerances is widely established in the engineering design community and is usually referred to as requirement or system decomposition. A framework that largely makes use of decomposition is
Axiomatic Design (AD) by Nam P. Suh [8]. AD promotes not only the mapping between FRs and DPs but also the mapping from customer attributes (Customer domain) to the functional requirements and the mapping between design parameters and process variables in the process domain. The decomposition of the high level functional requirements and how these are addressed in the physical domain is realized by so called zigzagging between the functional and physical domain. With this, new evolving lower level requirements and design parameters are systematically established and a design solution generated. The function-means tree model as described by Hansen and Andreasen [9] works in a similar fashion arranging the functions and their realizations in a hierarchical manner. Söderberg and Johanneson [10] utilize function-means trees to detect potential tolerance chains to increase robustness. However, these techniques are more an idealized process that is often not practical, especially if the product is complex or solutions are being reused. Another framework that is more tailored towards the management of variation in design and manufacturing is the Variation Risk Management (VRM) framework by Thornton [11]. The framework is generally divided into three phases: Identification, Assessment and Mitigation. The identification of potential issues related to variation followed by the assessment of the associated risks as well as costs and the final mitigation of the issues with the most potential forms a holistic approach. In that way, trade-offs between design and manufacturing can efficiently and objectively be managed to improve the quality and cost of the final product. With respect to the systematical tackling of the issues, the identification phase comprising the collection of variation-sensitive requirements and the risk flow-down to understand the structure of the product are of high importance. “The risk flow-down is an iterative decomposition process that identifies a hierarchy of contributing assembly, subassembly, part and process parameters [12].” Dantan et al. [1] propose an information model capturing the causality of Manufacturing Process Key Characteristics and Part/Product Key Characteristics to manage manufacturing resources and tolerances. The House of Quality (HoQ) methodology in Quality Function Deployment (QFD) has a similar domain based structure as Axiomatic Design [13]. It maps the customer attributes through the parts and process domain to the production domain. The decomposition of the attributes is facilitated by relating the “whats” to the “hows”. “What” is the requirement and “how” is it addressed. The “hows” are turned into “whats” for every level of decomposition in a new “house”. The Integrated Tolerancing Process (ITP) as presented by Dantan et al. [7] addresses the functional decomposition of tolerances through geometrical requirements and decomposed functions. Howard et al. [14] proposed the Variation Management Framework (VMF) emphasizing the mapping of variation and sensitivities through the domains for robust design. Hansen [15] and Weber [16] presented further product and process representations describing the relationship between requirements and product characteristics considering external influences. Methods like FMEA (Failure modes and effects analysis) and RCA (Root conflict analysis) use decomposition

108 Simon Moritz Göhler et al. / Procedia CIRP 43 ( 2016 ) 106 – 111
techniques to find the root causes for failures or potential failures.
3. Translation between FRs and DPs – a proposal for a new framework
The frameworks and methods discussed in the previous section are widely accepted and have proven to be useful in design and failure analysis situations. However, for the daily engineering development work and especially the detailed tolerance design and analysis phase, frameworks like Axiomatic Design and the House of Quality are too generic and impractical for addressing the issues mentioned in the introduction. Tools like FMEA and RCA can be of an appropriate level of detail but are, however, too focused and therefore limited to failures. The VRM framework on the other hand gives a good guidance to break down the product key characteristics to the related process characteristics. However, VRM is limited to dimensions that can be measured on the shop floor and in the assembly line and is therefore very production focused. Abstract functional and emerging properties like “mechanical stiffness” or “efficiency” are not addressed.
The purpose of the proposed framework in this contribution is to adapt and extend the VRM to include functional and emerging properties of a product. With this, it is believed, the communication between different engineering disciplines regarding dimensions and their tolerance can be made more understandable, traceable and transparent also for non SMEs (subject-matter experts) like system integrators and managers. The derivation of the framework is driven by the question of how to map between functional requirements and design parameters most efficiently. The idea is to ease the mapping and therefore extent the existing methods described in Section 2. Consider the “easy” example of a cantilever beam with a rectangular cross-section, where the functional requirement is a specific maximum deflection max at the far end under a load F. For this case an analytical expression can be derived as:
123
3
3
max hbE
lF (1)
The equation includes all influencing dimensional, material and load parameters. A design engineer could now for example insist on a specific height h of the beam to limit the maximum deflection of the beam. With constraints maybe only on the length and the material of the beam, the actual interest is in the second moment of inertia I rather than only the height.
12
3hbI (2)
A wrongly / too simplistic formulation of the requirement unnecessarily constrains the solution space and can cause a
non-optimal dimensioning and tolerancing. This clarification eases the mapping between FR and DPs and increases the understanding of what properties are actually required. The complicatedness of the transfer function rises with the complexity and level of abstraction of the functional requirement and can hence also be reduced.
Figure 1 illustrates the mapping between a functional requirement and a contributing design parameter (for simplicity only one DP is shown, in most cases a FR is dependent on multiple DPs). As in the example of the deflection of the cantilever beam, it is often helpful for the communication and traceability not to map the FR directly to the corresponding DPs but introduce sub-functional requirements (SFRs) in between. Especially abstract FRs like for example efficiency and acceleration can have complicated dependencies with numerous DPs. Decomposition into SFRs can help to express actual requirements for a function.
The translation between FRs, SFRs and DPs can be done from the ‘selection of concept’ onwards. In the early phases the translation might be based on analytical descriptions and first order principles of the function. First statements about the importance and sensitivities of SFRs and DPs can be made. As the design matures the mapping can be detailed including data from experiments and simulations.
Figure 1: Mapping between FR and DP
To formalize the framework and the introduction of SFRs a
bottom-up approach has been chosen to derive the different levels of SFRs starting at the sources of variation, which are dimensional, material, external (loads and environment) and time-related. Further, the P-Diagram (Figure 2) is used to structure the different sources of variation. The product is defined by its single DPs (control factors). This very basic level of definition is used on technical drawings of physical parts and assemblies. Nominal geometrical dimensions and form attributes as well as required material and surface properties are defined including their allowable deviations and tolerances. The most basic functional requirements are directly on these lowest level DPs and we define these as Level 1 SFR. Resulting from customer surveys, for example, a company developing a smart phone sets certain requirements on the width and length as well as the “feel” (material and surface) of the phone. These requirements are directly linked to the housing of the phone and are prescribed

109 Simon Moritz Göhler et al. / Procedia CIRP 43 ( 2016 ) 106 – 111
on its drawing. Level 2 SFRs combine properties of multiple dimensions, like required volumes or area moments, but also relative sizes and positions in assemblies. Examples for Level 2 requirements are the capacity of an engine and the position of a button on a phone.
Figure 2: P-Diagram
The level of abstraction is further increased for the 3rd level SFRs. Combining dimensions and material properties yields for example part or assembly properties like weight, stiffness and rigidity. SFR levels 1-3 entail the physical properties of a product or system and build logically on top of each other. For example, to derive the weight of a part, its volume and density needs to be known, which again implies that all single dimensions are known. For level 4 SFRs external non material or geometrical factors, like for example temperature, load or flow, are included. Some physical phenomena are time dependent such as creep, wear and corrosion. The variable time is included in level 5 SFRs. All other SFRs and functional responses and properties of higher complexity can be derived as aggregations of level 1- 5. Level 6 comprises of all higher level functional requirements including advanced
emerging responses like efficiency, power etc. Table 1 summarizes the proposed framework with examples for mechanical properties. Higher level sub-functional requirements are by inherent nature more complex and less restricting than lower level SFRs. The association of each tolerance to their respective SFR and functional origin in a database can increase the clarity, transparency and traceability and can support an efficient CAT.
Application
To ensure the applicability of a framework like the proposed decomposition of functional requirements, the Pareto Principle should be followed. Rather than having an exhaustive break down of all influencing parameters and properties of a function, the focus should be on the most influential characteristics and properties of a design towards the functional requirements. The idea of this framework and approach of looking at tolerances is to increase the understanding and traceability. Therefore, the highest meaningful level of SFR should be used to communicate acceptable ranges for the individual functions. In that way the design is also not being constrained more than necessary. Knowledge and experiences from previous projects as well as results from analyses can be utilized to formulate the SFRs. It shall be stressed here that usually no additional analyses and tests need to be run. The data that is anyway being produced for design, verification and validation shall be utilized to express the SFRs.
Table 1: Description of Sub-Functional Requirement Levels
SFR Sources of Variation Examples (mechanical)
Control Factors (Design
Parameters)
Level 1 Single Dimensions and Material Properties (Basic definitions on drawing)
Geometrical dimensions Forms (GD&T) Material properties (Density, yield stress/strain, Young’s
modulus, conductivity, resistance…) Surface finish
Level 2 Multiple Dimensions
Volume, Area Aspect ratio Moment of inertia 2nd Moment of area Assemblies (relative dimensions, positions, orientations,
flushness, gaps, overlaps)
Level 3 Dimensions & Material Properties Weight Stiffness Rigidity
Use (Signal & Noise
Factors) Level 4
Dimensions & External Factors Stress
Material Properties & External Factors Thermal Expansion (relative)
Dimensions & Material Properties & External Factors
Thermal Expansion (absolute) Bending, buckling, distortion Compression
Time Level 5 Dimensions & Material Properties & External Factors & Time
Creep Corrosion Wear
Functional output (behavior) Level 6 Emerging responses and properties
(combining Level 1 – 5)
Friction Efficiency Power, Energy

110 Simon Moritz Göhler et al. / Procedia CIRP 43 ( 2016 ) 106 – 111
Once the SFRs for all functions are defined, they can be
compared and analyzed by system integrators or lead engineers to make the trade-offs for working out the final tolerances of the dimensions on the part drawings. Design Structure Matrices can be used as a structured way to capture all SFRs.
4. Example – The Glue Gun
The proposed framework and way of thinking about tolerances shall be demonstrated in a simple example. Note that the advantages and usefulness of the proposed framework arise with a higher product complexity and multi-disciplinarity. The example is chosen to illustrate the general idea. Figure 3 shows the principle model of a glue gun [17]. By pulling the trigger (green) the grabbing arm (red) clamps the glue stick onto the sledge and subsequently drags it forward to feed the heating unit that finally dispenses the glue. Depending on the way of argumentation, the framework can be used in a bottom-up or top-down fashion. To investigate, for example, the origin or the functional impact of tolerances it is practical to review the SFRs bottom-up, whereas for the design and tolerance synthesis a top-down approach breaking down the functional requirements to SFRs using experience, analytics, experiments and simulations is appropriate. “Thought experiments” like the virtual deviation method [18] can also help to identify the most influencing parameters. For the glue gun example a top-down approach is demonstrated in the following. For simplicity reasons it is assumed that there are only two main functional requirements for the glue gun: 1) the application force for the user (for example 8 +/- 2 N) and 2) the precise and predictable delivery of glue (for example
0.5 +/- 0.1 ml/stroke). Table 2 summarizes the decomposition of the two functional requirements.
The application force is mainly driven by two phenomena: firstly the friction of all moving parts and secondly the general gearing of the mechanism itself.
Figure 3: Glue Gun Principle Model
The friction is a complex phenomenon depending on the materials, the applied force but also on relative sizes, positions and orientations of the single parts. Another influence is the level of compliance in the system. Using the breakdown to SFRs as proposed in the previous sections helps to identify the actual attributes and properties influencing the application force for the glue gun and to prioritize further analyses as appropriate. For the allocation of tolerances, the constraints on the highest possible level of SFR should be used to constrain the design as little as possible.
Table 2: Functional Requirements Breakdown for Glue Gun Example
Constant application force (+ no jamming) Precise and predictable delivery of glue (Linear translation between trigger and feed)
Level 6 Friction of moving parts Slip of glue stick: friction of hook to glue stick > rubber heater inlet to glue stick and vice versa for retraction
Level 5 n.a. n.a.
Level 4 Bending, buckling, distortion, deformation of mechanism parts Bending, buckling, distortion, deformation of mechanism parts
Level 3 Stiffness of mechanism parts Stiffness of mechanism parts
Level 2
Sledge width to rail width Ø glue stick to Ø heater, Ø nozzle, Ø rubber hole, clamping arm
length, Ø sledge pass through, Ø housing hole Hole positions of joints Alignment of sledge and rail (housing halves relative position) Alignment of sledge and heater Moments of inertia of mechanism parts Aspect ratios of lever arms
Ø pin to Ø hole of joint connections Sledge width to rail width Moments of inertia of mechanism parts Gaps in joints (wiggle room) Gap between rail and sledge Aspect ratios of lever arms (gearing ratio)
Level 1
Parts’ E-modulus friction coefficients Spring constant Dimensions of mechanism parts
Parts’ E-modulus Dimensions of mechanism parts

111 Simon Moritz Göhler et al. / Procedia CIRP 43 ( 2016 ) 106 – 111
In that way the design can also more easily be assessed
and challenged by non-SMEs, i.e. system integrators and lead engineers. If, for example, bending and buckling of the mechanism turns out to have a major influence on the application force, the constraints and tolerances should be set and communicated on that level, ensuring the understanding for tolerances but also leaving design space to change the design and material while complying with the constraints on bending and buckling. The second main functional requirement, the precise and predictable delivery of glue, is dependent on the smooth and linear translation between trigger and feed sledge. The most important characteristics are the gearing of the mechanism, the level of compliance and the prevention of slip of the glue stick. Again, the highest level requirements should be selected to communicate the SFRs and to set the tolerances.
5. Discussion and concluding remarks
In this contribution we propose a new framework of how to translate between functional requirements and design parameters through sub-functional requirements to improve the specification and justification of tolerances. Expressing the sub-functional requirements leads to a less constrained design. Compared to traditional tolerancing frameworks that focus on interfaces and resulting positions and orientations of parts in assemblies [19], the presented framework captures also functional emerging properties taking material properties, external factors like forces and temperature as well as time related factors into account. Tolerance methods that do take functional responses into account are mostly concerned with tolerance analysis or allocation and optimization [4], which require very detailed models which, again lack transparency and traceability. With the proposed approach a clear traceability of tolerances can be ensured linking them to the respective SFRs, which can be done in a less complicated way than to the overall FR. The framework also yields potentials in improving the communication about and the finding of design trade-offs especially in multi-disciplinary designs as well as the extension of computer aided functional tolerancing to properties of higher abstraction. Positive impacts can also be seen on change management and propagation, design documentation including reasoning as well as motivation and decision support in terms of decision rational. Knowing the main influencing attributes and properties also helps robust design and design optimization. Furthermore, the SFRs can directly be compared to customer requirements and product specifications as well as potentially be used for testing and verification purposes.
Acknowledgements
The authors would like to acknowledge Novo Nordisk for the research funding under the DTU-Novo Nordisk Robust Design Program.
References
[1] J. Y. Dantan, A. Hassan, A. Etienne, A. Siadat, and P. Martin, “Information modeling for variation management during the product and manufacturing process design,” Int. J. Interact. Des. Manuf., vol. 2, no. 2, pp. 107–118, 2008.
[2] G. Taguchi, S. Chowdhury, and Y. Wu, Taguchi’s quality engineering handbook. Hoboken, NJ: John Wiley & Sons, 2005.
[3] U. Roy, C. R. Liu, and T. C. Woo, “Review of dimensioning and tolerancing: representation and processing,” Comput. Des., vol. 23, no. 7, pp. 466–483, 1991.
[4] Y. S. Hong and T. C. Chang, “A comprehensive review of tolerancing research,” Int. J. Prod. Res., vol. 40, no. 919435512, pp. 2425–2459, 2002.
[5] J.-Y. Dantan, L. Mathieu, A. Ballu, and P. Martin, “Tolerance synthesis: quantifier notion and virtual boundary,” Comput. Des., vol. 37, no. 2, pp. 231–240, 2005.
[6] T. Eifler, J. L. Olesen, and T. J. Howard, “Robustness and Reliability of the GM Ignition Switch - A Forensic Engineering Case,” in 1st International Symposium on Robust Design. 2014., 2014, no. August, pp. 51–58.
[7] J.-Y. Dantan, N. Anwer, and L. Mathieu, “Integrated tolerancing process for conceptual design,” CIRP Ann. Technol., no. 52.1, pp. 135–138, 2003.
[8] N. P. Suh, Axiomatic Design: Advances and Applications. New York: Oxford University Press, 2001.
[9] C. T. Hansen and M. M. Andreasen, “Two approaches to synthesis based on the domain theory,” in Engineering Design Synthesis: Understanding, Approaches and Tools, 2002, pp. 93–108.
[10] R. Söderberg and H. Johannesson, “Tolerance Chain Detection by Geometrical Constraint Based Coupling Analysis,” J. Eng. Des., vol. 10, no. 1, pp. 4–24, 1999.
[11] A. C. Thornton, Variation risk management: focusing quality improvements in product development and production. Hoboken, NJ: John Wiley & Sons, 2004.
[12] A. C. Thornton, S. Donnelly, and B. Ertan, “More than Just Robust Design: Why Product Development Organizations Still Contend with Variation and its Impact on Quality,” Research in Engineering Design, vol. 12. pp. 127–143, 2000.
[13] J. R. Hauser and D. O. N. Clausing, “The House of Quality,” Harvard Business Review, 1988, pp. 63–74.
[14] T. J. Howard, M. Ebro, T. Eifler, S. Petersen, S. M. Göhler, A. Christiansen, and A. Rafn, “The Variation Management Framework (VMF) for Robust Design,” in 1st International Symposium on Robust Design, 2014, no. August, pp. 1–9.
[15] F. Hansen, Konstruktionswissenschaft – Grundlagen und Methoden, 2nd ed. München-Wien: Hanser, 1974.
[16] C. Köhler, J. Conrad, S. Wanke, and C. Weber, “A matrix representation of the CPM/PDD approach as a means for change impact analysis,” Proc. Des. 2008, 10th Int. Des. Conf., pp. 167–174, 2008.
[17] T. Eifler and T. J. Howard, “Robust Design Workshop on Embodiment.” [Online]. Available: http://www.robustdesign.org/RDD15/workshop.php.
[18] F. Hansen, “Adjustment of Precision Mechanisms,” London: ILiffe Books Ltd, 1970, pp. 40–47.
[19] D. Jérome and T. Denis, “A tolerancing framework to support geometric specifications traceability,” Int. J. Adv. Manuf. Technol., vol. 36, no. 9–10, pp. 894–907, 2007.

The Variation Management Framework (VMF) Tool for Robust
Design
Göhler, Simon Moritz; Mathiasen, Mads Ravn; Nielsen, Morten Bæk;
Eifler, Tobias; Howard, Thomas J.
Department of Mechanical Engineering, Technical University of Denmark, Kgs.
Lyngby, Denmark
Variation is omnipresent in production but also in the use phase and needs to be
catered for in design. With the “Right-first-time” paradigm and the trend towards
virtual verification and validation, the understanding of the functional behaviour
and the impact of variation becomes critical. Given this, new demands emerge
towards a holistic and metric-driven variation management and Robust Design,
especially for complex products. Different methods and frameworks exist to
tackle this challenge. However, a coherent and holistic tool is lacking to address
this complexity. To overcome the challenge, the research presented in this
contribution builds upon and extends the Variation Management Framework
(VMF) by Howard et al. (2017). The proposed tool utilizes insights and analyses
addressing system robustness and complexity to holistically evaluate robustness
and support Robust Design throughout the development and production of
complex products. The tool was presented and applied in a workshop at the
Robust Design Day 2016 and successively further developed and tested in an in-
depth case study. First experiences and feedback show promising results and
point towards a great potential to support holistic Robust Design.
Keywords: Robust Design, Variation Management, Quality Engineering, VMF,
Key Characteristics
1 Introduction
In recent years, products have gotten more and more complex thriving for integrated
designs with a rising amount of functionality with optimized performance and physical
space (Göhler, Frey, and Howard 2016; Maurer 2007). This trend can be seen for all
kinds of products from insulin pens which integrate mechatronics to cars that become
more and more autonomous. At the same time, competition on the market puts pressure

on the individual companies to develop the products in as short time as possible leading
to an increased use of virtual verification and validation techniques in order to avoid
lengthy and expensive prototyping and physical tests. However, the design under
uncertainty and the design to cope with variation stay a challenge, especially with
reduced and late physical testing. Even though companies postulate and promote the
“Right-first-time” philosophy, redesigns, product launch delays, problems with
production ramp-up and product recalls are not uncommon (Ebro 2015). An
acknowledged methodology to design products to be insensitive to variation not only to
noise factors (type I robustness) but also to changes to the design itself (type II
robustness) is Robust Design (Allen et al. 2006). However, the complexity of the
product and the associated missing understanding of the functional behaviour create
uncertainty regarding the impact and propagation of variation and make the
implementation and application of Robust Design difficult. Challenges regarding the
analysis and objective evaluation of the robustness of complex products hinder the
continuous improvement, monitoring and prioritization of tasks throughout the
development. Non-optimal designs and trade-offs are the consequence. Most
quantitative Robust Design tools rely on very mature mathematical models and often
only address single functions neglecting the product or system perspective (Göhler,
Eifler, and Howard 2016). Problematic is also the organizational complexity of the
development process with specialists from various areas including engineering,
marketing, sales and production working together. The complexity makes it too
complicated for single engineers to overlook the whole product, even though the
information is available. Most analyses are conducted independently from each other
building a patchwork of information that is oftentimes not shared between the different
functions and departments, which is referred to as “Silo thinking” (Gmelin and Seuring

2014). It is the authors’ perception and experience from numerous collaboration and
student projects in industry that although Robust Design and Systems Engineering are
widely acknowledged and applied, many problems related to variation that should
supposedly not occur, are still present.
The Variation Management Framework (VMF) proposed by Howard et al. (2017) is
seen as a viable tool to address the mentioned problems. It links the insights from the
different domains of marketing, design and production to a coherent view on how
variation is propagated and what impact it has. It is assumed that Robust Design can
capitalize on that information especially with respect to robustness evaluation and
creating a comprehensive functional overview of the product.
The aim of this study was therefore to develop a tool extending and operationalizing the
VMF. A holistic approach was conducted to integrate and unify all structural and
functional information generated during product development and production. The
study at hand is fourfold and was conducted as follows:
(1) To get an idea about the severity of the mentioned problems in industry, a
survey was conducted among product development and production professionals
(section 2).
(2) The VMF was then further developed and extended to address the encountered
problems (section 3).
(3) The tool was successively presented and a trial use conducted at a Robust
Design workshop with practitioners from industry (section 4.1).
(4) Following the workshop, an in-depth case study at a medical company was run
to test the value and applicability of the tool (section 4.2).

2 Survey and state of the art
Although the problem of variation is not new and there are various academic and
industrial proposed strategies and tools, a lot of evidence for symptoms of problems in
relation to variation can be found (Ebro 2015). Preceding the Robust Day 2016 held at
the Technical University of Denmark a survey was conducted among the delegates,
Robust Design practitioners from Product Development, Production and Management,
asking to rate the severity of Robust Design related issues in the development and
production of their companies. The questionnaire included the following statements that
were hypothesized to negatively influence the efficient application of Robust Design as
well as variation management and needed to be rated from 1 “Strongly disagree” to 5
“Strongly agree” on a Likert-type scale:
(1) Silo thinking hinders the ability of our organization to deliver product quality.
(2) Unquantified decision making is a major cost/opportunity-cost for our
organization.
(3) Uncertainty of impact of design/production change/variation is a major
cost/opportunity-cost for our organization.
(4) Non-optimal designs and trade-offs is a major cost / opportunity-cost for our
organization.
42 responses were collected. The results of the survey are shown in Figure 1 and,
although the sample of participants is not representative, give an indication that the
hypothesized issues are indeed present in practice. Between 55 and 70% of the
delegates “agreed” or “strongly agreed” with the statements.

Figure 1. Results from a survey regarding Robust Design related issues in product development and production
There are various tools and strategies in the literature which aim at an efficient variation
management to address aforementioned problems. In the following, the state of the art
will briefly be discussed with focus on their ability to support Robust Design
throughout the development from the initial concept to production including type I but
especially also type II Robust Design, meaning robustness against noise factors and
variation in design parameters respectively (Allen et al. 2006). Specifically, the existing
tools and frameworks were evaluated against, whether they…
(1) …have a holistic approach to include marketing and production considerations
to Robust Design to address issues related to silo-thinking.
(2) …support a Key Characteristic approach to ensure applicability.
(3) …support various fidelities of Transfer Function (TF) models including
qualitative as well as linear and non-linear quantitative models to support type II
Robust Design.

(4) …exploit structural (complexity related) information to capture interaction
related robustness issues arising from coupling (Suh 2001) as well as trade-offs
and contradictions (Göhler, Frey, and Howard 2016; Göhler and Howard 2015)
to support Robust Design from conceptual design onwards.
(5) …enable and supply metrics like sensitivities, functional variance, size of design
space, and yield rates (Göhler, Eifler, and Howard 2016; Saltelli et al. 2008) to
monitor and prioritize efforts and make quantified, objective decision for metric-
driven Robust Design.
Nowadays, PLM (product lifecycle management) systems have the capabilities
to seamlessly integrate simulation software to holistically evaluate complex (multi-
function) designs. Especially for tolerance allocation and analysis in the detailed design
stage, many tools for variation simulation and analysis (VSA) as well as robustness and
production optimization exist (see for example (Beyer and Sendhoff 2007; Etienne et al.
2008; Söderberg, Lindkvist, and Dahlström 2006)). However, there are several issues:
firstly, mature models are necessary which are not available in earlier design stages.
Secondly, there is no Key Characteristics (KC) approach reducing the complexity and
complicatedness of the task. And thirdly, structural information to support Robust
Design on the conceptual design stage is not utilized.
In the Variation Risk Management (VRM) methodology by Thornton (2004),
the complexity of the problem is addressed by identifying Key Characteristics (KC) and
by the utilization of surrogate (linear) models as well as decomposition of the variation
problem from product KCs all the way to production process KCs. Dantan et al. (2008)
pursue a similar approach to variation management (VM) where a KC flowdown is
combined with a condition flowdown to capture causalities and conditions on the
characteristics. Both, Thornton and Dantan, have a strong focus on geometry and
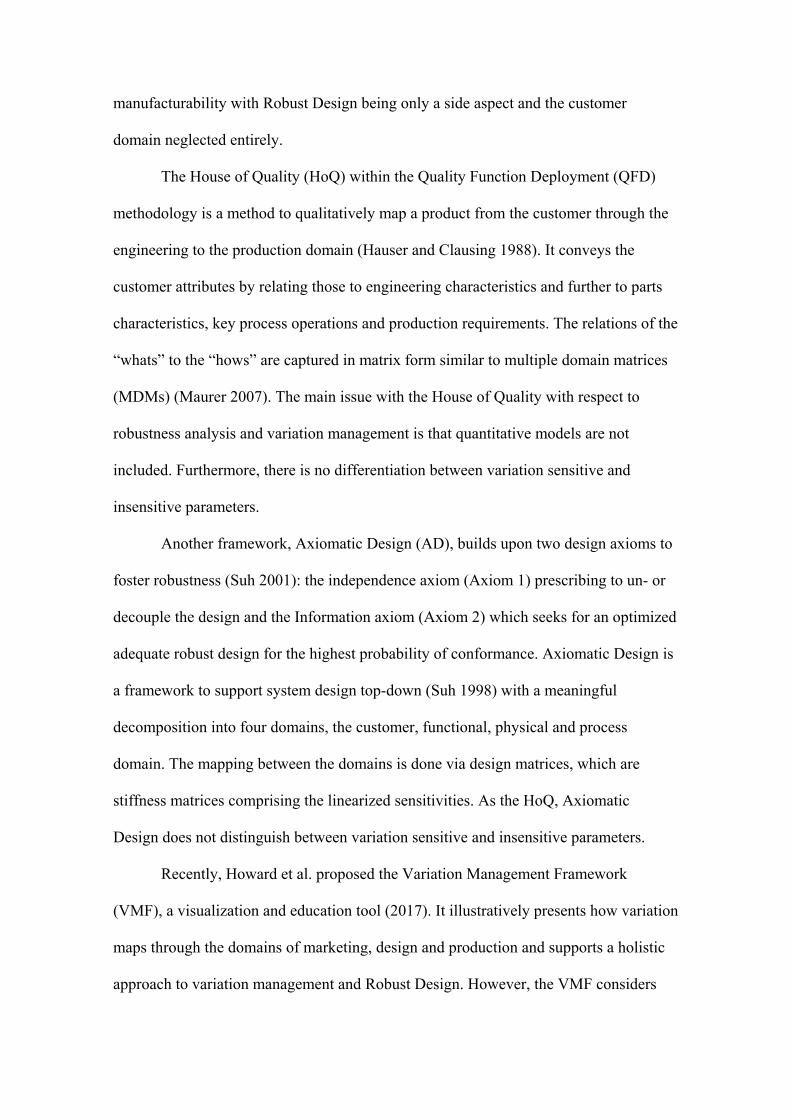
manufacturability with Robust Design being only a side aspect and the customer
domain neglected entirely.
The House of Quality (HoQ) within the Quality Function Deployment (QFD)
methodology is a method to qualitatively map a product from the customer through the
engineering to the production domain (Hauser and Clausing 1988). It conveys the
customer attributes by relating those to engineering characteristics and further to parts
characteristics, key process operations and production requirements. The relations of the
“whats” to the “hows” are captured in matrix form similar to multiple domain matrices
(MDMs) (Maurer 2007). The main issue with the House of Quality with respect to
robustness analysis and variation management is that quantitative models are not
included. Furthermore, there is no differentiation between variation sensitive and
insensitive parameters.
Another framework, Axiomatic Design (AD), builds upon two design axioms to
foster robustness (Suh 2001): the independence axiom (Axiom 1) prescribing to un- or
decouple the design and the Information axiom (Axiom 2) which seeks for an optimized
adequate robust design for the highest probability of conformance. Axiomatic Design is
a framework to support system design top-down (Suh 1998) with a meaningful
decomposition into four domains, the customer, functional, physical and process
domain. The mapping between the domains is done via design matrices, which are
stiffness matrices comprising the linearized sensitivities. As the HoQ, Axiomatic
Design does not distinguish between variation sensitive and insensitive parameters.
Recently, Howard et al. proposed the Variation Management Framework
(VMF), a visualization and education tool (2017). It illustratively presents how variation
maps through the domains of marketing, design and production and supports a holistic
approach to variation management and Robust Design. However, the VMF considers
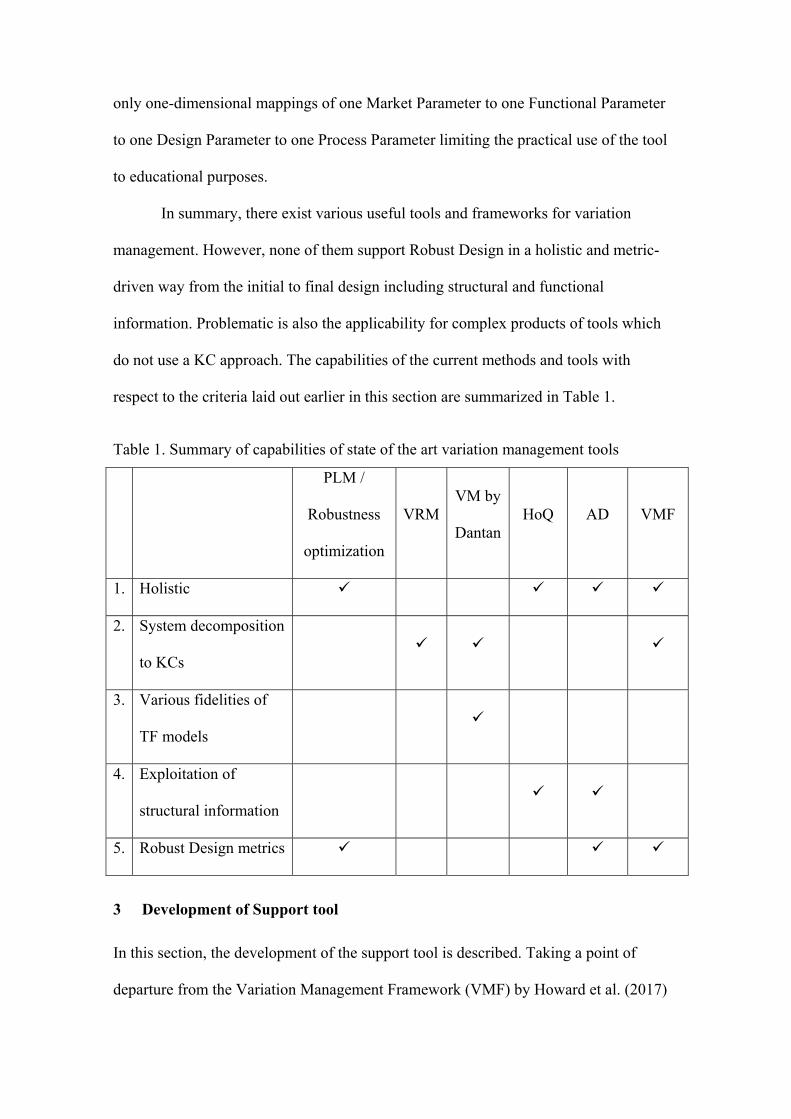
only one-dimensional mappings of one Market Parameter to one Functional Parameter
to one Design Parameter to one Process Parameter limiting the practical use of the tool
to educational purposes.
In summary, there exist various useful tools and frameworks for variation
management. However, none of them support Robust Design in a holistic and metric-
driven way from the initial to final design including structural and functional
information. Problematic is also the applicability for complex products of tools which
do not use a KC approach. The capabilities of the current methods and tools with
respect to the criteria laid out earlier in this section are summarized in Table 1.
Table 1. Summary of capabilities of state of the art variation management tools
PLM /
Robustness
optimization
VRMVM by
DantanHoQ AD VMF
1. Holistic
2. System decomposition
to KCs
3. Various fidelities of
TF models
4. Exploitation of
structural information
5. Robust Design metrics
3 Development of Support tool
In this section, the development of the support tool is described. Taking a point of
departure from the Variation Management Framework (VMF) by Howard et al. (2017)

which already reflects and incorporates many of the elements listed in Table 1, the VMF
Tool is developed addressing the 5 requirements one by one. A focus is also put on the
applicability and ability for operationalization of the tool for complex products in
industry, i.e. scalability and the option for implementation in a software solution.
3.1 A holistic approach to Robust Design
In the Variation Management Framework (Howard et al. 2017), a holistic view on
variation is taken. In its graphical representation, it differentiates between three so-
called quadrants of variation management: the marketing, design and production
quadrant. In those, the four product domains customer, functional, physical and process
domain are linked, in particular the characteristics Market Parameters (MP)1 (Footnote1
Termed CS (Customer Satisfaction) in previous articles – adopted from Axiomatic
Design), Functional Parameters (FP), Design Parameters (DP) and Process Parameters
(PP) respectively (Figure 2). Robust Design as the main approach for variation
management in the design quadrant is the means to ensure that physical variation in
production is not perceived by the customers in the market due to a compromised
functionality. The VMF enables a cross-department and cross-functional collaboration
for Robust Design and variation management addressing the experienced issues with
silo-thinking.
To achieve this holistic approach to variation management and Robust Design in
particular the VMF Tool needs to be object/element-based and structured by the four
product domains.

Figure 2. Quadrants of the VMF
3.2 Key Characteristics Approach
To ensure applicability in real-world development projects of complex products a Key
Characteristics (KC) approach is inevitable. Due to the sheer number of Design and
Process parameters, variation management including modelling and controlling of the
parameters needs to be limited to the most influential ones. Two criteria are decisive for
the identification of a KC. Firstly, variation of a parameter needs to have a significant
impact on the product and secondly, it needs to be likely that the parameter experiences
substantial variation (Thornton 2004).
The KC approach has a lesser influence on the VMF Tool itself but on the process and
way it is used. However, the VMF Tool needs to support the capturing of KCs but also a
further analysis and differentiation among the KCs for ranking and prioritization
purposes once they are captured in the tool.
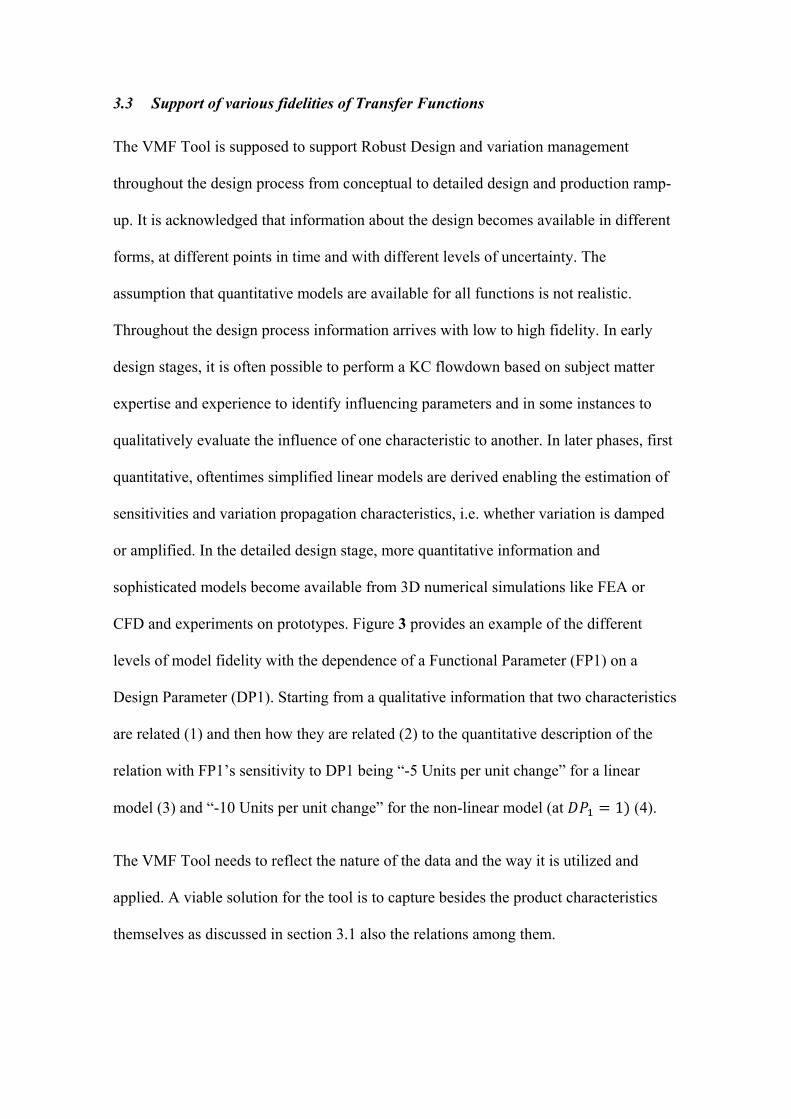
3.3 Support of various fidelities of Transfer Functions
The VMF Tool is supposed to support Robust Design and variation management
throughout the design process from conceptual to detailed design and production ramp-
up. It is acknowledged that information about the design becomes available in different
forms, at different points in time and with different levels of uncertainty. The
assumption that quantitative models are available for all functions is not realistic.
Throughout the design process information arrives with low to high fidelity. In early
design stages, it is often possible to perform a KC flowdown based on subject matter
expertise and experience to identify influencing parameters and in some instances to
qualitatively evaluate the influence of one characteristic to another. In later phases, first
quantitative, oftentimes simplified linear models are derived enabling the estimation of
sensitivities and variation propagation characteristics, i.e. whether variation is damped
or amplified. In the detailed design stage, more quantitative information and
sophisticated models become available from 3D numerical simulations like FEA or
CFD and experiments on prototypes. Figure 3 provides an example of the different
levels of model fidelity with the dependence of a Functional Parameter (FP1) on a
Design Parameter (DP1). Starting from a qualitative information that two characteristics
are related (1) and then how they are related (2) to the quantitative description of the
relation with FP1’s sensitivity to DP1 being “-5 Units per unit change” for a linear
model (3) and “-10 Units per unit change” for the non-linear model (at 1 (4).
The VMF Tool needs to reflect the nature of the data and the way it is utilized and
applied. A viable solution for the tool is to capture besides the product characteristics
themselves as discussed in section 3.1 also the relations among them.
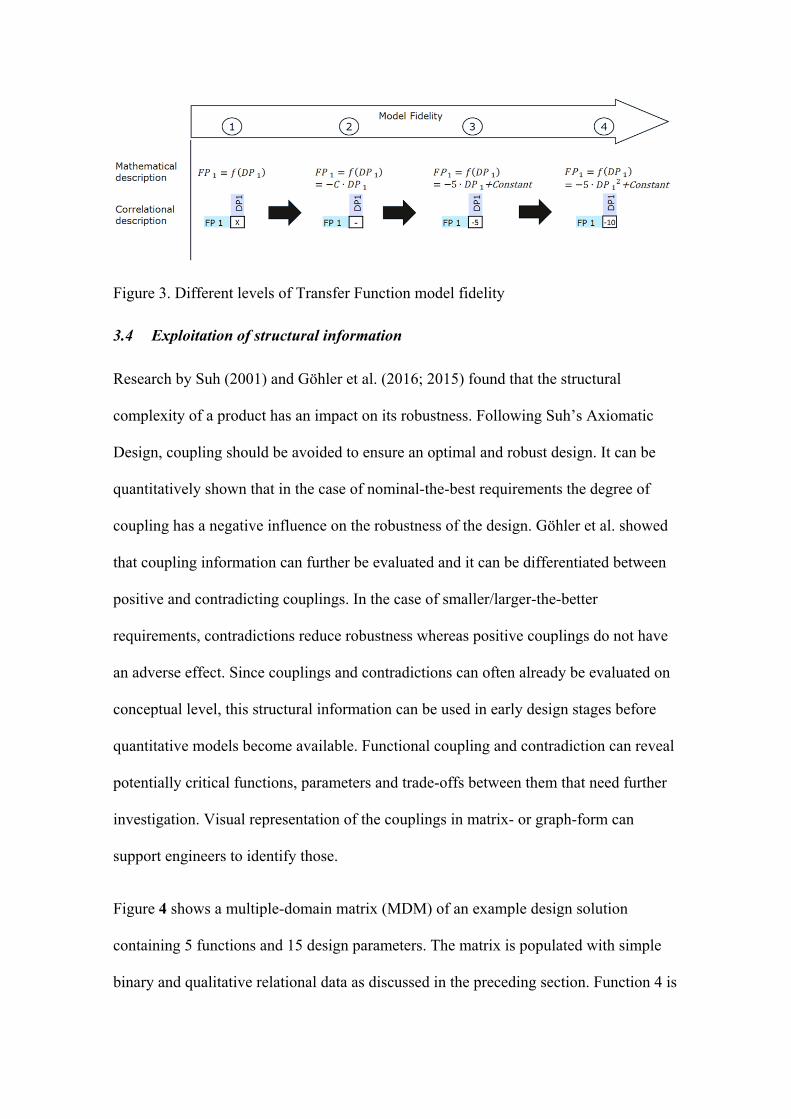
Figure 3. Different levels of Transfer Function model fidelity
3.4 Exploitation of structural information
Research by Suh (2001) and Göhler et al. (2016; 2015) found that the structural
complexity of a product has an impact on its robustness. Following Suh’s Axiomatic
Design, coupling should be avoided to ensure an optimal and robust design. It can be
quantitatively shown that in the case of nominal-the-best requirements the degree of
coupling has a negative influence on the robustness of the design. Göhler et al. showed
that coupling information can further be evaluated and it can be differentiated between
positive and contradicting couplings. In the case of smaller/larger-the-better
requirements, contradictions reduce robustness whereas positive couplings do not have
an adverse effect. Since couplings and contradictions can often already be evaluated on
conceptual level, this structural information can be used in early design stages before
quantitative models become available. Functional coupling and contradiction can reveal
potentially critical functions, parameters and trade-offs between them that need further
investigation. Visual representation of the couplings in matrix- or graph-form can
support engineers to identify those.
Figure 4 shows a multiple-domain matrix (MDM) of an example design solution
containing 5 functions and 15 design parameters. The matrix is populated with simple
binary and qualitative relational data as discussed in the preceding section. Function 4 is

coupled with functions 1, 2 and 3. However, the coupling with function 3 is a positive
one with no adverse effect. With this information the coupling between functions 1, 2
and 4 through the DPs 5,6 and 11 can be flagged and the awareness gained by this
analysis helps to prioritize further design and analysis tasks. Anticipating functional
design flaws is difficult. “Easy” flaws can be found by review and analysis. However,
detecting complex interaction effects that create issues are often not found until testing.
A support tool like the VMF Tool needs to provide a functional overview for example
in matrix-form as displayed in Figure 4.
Figure 4. Example MDM to illustrate couplings
3.5 Support of analyses and algorithms to generate robustness metrics
The quantification of sensitivities and robustness of concepts and design solutions has a
high importance for the development process of a product to monitor, prioritize and
decide on objective and quantified grounds (Göhler, Ebro, and Howard 2016). A maxim
oftentimes brought forward in quality engineering is that “You can only improve what
you can measure” (Fowlkes and Creveling 1995). ”Unquantified decision making” was
identified as a major issue in the survey presented in section 2. Ideally, all decisions
should be as metric-driven as possible. To derive robustness metrics like for example
discussed by Göhler et al. (2016), quantitative models as well as certain analysis
capabilities like Monte-Carlo-Analysis, sensitivity analysis and techniques for ANOVA
and HDMR (High dimensional model representation) need to be available for the VMF

Tool.
3.6 Structure of the VMF Tool
Through the preceding sections 3.1 to 3.5 the VMF Tool was developed based on the
requirements and functionality discussed in section 2. Figure 5 shows the resulting
structure of the VMF Tool to capture and unify the patchwork of different insights
about the product and provide a platform for analyses and a functional overview to
support Robust Design and variation management. All information about the design is
gathered systematically and stored centrally in the “VMF Database”. This is done
through the registration of relations and Transfer Functions featuring the different levels
of fidelity in the form:
y f x , x , … , x
Where y is the dependent element (for example a function F1) and xi are the influencing
elements (for example DPs). Analogous to PLM systems, which organize structural
information, i.e. drawing, assemblies, manufacturing, and its documentation, this
database captures functional information and offers system-wide robustness, sensitivity
and change or variation propagation analyses. Different visualizations including matrix
and graph-based visualizations are available to attain an overview and help to guide
design change and improvements. The ability for a scalable software implementation is
essential to address the complexity of real-world products and systems (Dantan et al.
2008). Analogous to PLM systems, a certain collaborative and multi-user capability
should be envisaged to make the tool applicable.

Figure 5. Structure of the VMF Tool
In practice, it was experienced that the decomposition from Functional Parameter to
Design Parameters in one step is in many cases not practical. An example is an abstract
Functional Parameter like the top speed of a car. The decomposition to the DPs in one
step is in that case not very sensible. To ensure applicability for complex products a
further decomposition of the functions to so-called sub-functional parameters is
therefore utilized (Göhler, Husung, and Howard 2016).
4 Case Studies
Two different case studies were run to test and evaluate the tool. In particular, the
goodness and success of the VMF Tool was evaluated against its ability to address the
issues discussed in the survey. The first study aimed to broadly evaluate the utility of
the VMF tool in a workshop getting feedback from multiple participants serving very
different products and systems. The second case was to conduct an in-depth study of a
product in order to identify exactly where and how the VMF tool would be used and

whether it adds value to the product life cycle.
4.1 Trial application in a workshop situation
A first test of the VMF tool proposed in this contribution was conducted in a workshop
at the Robust Design Day 2016. Case product was the Vaavud wind reader Sleipnir
(Figure 6). The Sleipnir consists of 6 parts with numerous design as well as process
parameters and was chosen as a simple case adequate for a 2h workshop trial of the
VMF Tool. Five tasks were completed related to scenarios in detailed design and
production. Figure 6 shows the trial version of the tool for the Vaavud Sleipnir wind
reader. The details of the workshop and the case are publically available under http://pd-
symposium.org/RDD.php.
After the completion of the workshop, the participants were asked in a survey, whether
the VMF Tool would provide a solution to address the issues related to Robust Design
and variation management that were judged relevant in the pre-survey. The same 5 level
Likert-type scale was used as in the pre-survey. 40 responses were returned with the
results shown in Figure 7. On average 78% of the participants “agreed” or “strongly
agreed” that the proposed VMF tool provides a solution to address the encountered
problems. Although this is a subjective evaluation conducted by a non-representative
group of industry delegates, the results give an indication about the value and potential
of the tool. The survey also included a feedback section, which showed that the main
concerns about the tool were regarding the applicability in complex products and the
efficiency of the data entry. However, there was generally positive feedback and
encouragement for further development of the tool.

Figure 6. Trial version of the VMF Tool from the Vaavud Sleipnir workshop case study (Boorla et al. 2016)
Figure 7. Results from a survey regarding the suitability of the VMF to solve Robust Design related problems in product development and production
4.2 In-depth Product Case study
Following the workshop, the VMF tool was further developed improving the data entry
and tested in an in-depth product case study in the medical industry to evaluate its value
and applicability.
The product in the centre of the case study was a medical device measuring parameters

relevant to a patient’s well-being and providing healthcare professionals with important
information for diagnosis and treatment. More specifically, in this case study, the design
of a complex sensor comprising of several sub-components was investigated.
Figure 8. Main window with reduced and anonymized data
The main functional requirements are concerned with the reliable and accurate detection
of an analyte. Typical design and process parameters are chemical and mechanical
properties of the sensor as well as drying time respectively. In total, 25 functional
parameters and more than 400 design and process parameters were identified and
mapped. From interviews and practice it was clear that although tests are conducted to
understand the relationships between functions and design / process parameters, it was
difficult to maintain a comprehensive overview. While the data was available in digital
formats, it took the external researchers several weeks to gain sufficient insight and a
basic overview. An improved centralization of the data may be seen as a way of
reducing data compilation overhead for design iterations, in turn making such iterations
more appealing. Also the communication across departments, e.g. Design and
Production, regarding function understanding and variation would likely benefit from a
centralized support tool. These challenges perceived by the external researchers during
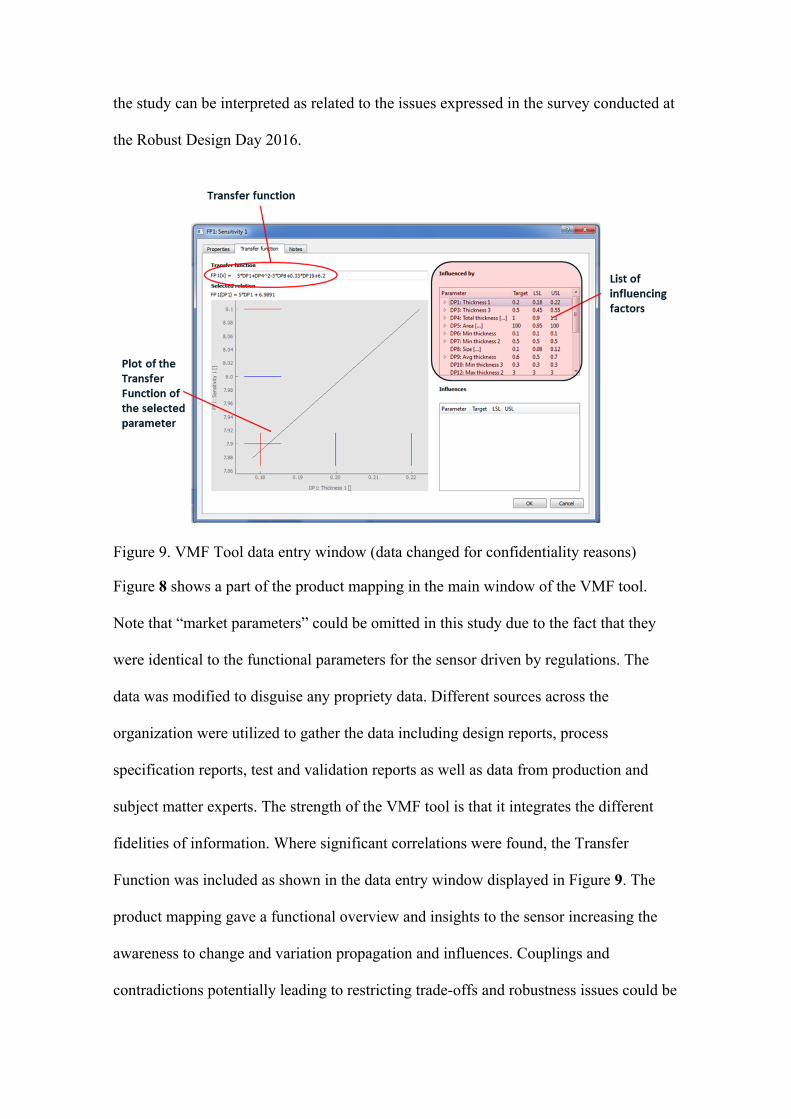
the study can be interpreted as related to the issues expressed in the survey conducted at
the Robust Design Day 2016.
Figure 9. VMF Tool data entry window (data changed for confidentiality reasons)
Figure 8 shows a part of the product mapping in the main window of the VMF tool.
Note that “market parameters” could be omitted in this study due to the fact that they
were identical to the functional parameters for the sensor driven by regulations. The
data was modified to disguise any propriety data. Different sources across the
organization were utilized to gather the data including design reports, process
specification reports, test and validation reports as well as data from production and
subject matter experts. The strength of the VMF tool is that it integrates the different
fidelities of information. Where significant correlations were found, the Transfer
Function was included as shown in the data entry window displayed in Figure 9. The
product mapping gave a functional overview and insights to the sensor increasing the
awareness to change and variation propagation and influences. Couplings and
contradictions potentially leading to restricting trade-offs and robustness issues could be

identified. Furthermore, where significant correlation was found, the sensitivities of
parameters to functions were presented in the VMF Tool. Figure 10 shows the
“Sensitivity view” in the VMF Tool marking binary relational information with an “X”,
positive and negative influences with a “+” and a “-“ respectively and displaying the
Nominal-range sensitivity (NRS) (Göhler, Eifler, and Howard 2016) as relative measure
for the propagation of variation (NRS < 1 = damping of variation; NRS > 1 =
amplifying of variation).
Figure 10. Sensitivity view (data changed for confidentiality reasons)
Once all the information was gathered it was important that the VMF Tool and its
representation were easily interpreted by those related to the project. To test the merit
and applicability of the tool to handle complexity and a high number of parameters, an
experiment with 4 employees from the case company was set up. The task was to
identify the influencing parameters to a function from a patchwork of analysis results
conducted previously. The complexity of the task, i.e. the number of functions and
parameters, was increased in 3 steps ranging from 15 to 60 parameters, which is only a
subset of the data and was chosen due to time and availability constraints of the
participants of the experiment. Although a small sample size, the test showed that with
increasing complexity the tool improved the speed and accuracy (completeness) of
solving the task compared to the common approach using spreadsheets.

5 Conclusion
In this contribution, a tool was presented to support variation management and Robust
Design from the conceptual design stage onwards throughout the development and
production. It addresses the identified shortcomings of current tools failing to capitalize
on both structural and functional information in a holistic and comprehensive manner
whilst providing a KC-driven and scalable solution to support the development of
complex products. Based on the Variation Management Framework (VMF) (Howard et
al. 2017), the VMF Tool was developed utilizing an object-based relational database
featuring analyses and representations of the data to increase the functional
understanding of complex products and to evaluate the robustness of its design. The
strengths of the tool lie within the integration and conflation of the available
information to all members of the development team. With the scalable architecture of
the tool and an input interface that enables a piecewise input of data driven by
functional decomposition, the practical applicability is ensured.
The VMF tool was successfully tested in a trial application in a workshop with Robust
Design practitioners and in an in-depth product case study. The increase in functional
understanding including couplings, contradictions and the metric-driven approach
utilizing sensitivities as well as other robustness metrics enabled the users of the VMF
Tool to efficiently and holistically address problems related to Robust Design and
variation management such as understanding of variation propagation and non-optimal
designs and trade-offs. Positive feedback from the workshop participants as well as the
participants from the case company was also given regarding the capabilities of the
VMF tool to support the communication between departments related to variation and
sensitivity data.

A challenge was still seen in the entry of the data as well as the speed and efforts of
keeping it up to date. It is anticipated that the total amount of analyses and efforts
remains the same compared to current practice with the difference that necessary
analyses can be identified and conducted earlier. Filling, maintaining and keeping the
data included in the tool up to date is a challenge that has also been experienced and
overcome in PLM/PDM systems. The main focus area for further research lies therefore
in the process of using the tool in product development. Furthermore, additional
features for the tool to capture the uncertainty and sources of information as well as the
inclusion of the monetary dimension as also discussed by Etienne et al. (2016) and
Mirdamadi et al. (2013) to evaluate costs and benefits of certain activities and actions is
planned for the future development.
References
Allen, Janet K., Carolyn Seepersad, HaeJin Choi, and Farrokh Mistree. 2006. “Robust
Design for Multiscale and Multidisciplinary Applications.” Journal of Mechanical
Design 128(July 2006): 832–43.
Beyer, Hans-Georg, and Bernhard Sendhoff. 2007. “Robust Optimization – A
Comprehensive Survey.” Computer Methods in Applied Mechanics and
Engineering 196(March 2007): 3190–3218.
http://linkinghub.elsevier.com/retrieve/pii/S0045782507001259 (January 29,
2014).
Boorla, S Murthy et al. 2016. “VMF Tool Workshop Material.”
Dantan, J. Y. et al. 2008. “Information Modeling for Variation Management during the
Product and Manufacturing Process Design.” International Journal on Interactive
Design and Manufacturing (IJIDeM) 2(2): 107–18.
Ebro, Martin. 2015. “Applying Robust Design in an Industrial Context.” (August).
Etienne, Alain et al. 2016. “Cost Engineering for Variation Management during the
Product and Process Development.” International Journal on Interactive Design

and Manufacturing: 1–12. "http://dx.doi.org/10.1007/s12008-016-0318-3.
Etienne, Alain, Jean Yves Dantan, Jawad Qureshi, and Ali Siadat. 2008. “Variation
Management by Functional Tolerance Allocation and Manufacturing Process
Selection.” International Journal on Interactive Design and Manufacturing 2(4):
207–18.
Fowlkes, William Y., and Clyde M. Creveling. 1995. Engineering Methods for Robust
Product Design. Reading, MA: Addison-Wesley.
Gmelin, Harald, and Stefan Seuring. 2014. “Achieving Sustainable New Product
Development by Integrating Product Life-Cycle Management Capabilities.”
International Journal of Production Economics 154: 166–77.
http://dx.doi.org/10.1016/j.ijpe.2014.04.023.
Göhler, Simon Moritz, Martin Ebro, and Thomas J. Howard. 2016. “Mechanisms and
Coherences of Robust Design Methodology: A Robust Design Process Proposal.”
Total Quality Management & Business Excellence 3363(May): 1–21.
http://www.tandfonline.com/doi/full/10.1080/14783363.2016.1180952.
Göhler, Simon Moritz, Tobias Eifler, and Thomas J. Howard. 2016. “Robustness
Metrics: Consolidating the Multiple Approaches to Quantify Robustness.” Journal
of Mechanical Design (November).
Göhler, Simon Moritz, Daniel D. Frey, and Thomas J. Howard. 2016. “A Model-Based
Approach to Associate Complexity and Robustness in Engineering Systems.”
Research in Engineering Design. http://link.springer.com/10.1007/s00163-016-
0236-1.
Göhler, Simon Moritz, and Thomas J Howard. 2015. “The Contradiction Index: A New
Metric Combining System Complexity and Robustness for Early Design Stages.”
In Proceedings of the ASME 2015 International Design Engineering Technical
Conferences & Computers and Information in Engineering Conference, , 1–10.
Göhler, Simon Moritz, Stephan Husung, and Thomas J. Howard. 2016. “The
Translation between Functional Requirements and Design Parameters for Robust
Design.” Procedia CIRP 43: 106–11.
http://dx.doi.org/10.1016/j.procir.2016.02.028.
Hauser, John R, and D O N Clausing. 1988. “The House of Quality.” In Harvard

Business Review, 63–74.
Howard, Thomas J. et al. 2017. “The Variation Management Framework (VMF): A
Unifying Graphical Representation of Robust Design.” Quality Engineering.
Maurer, Maik S. 2007. Dissertation “Structural Awareness in Complex Product
Design.” Technical University Munich.
Mirdamadi, S. et al. 2013. “Cost Estimation Method for Variation Management.”
Procedia CIRP 10: 44–53. http://dx.doi.org/10.1016/j.procir.2013.08.011.
Saltelli, Andrea et al. 2008. Global Sensitivity Analysis. The Primer Global Sensitivity
Analysis: The Primer. Chichester, UK: John Wiley & Sons.
Suh, Nam P. 1998. “Axiomatic Design Theory for Systems.” Research in Engineering
Design - Theory, Applications, and Concurrent Engineering 10: 189–209.
http://www.scopus.com/inward/record.url?eid=2-s2.0-
0032259126&partnerID=tZOtx3y1.
Suh, Nam P. 2001. Axiomatic Design: Advances and Applications. New York: Oxford
University Press.
Söderberg, Rikard, Lars Lindkvist, and Stefan Dahlström. 2006. “Computer-Aided
Robustness Analysis for Compliant Assemblies.” Journal of Engineering Design
17(5): 411–28.
Thornton, Anna C. 2004. Variation Risk Management: Focusing Quality Improvements
in Product Development and Production. Hoboken, NJ: John Wiley & Sons.


DCAMM
Danish Center for Applied Mathematics and Mechanics
Nils Koppels Allé, Bld. 404
DK-2800 Kgs. Lyngby
Denmark
Phone (+45) 4525 4250
Fax (+45) 4593 1475
www.dcamm.dk
ISSN: 0903-1685
DTU Mechanical Engineering
Section of Engineering Design and Product Development
Technical University of Denmark
Produktionstorvet, Bld. 426
DK-2800 Kgs. Lyngby
Denmark
Phone (+45) 4525 6263
Fax (+45) 4593 1577
www.mek.dtu.dk
ISBN: 978-87-7475-489-3


![Bowen Liang Automated Quantification Anand Nagarajan of the … · 2019-08-01 · [15] approaches were developed to build structures of similar geo-metric complexity and underlying](https://static.fdocuments.net/doc/165x107/5e2ee45ea2bd542094023ef9/bowen-liang-automated-quantification-anand-nagarajan-of-the-2019-08-01-15-approaches.jpg)