METLIFE ANNOUNCES FIRST QUARTER 2020 RESULTS...Exhibit 99.1 . Page 1 of 28 . For Immediate Release...
28
Exhibit 99.1 Page 1 of 28 For Immediate Release İ Global Communications İ MetLife, Inc. METLIFE ANNOUNCES FIRST QUARTER 2020 RESULTS NEW YORK, May 6, 2020 - MetLife, Inc. (NYSE: MET) today announced its first quarter 2020 results. First Quarter Results Summary • Net income of $4.4 billion, or $4.75 per share, compared to net income of $1.3 billion, or $1.40 per share in the first quarter of 2019. • Adjusted earnings of $1.4 billion, or $1.58 per share, compared to adjusted earnings of $1.4 billion, or $1.48 per share in the first quarter 2019. • Adjusted earnings, excluding total notable items, of $1.4 billion, or $1.58 per share, compared to adjusted earnings, excluding total notable items, of $1.5 billion, or $1.54 per share in the first quarter 2019. • Book value of $72.62 per share, up 25 percent from $58.06 per share at March 31, 2019. • Book value, excluding accumulated other comprehensive income (AOCI) other than foreign currency translation adjustments (FCTA), of $52.36 per share, up 15 percent from $45.58 per share at March 31, 2019. • Return on equity (ROE) of 27.1 percent. • Adjusted ROE, excluding AOCI other than FCTA, of 12.6 percent. Strong Financial Position • $5.3 billion of cash and liquid assets held at the holding company level at March 31, 2020, which is above our target cash buffer of $3.0-4.0 billion. • MetLife’s combined U.S. NAIC risk-based capital ratio (RBC) at December 31, 2019, excluding American Life Insurance Company, was 395 percent, which is above our 360 percent target; MetLife Japan solvency margin ratio was 931 percent at December 31, 2019. As these are year-end 2019 calculations, they do not reflect conditions and factors occurring after the year end. • MetLife’s next debt maturity is December 2022, when $500 million of senior notes will mature. • Returned over $900 million of capital in the first quarter 2020 through payment of common stock dividend and share repurchases. “Our commitment to being a purpose-driven company is even more important in the face of this pandemic. For our employees, we’ve introduced a variety of programs to protect their well- being. For our customers, we’re showing flexibility and compassion to help them navigate this challenge. And for our communities, we’re providing significantly increased support,” said MetLife President and CEO Michel Khalaf. “In the first quarter, MetLife delivered solid results that affirm our underlying financial strength. We entered this period of uncertainty with a business that is less capital intensive, an investment portfolio that is well positioned for a downturn, and a commitment to expense discipline that is stronger than ever. By continuing to execute on our Next Horizon strategy, we're confident we will position MetLife for long-term success.”
Transcript of METLIFE ANNOUNCES FIRST QUARTER 2020 RESULTS...Exhibit 99.1 . Page 1 of 28 . For Immediate Release...
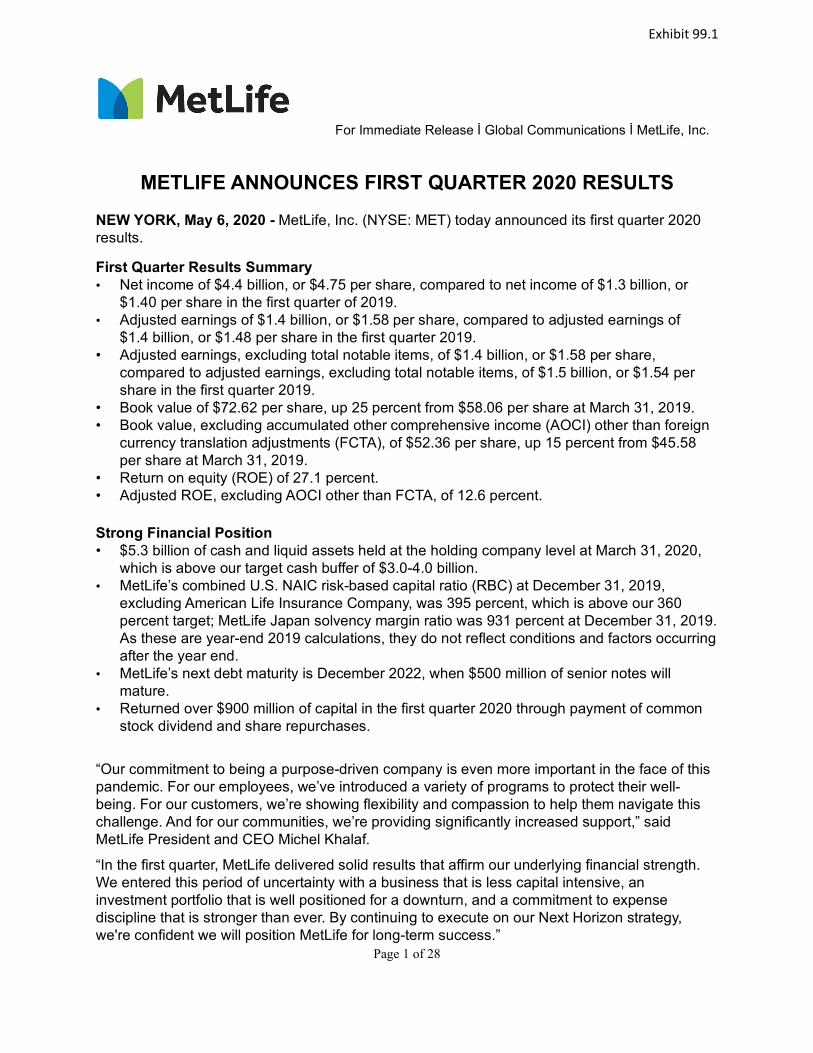
Exhibit 99.1
Page 1 of 28
For Immediate Release İ Global Communications İ MetLife, Inc.
METLIFE ANNOUNCES FIRST QUARTER 2020 RESULTS
NEW YORK, May 6, 2020 - MetLife, Inc. (NYSE: MET) today announced its first quarter 2020 results.
First Quarter Results Summary • Net income of $4.4 billion, or $4.75 per share, compared to net income of $1.3 billion, or
$1.40 per share in the first quarter of 2019. • Adjusted earnings of $1.4 billion, or $1.58 per share, compared to adjusted earnings of
$1.4 billion, or $1.48 per share in the first quarter 2019. • Adjusted earnings, excluding total notable items, of $1.4 billion, or $1.58 per share,
compared to adjusted earnings, excluding total notable items, of $1.5 billion, or $1.54 per share in the first quarter 2019.
• Book value of $72.62 per share, up 25 percent from $58.06 per share at March 31, 2019. • Book value, excluding accumulated other comprehensive income (AOCI) other than foreign
currency translation adjustments (FCTA), of $52.36 per share, up 15 percent from $45.58 per share at March 31, 2019.
• Return on equity (ROE) of 27.1 percent. • Adjusted ROE, excluding AOCI other than FCTA, of 12.6 percent.
Strong Financial Position • $5.3 billion of cash and liquid assets held at the holding company level at March 31, 2020,
which is above our target cash buffer of $3.0-4.0 billion. • MetLife’s combined U.S. NAIC risk-based capital ratio (RBC) at December 31, 2019,
excluding American Life Insurance Company, was 395 percent, which is above our 360 percent target; MetLife Japan solvency margin ratio was 931 percent at December 31, 2019. As these are year-end 2019 calculations, they do not reflect conditions and factors occurring after the year end.
• MetLife’s next debt maturity is December 2022, when $500 million of senior notes will mature.
• Returned over $900 million of capital in the first quarter 2020 through payment of common stock dividend and share repurchases.
“Our commitment to being a purpose-driven company is even more important in the face of this pandemic. For our employees, we’ve introduced a variety of programs to protect their well-being. For our customers, we’re showing flexibility and compassion to help them navigate this challenge. And for our communities, we’re providing significantly increased support,” said MetLife President and CEO Michel Khalaf.
“In the first quarter, MetLife delivered solid results that affirm our underlying financial strength. We entered this period of uncertainty with a business that is less capital intensive, an investment portfolio that is well positioned for a downturn, and a commitment to expense discipline that is stronger than ever. By continuing to execute on our Next Horizon strategy, we're confident we will position MetLife for long-term success.”
Page 2 of 28
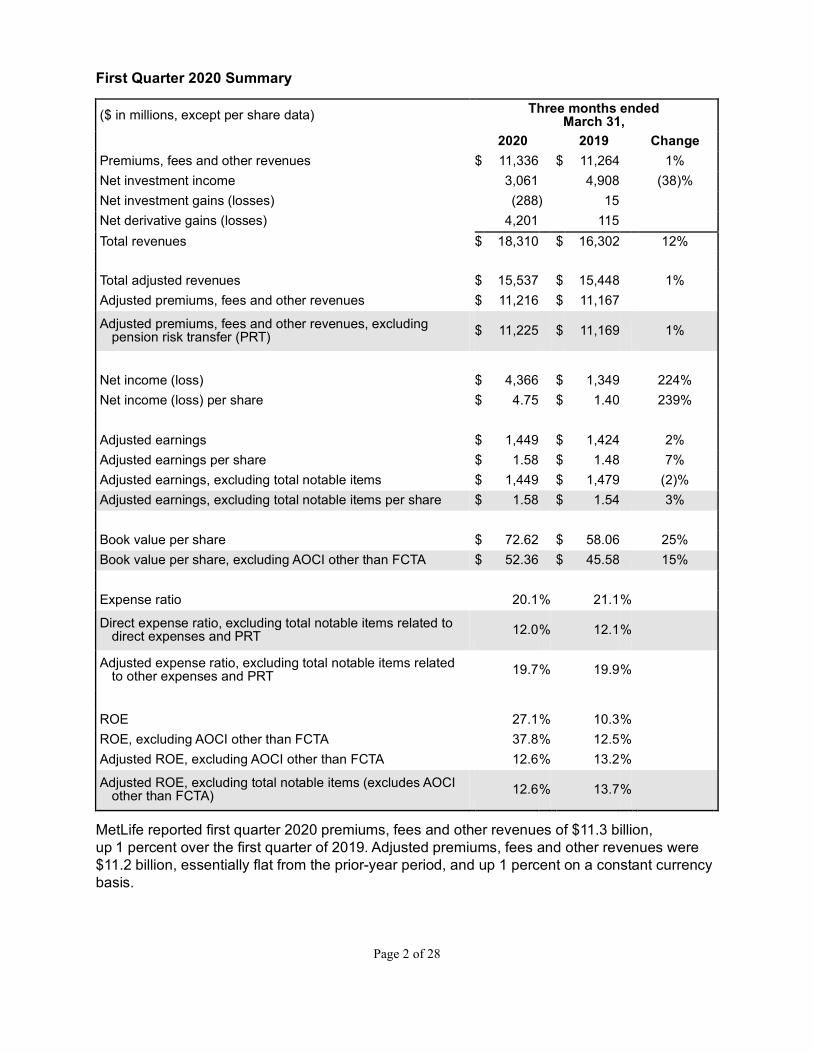
First Quarter 2020 Summary
($ in millions, except per share data) Three months ended March 31,
2020 2019 Change Premiums, fees and other revenues $ 11,336 $ 11,264 1% Net investment income 3,061 4,908 (38)% Net investment gains (losses) (288 ) 15 Net derivative gains (losses) 4,201 115 Total revenues $ 18,310 $ 16,302 12% Total adjusted revenues $ 15,537 $ 15,448 1% Adjusted premiums, fees and other revenues $ 11,216 $ 11,167
Adjusted premiums, fees and other revenues, excluding pension risk transfer (PRT) $ 11,225
$ 11,169
1%
Net income (loss) $ 4,366 $ 1,349 224% Net income (loss) per share $ 4.75 $ 1.40 239% Adjusted earnings $ 1,449 $ 1,424 2% Adjusted earnings per share $ 1.58 $ 1.48 7% Adjusted earnings, excluding total notable items $ 1,449 $ 1,479 (2)% Adjusted earnings, excluding total notable items per share $ 1.58 $ 1.54 3% Book value per share $ 72.62 $ 58.06 25% Book value per share, excluding AOCI other than FCTA $ 52.36 $ 45.58 15% Expense ratio 20.1 % 21.1 %
Direct expense ratio, excluding total notable items related to direct expenses and PRT 12.0 % 12.1 %
Adjusted expense ratio, excluding total notable items related to other expenses and PRT 19.7 % 19.9 %
ROE 27.1 % 10.3 % ROE, excluding AOCI other than FCTA 37.8 % 12.5 % Adjusted ROE, excluding AOCI other than FCTA 12.6 % 13.2 %
Adjusted ROE, excluding total notable items (excludes AOCI other than FCTA) 12.6 % 13.7 %
MetLife reported first quarter 2020 premiums, fees and other revenues of $11.3 billion, up 1 percent over the first quarter of 2019. Adjusted premiums, fees and other revenues were $11.2 billion, essentially flat from the prior-year period, and up 1 percent on a constant currency basis.

Page 3 of 28
Net investment income was $3.1 billion, down 38 percent from the first quarter of 2019. The decline in net investment income was driven by unfavorable changes in the estimated fair value of certain securities which do not qualify as separate accounts under GAAP. On an adjusted basis, net investment income was $4.3 billion, up 1 percent from the prior-year period.
Net derivative gains amounted to $4.2 billion, or $3.3 billion after tax during the quarter, driven by lower interest rates.
Net income was $4.4 billion, compared to net income of $1.3 billion in the first quarter of 2019. On a per share basis, net income was $4.75, compared to net income of $1.40 in the prior-year period.
MetLife reported adjusted earnings of $1.4 billion, up 2 percent, and up 4 percent on a constant currency basis, from the first quarter of 2019. On a per share basis, which includes the impact of share repurchases, adjusted earnings were $1.58, up 7 percent from the prior-year period. Information regarding the non-GAAP and other financial measures included in this news release and reconciliation of the non-GAAP financial measures to GAAP measures are in “Non-GAAP and Other Financial Disclosures” below and in the tables that accompany this news release. Details about projected COVID-19 impacts to MetLife are available under the heading “2Q20 Outlook” in MetLife’s first quarter 2020 supplemental slides, titled “1Q20 Supplemental Slides,” which are available together with MetLife’s Quarterly Financial Supplement for this period on the MetLife Investor Relations website at www.metlife.com, and in the Form 8-K furnished by MetLife to the U.S. Securities and Exchange Commission in connection with this earnings release.
Adjusted Earnings by Segment Summary*
Three months ended
March 31, 2020
Segment Change from
prior-year period
Change from prior-year
period (on a constant currency
basis) U.S. 8%
Asia (2)% —% Latin America (29)% (19)% Europe, the Middle East and Africa (EMEA) (9)% (6)% MetLife Holdings (13)%
*The percentages in this table are on a reported and constant currency basis, and do not exclude notable items.
Business Discussions All comparisons of the results for the first quarter of 2020 in the business discussions that follow are with the first quarter of 2019, unless otherwise noted. The first quarter of 2020 notable items table follows the Business Discussions section of this release.

Page 4 of 28
U.S.
($ in millions) Three months ended
March 31, 2020 Three months ended
March 31, 2019 Change Adjusted earnings $780 $724 8%
Adjusted premiums, fees and other revenues $6,189 $6,058 2%
Adjusted premiums, fees and other revenues, excluding PRT $6,198 $6,060 2%
Notable item(s) $0 $0
• Adjusted earnings for the U.S. were $780 million, up 8 percent. • Adjusted return on allocated equity was 28.2 percent, and adjusted return on allocated
tangible equity was 32.4 percent. • Adjusted premiums, fees and other revenues were $6.2 billion, up 2 percent.
Group Benefits
($ in millions) Three months ended
March 31, 2020 Three months ended
March 31, 2019 Change Adjusted earnings $312 $342 (9)%
Adjusted premiums, fees and other revenues $4,851 $4,545 7%
Notable item(s) $0 $0
• Adjusted earnings for Group Benefits were $312 million, down 9 percent, as volume growth was offset by less favorable underwriting and expense margins.
• Adjusted premiums, fees and other revenues were $4.9 billion, up 7 percent, driven by growth across all markets.
• Sales for Group Benefits were down 18 percent for the first quarter of 2020, due to lower jumbo case activity compared to the first quarter 2019.

Page 5 of 28
Retirement and Income Solutions
($ in millions) Three months ended
March 31, 2020 Three months ended
March 31, 2019 Change Adjusted earnings $359 $285 26%
Adjusted premiums, fees and other revenues $417 $609 (32)%
Adjusted premiums, fees and other revenues, excluding PRT $426 $611 (30)%
Notable item(s) $0 $0
• Adjusted earnings for Retirement and Income Solutions were $359 million, up 26 percent, driven by favorable variable investment income and volume growth.
• Adjusted premiums, fees and other revenues were $417 million, down 32 percent, primarily driven by lower structured settlement and institutional income annuity sales.
• Excluding pension risk transfers, adjusted premiums, fees and other revenues were $426 million, down 30 percent.
• Sales for Retirement and Income Solutions were up 123 percent over the first quarter of 2019, driven by stable value and capital market investment product deposits.
Property & Casualty
($ in millions) Three months ended
March 31, 2020 Three months ended
March 31, 2019 Change Adjusted earnings $109 $97 12%
Adjusted premiums, fees and other revenues $921 $904 2%
Notable item(s) $0 $0
• Adjusted earnings for Property & Casualty were $109 million, up 12 percent, driven by favorable underwriting and expense margins.
• Adjusted premiums, fees and other revenues were $921 million, up 2 percent. • Pre-tax catastrophe losses and prior year development totaled $68 million, compared to
$38 million in the prior-year period. • Sales for Property & Casualty were $125 million, down 19 percent, partially driven by
targeted management actions and lower quote activity.
Page 6 of 28
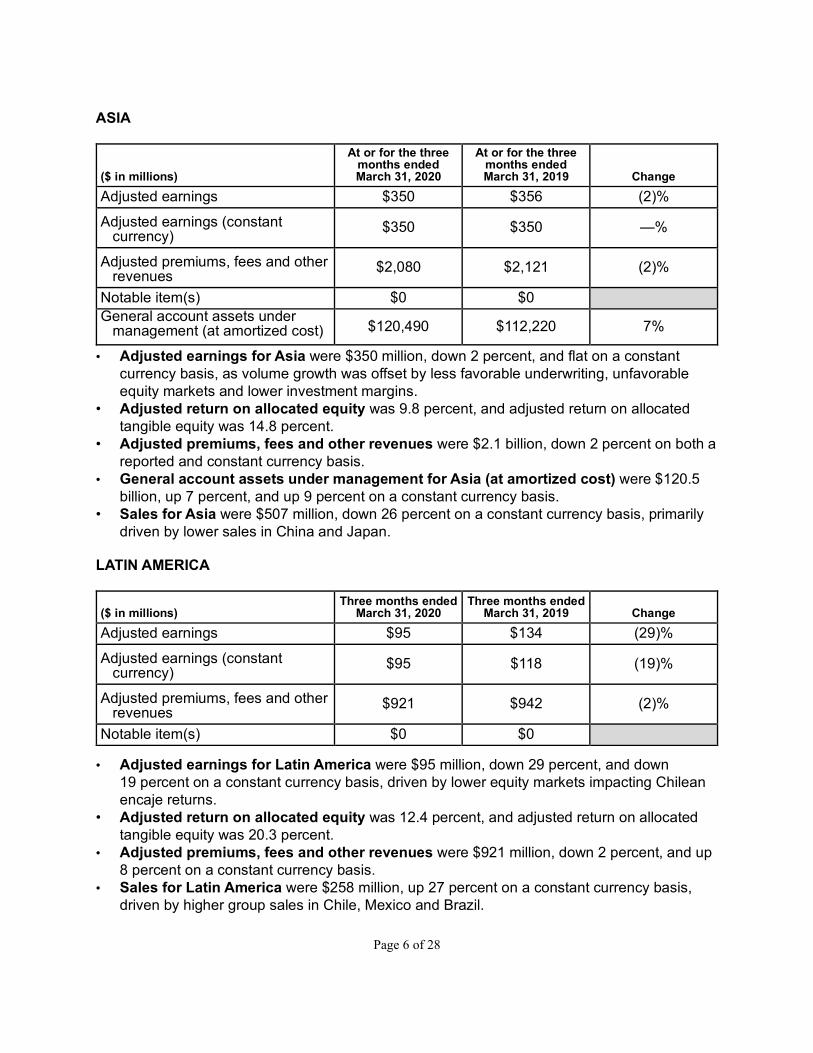
ASIA
($ in millions)
At or for the three months ended March 31, 2020
At or for the three months ended March 31, 2019 Change
Adjusted earnings $350 $356 (2)%
Adjusted earnings (constant currency) $350 $350 —%
Adjusted premiums, fees and other revenues $2,080 $2,121 (2)%
Notable item(s) $0 $0 General account assets under
management (at amortized cost)
$120,490 $112,220 7%
• Adjusted earnings for Asia were $350 million, down 2 percent, and flat on a constant currency basis, as volume growth was offset by less favorable underwriting, unfavorable equity markets and lower investment margins.
• Adjusted return on allocated equity was 9.8 percent, and adjusted return on allocated tangible equity was 14.8 percent.
• Adjusted premiums, fees and other revenues were $2.1 billion, down 2 percent on both a reported and constant currency basis.
• General account assets under management for Asia (at amortized cost) were $120.5 billion, up 7 percent, and up 9 percent on a constant currency basis.
• Sales for Asia were $507 million, down 26 percent on a constant currency basis, primarily driven by lower sales in China and Japan.
LATIN AMERICA
($ in millions) Three months ended
March 31, 2020 Three months ended
March 31, 2019 Change Adjusted earnings $95 $134 (29)%
Adjusted earnings (constant currency) $95 $118 (19)%
Adjusted premiums, fees and other revenues $921 $942 (2)%
Notable item(s) $0 $0
• Adjusted earnings for Latin America were $95 million, down 29 percent, and down 19 percent on a constant currency basis, driven by lower equity markets impacting Chilean encaje returns.
• Adjusted return on allocated equity was 12.4 percent, and adjusted return on allocated tangible equity was 20.3 percent.
• Adjusted premiums, fees and other revenues were $921 million, down 2 percent, and up 8 percent on a constant currency basis.
• Sales for Latin America were $258 million, up 27 percent on a constant currency basis, driven by higher group sales in Chile, Mexico and Brazil.

Page 7 of 28
EMEA
($ in millions) Three months ended
March 31, 2020 Three months ended
March 31, 2019 Change Adjusted earnings $78 $86 (9)%
Adjusted earnings (constant currency) $78 $83 (6)%
Adjusted premiums, fees and other revenues $697 $659 6%
Notable item(s) $0 $0
• Adjusted earnings for EMEA were $78 million, down 9 percent, and down 6 percent on a constant currency basis, primarily driven by lower equity markets and unfavorable underwriting.
• Adjusted return on allocated equity was 10.9 percent, and adjusted return on allocated tangible equity was 19.2 percent.
• Adjusted premiums, fees and other revenues were $697 million, up 6 percent, and up 8 percent on a constant currency basis.
• Sales for EMEA were $255 million, up 2 percent on a constant currency basis.
METLIFE HOLDINGS
($ in millions) Three months ended
March 31, 2020 Three months ended
March 31, 2019 Change Adjusted earnings $277 $317 (13)%
Adjusted premiums, fees and other revenues $1,233 $1,268 (3)%
Notable item(s) $0 $0
• Adjusted earnings for MetLife Holdings were $277 million, down 13 percent, driven by lower equity markets.
• Adjusted return on allocated equity was 11.2 percent, and adjusted return on allocated tangible equity was 12.5 percent.
• Adjusted premiums, fees and other revenues were $1.2 billion, down 3 percent.
CORPORATE & OTHER
($ in millions) Three months ended
March 31, 2020 Three months ended
March 31, 2019 Change Adjusted earnings $(131) $(193)
Notable item(s) $0 $(55)
• Corporate & Other had an adjusted loss of $131 million, compared to an adjusted loss of $193 million in the first quarter of 2019. The notable item in the prior-year period is related to the company's previously announced cost saving initiative.

Page 8 of 28
INVESTMENTS
($ in millions) Three months ended
March 31, 2020 Three months ended
March 31, 2019 Change
Net investment income (as reported on an adjusted basis) $4,321 $4,281 1%
• Net investment income (as reported on an adjusted basis) was $4.3 billion, up 1 percent. Variable investment income was $351 million, compared to $174 million in the first quarter of 2019, driven by higher private equity income.
FIRST QUARTER 2020 NOTABLE ITEMS
($ in millions) Adjusted Earnings
Three months ended March 31, 2020
Notable Items
U.S.
Asia Latin
America EMEA MetLife
Holdings
Corporate &
Other Total Group
Benefits
Retirement and Income Solutions
Property &
Casualty Total notable items $0 $0 $0 $0 $0 $0 $0 $0 $0
###
Contacts: For Media: Ashia Razzaq (212) 578-1538 For Investors: John Hall (347) 401-3404
About MetLife MetLife, Inc. (NYSE: MET), through its subsidiaries and affiliates (MetLife), is one of the world's leading financial services companies, providing insurance, annuities, employee benefits and asset management to help its individual and institutional customers navigate their changing world. Founded in 1868, MetLife has operations in more than 40 markets globally and holds leading positions in the United States, Japan, Latin America, Asia, Europe and the Middle East. For more information, visit www.metlife.com.
Conference Call MetLife will hold its first quarter 2020 earnings conference call and audio webcast on Thursday, May 7, 2020, from 9-10 a.m. (ET). The conference call will be available live via telephone and the internet. To listen via telephone, dial 844-291-6362 (U.S.) or 234-720-6995 (outside the U.S.). The participant access code is 6162808. To listen to the conference call via the internet, visit www.metlife.com through a link on the Investor Relations page. Those who want to listen to the call via telephone or the internet should dial in or go to the website at least 15 minutes prior to the call to register, and/or download and install any necessary audio software.
The conference call will be available for replay via telephone and the internet beginning at 2:15 p.m. (ET) on Thursday, May 7, 2020, until Thursday, May 14, 2020, at 10:55 p.m. (ET). To listen to a replay of the conference call via telephone, dial 866-207-1041 (U.S.) or 402-970-0847 (outside the U.S.). The access code for the replay is 9798723. To access the replay of the conference call over the internet, visit the above-mentioned website.
Page 9 of 28
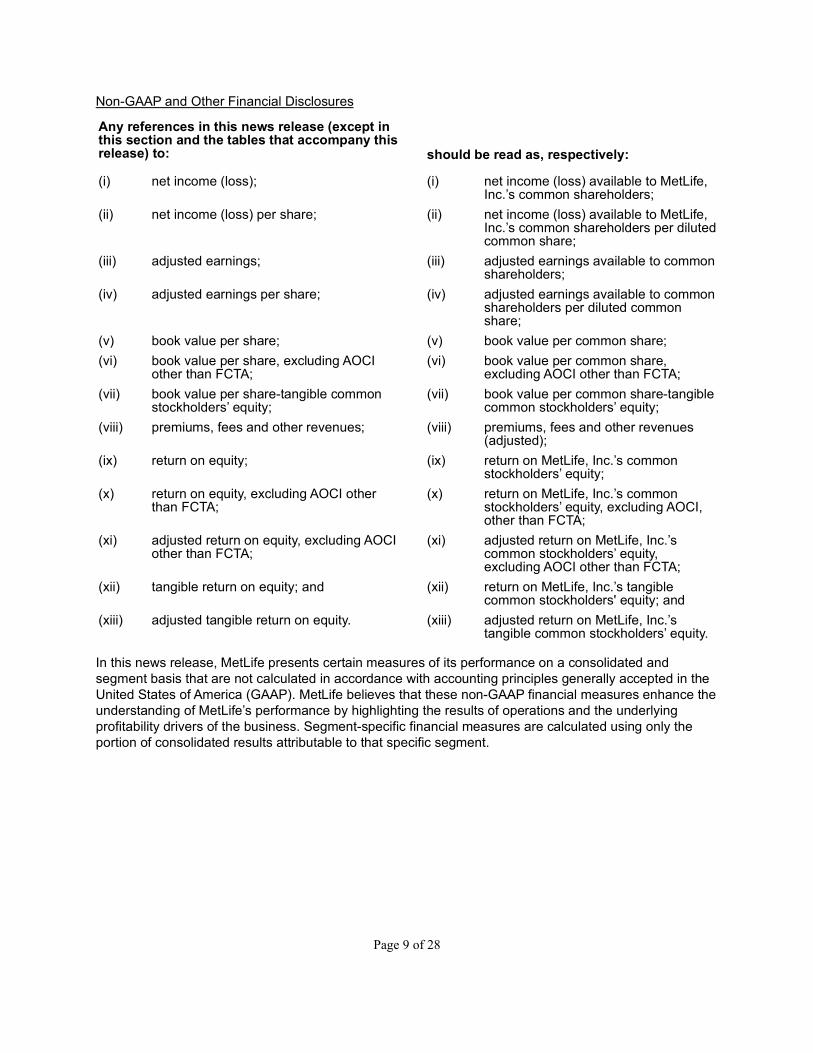
Non-GAAP and Other Financial Disclosures
Any references in this news release (except in this section and the tables that accompany this release) to:
should be read as, respectively: (i) net income (loss); (i) net income (loss) available to MetLife,
Inc.’s common shareholders; (ii) net income (loss) per share; (ii) net income (loss) available to MetLife,
Inc.’s common shareholders per diluted common share;
(iii) adjusted earnings; (iii) adjusted earnings available to common shareholders;
(iv) adjusted earnings per share; (iv) adjusted earnings available to common shareholders per diluted common share;
(v) book value per share; (v) book value per common share; (vi) book value per share, excluding AOCI
other than FCTA; (vi) book value per common share,
excluding AOCI other than FCTA; (vii) book value per share-tangible common
stockholders’ equity; (vii) book value per common share-tangible
common stockholders’ equity; (viii) premiums, fees and other revenues; (viii) premiums, fees and other revenues
(adjusted); (ix) return on equity; (ix) return on MetLife, Inc.’s common
stockholders’ equity; (x) return on equity, excluding AOCI other
than FCTA; (x) return on MetLife, Inc.’s common
stockholders’ equity, excluding AOCI, other than FCTA;
(xi) adjusted return on equity, excluding AOCI other than FCTA;
(xi) adjusted return on MetLife, Inc.’s common stockholders’ equity, excluding AOCI other than FCTA;
(xii) tangible return on equity; and (xii) return on MetLife, Inc.’s tangible common stockholders' equity; and
(xiii) adjusted tangible return on equity. (xiii) adjusted return on MetLife, Inc.’s tangible common stockholders’ equity.
In this news release, MetLife presents certain measures of its performance on a consolidated and segment basis that are not calculated in accordance with accounting principles generally accepted in the United States of America (GAAP). MetLife believes that these non-GAAP financial measures enhance the understanding of MetLife’s performance by highlighting the results of operations and the underlying profitability drivers of the business. Segment-specific financial measures are calculated using only the portion of consolidated results attributable to that specific segment.

Page 10 of 28
The following non-GAAP financial measures should not be viewed as substitutes for the most directly comparable financial measures calculated in accordance with GAAP:
Non-GAAP financial measures: Comparable GAAP financial measures: (i) total adjusted revenues; (i) total revenues; (ii) total adjusted expenses; (ii) total expenses; (iii) adjusted premiums, fees and other
revenues; (iii) premiums, fees and other revenues;
(iv) adjusted premiums, fees and other revenues, excluding PRT;
(iv) premiums, fees and other revenues;
(v) adjusted earnings; (v) income (loss) from continuing operations, net of income tax;
(vi) net investment income, as reported on an adjusted basis;
(vi) net investment income;
(vii) capitalization of deferred policy acquisition costs (DAC), as reported on an adjusted basis;
(vii) capitalization of DAC;
(viii) adjusted earnings available to common shareholders;
(viii) net income (loss) available to MetLife, Inc.’s common shareholders;
(ix) adjusted earnings available to common shareholders, excluding total notable items;
(ix) net income (loss) available to MetLife, Inc.’s common shareholders;
(x) adjusted earnings available to common shareholders per diluted common share;
(x) net income (loss) available to MetLife, Inc.’s common shareholders per diluted common share;
(xi) adjusted earnings available to common shareholders, excluding total notable items, per diluted common share;
(xi) net income (loss) available to MetLife, Inc.’s common shareholders per diluted common share;
(xii) adjusted return on equity; (xii) return on equity; (xiii) adjusted return on equity, excluding AOCI
other than FCTA; (xiii) return on equity;
(xiv) adjusted tangible return on equity; (xiv) return on equity; (xv) investment portfolio gains (losses); (xv) net investment gains (losses); (xvi) derivative gains (losses); (xvi) net derivative gains (losses); (xvii) total MetLife, Inc.’s tangible common
stockholders’ equity; (xvii) total MetLife, Inc.’s stockholders’
equity; (xviii) total MetLife, Inc.’s tangible common
stockholders’ equity, excluding total notable items;
(xviii) total MetLife, Inc.’s stockholders’ equity;
(xix) total MetLife, Inc.’s common stockholders’ equity, excluding AOCI other than FCTA;
(xix) total MetLife, Inc.’s stockholders’ equity;
(xx) total MetLife, Inc.’s common stockholders’ equity, excluding total notable items (excludes AOCI other than FCTA);
(xx) total MetLife, Inc.’s stockholders’ equity;
(xxi) book value per common share, excluding AOCI other than FCTA;
(xxi) book value per common share;
(xxii) book value per common share - tangible common stockholders' equity;
(xxii) book value per common share;

Page 11 of 28
(xxiii) free cash flow of all holding companies; (xxiii) MetLife, Inc. (parent company only) net cash provided by (used in) operating activities;
(xxiv) other expenses, as reported on an adjusted basis;
(xxiv) other expenses;
(xxv) other expenses, net of capitalization of DAC, as reported on an adjusted basis;
(xxv) other expenses, net of capitalization of DAC;
(xxvi) other expenses, net of capitalization of DAC, excluding total notable items related to other expenses, as reported on an adjusted basis;
(xxvi) other expenses, net of capitalization of DAC;
(xxvii) adjusted expense ratio; (xxvii) expense ratio; (xxviii) adjusted expense ratio, excluding total
notable items related to other expenses and PRT;
(xxviii) expense ratio;
(xxix) direct expenses; (xxix) other expenses; (xxx) direct expenses, excluding total notable
items related to direct expenses; (xxx) other expenses;
(xxxi) direct expense ratio; and (xxxi) expense ratio; and (xxxii) direct expense ratio, excluding total
notable items related to direct expenses and PRT.
(xxxii) expense ratio.
Any of these financial measures shown on a constant currency basis reflect the impact of changes in foreign currency exchange rates and are calculated using the average foreign currency exchange rates for the most recent period and applied to the comparable prior period.
Reconciliations of these non-GAAP financial measures to the most directly comparable GAAP financial measures are included in this earnings news release and in this period’s quarterly financial supplement, which is available at www.metlife.com.
MetLife’s definitions of non-GAAP and other financial measures discussed in this news release may differ from those used by other companies:
Adjusted earnings and related measures • adjusted earnings; • adjusted earnings available to common shareholders; • adjusted earnings available to common shareholders on a constant currency basis; • adjusted earnings available to common shareholders, excluding total notable items; • adjusted earnings available to common shareholders, excluding total notable items, on a constant
currency basis; • adjusted earnings available to common shareholders per diluted common share; • adjusted earnings available to common shareholders on a constant currency basis per diluted
common share; • adjusted earnings available to common shareholders, excluding total notable items per diluted
common share; and • adjusted earnings available to common shareholders, excluding total notable items, on a constant
currency basis per diluted common share.

Page 12 of 28
These measures are used by management to evaluate performance and allocate resources. Consistent with GAAP guidance for segment reporting, adjusted earnings and components of, or other financial measures based on, adjusted earnings are also MetLife’s GAAP measures of segment performance. Adjusted earnings and other financial measures based on adjusted earnings are also the measures by which MetLife senior management’s and many other employees’ performance is evaluated for the purposes of determining their compensation under applicable compensation plans. Adjusted earnings and other financial measures based on adjusted earnings allow analysis of MetLife's performance relative to its Business Plan and facilitate comparisons to industry results.
Adjusted earnings is defined as adjusted revenues less adjusted expenses, net of income tax. Adjusted loss is defined as negative adjusted earnings. Adjusted earnings available to common shareholders is defined as adjusted earnings less preferred stock dividends.
Adjusted revenues and adjusted expenses These financial measures, along with the related adjusted premiums, fees and other revenues, focus on our primary businesses principally by excluding the impact of market volatility, which could distort trends, and revenues and costs related to non-core products and certain entities required to be consolidated under GAAP. Also, these measures exclude results of discontinued operations under GAAP and other businesses that have been or will be sold or exited by MetLife but do not meet the discontinued operations criteria under GAAP and are referred to as divested businesses. Divested businesses also include the net impact of transactions with exited businesses that have been eliminated in consolidation under GAAP and costs relating to businesses that have been or will be sold or exited by MetLife that do not meet the criteria to be included in results of discontinued operations under GAAP. Adjusted revenues also excludes net investment gains (losses) (NIGL) and net derivative gains (losses) (NDGL). Adjusted expenses also excludes goodwill impairments.
The following additional adjustments are made to revenues, in the line items indicated, in calculating adjusted revenues:
• Universal life and investment-type product policy fees excludes the amortization of unearned revenue related to NIGL and NDGL (Unearned revenue adjustments) and certain variable annuity guaranteed minimum income benefits (GMIB) fees (GMIB fees);
• Net investment income: (i) includes adjustments for earned income on derivatives and amortization of premium on derivatives that are hedges of investments or that are used to replicate certain investments but do not qualify for hedge accounting treatment (Investment hedge adjustments), (ii) excludes post-tax adjusted earnings adjustments relating to insurance joint ventures accounted for under the equity method (Operating joint venture adjustments), (iii) excludes certain amounts related to contractholder-directed equity securities (Unit-linked contract income), (iv) excludes certain amounts related to securitization entities that are variable interest entities (VIEs) consolidated under GAAP (Securitization entities income); and (v) includes distributions of profits from certain other limited partnership interests that were previously accounted for under the cost method, but are now accounted for at estimated fair value, where the change in estimated fair value is recognized in NIGL under GAAP (Certain partnership distributions); and
• Other revenues is adjusted for settlements of foreign currency earnings hedges and excludes fees received in association with services provided under transition service agreements (TSA fees).

Page 13 of 28
The following additional adjustments are made to expenses, in the line items indicated, in calculating adjusted expenses:
• Policyholder benefits and claims and policyholder dividends excludes: (i) amortization of basis adjustments associated with de-designated fair value hedges of future policy benefits (PBC hedge adjustments), (ii) changes in the policyholder dividend obligation related to NIGL and NDGL (PDO adjustments), (iii) inflation-indexed benefit adjustments associated with contracts backed by inflation-indexed investments and amounts associated with periodic crediting rate adjustments based on the total return of a contractually referenced pool of assets and other pass-through adjustments (Inflation and pass-through adjustments), (iv) benefits and hedging costs related to GMIBs (GMIB costs), and (v) market value adjustments associated with surrenders or terminations of contracts (Market value adjustments);
• Interest credited to policyholder account balances includes adjustments for earned income on derivatives and amortization of premium on derivatives that are hedges of policyholder account balances but do not qualify for hedge accounting treatment (PAB hedge adjustments) and excludes certain amounts related to net investment income earned on contractholder-directed equity securities (Unit-linked contract costs);
• Amortization of DAC and value of business acquired (VOBA) excludes amounts related to: (i) NIGL and NDGL, (ii) GMIB fees and GMIB costs and (iii) Market value adjustments;
• Amortization of negative VOBA excludes amounts related to Market value adjustments; • Interest expense on debt excludes certain amounts related to securitization entities that are
VIEs consolidated under GAAP (Securitization entities debt expense); and • Other expenses excludes: (i) noncontrolling interests, (ii) implementation of new insurance
regulatory requirements costs (Regulatory implementation costs), and (iii) acquisition, integration and other costs. Other expenses includes TSA fees.
Adjusted earnings also excludes the recognition of certain contingent assets and liabilities that could not be recognized at acquisition or adjusted for during the measurement period under GAAP business combination accounting guidance.
The tax impact of the adjustments mentioned above are calculated net of the U.S. or foreign statutory tax rate, which could differ from MetLife’s effective tax rate. Additionally, the provision for income tax (expense) benefit also includes the impact related to the timing of certain tax credits, as well as certain tax reforms.

Page 14 of 28
Investment portfolio gains (losses) and derivative gains (losses) These are measures of investment and hedging activity. Investment portfolio gains (losses) principally excludes amounts that are reported within net investment gains (losses) but do not relate to the performance of the investment portfolio, such as gains (losses) on sales and divestitures of businesses, goodwill impairment or changes in estimated fair value. Derivative gains (losses) principally excludes earned income on derivatives and amortization of premium on derivatives, where such derivatives are either hedges of investments or are used to replicate certain investments, and where such derivatives do not qualify for hedge accounting. This earned income and amortization of premium is reported within adjusted earnings and not within derivative gains (losses).
Return on equity, allocated equity, tangible equity and related measures • Total MetLife, Inc.’s common stockholders’ equity, excluding AOCI other than FCTA: total MetLife,
Inc.’s common stockholders’ equity, excluding the net unrealized investment gains (losses) and defined benefit plans adjustment components of AOCI, net of income tax.
• Total MetLife, Inc.’s common stockholders’ equity, excluding total notable items (excludes AOCI other than FCTA): total MetLife, Inc.’s common stockholders’ equity, excluding the net unrealized investment gains (losses), defined benefit plans adjustment components of AOCI and total notable items, net of income tax.
• Return on MetLife, Inc.’s common stockholders’ equity: net income (loss) available to MetLife, Inc.’s common shareholders divided by MetLife, Inc.’s average common stockholders’ equity.
• Return on MetLife, Inc.'s common stockholders' equity, excluding AOCI other than FCTA: net income (loss) available to MetLife, Inc.’s common shareholders divided by MetLife, Inc.'s average common stockholders' equity, excluding AOCI other than FCTA.
• Adjusted return on MetLife, Inc.'s common stockholders' equity: adjusted earnings available to common shareholders divided by MetLife, Inc.'s average common stockholders' equity.
• Adjusted return on MetLife, Inc.'s common stockholders' equity, excluding AOCI other than FCTA: adjusted earnings available to common shareholders divided by MetLife, Inc.'s average common stockholders' equity, excluding AOCI other than FCTA.
• Adjusted return on MetLife, Inc.'s common stockholders' equity, excluding total notable items (excludes AOCI other than FCTA): adjusted earnings available to common shareholders, excluding total notable items divided by MetLife, Inc.'s average common stockholders' equity, excluding total notable items (excludes AOCI other than FCTA).
• Allocated equity: portion of MetLife, Inc.’s common stockholders’ equity that management allocates to each of its segments and sub-segments based on local capital requirements and economic capital. Economic capital is an internally developed risk capital model, the purpose of which is to measure the risk in the business and to provide a basis upon which capital is deployed. MetLife management periodically reviews this model to ensure that it remains consistent with emerging industry practice standards and the local capital requirements; allocated equity may be adjusted if warranted by such review. Allocated equity excludes the impact of AOCI other than FCTA.
• Adjusted return on allocated equity: adjusted earnings available to common shareholders divided by allocated equity.

Page 15 of 28
The above measures represent a level of equity consistent with the view that, in the ordinary course of business, MetLife does not plan to sell most investments for the sole purpose of realizing gains or losses. Also refer to the utilization of adjusted earnings and components of, or other financial measures based on adjusted earnings mentioned above.
• Total MetLife, Inc.’s tangible common stockholders’ equity or tangible equity: total MetLife, Inc.’s common stockholders’ equity, excluding AOCI other than FCTA, reduced by the impact of goodwill, value of distribution agreements (VODA) and value of customer relationships acquired (VOCRA), all net of income tax.
• Total MetLife, Inc.’s tangible common stockholders’ equity, adjusted for total notable items: total MetLife, Inc.’s common stockholders’ equity, excluding AOCI other than FCTA, reduced by the impact of goodwill, value of distribution agreements (VODA), value of customer relationships acquired (VOCRA) and total notable items, all net of income tax.
• Return on MetLife, Inc.’s tangible common stockholders' equity: net income (loss) available to MetLife, Inc.’s common shareholders, excluding amortization of VODA and VOCRA, net of income tax, divided by MetLife, Inc.'s average tangible common stockholders' equity.
• Adjusted return on MetLife, Inc.'s tangible common stockholders' equity: adjusted earnings available to common shareholders, excluding amortization of VODA and VOCRA, net of income tax, divided by MetLife, Inc.'s average tangible common stockholders' equity.
• Allocated tangible equity: allocated equity reduced by the impact of goodwill, VODA and VOCRA, all net of income tax.
• Adjusted return on allocated tangible equity: adjusted earnings available to common shareholders, excluding amortization of VODA and VOCRA, net of income tax, divided by allocated tangible equity.
The above measures are, when considered in conjunction with regulatory capital ratios, a measure of capital adequacy.
Expense ratio, direct expense ratio, adjusted expense ratio and related measures • Expense ratio: other expenses, net of capitalization of DAC, divided by premiums, fees and other
revenues. • Direct expense ratio: direct expenses, on an adjusted basis, divided by adjusted premiums, fees
and other revenues. • Direct expense ratio, excluding total notable items related to direct expenses and PRT: direct
expenses, on an adjusted basis, excluding total notable items related to direct expenses, divided by adjusted premiums, fees and other revenues, excluding PRT.
• Adjusted expense ratio: other expenses, net of capitalization of DAC, both on an adjusted basis, divided by adjusted premiums, fees and other revenues.
• Adjusted expense ratio, excluding total notable items related to other expenses and PRT: other expenses, net of capitalization of DAC, both on an adjusted basis, excluding total notable items related to other expenses, divided by adjusted premiums, fees and other revenues, excluding PRT.
General account (GA) assets under management (GA AUM) and related measures
GA AUM is used by MetLife to describe assets in its GA investment portfolio which are actively managed and stated at estimated fair value. GA AUM is comprised of GA total investments and cash and cash equivalents, excluding policy loans, contractholder-directed equity securities, fair value option securities and certain other invested assets, as substantially all of these assets are not actively managed in MetLife’s GA investment portfolio. Mortgage loans (including commercial, agricultural and residential) and real estate and real estate joint ventures included in GA AUM (at net asset value, net of deduction for encumbering debt) have been adjusted from carrying value to estimated fair value. At the segment level, intersegment balances (intercompany activity, primarily related to investments in subsidiaries, that eliminate at the MetLife consolidated level) are excluded from GA AUM.

Page 16 of 28
GA AUM (at amortized cost) excludes the following adjustments: (i) unrealized gain (loss) on investments carried at estimated fair value and (ii) adjustments from carrying value to estimated fair value on mortgage loans (including commercial, agricultural and residential) and real estate and real estate joint ventures. GA AUM (at amortized cost) is presented net of related allowance for credit loss.
Statistical sales information: • U.S.:
▪ Group Benefits: calculated using 10% of single premium deposits and 100% of annualized full-year premiums and fees from recurring premium policy sales of all products.
▪ Retirement and Income Solutions: calculated using 10% of single premium deposits and 100% of annualized full-year premiums and fees only from recurring premium policy sales of specialized benefit resources and corporate-owned life insurance.
▪ Property & Casualty: calculated based on first year direct written premium, net of cancellation and endorsement activity.
• Latin America, Asia and EMEA: calculated using 10% of single-premium deposits (mainly from retirement products such as variable annuity, fixed annuity and pensions), 20% of single-premium deposits from credit insurance and 100% of annualized full-year premiums and fees from recurring-premium policy sales of all products (mainly from risk and protection products such as individual life, accident & health and group).
Sales statistics do not correspond to revenues under GAAP, but are used as relevant measures of
business activity.
The following additional information is relevant to an understanding of MetLife’s performance results and outlook:
• Volume growth, as discussed in the context of business growth, is the period over period percentage change in adjusted earnings available to common shareholders attributable to adjusted premiums, fees and other revenues and assets under management levels, applying a model in which certain margins and factors are held constant. The most significant of such items are underwriting margins, investment margins, changes in equity market performance, expense margins and the impact of changes in foreign currency exchange rates.
• MetLife uses a measure of free cash flow to facilitate an understanding of its ability to generate cash for reinvestment into its businesses or use in non-mandatory capital actions. MetLife defines free cash flow as the sum of cash available at MetLife’s holding companies from dividends from operating subsidiaries, expenses and other net flows of the holding companies (including capital contributions to subsidiaries), and net contributions from debt to be at or below target leverage ratios. This measure of free cash flow is prior to capital actions, such as common stock dividends and repurchases, debt reduction and mergers and acquisitions. Free cash flow should not be viewed as a substitute for net cash provided by (used in) operating activities calculated in accordance with GAAP. The free cash flow ratio is typically expressed as a percentage of annual adjusted earnings available to common shareholders.
• Notable items represent a positive (negative) impact to adjusted earnings available to common shareholders. Notable items reflect the unexpected impact of events that affect MetLife’s results, but that were unknown and that MetLife could not anticipate when it devised its Business Plan. Notable items also include certain items regardless of the extent anticipated in the Business Plan, to help investors have a better understanding of MetLife's results and to evaluate and forecast those results.
• We refer to observable forward yield curves as of a particular date in connection with making our estimates for future results. The observable forward yield curves at a given time are based on implied future interest rates along a range of interest rate durations. This includes the 10-year U.S. Treasury rate which we use as a benchmark rate to describe longer-term interest rates used in our estimates for future results.

Page 17 of 28
Forward-Looking Statements This news release may contain or incorporate by reference information that includes or is based upon forward-looking statements within the meaning of the Private Securities Litigation Reform Act of 1995. Forward-looking statements give expectations or forecasts of future events. These statements can be identified by the fact that they do not relate strictly to historical or current facts. They use words and terms such as "2Q," “anticipate,” "continue," “estimate,” “expect,” "future," "ongoing," "outlook," "plan," "positioned," “project,” "remain," “second quarter,” "target," "will," "would," and other words and terms of similar meaning, in each of their forms of speech, or that are tied to future periods, in connection with a discussion of future performance. In particular, these include statements relating to future actions, prospective services or products, future performance or results of current and anticipated services or products, sales efforts, expenses, the outcome of contingencies such as legal proceedings, trends in operations and financial results. Many factors will be important in determining the results of MetLife, Inc., its subsidiaries and affiliates. Forward-looking statements are based on our assumptions and current expectations, which may be inaccurate, and on the current economic environment, which may change. These statements are not guarantees of future performance. They involve a number of risks and uncertainties that are difficult to predict. Results could differ materially from those expressed or implied in the forward-looking statements. Risks, uncertainties, and other factors that might cause such differences include the risks, uncertainties and other factors identified in MetLife, Inc.’s filings with the U.S. Securities and Exchange Commission. These factors include: (1) the course of the COVID-19 pandemic and responses to it, which may also precipitate or exacerbate the remaining risks; (2) difficult economic conditions, including risks relating to interest rates, credit spreads, equity, real estate, obligors and counterparties, currency exchange rates, derivatives, and terrorism and security; (3) adverse global capital and credit market conditions, which may affect our ability to meet liquidity needs and access capital, including through credit facilities; (4) downgrades in our claims paying ability, financial strength or credit ratings; (5) availability and effectiveness of reinsurance, hedging or indemnification arrangements; (6) increasing cost and limited market capacity for statutory life insurance reserve financings; (7) the impact on us of changes to and implementation of the wide variety of laws and regulations to which we are subject; (8) regulatory, legislative or tax changes relating to our operations that may affect the cost of, or demand for, our products or services; (9) adverse results or other consequences from litigation, arbitration or regulatory investigations; (10) legal, regulatory and other restrictions affecting MetLife, Inc.’s ability to pay dividends and repurchase common stock; (11) MetLife, Inc.’s primary reliance, as a holding company, on dividends from subsidiaries to meet free cash flow targets and debt payment obligations and the applicable regulatory restrictions on the ability of the subsidiaries to pay such dividends; (12) investment losses, defaults and volatility; (13) potential liquidity and other risks resulting from our participation in a securities lending program and other transactions; (14) changes to securities and investment valuations, allowances and impairments taken on investments, and methodologies, estimates and assumptions; (15) differences between actual claims experience and underwriting and reserving assumptions; (16) political, legal, operational, economic and other risks relating to our global operations; (17) competitive pressures, including with respect to pricing, entry of new competitors, consolidation of distributors, the development of new products by new and existing competitors, and for personnel; (18) the impact of technological changes on our businesses; (19) catastrophe losses; (20) a deterioration in the experience of the closed block established in connection with the reorganization of Metropolitan Life Insurance Company; (21) impairment of goodwill or other long-lived assets, or the establishment of a valuation allowance against our deferred income tax asset; (22) changes in assumptions related to deferred policy acquisition costs, deferred sales inducements or value of business acquired; (23) exposure to losses related to guarantees in certain products; (24) ineffectiveness of risk management policies and procedures or models; (25) a failure in cybersecurity systems or other information security systems or disaster recovery plans; (26) any failure to protect the confidentiality of client information; (27) changes in accounting standards; (28) associates taking excessive risks; (29) difficulties in or complications from marketing and distributing

Page 18 of 28
products through our distribution channels; (30) increased expenses relating to pension and other postretirement benefit plans; (31) inability to protect our intellectual property rights or claims of infringement of others’ intellectual property rights; (32) difficulties, unforeseen liabilities, asset impairments, or rating agency actions arising from business acquisitions and dispositions, joint ventures, or other legal entity reorganizations; (33) unanticipated or adverse developments that could harm our expected operational or other benefits from the separation of Brighthouse Financial, Inc. and its subsidiaries; (34) the possibility that MetLife, Inc.’s Board of Directors may influence the outcome of stockholder votes through the voting provisions of the MetLife Policyholder Trust; (35) provisions of laws and our incorporation documents that may delay, deter or prevent takeovers and corporate combinations involving MetLife; and (36) other risks and uncertainties described from time to time in MetLife, Inc.’s filings with the U.S. Securities and Exchange Commission. MetLife, Inc. does not undertake any obligation to publicly correct or update any forward-looking statement if MetLife, Inc. later becomes aware that such statement is not likely to be achieved. Please consult any further disclosures MetLife, Inc. makes on related subjects in reports to the U.S. Securities and Exchange Commission.

Page 19 of 28
MetLife, Inc. GAAP Interim Condensed Consolidated Statements of Operations
(Unaudited) (In millions)
For the Three Months Ended March 31, 2020 2019 Revenues Premiums $ 9,466 $ 9,405
Universal life and investment-type product policy fees 1,431 1,365
Net investment income 3,061 4,908
Other revenues 439 494
Net investment gains (losses) (288 ) 15
Net derivative gains (losses) 4,201 115
Total revenues 18,310 16,302
Expenses Policyholder benefits and claims 9,022 9,072
Interest credited to policyholder account balances 80 1,961
Policyholder dividends 292 300
Capitalization of DAC (774 ) (812 ) Amortization of DAC and VOBA 788 624
Amortization of negative VOBA (10 ) (10 ) Interest expense on debt 222 234
Other expenses 3,047 3,189
Total expenses 12,667 14,558
Income (loss) from continuing operations before provision for income tax 5,643
1,744
Provision for income tax expense (benefit) 1,242 359
Income (loss) from continuing operations, net of income tax 4,401 1,385
Income (loss) from discontinued operations, net of income tax — —
Net income (loss) 4,401 1,385
Less: Net income (loss) attributable to noncontrolling interests 3 4
Net income (loss) attributable to MetLife, Inc. 4,398 1,381
Less: Preferred stock dividends 32 32
Net income (loss) available to MetLife, Inc.'s common shareholders $ 4,366
$ 1,349
See footnotes on last page.

Page 20 of 28
MetLife, Inc. (Unaudited)
(In millions, except per share data) For the Three Months Ended
March 31,
2020 2019
Reconciliation to Adjusted Earnings Available to Common Shareholders
Earnings Per Weighted Average
Common Share Diluted (1)
Earnings Per Weighted Average
Common Share Diluted (1)
Net income (loss) available to MetLife, Inc.'s common shareholders $ 4,366 $ 4.75 $ 1,349 $ 1.40 Adjustments from net income (loss) available to common shareholders to adjusted earnings available to common shareholders: Less: Net investment gains (losses) (288 ) (0.31 ) 15 0.02
Net derivative gains (losses) 4,201 4.57 115 0.12 Premiums 32 0.03 — — Universal life and investment-type product policy fees 46 0.05 27 0.03 Net investment income (1,260 ) (1.37 ) 627 0.65 Other revenues 42 0.05 70 0.07 Policyholder benefits and claims and policyholder dividends 49 0.05 (131 ) (0.14 ) Interest credited to policyholder account balances 1,138 1.23 (713 ) (0.74 ) Capitalization of DAC 3 — — — Amortization of DAC and VOBA (49 ) (0.05 ) 31 0.03 Amortization of negative VOBA — — — — Interest expense on debt — — — — Other expenses (66 ) (0.07 ) (88 ) (0.09 ) Goodwill impairment — — — — Provision for income tax (expense) benefit (928 ) (1.01 ) (24 ) (0.03 ) Income (loss) from discontinued operations, net of income tax — — — —
Add: Net income (loss) attributable to noncontrolling interests 3 — 4 — Adjusted earnings available to common shareholders 1,449 1.58 1,424 1.48 Less: Total notable items (2) — — (55 ) (0.06 ) Adjusted earnings available to common shareholders, excluding total notable items (2) $ 1,449 $ 1.58 $ 1,479 $ 1.54 Adjusted earnings available to common shareholders on a constant currency basis $ 1,449 $ 1.58 $ 1,399 $ 1.45
Adjusted earnings available to common shareholders, excluding total notable items, on a constant currency basis (2) $ 1,449
$ 1.58
$ 1,454
$ 1.51
Weighted average common shares outstanding - diluted 920.0 963.3 See footnotes on last page.

Page 21 of 28
MetLife, Inc. (Unaudited) (In millions)
For the Three Months Ended March 31,
2020 2019 Premiums, Fees and Other Revenues Premiums, fees and other revenues $ 11,336 $ 11,264 Less: Unearned revenue adjustments 18 —
GMIB fees 26 27 Settlement of foreign currency earnings hedges — 2 TSA fees 42 68 Divested businesses 34 —
Adjusted premiums, fees and other revenues $ 11,216 $ 11,167 Adjusted premiums, fees and other revenues, on a constant currency basis $ 11,216 $ 11,062
Less: Pension risk transfer (PRT) (3) (9 ) (2 ) Adjusted premiums, fees and other revenues, excluding PRT, on a constant currency basis $ 11,225 $ 11,064 Net Investment Income Net investment income $ 3,061 $ 4,908 Less: Investment hedge adjustments (138 ) (105 )
Operating joint venture adjustments — — Unit-linked contract income (1,140 ) 736 Securitization entities income — — Certain partnership distributions (4 ) (4 ) Divested businesses 22 —
Net investment income, as reported on an adjusted basis $ 4,321 $ 4,281 Revenues and Expenses Total revenues $ 18,310 $ 16,302 Less: Net investment gains (losses) (288 ) 15 Less: Net derivative gains (losses) 4,201 115 Less: Adjustments related to net investment gains (losses) and net derivative gains (losses) 18 — Less: Other adjustments to revenues:
GMIB fees 26 27 Investment hedge adjustments (138 ) (105 ) Operating joint venture adjustments — — Unit-linked contract income (1,140 ) 736 Securitization entities income — — Certain partnership distributions (4 ) (4 ) Settlement of foreign currency earnings hedges — 2 TSA fees 42 68 Divested businesses 56 —
Total adjusted revenues $ 15,537 $ 15,448 Total expenses $ 12,667 $ 14,558 Less: Adjustments related to net investment gains (losses) and net derivative gains (losses) 30 (24 ) Less: Goodwill impairment — — Less: Other adjustments to expenses:
PBC hedge adjustments 9 — Inflation and pass-through adjustments 48 79 GMIB costs and amortization of DAC and VOBA related to GMIB fees and GMIB costs (128 ) 49 Market value adjustments and amortization of DAC, VOBA and negative VOBA related to market value adjustments 11 (4 ) PAB hedge adjustments (5 ) (3 ) Unit-linked contract costs (1,138 ) 716 Securitization entities debt expense — — Noncontrolling interest (3 ) (6 ) Regulatory implementation costs 2 3 Acquisition, integration and other costs 6 23 TSA fees 42 68 Divested businesses 51 —
Total adjusted expenses $ 13,742 $ 13,657 See footnotes on last page.

Page 22 of 28
MetLife, Inc. (Unaudited)
(In millions, except per share and ratio data)
For the Three Months Ended
March 31,
2020 2019
Expense Detail and Ratios Reconciliation of Capitalization of DAC to Capitalization of DAC, as reported on an adjusted basis Capitalization of DAC $ (774 ) $ (812 )
Less: Divested businesses (3 ) — Capitalization of DAC, as reported on an adjusted basis $ (771 ) $ (812 )
Reconciliation of Other Expenses to Other Expenses, as reported on an adjusted basis Other expenses $ 3,047 $ 3,189
Less: Noncontrolling interest (3 ) (6 )
Less: Regulatory implementation costs 2 3 Less: Acquisition, integration and other costs 6 23 Less: TSA fees 42 68 Less: Divested businesses 19 —
Other expenses, as reported on an adjusted basis $ 2,981 $ 3,101 Other Detail and Ratios Other expenses $ 3,047 $ 3,189
Capitalization of DAC (774 ) (812 )
Other expenses, net of capitalization of DAC $ 2,273 $ 2,377
Premiums, fees and other revenues $ 11,336 $ 11,264
Expense ratio 20.1 % 21.1 %
Direct expenses $ 1,344 $ 1,420
Less: Total notable items related to direct expenses (2) — 70 Direct expenses, excluding total notable items related to direct expenses (2) $ 1,344 $ 1,350 Other expenses, as reported on an adjusted basis $ 2,981 $ 3,101
Capitalization of DAC, as reported on an adjusted basis (771 ) (812 )
Other expenses, net of capitalization of DAC, as reported on an adjusted basis 2,210 2,289 Less: Total notable items related to other expenses, as reported on an adjusted basis (2) — 70
Other expenses, net of capitalization of DAC, excluding total notable items related to other expenses, as reported on an adjusted basis (2) $ 2,210 $ 2,219 Adjusted premiums, fees and other revenues $ 11,216 $ 11,167
Less: PRT (9 ) (2 )
Adjusted premiums, fees and other revenues, excluding PRT $ 11,225 $ 11,169 Direct expense ratio 12.0 % 12.7 %
Direct expense ratio, excluding total notable items related to direct expenses and PRT (2) 12.0 % 12.1 %
Adjusted expense ratio 19.7 % 20.5 %
Adjusted expense ratio, excluding total notable items related to other expenses and PRT (2) 19.7 % 19.9 %
See footnotes on last page.

Page 23 of 28
MetLife, Inc. (Unaudited)
(In millions, except per share data)
For the Three Months Ended
March 31,
Equity Details 2020 2019
Total MetLife, Inc.'s stockholders' equity $ 70,221 $ 58,509 Less: Preferred stock 4,312 3,340 MetLife, Inc.'s common stockholders' equity 65,909 55,169 Less: Net unrealized investment gains (losses), net of income tax 20,369 13,862
Defined benefit plans adjustment, net of income tax (1,985 ) (2,004 )
Total MetLife, Inc.'s common stockholders' equity, excluding AOCI other than FCTA 47,525 43,311 Less: Goodwill, net of income tax 8,828 9,082
VODA and VOCRA, net of income tax 276 298 Total MetLife, Inc.'s tangible common stockholders' equity $ 38,421 $ 33,931 March 31,
2020 2019
Total MetLife, Inc.'s common stockholders' equity, excluding AOCI other than FCTA $ 47,525 $ 43,311 Less: Accumulated total notable items (2) — (55 )
Total MetLife, Inc.'s common stockholders' equity, excluding total notable items (excludes AOCI other than FCTA) (2) 47,525 43,366 Less: Goodwill, net of income tax 8,828 9,082
VODA and VOCRA, net of income tax 276 298 Total MetLife, Inc.'s tangible common stockholders' equity, excluding total notable items (2) $ 38,421 $ 33,986 March 31,
Book Value (4) 2020 2019
Book value per common share $ 72.62 $ 58.06 Less: Net unrealized investment gains (losses), net of income tax 22.45 14.59
Defined benefit plans adjustment, net of income tax (2.19 ) (2.11 )
Book value per common share, excluding AOCI other than FCTA 52.36 45.58 Less: Goodwill, net of income tax 9.73 9.56
VODA and VOCRA, net of income tax 0.30 0.31 Book value per common share - tangible common stockholders' equity $ 42.33 $ 35.71 Common shares outstanding, end of period 907.6 950.2 For the Three Months Ended
March 31,
Average Common Stockholders' Equity 2020 2019
Average common stockholders' equity $ 64,357 $ 52,285 Average common stockholders' equity, excluding AOCI other than FCTA $ 46,175 $ 43,043 Average common stockholders' equity, excluding total notable items (excludes AOCI other than FCTA) (2) $ 46,175 $ 43,070 Average tangible common stockholders' equity $ 36,996 $ 33,630 Average tangible common stockholders' equity, excluding total notable items (2) $ 36,996 $ 33,658 See footnotes on last page.

Page 24 of 28
MetLife, Inc. (Unaudited)
For the Three Months Ended
March 31, (5)
2020 2019
Return on Equity Return on MetLife, Inc.'s:
Common stockholders' equity 27.1 % 10.3 %
Common stockholders' equity, excluding AOCI other than FCTA 37.8 % 12.5 %
Tangible common stockholders' equity (6) 47.3 % 16.2 %
Adjusted return on MetLife, Inc.'s:
Common stockholders' equity 9.0 % 10.9 %
Common stockholders' equity, excluding AOCI other than FCTA 12.6 % 13.2 %
Common stockholders' equity, excluding total notable items (excludes AOCI other than FCTA) (2) 12.6 % 13.7 %
Tangible common stockholders' equity (6) 15.8 % 17.1 %
Tangible common stockholders' equity, excluding total notable items (2), (6) 15.8 % 17.7 %
Adjusted Return on Allocated Equity:
U.S. 28.2 % 27.0 %
Asia 9.8 % 10.0 %
Latin America 12.4 % 18.1 %
EMEA 10.9 % 12.3 %
MetLife Holdings 11.2 % 13.2 %
Adjusted Return on Allocated Tangible Equity:
U.S. 32.4 % 30.7 %
Asia 14.8 % 15.2 %
Latin America 20.3 % 29.9 %
EMEA 19.2 % 22.1 %
MetLife Holdings 12.5 % 14.8 %
See footnotes on last page.

Page 25 of 28
MetLife, Inc. (Unaudited)
Private Equity Returns (7) Year Return Year Return 2008 3.3% 2014 16.7% 2009 (1.4)% 2015 13.4% 2010 16.5% 2016 12.8% 2011 12.4% 2017 15.8% 2012 13.8% 2018 14.4% 2013 14.1% 2019 12.1% Below Investment Grade Credit (8) (in billions, except ratio data) March 31, December 31, Rating 2020 2015 BB 75 % 72 % B 21 % 23 % CC and below 4 % 5 % Total $ 14.2 $ 17.7 % of GA AUM 3.0 % 4.6 % Syndicated Bank Loans (8) (in billions, except ratio data) March 31, December 31, Rating 2020 2015 BBB and above 20 % 12 % BB 55 % 59 % B 23 % 28 % CC and below 2 % 1 % Total $ 4.0 $ 5.3 % of GA AUM 0.9 % 1.4 % Fixed Maturity Securities Exposure to Stressed Sectors (in millions, except ratio data) Sector Book Value (9) Investment Grade % % of Total Investments (10) March 31, 2020 Energy $ 8,696 85 % 1.7 % Airports 3,489 93 % 0.7 % Airlines 556 78 % 0.1 % Cruise Lines / Leisure 504 86 % 0.1 % Restaurants 415 89 % 0.1 % Lodging 307 77 % 0.1 % Fixed Maturity Securities
Exposure to Stressed Sectors (11) $ 13,967
2.8 % See footnotes on last page.

Page 26 of 28
MetLife, Inc. Adjusted Earnings Available to Common Shareholders
(Unaudited) (In millions)
For the Three Months Ended
March 31,
2020 2019 U.S. (3): Adjusted earnings available to common shareholders $ 780 $ 724 Less: Total notable items (2) — — Adjusted earnings available to common shareholders, excluding total notable items (2) $ 780 $ 724 Adjusted premiums, fees and other revenues $ 6,189 $ 6,058 Less: PRT (9 ) (2 )
Adjusted premiums, fees and other revenues, excluding PRT $ 6,198 $ 6,060 Group Benefits (3): Adjusted earnings available to common shareholders $ 312 $ 342 Less: Total notable items (2) — — Adjusted earnings available to common shareholders, excluding total notable items (2) $ 312 $ 342 Adjusted premiums, fees and other revenues $ 4,851 $ 4,545
Retirement & Income Solutions (3): Adjusted earnings available to common shareholders $ 359 $ 285 Less: Total notable items (2) — — Adjusted earnings available to common shareholders, excluding total notable items (2) $ 359 $ 285 Adjusted premiums, fees and other revenues $ 417 $ 609 Less: PRT (9 ) (2 )
Adjusted premiums, fees and other revenues, excluding PRT $ 426 $ 611
Property & Casualty (3): Adjusted earnings available to common shareholders $ 109 $ 97 Less: Total notable items (2) — — Adjusted earnings available to common shareholders, excluding total notable items (2) $ 109 $ 97 Adjusted premiums, fees and other revenues $ 921 $ 904 See footnotes on last page.

Page 27 of 28
MetLife, Inc.
Adjusted Earnings Available to Common Shareholders (Continued) (Unaudited) (In millions)
For the Three Months Ended
March 31,
2020 2019 Asia: Adjusted earnings available to common shareholders $ 350 $ 356 Less: Total notable items (2) — — Adjusted earnings available to common shareholders, excluding total notable items (2) $ 350 $ 356 Adjusted earnings available to common shareholders on a constant currency basis $ 350 $ 350
Adjusted earnings available to common shareholders, excluding total notable items, on a constant currency basis (2) $ 350
$ 350
Adjusted premiums, fees and other revenues $ 2,080 $ 2,121 Adjusted premiums, fees and other revenues, on a constant currency basis $ 2,080 $ 2,117 Latin America: Adjusted earnings available to common shareholders $ 95 $ 134 Less: Total notable items (2) — — Adjusted earnings available to common shareholders, excluding total notable items (2) $ 95 $ 134 Adjusted earnings available to common shareholders on a constant currency basis $ 95 $ 118
Adjusted earnings available to common shareholders, excluding total notable items, on a constant currency basis (2) $ 95
$ 118
Adjusted premiums, fees and other revenues $ 921 $ 942 Adjusted premiums, fees and other revenues, on a constant currency basis $ 921 $ 854 EMEA: Adjusted earnings available to common shareholders $ 78 $ 86 Less: Total notable items (2) — — Adjusted earnings available to common shareholders, excluding total notable items (2) $ 78 $ 86 Adjusted earnings available to common shareholders on a constant currency basis $ 78 $ 83
Adjusted earnings available to common shareholders, excluding total notable items, on a constant currency basis (2) $ 78
$ 83
Adjusted premiums, fees and other revenues $ 697 $ 659 Adjusted premiums, fees and other revenues, on a constant currency basis $ 697 $ 646 MetLife Holdings (3): Adjusted earnings available to common shareholders $ 277 $ 317 Less: Total notable items (2) — — Adjusted earnings available to common shareholders, excluding total notable items (2) $ 277 $ 317 Adjusted premiums, fees and other revenues $ 1,233 $ 1,268 Corporate & Other (3): Adjusted earnings available to common shareholders $ (131 ) $ (193 )
Less: Total notable items (2) — (55 )
Adjusted earnings available to common shareholders, excluding total notable items (2) $ (131 ) $ (138 ) Adjusted premiums, fees and other revenues $ 96 $ 119 See footnotes on last page.

Page 28 of 28
MetLife, Inc. (Unaudited)
(1) Adjusted earnings available to common shareholders, excluding total notable items, per diluted common share is
calculated on a standalone basis and may not equal the sum of (i) adjusted earnings available to common shareholders per diluted common share and (ii) total notable items per diluted common share.
(2) Notable items reflect the unexpected impact of events that affect MetLife’s results, but that were unknown and that MetLife could not anticipate when it devised its Business Plan. Notable items also include certain items regardless of the extent anticipated in the Business Plan to help investors have a better understanding of MetLife's results and to evaluate and forecast those results. Notable items can affect MetLife’s results either positively or negatively.
(3) Results on a constant currency basis are not included as constant currency impact is not significant. (4) Book values exclude $4,312 million and $3,340 of equity related to preferred stock at March 31, 2020 and 2019,
respectively. (5) Annualized using quarter-to-date results. (6) Net income (loss) available to MetLife, Inc.'s common shareholders and adjusted earnings available to common
shareholders, used to calculate returns on tangible equity, exclude the impact of amortization of VODA and VOCRA, net of income tax, for the three months ended March 31, 2020 and 2019 of $8 million and $10 million, respectively.
(7) Represents private equity and middle market capital component of other invested assets. (8) Credit portfolio is estimated at fair value and includes public and private corporates, municipals and foreign governments. Percentages presented include the below investment grade credit or syndicated bank loans by rating distribution. (9) Represents fixed maturity securities available-for-sale at amortized cost, net of allowance for credit loss. (10) Total investments represents cash, cash equivalents and invested assets. (11) The estimated fair value of fixed maturity securities was $13.0 billion.