Methyl acetate production process simulation in ...ashm-journal.com/test/vol1-1/10.pdfMethyl acetate...
14
Applied mathematics in Engineering, Management and Technology 1 (1) 2013:77-90 www.amiemt-journal.com 77 Abstract: Methyl acetate is the etherification process by-product of acetic acid and methanol. In conventional method to attain high purity product two reactors and eight separation towers were utilized despite the fact that a high purity product can be obtained via a reactive distillation tower (RD) system. RD tower is obtainable via a non-equilibrium modelling. Therefore, its error due to equilibrium modelling is rectified. RD tower utilization leads to a reduction in the number of equipments, costs and operation time. The RD tower used in this simulation is a combination of tray segment in high and low and pack segment is in the centre of the tower. The acquired results depicted the smooth flow of liquid and vapour across the tower; obtained a high reaction rate in the reactive tower segment and a suitable purity of product. Keywords: Reactive distillation (RD), non-equilibrium modelling, methyl acetate, Rate Based Model. 1.Introduction: Methyl acetate is the etherification by-product of acetic acid and methanol on the basis of the following reaction: 3 3 2 3 3 COOCH CH O H OH CH COOH CH → ← (1) The above reaction with K=5.2 has two minimum-boiling zoetrope’s in XmeAc=0.66 for methyl acetate/methanol and in the XmeAc=0.92 for methyl acetate/water. The constraints governing a zoetrope’s equilibrium and points have led to the incorporation of two reactors, eight distillation towers and an additional amount of a reactor for attainment of higher purity methyl acetate solvents. On the other hand, the used distillation columns are gained from the equilibrium modelling which leads to the uprising of an error in the calculations. Hence, the above simulation process in a reactive distillation tower system, Reactive Distillation (RD) instead of two reactors and eight distillation towers has been reported [1]. The RDtower can be of the tray, Pack or the combination of both models and a segment of it can be considered for carrying out the reactions and the other segments for isolation and enrichment and such a tower is a resultant of non-equilibrium modelling or Rate based model. Since the existing researches and resources in the country have a rare experience to gain from Rate based model field and simulation of reactive distillation process is persisting and the researches abroad, especially in the United States and the Netherlands are in progress. Hence, in this study the failed equilibrium model to describe separation columns behaviour against the benefits of models that are mass transfer Rate based, and the previous drawbacks are being highly pointed to a greater extent, and in addition the reactive distillation columns are introduced whose modelling is being carried out via the non-equilibrium models and besides there active Distillation. production process of methyl acetate in such column with use of the Aspen Plus software and non-excellence modelling and variations in some parameters and their effects upon percentage variation of the raw material conversion is evaluated. Methyl acetate production process simulation in heterogeneous reactive distillation system Seid Ali Mostajabi Gonabad Department of Chemical Engineering, Faculty of Engineering, Islamic Azad University South Tehran Branch, Tehran, Iran, email: [email protected].
Transcript of Methyl acetate production process simulation in ...ashm-journal.com/test/vol1-1/10.pdfMethyl acetate...

Applied mathematics in Engineering, Management and Technology 1 (1) 2013:77-90 www.amiemt-journal.com
77
Abstract: Methyl acetate is the etherification process by-product of acetic acid and methanol. In conventional method to attain high purity product two reactors and eight separation towers were utilized despite the fact that a high purity product can be obtained via a reactive distillation tower (RD) system. RD tower is obtainable via a non-equilibrium modelling. Therefore, its error due to equilibrium modelling is rectified. RD tower utilization leads to a reduction in the number of equipments, costs and operation time. The RD tower used in this simulation is a combination of tray segment in high and low and pack segment is in the centre of the tower. The acquired results depicted the smooth flow of liquid and vapour across the tower; obtained a high reaction rate in the reactive tower segment and a suitable purity of product. Keywords: Reactive distillation (RD), non-equilibrium modelling, methyl acetate, Rate
Based Model. 1.Introduction: Methyl acetate is the etherification by-product of acetic acid and methanol on the basis of the following reaction:
33233 COOCHCHOHOHCHCOOHCH ++ →← (1)
The above reaction with K=5.2 has two minimum-boiling zoetrope’s in XmeAc=0.66 for methyl acetate/methanol and in the XmeAc=0.92 for methyl acetate/water. The constraints governing a zoetrope’s equilibrium and points have led to the incorporation of two reactors, eight distillation towers and an additional amount of a reactor for attainment of higher purity methyl acetate solvents. On the other hand, the used distillation columns are gained from the equilibrium modelling which leads to the uprising of an error in the calculations. Hence, the above simulation process in a reactive distillation tower system, Reactive Distillation (RD) instead of two reactors and eight distillation towers has been reported [1]. The RDtower can be of the tray, Pack or the combination of both models and a segment of it can be considered for carrying out the reactions and the other segments for isolation and enrichment and such a tower is a resultant of non-equilibrium modelling or Rate based model. Since the existing researches and resources in the country have a rare experience to gain from Rate based model field and simulation of reactive distillation process is persisting and the researches abroad, especially in the United States and the Netherlands are in progress. Hence, in this study the failed equilibrium model to describe separation columns behaviour against the benefits of models that are mass transfer Rate based, and the previous drawbacks are being highly pointed to a greater extent, and in addition the reactive distillation columns are introduced whose modelling is being carried out via the non-equilibrium models and besides there active Distillation. production process of methyl acetate in such column with use of the Aspen Plus software and non-excellence modelling and variations in some parameters and their effects upon percentage variation of the raw material conversion is evaluated.
Methyl acetate production process simulation in heterogeneous reactive distillation system
Seid Ali Mostajabi Gonabad
Department of Chemical Engineering, Faculty of Engineering, Islamic Azad University South Tehran Branch, Tehran, Iran, email: [email protected].

Applied mathematics in Engineering, Management and Technology 1 (1) 2013 A. Gonbad
78
2.Rate Based Model Since the equilibrium models in are effective in expressing the behaviour of liquid and vapour within the separation columns due to (efficiency dependency, considering the equilibrium for liquid and vapour output for each phase regardless to the actual mass and heat transfer rates, lack of attention towards hydraulic effect of tray upon mass transfer, lack of attention in a few integrated system towards interactions that could lead to unusual phenomena such as reverse influence, and in addition the existing weakness points in the efficiencies, that without considering the efficiency variations of different compositions on the tray and the lack of efficiency equitation of their steam and vapour phases and assumed equivalent, in a manner that the attained efficiency is almost devoid of the entire phenomena ranging from dynamic hydro, mass transfer, the interaction in interface etc. arein the device and the efficiency is a stage close to influence of components can be different for them), suffering from weakness and problem and can lead to error appearance in the calculations. Therefore, the models that eliminate the mentioned weakness points are considered [2]. The non-equilibrium models that are founded on the basis of mass transfer Rate were used for the first time by Krishna Taylor in 1985 [3]. Thus, the transfer rates of mass, heat, chemical reactions, hydrodynamic in Packing, in the multi-component model systems, two film extend and the models that have an ability to describe the chemical reaction and the residence time distribution (RTD) have to be investigated. Designing a non-equilibrium model based on the Design mode method in which the Rating tower coincides with simulation, based on the fraction of tower insurrection in the tray columns and pressure loss in the design of pack towers [4]. In this model the equilibrium equations of mass and energy is calculated separately for each phase and the thermodynamic equilibrium for the mass and energy transfer only for the interfaces of two phases is considered and also the non-equilibrium modelling can be carried out in dynamic and S.S. states [5].
Figure 1 depicts a non-equilibrium phase
Figure 1 indicates a non-equilibrium phase, which expresses a Stage from tray tower or a Segment from Packed tower [6]. Non-equilibrium model simulation can be carried out by the Rate frac model present in the Aspen Plus software that is dependent upon the parameters such as mass and energy transfer coefficients, pressure drop, phase currents, physical characteristics, entrainment, design and tower mechanical characteristics, mass and energy transfer flux in an interface, temperature of phases, mass and energy equilibrium equations and the their reaction effect upon mass transfer etc. requires that the mentioned models and many other needed items are available in the above software information. 3.Reactive Distillation (RD):

Applied mathematics in Engineering, Management and Technology 1 (1) 2013 A. Gonbad
79
One of the applications of the non-equilibrium model is in the reactive distillation columns which is one of the major operational units and is gaining attention in the industry. In a manner that instead of using reactor and distillation towers sequentially for the reaction and separation the reaction distillation tower consisting of the following segments from top to bottom: 1- Enrichment 2- Reaction 3- Disposal is utilizable [7].
Figure 2. the raw materials A and B in the reaction segment, convert into C and D and in the enrichment segment B separates from C and in the disposal segment A disposes from D.
In the equilibrium reactions the equilibrium limitations due to evaporation and exit of products from the reaction segment to other segments of tower are lost and lead to the reaction progress towards the product production and in the heat-producing reactions the obtained heat is utilized for distillation in the separation segment. Besides, in the zoetrope mixtures utilizing a component in the reaction segment leads to the breakage of azeotrope in the separation segment, as in the said process with utilization of methanol in the reaction segment leads to exit of methyl acetate from top and water from the tower’s bottom as the products of upside and downside lead to the azeotropes of methyl acetate/methanol and methyl acetate/water. The error issues in calculations due to incorporation of equilibrium models with RD tower, gaining from non-equilibrium models have turned optimal. With methyl acetate and water output from the reaction segment and the progress of the reaction towards product production has reduced the equilibrium limitation. It should be mentioned that due to reaction performance and separation process designed in a tower, the distillation and reaction processes are more complex than the customary design of a reactor and distillation towers. Therefore, the invention of a state for the separation within a reaction zone can lead to a tense and complex interplay between the liquid –vapour equilibrium, liquid-vapour mass transfer, influence inside the catalyst ( for the heterogeneous catalytic processes) and chemical kinetics. In addition, in the tray towers the flow regime is of the important issues [8]. 1- Suitable models for RD design The models that are used in the design and modelling of RD tower, including the equilibrium and non-equilibrium are comprised of: equilibrium stage model s.s, dynamic equilibrium stage model, stage model s.s with multistage efficiency, non-equilibrium stage model s.s, dynamic non-equilibrium stage model, non-equilibrium cell model in the s.s state, dynamic model with multistage efficiencies [9]. 4.Reaction systems enforced via RD [10]

Applied mathematics in Engineering, Management and Technology 1 (1) 2013 A. Gonbad
80
Ether production, ester (methyl acetate, ethyl acetate, hydrogenation (ethylene glycol, propylene glycol, aromatic alkylation (alkyl benzene), thermo chemical, hydrolysis, demonization, carbonation [11]. 4.1.The equations that are utilized in the multi-stage non-excellence modelling s.sinclude: 4.1.1. Mass equilibrium for liquid and vapour phases: Liquid phase:
01
,11111 =−−−−+ ∑=
+++−−−L
ijij
n
v
Ljviijj
Ljijjijj
Ljijj fNGXLQXLXLQXL
(2)
Vapourphase:
0_1
11111 =+−−−++ ∑=
−−∨−
∨++
∨∨ij
n
vijvijjjijijjijijijijij NGyVQfyVyVQyvrViy
(3)
Is the fraction of liquid entrainment in vapour, is the fraction of steam entrainment along with liquid, system in the s.s state, thus this accumulation term in the right side equals to zero. 4.1.2. The Rate equations for each stage:
Lijij
Lij NNR −=
(4) vijij
vij NNR −=
4.1.3. Energy equilibrium for liquid and vapour phases Liquid phase
∑=
+=+− =−+−−−−++n
v
Lj
Lj
Ljv
Ljv
LFj
Lj
Ljjj
Ljj
Ljj
Lj
Ljj
Lj
Ljj eqHCHFHLQHLHLQHLrHL
11111 0
(5)
Vapour phase
011111 =++−−−−++ ∑∨−−−++
vj
vj
vjv
VFjr
VFj
vjjj
vj
vjj
vjj
vj
vjj
vj
vjj eqHCHFHvQHVHVQHVrHV (6)
If the number of compounds is c, materials equilibrium equations 2c+2, energy equilibrium equations 3, transfer rate equations 2c-2, total equations 2, hydraulic equations 1, interface equilibrium equations c, so, in total the 5c+6 number of equations are needed which with the Newton method incorporating reverse relation and k-value model, and the product flow rate in the lower tower as an initial guess and in a manner that the mass transfer flow rate and the energy transfer flux are in the beginning zero, the mole fraction in bulk and the interface equivalent, the vapour and liquid temperature in interface equivalent to an initial guess and the pressure drop in the beginning is considered zero and the equations are solved. H is heat transfer coefficient and is calculated from the Chilton-Colburn similarity. 4.1.4.Maxwell- Stefan equations (Ms)[12]: The equations that are generally used as a mass transfer for dual systems with mass transfer rate are less valid. In addition, the other formulas such as Fick are unable to predict the collisions between different components. The non-idealistic motive force is not considered. Therefore, the Ms Equations that are obtained from the

Applied mathematics in Engineering, Management and Technology 1 (1) 2013 A. Gonbad
81
kinetic theory of gases, with a little variation for the influence of multi-components in a transfer film based on the total mole flux is used as follows:
(7)∑=
−=
n
j CiDijNjyiNiyj
1µ T,p ∇ yi
RT1
-
ijD the influence coefficient Ms¤)∑=
n
JNJ
1
Ni = Ji + yi (¤i=1,…,n
In the Ms Equations as expected by non-equilibrium model the interface equilibrium is assumed and the mass transfer is considered based on the mechanism influences in the film. The above equations are also solvable through the DAE producer. 4.1.5.Two film model The failure to diagnose the phase borders and fluid currents to describe the transfer processes in the separation column causes to use the models with complete equations, simplified and usable like two film model instead of partial differential equations. In the above model the total resistance against mass transfer in an interface (thin film), internal film transfer due to molecular influence s.s single dimension and in bulk due to presence of a gradient is considered and for the vapour influence interface is as follows:
(8)0 =vfη d (vfη Ni Vf)d 4.1.6. Pressure drop modelling In total, the pressure drop inside the tower functions upon the type of currents, density, design parameters, operation conditions, and tray type, in the pack towers Packing functions [13]. So, in this regard, the hydraulic equations are of importance. In the non-equilibrium pressure models in the first stage the condenser pressure is considered, and the tray pressure from the higher stage pressure and the pressure drop is calculated and the calculation parameters can be estimated via the presented textual emendations. In the integrated reactors the pressure drop is composed of 3 parts: 1- Impact of entry and exit points, 2- gravity component, and 3-friction component. 4.1.7.Modelling of chemical reactions The different models that are present in the two film model template are used to describe the chemical reactions [14]. In the heterogeneous catalysts of chemical reaction with different transport phenomena in sequences adjacent to the catalyst surface. The initial profile model for heterogenous catalyst is based upon the general kinetics. In the case of simple homogenous reactions the mass flow rule is applicable. Thedependence of the rate constant of a reaction is described by the Arrhenius equation and kinetics is based on the molar concentrations, the rate of common reaction is written as follows:
( ) )(21
1))(2
1(1
1( iiii VVNci
c
VVNcif ci
kcikr −
=−
= −= ππ (9)
In the above equation vi is the stoichio metric coefficient. 4.1.8.Boundary conditions The intensity of mass transfer in the continuous catalyst interface and in the centre of catalyst the gradients composition, temperature, pressure and mass flux of each component is zero. Therefore, we will have [15]:
cij
sij NN = ، 0=iN ، 0=dz
dT ، 0=dzdp ، 0=dz
dxi (10)

Applied mathematics in Engineering, Management and Technology 1 (1) 2013 A. Gonbad
82
4.1.9.Modelling ofResidence Time Distribution (RTD) Deviation from the ideal state can be due to different reasons such as molecular influence, the flow chaos, canalization and partial stagnancy of fluid region, etc. The flow design, especially in the state where the catalyst is inside the fluid is very complicated, and from the very limited applicable methods and simultaneous solving of the mass equilibrium, energy and momentum profile, the fluid flow is determinable. The axial gas distribution was not so important. Generally the plug current for gas phase is considered and the non-idealistic mixture is related to the gas phase. The general equation of distribution model for the non-reaction state is devoid of this assumption that all the axial mixing phenomena have a linear dependency with the concentration gradient. Therefore, we will have [16]:
dtdcudz
dcBodt
dc == 221 ،
dRLPeDar
ulc == Bo
Bo = Bodenstein Number 5.Process Simulation The hypotheses and conditions considered in the non-equilibrium simulation model of reactive distillation process of methyl acetate in the RD tower include [17]: Vapour phase–liquid in non-reaction stages in interfaces has reached a thermodynamic equilibrium. 2- The reaction stages have reached a chemical equilibrium. 3- The activity of the compounds in the liquid phase is calculated byNRTL model. 4- The demonization of acetic acid in the vapour phase is describable through chemical theory. 5- The heat reduction is not considered. 6- RD tower includes 25 stages in 3 zones with numbers from top to bottom. Stage 1 is considered as complete condenser, stages 2 to 10 are the enrichment segments with a height of 1 metre containing 9 sieve tray with four pass, stages 11 to 19 with a height of 1.85 m is composed of Mellapak filling type, stages 20 to 24 are disposal stages with a height of 1 metre contain 5 sieve tray with four pass, the tower diameter was constant in all segments and equalled to 55 mm, stage 25 composed rebuilder of the Kettle-type reboiler, acid with a temperature of 105 ºC and 14/7 psI pressure with 0.4 mol/min flow rate with 98% purity enters the tower from top of the stage 11, and methanol as 80% vapour with 0.62 mol/min flow rate with 99.5% purity enters the tower from stage 19. The methyl acetate from stage 1 and water from stage 25 flow out as a liquid [17].
Figure (4) is the schematic of the used reactive distillation tower 6.Results Figure-5 shows the profile temperatures of liquid, vapour and interface. From the stages 20 and 24 the disposal activity causes temperature reduction up to 70 ºC in the stages 11 to 19 of reaction segment due to heat

Applied mathematics in Engineering, Management and Technology 1 (1) 2013 A. Gonbad
83
producing reactions led to the rise in the profile temperature up to 90 ºC and from the stages 2 to 10 the enrichment process took place which led to the temperature reduction up to 58 ºC.
Figure (5) Tower temperature profile according to stages
Figure 6 expresses the mass fraction of vapour phase. From the phases 11 to 19 due to reaction with acid methanol suffers severed decrease from 0.95 to 0.12 which supports the proper consumption of the reactor in the reaction zone and an increased level in the phases 20 to 24 due to entry of methanol from stage 19. In addition, methyl acetate from stages 11 to 19 due to the produced reaction activity gains an increased level up to 0.54 and attains enrichment in stages 2 to 10 and reaches its maximum level around 0.86 in the tray 1.
Figure (6) Mass fraction profile according to stages Figure 7 demonstrates the values in the temperature reaction stage, which reached its highest level and led to increase in k. Therefore, k-val level for methyl acetate has reached its highest level and due to product exit from the reaction segment its level descends. The variation K value for three other substances with boiling points over methyl acetate and lower sensitivity in relation to the temperature increase in reaction zone with relation to methyl acetate is less. Besides the K value for methanol in the stage 11 where it enters in the form of vapour 0.8 reaches its highest level.

Applied mathematics in Engineering, Management and Technology 1 (1) 2013 A. Gonbad
84
Figure 7 K-value profile according to stages Figure 8 shows the reactors and products mass transfer severity profile, positive direction as a mass transfer from vapour to liquid was considered, the greatest transfer value in the reaction zone relates to methanol and the lowest level relates to methyl acetate in order to gain a highest purity of methyl acetate in the enrichment segment.
Figure (8)Mass transfer severity profile
The reactor, according to the stages of figure 9 indicates the directive and displacement of heat transfer rate in vapour liquid phase and an interface. The highest quantity relates to the displacement of liquid heat transfer in the reaction zone due to the presence of fillings the lowest level relates to tray segments in the high and low of the tower.
Figure (9) Heat transfer rate profile according tostages
Applied mathematics in Engineering, Management and Technology 1 (1) 2013 A. Gonbad
85
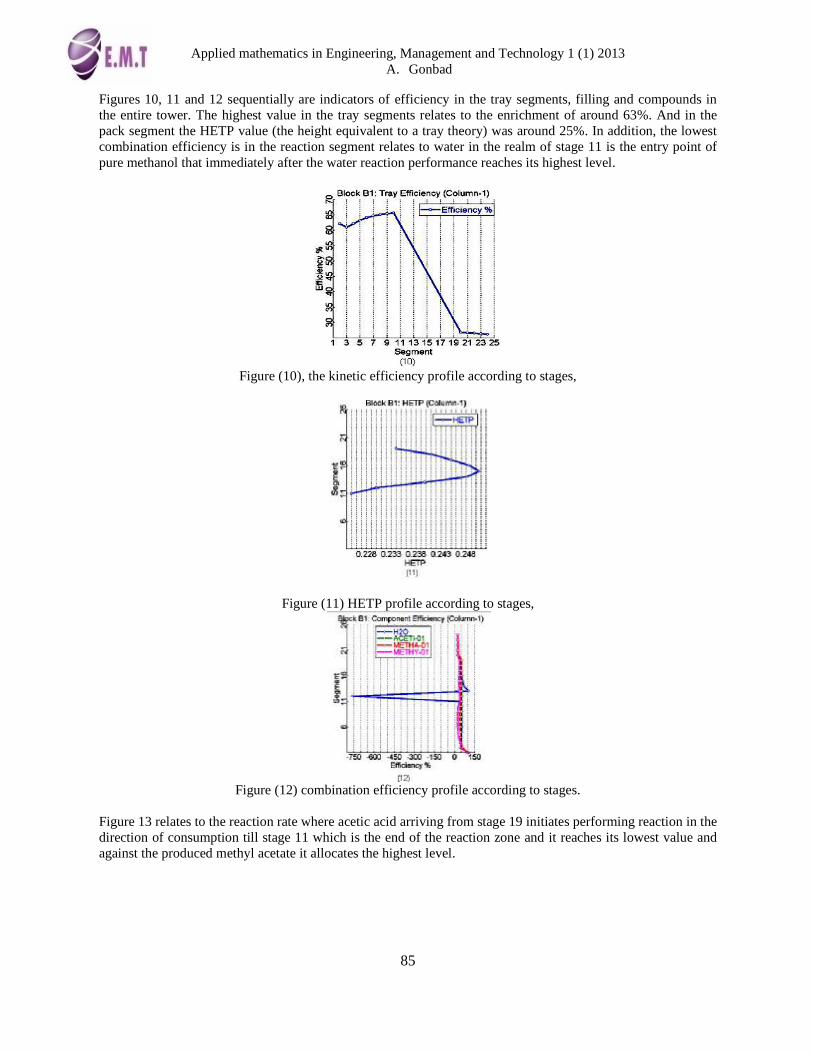
Figures 10, 11 and 12 sequentially are indicators of efficiency in the tray segments, filling and compounds in the entire tower. The highest value in the tray segments relates to the enrichment of around 63%. And in the pack segment the HETP value (the height equivalent to a tray theory) was around 25%. In addition, the lowest combination efficiency is in the reaction segment relates to water in the realm of stage 11 is the entry point of pure methanol that immediately after the water reaction performance reaches its highest level.
Figure (10), the kinetic efficiency profile according to stages,
Figure (11) HETP profile according to stages,
Figure (12) combination efficiency profile according to stages.
Figure 13 relates to the reaction rate where acetic acid arriving from stage 19 initiates performing reaction in the direction of consumption till stage 11 which is the end of the reaction zone and it reaches its lowest value and against the produced methyl acetate it allocates the highest level.

Applied mathematics in Engineering, Management and Technology 1 (1) 2013 A. Gonbad
86
Figure (13) Reaction rate profile according to stages
Figure 14 shows the profiles of liquid and vapour currents across the tower length and the lowest value relates to the liquid flow in the reaction segment due to the existence of filling and upper side of the tower due to the entrance of acid from stage 11 and its movement downside resulting in the reduction of liquid current over the stage 11, and the greatest level relates to steam in the upper side of the tower and finally in condenser after conversion to the desired liquid to the lowest vapour flow where the above results with the liquid – vapour behaviour in towers gains the highest accommodation.
Figure (14) Liquid-vapour current profile in the tower length according to tray
Figure 15 expresses the volatility of materials in relation to acetic acid. The maximum influence relates to methyl acetate in relation to acid, which caused the exit of acetate from the reaction zone and the progress of reaction towards the acetate production. Besides, methanol has a lower volatility in order to produce acetate in the remaining reaction zone. Hydraulic tower profiles are also accessible and examinable.

Applied mathematics in Engineering, Management and Technology 1 (1) 2013 A. Gonbad
87
Figure (15) Volatility profile of materials in relation to acetic acid
Figure 16 depicts the pressure drop via the tower length. The tables 1, 2 and 3 show the mass and energy equilibrium in the tower, the dual influence coefficients and the calculations in the upper side and downside of the tower.
Figure (16) Pressure drop profile in the tower length
Table (1) Mass and heat equilibrium
Applied mathematics in Engineering, Management and Technology 1 (1) 2013 A. Gonbad
88
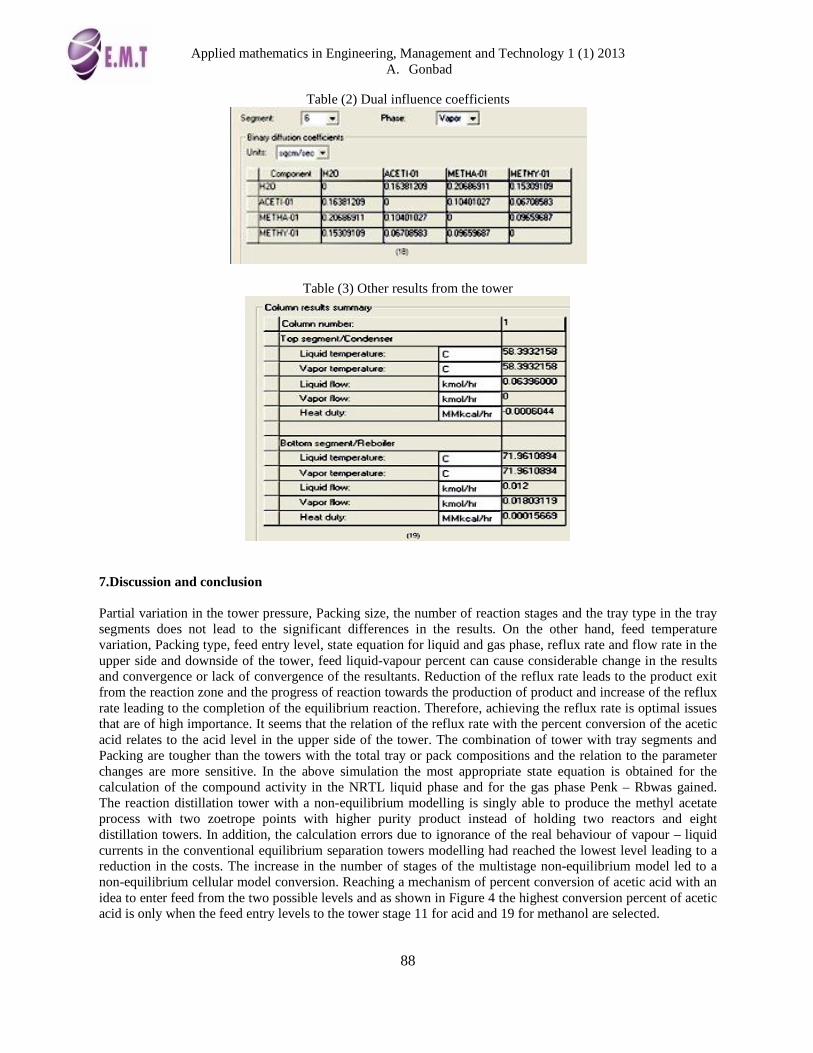
Table (2) Dual influence coefficients
Table (3) Other results from the tower
7.Discussion and conclusion Partial variation in the tower pressure, Packing size, the number of reaction stages and the tray type in the tray segments does not lead to the significant differences in the results. On the other hand, feed temperature variation, Packing type, feed entry level, state equation for liquid and gas phase, reflux rate and flow rate in the upper side and downside of the tower, feed liquid-vapour percent can cause considerable change in the results and convergence or lack of convergence of the resultants. Reduction of the reflux rate leads to the product exit from the reaction zone and the progress of reaction towards the production of product and increase of the reflux rate leading to the completion of the equilibrium reaction. Therefore, achieving the reflux rate is optimal issues that are of high importance. It seems that the relation of the reflux rate with the percent conversion of the acetic acid relates to the acid level in the upper side of the tower. The combination of tower with tray segments and Packing are tougher than the towers with the total tray or pack compositions and the relation to the parameter changes are more sensitive. In the above simulation the most appropriate state equation is obtained for the calculation of the compound activity in the NRTL liquid phase and for the gas phase Penk – Rbwas gained. The reaction distillation tower with a non-equilibrium modelling is singly able to produce the methyl acetate process with two zoetrope points with higher purity product instead of holding two reactors and eight distillation towers. In addition, the calculation errors due to ignorance of the real behaviour of vapour – liquid currents in the conventional equilibrium separation towers modelling had reached the lowest level leading to a reduction in the costs. The increase in the number of stages of the multistage non-equilibrium model led to a non-equilibrium cellular model conversion. Reaching a mechanism of percent conversion of acetic acid with an idea to enter feed from the two possible levels and as shown in Figure 4 the highest conversion percent of acetic acid is only when the feed entry levels to the tower stage 11 for acid and 19 for methanol are selected.

Applied mathematics in Engineering, Management and Technology 1 (1) 2013 A. Gonbad
89
8.Signs Y:Mole fraction in vapour phase X:Mole fraction in liquid phase HAC:Acetic acid MEOH:Methanol Meac:Methyl acetate s.s:Steady flow L: (Superscript) liquid phase V:(Superscript)vapour phase L:Liquid flow V:Vapour flow Q:Entrainment coefficient i:ithstage j:jth stage G: Composition flow rate n: Total stage numbers r: Relations of tower current side effects f: Feed flow rate N:Mass transfer flux R:Rate e: Entry transfer level H:Partial molar enthalpy q: Energy transfer parameter Dij:Maxwell-Stefaninfluence coefficient MS:Maxwell-Stefan C:Mole concentration T:Temperature P:Pressure μ:Viscosity R:Gases International Constant η:Dynamic viscosity ▼:Gradient Z:Height Kc:Fixed equilibrium Kf:Fixed equilibrium References: [1]- BesslingB, Schembecker G., Simmrock. K.H.(1997).Design of Processes with Reactive Distillation Line Diagrams. Industrial and engineering chemistry research,36 (8):3032-3042. [2] Backhaus, A. A. (1921). U.S. Pat. 1,400,849–51. [3]Krishnamurthy R. andTaylor R. (1985). A nonequilibrium stage model of multicomponent separation processes. Part I: Model description and method of solution.AIChE Journal, 31(3):449–456. [4]Arnoud H., Krishna R., and Taylor R.(1999). Nonequilibrium cell model for packed distillation columns , The Influence of Maldistribution,Ind. Eng. Chem. Res., 38 (10):pp 3988–3999. [5]Higler A., KrishnaR.andTaylor R. (1999). Nonequilibrium cell model for multicomponent (reactive) separation processes, AIChE Journal, 45(11): 2357–2370. [6]Kooijman H.A. andTaylor R. (1995).Anonequilibrium model for dynamic simulation of tray distillation-columns.AIChE Journal, 41(8): 1852–1863. [7] Sundmacher K., Kienle A.(2003). Reactive distillation: Status and future directions. Pp. 153-216, wiley –VCH verlag, weinheim, Germany. [8] Onken U.,Arit W.(1990). Recommended Test Mixtures for Distillation Co – lumns, 2nd edition. The Institution of Chemical Engineers, Rugby (UK) [9]Seader J.D. (1989). The rate-based approach for modeling staged separations.Chemical engineering progress, 85(10):4-49.

Applied mathematics in Engineering, Management and Technology 1 (1) 2013 A. Gonbad
90
[10]BauraR., Taylorb R., KrishnaR. (2001). Dynamic behaviour of reactive distillation tray column described with a noneequilibrium cell model.Chemical Engineering Science.56(4):1721–1729. [11] Krishna R., StandartG. (1976). Amulticomponent film model incorporating an exact matrix method of solution to the Maxwell Stephan equation.AIChE Journal, 22(2):383–389. [12]Krishna R., and wesselinghJ.A.(1997). The Maxwell-Stephan Approach to mass transfer, Chemical Engineering Science, 52:861-911. [13]Kunz U., Hoffman U. (1994). Preparation of catalytic polymer/ceramic ion exchange packing for reactive distillation columns preprin”.6thsymp. Prep catalyst vol 1,.Pp.307-316. [14]Wesselingh J.A.and Krishna R. (2000).Mass Transfer in multicomponent Mixture, Delft University Press,Delft. [15]-TaylorR.and KrishnaR.(1993).Multicomponent mass transfer. Pp. 111-173, Wiley, new York. [16]Macías-Salinas R.andFair J.R. (2000)Axial mixing in modern packings, gas, and liquid phases: II. Two-phase flow.AIChE Journal, 46(1): 79-91. [17]Taylor R., and Krishna R. (2000).m”modeling reactive distillation. Chemical Engineering Science, 55:5183-5229.