Methods to Aid Recovery from Training and Racing Dr Gordon Wright Senior ABCC Coach Note carefully:...
96
Methods to Aid Recovery from Training and Racing Dr Gordon Wright Senior ABCC Coach Note carefully: The material presented in these notes is copyright July 2006 and must not be used in any form whatsoever without the permission of the author [email protected] A presentation given at the High Wycombe CC Club Room 26 th July 2006.
-
Upload
tristin-goodgame -
Category
Documents
-
view
213 -
download
0
Transcript of Methods to Aid Recovery from Training and Racing Dr Gordon Wright Senior ABCC Coach Note carefully:...

Methods to Aid Recovery from Training and Racing
Dr Gordon Wright Senior ABCC Coach
Note carefully: The material presented in these notes is copyright July 2006 and must not be used in any form
whatsoever without the permission of the author
A presentation given at the High Wycombe CC Club Room 26th July 2006.

Stage 16 - lost 10 minutes !

Stage 17 - he effectively won the Tour de France
How did he recovery so fast ?

Recovery Issues
These notes cover a range of issues concerning recovery after training and tracing.
They do not cover every aspect of recovery that you could wish to know about– that’s a substantial text book.
But I do cover some important nutritional considerations and also some simple and some very advanced methods of tracking recovery – especially after hard training session or whilst in a heavy period of racing or training. Hopefully most riders will find some value in the information contained here

Training and Racing
is destructive
It has to be if we are to improve
But recovery is the key to it all

The simple answer to most non injury recovery questions in sport is
Active rest and early nutritional support
But a key issue is ‘How long do you rest’
And the answer to that is – it all depends
These note are intended to provide some methods and insights to these two key areas in
particular

What do we mean by recovery ?
Training and racing disturb the body’s balance with its environment. Fatigue is the result.
Recovery restores the body to its previous condition
Further recovery leads to ‘overcompensation’We are stronger and faster the next time round
The process can be summed up in the diagram which follows :-

Fitness level
Train Race Phase
Fatigue Phase
Recovery phaseOvercompensation phase
De – training phase
Increased fitness level The Train – Fatigue –Recovery –Overcompensation cycle

The recovery cycle seen on the previous page could be the result of the recovery from
(a) a single training session or the result of a single race.
(b) the result of a heavy week(s) of training or racing and the easy period which follows
(c) or the result of many weeks, even months, of hard training and racing followed by a complete recovery period
In fact such short, medium and long term recovery cycles are all occurring simultaneously all the time
throughout a racing and training season

(a) The Early Recovery Period – the period immediately following the training or racing session. A vital aspect of this period is early nutrition to speed up the start of the recovery process
(b) the Late Recovery Period – this is the period when overcompensation begins to set in. Many riders often do not get to this period - as a result they don’t get the benefit of over –compensation. The reason – they train hard again too soon, because they fear losing form.
During the recovery phase there are two crucial periods in the whole recovery process:

Fitness level
Recovery phase
Overcompensation phase
Increased fitness level The Train – Fatigue –Recovery –Overcompensation cycle
Early recovery period
Late recovery period
For complete recovery you must get to at
least here

The remainder of these notes address the two key issues of recovery in the
(a) Early Recovery Period and (b) the Late Recovery Period
The Late Recovery Period needs a steady nerve and confidence that a loss of fitness will not occur. It is the fear of losing form that will often prompt a rider to train hard again too soon and before full recovery has taken place let along allowing time for overcompensation to take place. To get over this fear objective methods of monitoring recovery are required.
Before we look at these issues lets first have a closer look at Fatigue :

What is fatigue ?
• An inability to maintain performance.
• Body is damaged, various systems are disturbed
• Fatigue can be minor or severe.
• Fatigue is broadly proportional to load severity
• Fatigue results from both intensity and duration
• Very intense training and exceptionally long
training or racing cause major fatigue.
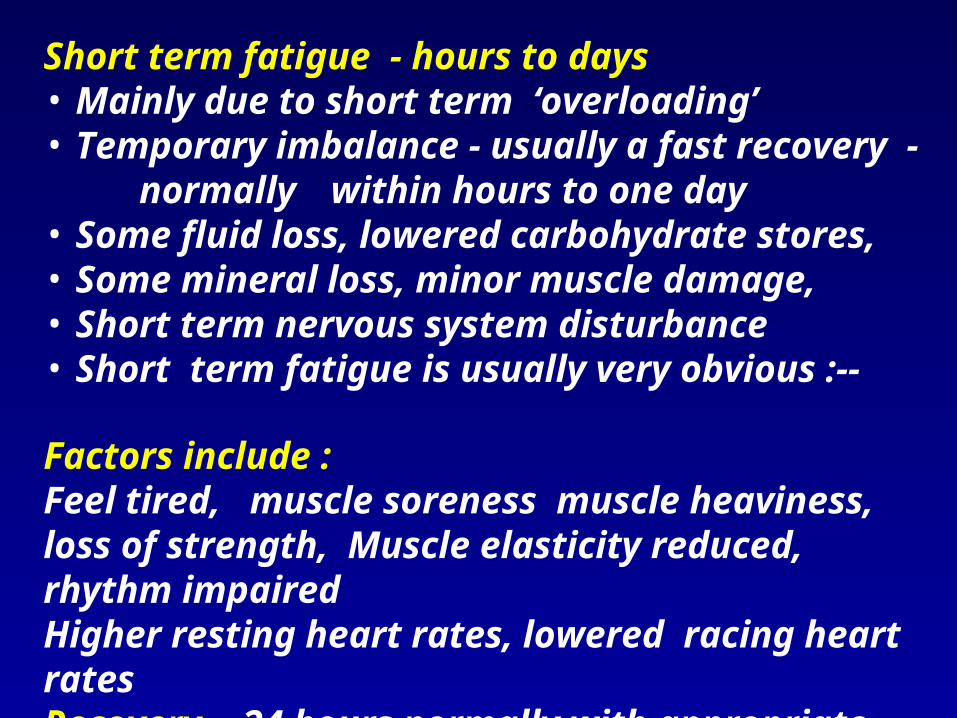
Short term fatigue - hours to days • Mainly due to short term ‘overloading’ • Temporary imbalance - usually a fast recovery - normally within hours to one day • Some fluid loss, lowered carbohydrate stores, • Some mineral loss, minor muscle damage, • Short term nervous system disturbance• Short term fatigue is usually very obvious :--
Factors include :Feel tired, muscle soreness muscle heaviness, loss of strength, Muscle elasticity reduced, rhythm impairedHigher resting heart rates, lowered racing heart ratesRecovery - 24 hours normally with appropriate action

Medium to Longer term fatigue - days to a week +
• More serious mainly due to persistent over-loading – termed ‘Over-reaching’. • Serious glycogen depletion • Major muscle cell damage • Hormonal disturbance • Serious nervous system disturbance. • Seriously reduced energy substrates
Recovery - Days if no further racing or hard training Results from many successive training and racing bouts
with inadequate rest days in the programme – But one masssive overload can start the process

More Serious Longer term fatigue - weeks to months • The effects often less obvious than shorter term fatigue • Its more insidious - it can build up slowly without you realizing it - the end result -serious overtraining• It can take many weeks even months to recover from serious overtraining • Results from - serious and relentless ‘over-reaching’
Some indicators: • Low unexplained performance, mood state changes, • Irritable, withdrawn, excitable, night sweats, loss of • Motivation, restlessness, aggressiveness• Diagnosis can be difficult – hormone changes in blood stream, but not practical for the club cyclist Recovery - can be weeks, months in serious cases

Why is recovery importantFull Performance capability is restored ONLY when fully recovered. As previously seen further recovery time leads to increased performance due to ‘over compensation’ -a ‘rebound effect’ occurs if you have the nerve to wait long enough !
Fatigue Recovery Overcompensation -
the ‘Rebound Effect’
Similar ‘fatigue -recovery -rebound’ cycles are occurring all the time

Stagnation
Slow decline
Cycles to avoid
Not allowing overcompensation to take place
Always training hard too soon

The ideal outcome
A gradual progression upwards

Multiple Recovery periods
Does all the foregoing mean you have to fully recovery after every training session ?
The answer is not necessarily. There are times in training when it makes sense to have several quality training session in quick succession. So full recovery is not possible until the sequence is over, BUT then full recovery MUST be allowed to take place.
At other times full recovery from a single massive event overload may be very necessary before you can move on. Such overloads might for example be a 12 hour TT , Etape du Tour, or other very hard sportive

Recovery time is related to
• Age, fitness and genetics
• General health status
• Sleep quality and sleeping patterns
• General training load
• Training and race patterns -recovery days, easy weeks
• Nutritional habits and status –adequate nutrient intake
• Life style, social and work life- stress, + lifes demands
All these factors help or hinder recovery

Inadequate Recovery - Some vulnerable groups
Young riders - too much too soon – not durable
until maturity
Mature highly motivated riders - inadequate rest -
don’t know when to stop
Older riders - age related deterioration in recovery
its inevitable but can be slowed down
Come back riders - trying to run before they can walk
Come back from injury or ill health
- you can’t rush things

Recovery Strategies – can be based on :
• Regular Sleep and active rest – frequent recovery rides
• Nutritional support – need good eating habits
• Massage - can be self or professionally applied
• Hydrotherapy techniques – hot and cold methods
• Timed rest and recovery periods – using periodisation
• Need a Controlled lifestyle – maybe re-engineering
• Monitoring fatigue and Recovery by various methods

The Early Recovery Period is improved by :
Good Re-hydration with micro nutrients
Carbohydrate intake – 60 to 100 grms in 750 mls water
Protein intake - 1/2 grm per kg of body weight
Immediately following racing and training
There is a two hour window of opportunity to replenish glycogen stores and start the process of muscle protein re -synthesis - so use this opportunity to speed recovery
After this time the process slows down considerably – so you need to get the carbs down as a matter of priority

Research has shown recovery is improved by :
A good protein source immediately after hard training and racing BUT also some protein intake
in amino acid form - during the racing and hard training periods
Protein is a key factor in recovery from hard training and racing
Protein sources are appearing more and more in sports drinks

Eaten protein
Proteins in food are large complex molecules
But they can not be used for tissue repair until they have been broken down in the stomach into smaller
units called Amino Acids
These units then have to be recombined in the liver and other organs into the
precise protein structure required to repair various parts of the muscles that have been broken down and damaged during
training and racing

Eaten protein
Amino acids
A new protein
For tissue repair
Digestion Synthesis

Protein Synthesis
The process shown on the previous slide takes some time for completion - certainly several hours at least
So it makes sense to get the protein into your body as soon as possible after racing and hard training
Better still use recovery drinks that have amino acids in them to speed up the tissue repair even faster as you miss out one stage. A Company called ‘All Sports’ have a product called ‘Amino Load’ for this very purpose. ‘CytoMax’ contains some amino acids
Remember the faster you make a full recovery the sooner you can get back to quality training.

Energy Drink support to recovery
Many products now on offer
Some offer just ‘glucose polymers’ based on Maltodextrin -Maxim was the original
Many now provide ‘add-ins’ minerals, vitamins and some protein as whey or soya protein or ‘free’ amino acids

Glucose polymer
Minerals - Sodium and Potassium
Some Amino Acids
Before during and after training and racing
Good for warm weather training and racing
Glucose polymers, Fructose
Plus plenty of Minerals

Slow release protein source. Night time recovery - Really ONLY for high performing
riders
REGO Rapid
High Quality protein Good after training and racing recovery product
REGO Nocte

Is it essential to buy sports drinks ?
They are certainly of significant value but are relatively costly
If you are a high performer and aspiring to make big improvements then for periods of HEAVY
training and racing the investment is almost certainly worthwhile
But don’t ignore the cheaper and nearly as effective alternatives

One 110 gram banana (without skin) 25 grams carbohydrate
1.O to 1.5 grams protein
2.7 grams of fibre plus vitamin C and Potassium
200 grams yoghurt
9 grams of protein
18 grams of carbohydrate
Plus sodium and vitamins
One yoghurt + one banana - cost about 50 pence

100 grams serving costs around £1.50
100 grams provides :
26 grams of protein
58 grams of carbohydrate
Fibre 4.9 grams
Plus full range of minerals plus vitamins

Some healthy meal options
Rice Fruit and vegetables
various beans plus salad
Chicken plus vegetables plus salad

Don’t even go there !

Ideal meals – pasta based - for the 100 or 12 hour TT or other major endurance events

Micro nutrient support Forget the RDA (recommended dietary allowance) - that’s for normal people
Endurance athletes needs are much greater
During periods of heavy training and racing you need additional micronutrients – vitamins and minerals :-
High dose formulations

Some take home points so far
Think more about what you eat and when you eat it
Mixed Carbs (simple & complex) immediately after training and racing is essential
Need Protein or Amino acids in the 2 hour window
Need extra micro nutrients during hard training periods
Early Re-hydration essential after all training and racing sessions
Massage optional – useful if done on a regular basis
Hold cold baths worth thinking about – to reduce inflammation
and help flush out debris from damaged tissue
Regular sleep essential - find our what is good for you.
Frequent Active Rest and recovery days are essential

Monitoring recovery
Early Stage Recovery is often very obvious and you do not need anything very sophisticated to tell you that you are tired - your legs soon tell you.
Late Stage Recovery is far more complex. Think about it – when you are almost fully recovered you will feel OK to good and you will want to train again. But you may not have reached the overcompensation stage ! The fact is going on feel alone will not tell you where you are in the Late Recovery Period
This is where sophisticated heart rate monitoring can play a very big role

Monitoring Recovery - What can be done ?
General day by day feel - How do I feel today approach
If in doubt - rest for a day – OK for Early Stage
Watch resting heart rates - if 8 beats up –maybe tired
if elevated over several days then rest
Racing and Training Heart rates – if lower than normal
it may be an early sign of medium term fatigue
Use of Orthostatic Heart Rate Tests – can give deep insight into recovery processes at all stages

Advanced Heart Rate Monitoring
New tools and techniques are emerging that can be used to track recovery and give a deeper insight into fatigue and recovery in the recovery cycle.
The remainder of these notes focuses on Orthostatic Heart rate tests and heart rate variability methods (HRV). HRV is a new and emerging science as far as sport is concerned and it offers some significant insights into fatigue and recovery.

The Ortho static Heart Rate Test
The Orthostatic Heart rate test is a simple test which can give some valuable insights to fatigue and recovery.
The basis interpretation of the results on a day to day basis are straightforward, but more advanced interpretation is more difficult and it does need some experience -speak to me for advice
The test is undertaken by recording the heart rate in the lying position (supine) for between 2 and 4 minutes. You then stand up and continue recording the heart rate for another 2 to 4 minutes. Your breathing rate must be controlled and regular throughout the test.
Assuming you are using a Polar heart rate monitor download the data to your PC and the Polar software will display the typical Orthostatic heart rate profile as shown on the pages which follow

32
36
40
44
48
52
56
60
64
68
72
76
80
84
88
92
0 20 40 60 80 100 120 140 160 180 200 220 240 260
A typical Orthostatic Heart rate profile
A well rested profile of a high performing rider

32
36
40
44
48
52
56
60
64
68
72
76
80
84
88
92
0 20 40 60 80 100 120 140 160 180 200 220 240 260
Parasympathetic drive
Sympathetic drive Resting heart rate laying down
Heart rate after standing up

32
36
40
44
48
52
56
60
64
68
72
76
80
84
88
92
0 20 40 60 80 100 120 140 160 180 200 220 240 260
Parasympathetic dominance
Sympathetic
dominance
Sympathetic system snaps into action

The Central Nervous SystemThe Orthostatic Heart rate profile is determined by the central nervous system (CNS) – more specifically the autonomic division of the CNS.
There are two parts to the CNS - parasympathetic which slows the heart rate and the sympathetic which speeds it up. These two are always balancing each other. Lay down the parasympathetic is more dominant. Stand up and the sympathetic part becomes more dominant.
Fatigue from racing and training shows up as a serious disturbance to the CNS and the shape of the Orthostatic profile changes as a result. But training affects the parasympathetic and sympathetic parts of the CNS differently and each part recovers at a different rate. The return to a normal orthostatic profile when full recovery has taken place will often reveal these changes.

32
36
40
44
48
52
56
60
64
68
72
76
80
84
88
92
0 20 40 60 80 100 120 140 160 180 200 220 240 260
Good resting HR with some irregularity
Climb to a new stable balance –
the oscillations are normal
A nice sharp spike upwards
as you stand up
What to look for in the Ortho Static profile
A quick drop and bottom
out

36
40
44
48
52
56
60
64
68
72
76
80
84
88
92
96
0 20 40 60 80 100 120 140 160 180 200 220 240 260
Example Ortho test when very tired from endurance training
Shows heavy fatigue in this component – climbing and
unstable
Abnormally low spike - no real drop
afterwards
32
36
40
44
48
52
56
60
64
68
72
76
80
84
88
92
0 50 100 150 200 250 300
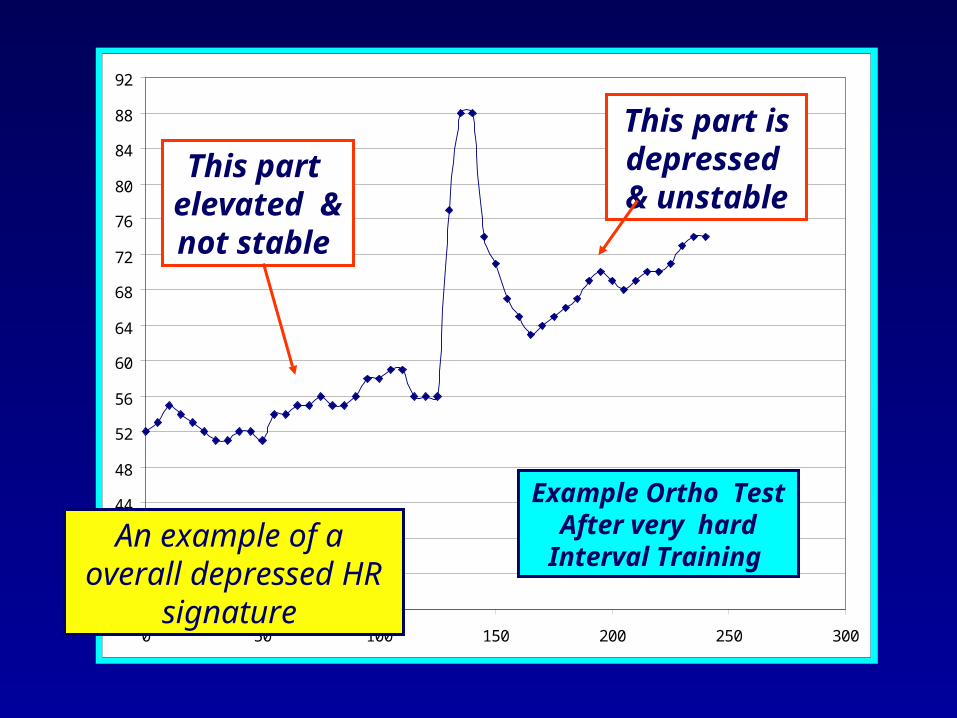
Rusko Example Ortho Test
After very hard Interval Training
This part elevated & not stable
This part is depressed &
unstable
An example of a overall depressed HR signature

World TT Championship 2003
’25’ Mile TT Championships 2004

6th January 5 day Training Camp - Blue Mountains - Australia
Day 1 - 3hours hard endurance riding
Day 2 and 3 four to five hours endurance riding
Day 4 one hour Mountain Time Trial
Day 5 another 4 hours but steady
Overall - a severe training overload
This case study demonstrates just how long it can take to achieve full recovery. Riding during each recovery day amounted to one hour at an easy pace. Recovery day by day was tracked using Orthostatic tests as shown :-

30
34
38
42
46
50
54
58
62
66
70
74
78
82
86
90
0 25 50 75 100 125 150 175 200 225 250 275
Day before going on the
training Camp

30
34
38
42
46
50
54
58
62
66
70
74
78
82
86
90
0 25 50 75 100 125 150 175 200 225 250 275
Recovery day 1
First day back after training Camp

30
34
38
42
46
50
54
58
62
66
70
74
78
82
86
90
0 25 50 75 100 125 150 175 200 225 250 275
Pre Camp
Day 1 Recovery

30
34
38
42
46
50
54
58
62
66
70
74
78
82
86
90
0 25 50 75 100 125 150 175 200 225 250 275
Recovery day 2
Recovery day 1

30
34
38
42
46
50
54
58
62
66
70
74
78
82
86
90
0 25 50 75 100 125 150 175 200 225 250 275

30
34
38
42
46
50
54
58
62
66
70
74
78
82
86
90
0 25 50 75 100 125 150 175 200 225 250 275
Recovery day 3

30
34
38
42
46
50
54
58
62
66
70
74
78
82
86
90
0 25 50 75 100 125 150 175 200 225 250 275

30
34
38
42
46
50
54
58
62
66
70
74
78
82
86
90
0 25 50 75 100 125 150 175 200 225 250 275
Recovery day 4

30
34
38
42
46
50
54
58
62
66
70
74
78
82
86
90
0 25 50 75 100 125 150 175 200 225 250 275
Abnormally low resting HR

30
34
38
42
46
50
54
58
62
66
70
74
78
82
86
90
0 25 50 75 100 125 150 175 200 225 250 275
Recovery day 5

30
34
38
42
46
50
54
58
62
66
70
74
78
82
86
90
0 25 50 75 100 125 150 175 200 225 250 275

30
34
38
42
46
50
54
58
62
66
70
74
78
82
86
90
0 25 50 75 100 125 150 175 200 225 250 275

30
34
38
42
46
50
54
58
62
66
70
74
78
82
86
0 25 50 75 100 125 150 175 200 225 250 275
Day 5 compared
to pre camp

Took 5 days !
Fatigue
Recovery
Rebound effect
Train Fatigue Recovery Cycle
Late stage recovery period

It took a full five days to fully recover from the Training Camp !
Any hard training in that five period would have only delayed
the recovery process

What if my monitor has no memory, can I do Ortho tests you may ask. The answer is yes :-
30
34
38
42
46
50
54
58
62
66
70
74
78
82
86
90
0 25 50 75 100 125 150 175 200 225 250 275
Observe the average heart rates supine and standing
Note the peak HR

Record the following data - day by day :
30
34
3842
4650
5458
6266
7074
7882
8690
0 25 50 75 100 125 150 175 200 225 250 275
Supine =
Peak =
Standing =
Difference (standing – supine) =
Record values : Get to know your own values when
you are fully recovered and
have no fatigue at all

Case Number 2
Elite woman rider
Orthostatic profiles after a successful 3 day 4 stage road race - 2nd Overall and winner of the TT stage.

Friday 28th April - Before RR
30
40
50
60
70
80
90
100
0 20 40 60
Rested Ortho chart

30
40
50
60
70
80
90
0 20 40 60
Tues 2nd May day after 3 day Road race - many fatigue
pointers
Lazy spike indicates lack of sympathetic
tone
Continually rising slowly = poor
sympathetic recovery
A bit too flat indicates likely reduced R to R HR variability
Overall a very depressed Heart Rate signature
Dropped too low Shows lack of
sympathetic tone

30
40
50
60
70
80
90
100
0 10 20 30 40 50 60
Wednesday 3rd May 2 days after race
Rather flat here – delayed fatigue still coming out
Too much regularity here Shows lack of nervous system tone
Spike up much improved
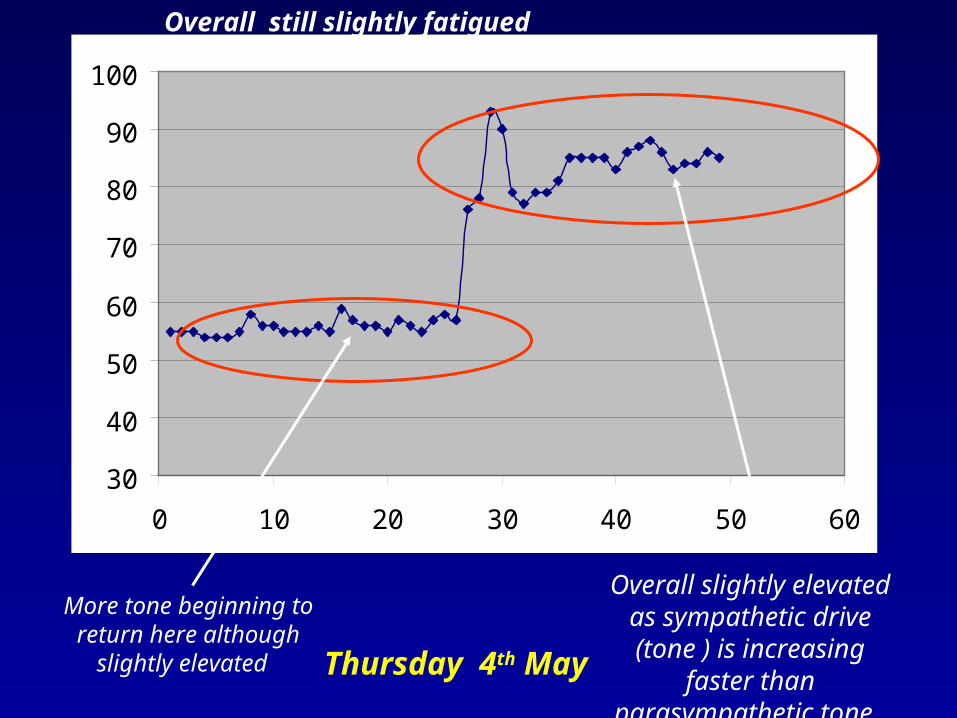
Thursday 4th May
30
40
50
60
70
80
90
100
0 10 20 30 40 50 60
More tone beginning to return here although
slightly elevated
Overall slightly elevated as sympathetic drive (tone ) is increasing faster than
parasympathetic tone
Overall still slightly fatigued

30
40
50
60
70
80
90
100
0 10 20 30 40 50 60
Friday 5th May - 4 days after Race
Looking much better here and probably close to normal
A bit flat here parasympathetic drive still struggling to get
back to normal
Overall a much better picture
30
40
50
60
70
80
90
100
110
0 20 40 60
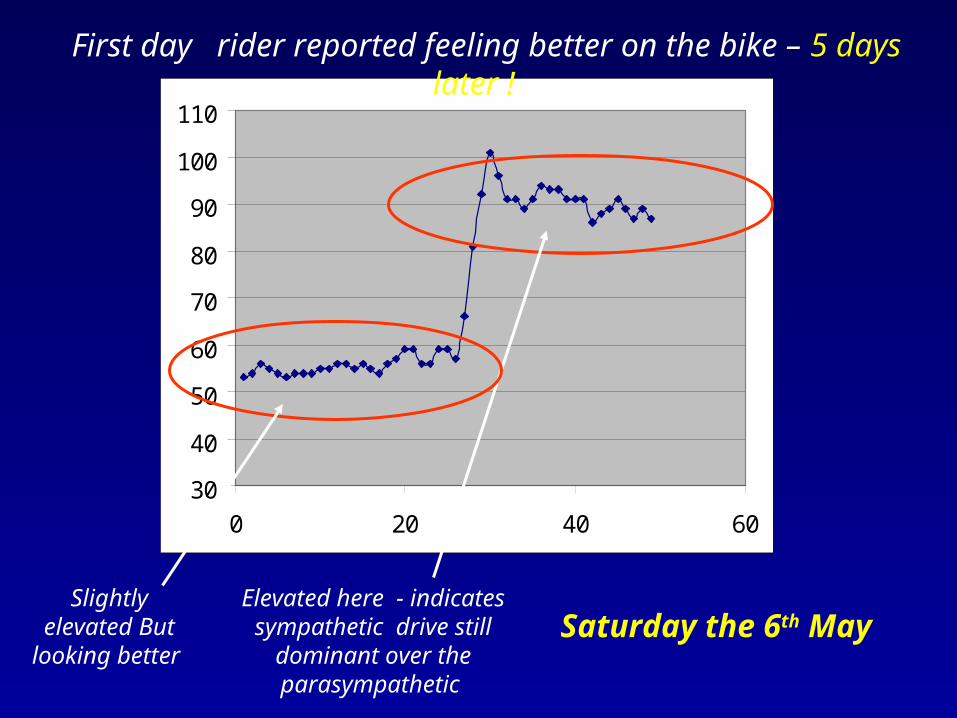
Saturday the 6th May Elevated here - indicates
sympathetic drive still dominant over the parasympathetic
Slightly elevated But looking
better
First day rider reported feeling better on the bike – 5 days later !

32
36
40
44
48
52
56
60
64
68
72
76
80
84
88
92
0 50 100 150 200 250 300
Wednesday 8th March Indifference Chart. Not fully obvious if fatigue is
shown here or not !
So where do we go from here ? Look at Heart Rate Variability
Data as the next level of analysis

Measuring Heart Rate Variability
The next level of analysis in heart rate monitoring of fatigue and recovery is to measure the heart rate variability. This is done by recording the time between one heat beat and the next - called R to R data recording. R to R is the time difference in milliseconds between R waves from an ECG trace.
A typical ECG trace is shown on the next page
These methods take a little while to prepare each day so you will need some motivation and a strong interest to spend the necessary time needed

Typical ECG trace
QRS Complex The ‘R’ wave
R1 R2 R3
ONE BEAT
NEXT BEAT ETC
To undertake R to R heart rate recording you need a Polar S810i or Suunto T6 heart rate monitor
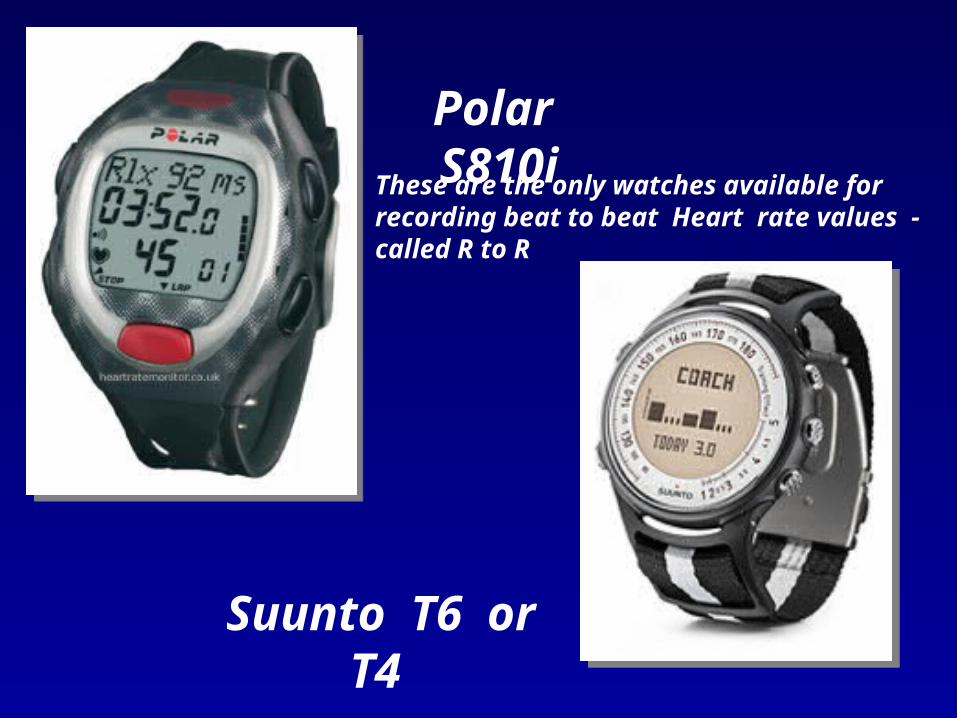
Polar S810i
Suunto T6 or T4
These are the only watches available for recording beat to beat Heart rate values - called R to R

Typical ECG trace
R1 R2 R3
R to R
R to R values can be captured by the Polar S810i or Suunto T6 heart rate monitors

R1 R2 R3
R to R
The more variable the R to R values in an athlete the more conditioned is that athlete
A fatigued athlete has low RR variability a recovered athlete has high RR variability
Therefore heart rate variability using RtoR values can be used to track recovery

ECG Trace with High Variability
ECG Trace with Low Variability
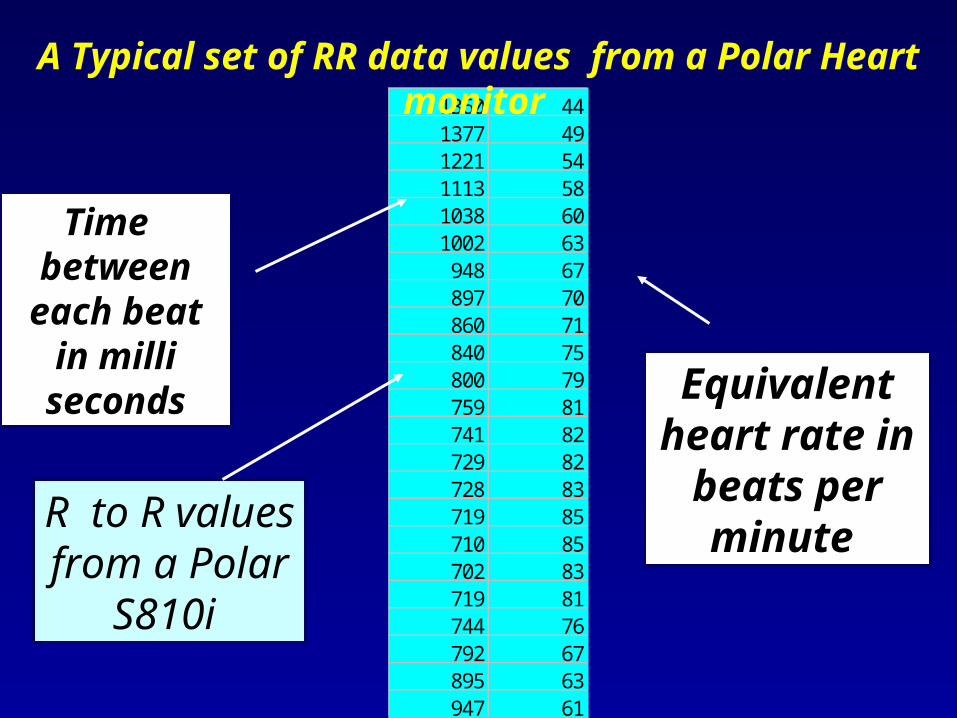
1360 441377 491221 541113 581038 601002 63948 67897 70860 71840 75800 79759 81741 82729 82728 83719 85710 85702 83719 81744 76792 67895 63947 61
Time between each beat in milli
secondsEquivalent
heart rate in beats per minute
R to R values from a Polar
S810i
A Typical set of RR data values from a Polar Heart monitor

There are a number of methods of measuring Heart rate variability
One is the ‘Poincare Plot’ method
This is undertaken by plotting a sequence of RR data values against itself but slipped by one place as shown next

RR RRn+1
1360 1377
1377 1221
1221 1113
1113 1038
1038 1002
1002 948
948 897
897 860
860 840
840 800
800 759
759 741
741 729
729 728
728 719
719 710
710 702
702 719
719 744
744 792
792 895
895 947
947 899
Plot RR values
against
RR n+1 values
600
700
800
900
1000
1100
1200
600 700 800 900 1000 1100 1200
ms
ms
Person
Exercise
Note
Selection
Date
Time
SD 2
SD 1
Gordon Wright
Margaret Ortho test
0:00:01 - 0:07:01 (0:07:01.3)
11:41:13
25/02/2006
125.1 ms
53.2 ms
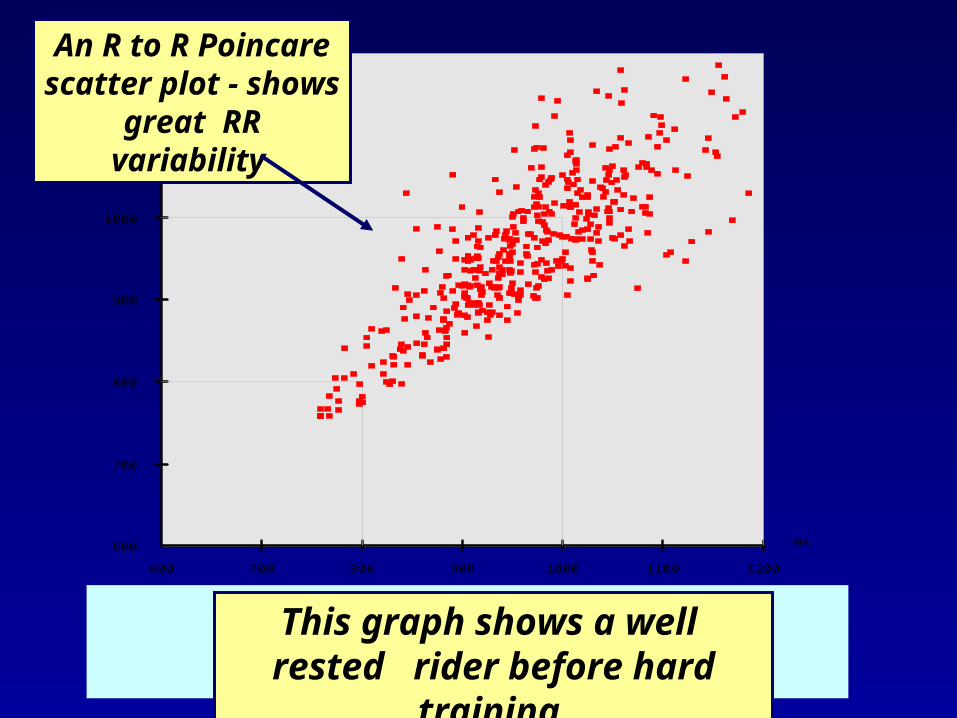
An R to R Poincare scatter plot - shows
great RR variability
This graph shows a well rested rider before hard training

600
700
800
900
1000
1100
1200
600 700 800 900 1000 1100 1200
ms
ms
Person
Exercise
Note
Selection
Date
Time
SD 2
SD 1
Gordon Wright
Margaret Ortho test
0:00:01 - 0:07:01 (0:07:01.3)
11:41:13
25/02/2006
125.1 ms
53.2 ms
Measures SD1
Measures SD2
Polar S810i will produce this scatter plot and calculate the variability by the standard
deviation scores SD1 and SD2
These values are measures of variability

600
700
800
900
1000
1100
1200
600 700 800 900 1000 1100 1200
ms
ms
Person
Exercise
Note
Selection
Date
Time
SD 2
SD 1
Gordon Wright
Margaret Ortho test 2
0:00:00 - 0:07:00 (0:07:00.0)
13:50:59
25/02/2006
69.8 ms
23.6 ms
Graph of same rider after hard training
Note the marked reduction in SD1 and SD2 values
The Variability in RR data is now markedly reduced and shows the
fatigue in the rider

600
700
800
900
1000
1100
1200
600 700 800 900 1000 1100 1200
ms
ms
Person
Exercise
Note
Selection
Date
Time
SD 2
SD 1
Gordon Wright
Margaret Ortho test 2
0:00:00 - 0:07:00 (0:07:00.0)
13:50:59
25/02/2006
69.8 ms
23.6 ms
This rider is arguably not ready for the next hard session until SD1 and SD2 values
have returned to resting levels
That is until RR variability has normalised
Heart rate variability is now much reduced

600
700
800
900
1000
1100
1200
600 700 800 900 1000 1100 1200
ms
ms
Person
ExerciseNote
Selection
Date
Time
SD 2
SD 1
Gordon Wright
25/07/2006 08:12
0:00:01 - 0:09:37 (0:09:37.1)
08:12:45
25/07/2006
129.8 ms
34.0 msPoincare plot am on the day of a 10 mile TT

600
700
800
900
1000
1100
1200
600 700 800 900 1000 1100 1200
ms
ms
Person
ExerciseNote
Selection
Date
Time
SD 2
SD 1
Gordon Wright
25/07/2006 22:04
0:00:00 - 0:08:30 (0:08:30.5)
22:04:49
25/07/2006
70.8 ms
20.6 msPoincare Plot 3 hours after the ten mile TT

600
700
800
900
1000
1100
1200
600 700 800 900 1000 1100 1200
ms
ms
Person
ExerciseNote
Selection
Date
Time
SD 2
SD 1
Gordon Wright
26/07/2006 08:20
0:00:00 - 0:10:39 (0:10:39.9)
08:20:27
26/07/2006
70.0 ms
24.9 ms
Morning after the 10 mile TT
Much recovered but still not back to normal

Tracking Data
You don’t need to do RR data analysis and Poincare heart rate graphs to show that you are fatigued the day after a time trial – you will know that by feel alone
But if the analysis is undertaken over many days you can track recovery from much harder races and much greater training loads
A more objective and visual method of tracking recovery is available using ‘Poincare Plot analysis’ and it is especially important in the late recovery period.

Using heart rate variability gives deep insight into fatigue and recovery and provides an
objective method of knowing when full recovery has taken place. Therefore it is a valuable tool in the late recovery period.
Much of the guess work is removed
But it’s a complex area that’s advancing all the time

That’s all folks for the time being !