Methods in Comparative Genomics: Genome Correspondence, Gene Identification and Regulatory
37
JOURNAL OF COMPUTATIONAL BIOLOGY Volume 11, Numbers 2–3, 2004 © Mary Ann Liebert, Inc. Pp. 319–355 Methods in Comparative Genomics: Genome Correspondence, Gene Identification and Regulatory Motif Discovery MANOLIS KELLIS, 1,2 NICK PATTERSON, 1 BRUCE BIRREN, 1 BONNIE BERGER, 2,3,5 and ERIC S. LANDER 1,4,5 ABSTRACT In Kellis et al. (2003), we reported the genome sequences of S. paradoxus, S. mikatae, and S. bayanus and compared these three yeast species to their close relative, S. cerevisiae. Genomewide comparative analysis allowed the identification of functionally important se- quences, both coding and noncoding. In this companion paper we describe the mathematical and algorithmic results underpinning the analysis of these genomes. (1) We present methods for the automatic determination of genome correspondence. The algorithms enabled the au- tomatic identification of orthologs for more than 90% of genes and intergenic regions across the four species despite the large number of duplicated genes in the yeast genome. The re- maining ambiguities in the gene correspondence revealed recent gene family expansions in regions of rapid genomic change. (2) We present methods for the identification of protein- coding genes based on their patterns of nucleotide conservation across related species. We observed the pressure to conserve the reading frame of functional proteins and developed a test for gene identification with high sensitivity and specificity. We used this test to revisit the genome of S. cerevisiae, reducing the overall gene count by 500 genes (10% of previ- ously annotated genes) and refining the gene structure of hundreds of genes. (3) We present novel methods for the systematic de novo identification of regulatory motifs. The methods do not rely on previous knowledge of gene function and in that way differ from the current literature on computational motif discovery. Based on genomewide conservation patterns of known motifs, we developed three conservation criteria that we used to discover novel mo- tifs. We used an enumeration approach to select strongly conserved motif cores, which we extended and collapsed into a small number of candidate regulatory motifs. These include most previously known regulatory motifs as well as several noteworthy novel motifs. The majority of discovered motifs are enriched in functionally related genes, allowing us to infer a candidate function for novel motifs. Our results demonstrate the power of comparative 1 Whitehead Institute Center for Genome Research, MIT, Cambridge, MA 02139. 2 Computer Science and Artificial Intelligence Laboratory, MIT, Cambridge, MA 02139. 3 Department of Mathematics, MIT, Cambridge, MA 02139. 4 Department of Biology, MIT, Cambridge, MA 02139. 5 Corresponding author. 319
Transcript of Methods in Comparative Genomics: Genome Correspondence, Gene Identification and Regulatory
JOURNAL OF COMPUTATIONAL BIOLOGYVolume 11, Numbers 2–3, 2004© Mary Ann Liebert, Inc.Pp. 319–355
Methods in Comparative Genomics:Genome Correspondence, Gene Identification and
Regulatory Motif Discovery
MANOLIS KELLIS,1,2 NICK PATTERSON,1 BRUCE BIRREN,1
BONNIE BERGER,2,3,5 and ERIC S. LANDER1,4,5
ABSTRACT
In Kellis et al. (2003), we reported the genome sequences of S. paradoxus, S. mikatae, andS. bayanus and compared these three yeast species to their close relative, S. cerevisiae.Genomewide comparative analysis allowed the identification of functionally important se-quences, both coding and noncoding. In this companion paper we describe the mathematicaland algorithmic results underpinning the analysis of these genomes. (1) We present methodsfor the automatic determination of genome correspondence. The algorithms enabled the au-tomatic identification of orthologs for more than 90% of genes and intergenic regions acrossthe four species despite the large number of duplicated genes in the yeast genome. The re-maining ambiguities in the gene correspondence revealed recent gene family expansions inregions of rapid genomic change. (2) We present methods for the identification of protein-coding genes based on their patterns of nucleotide conservation across related species. Weobserved the pressure to conserve the reading frame of functional proteins and developeda test for gene identification with high sensitivity and specificity. We used this test to revisitthe genome of S. cerevisiae, reducing the overall gene count by 500 genes (10% of previ-ously annotated genes) and refining the gene structure of hundreds of genes. (3) We presentnovel methods for the systematic de novo identification of regulatory motifs. The methodsdo not rely on previous knowledge of gene function and in that way differ from the currentliterature on computational motif discovery. Based on genomewide conservation patterns ofknown motifs, we developed three conservation criteria that we used to discover novel mo-tifs. We used an enumeration approach to select strongly conserved motif cores, which weextended and collapsed into a small number of candidate regulatory motifs. These includemost previously known regulatory motifs as well as several noteworthy novel motifs. Themajority of discovered motifs are enriched in functionally related genes, allowing us to infera candidate function for novel motifs. Our results demonstrate the power of comparative
1Whitehead Institute Center for Genome Research, MIT, Cambridge, MA 02139.2Computer Science and Artificial Intelligence Laboratory, MIT, Cambridge, MA 02139.3Department of Mathematics, MIT, Cambridge, MA 02139.4Department of Biology, MIT, Cambridge, MA 02139.5Corresponding author.
319
320 KELLIS ET AL.
genomics to further our understanding of any species. Our methods are validated by theextensive experimental knowledge in yeast and will be invaluable in the study of complexgenomes like that of the human.
Key words: comparative genomics, computational biology, yeast, Saccharomyces cerevisiae,genome alignment, gene finding, gene identification, gene regulation, regulatory motifs, motifdiscovery.
INTRODUCTION
With the availability of complete sequences for a number of organisms, comparative analysisbecomes an invaluable tool for understanding genomes. Complete genomes allow for global views,
and multiple genomes increase predictive power.In Kellis et al. (2003) we used a comparative genomics approach to systematically discover the full
set of conserved genes and regulatory elements in yeast. We sequenced and assembled three novel yeastspecies, S. paradoxus, S. mikatae, and S. bayanus and compared them to their close relative, S. cerevisiae.The work represented the first genomewide comparison of four complete eukaryotic genomes. This paperfocuses on the computational algorithms or techniques or methods underpinning the work.We first describe our methods for resolving the genome correspondence between each of the newly
sequenced species and S. cerevisiae to identify orthologous regions. The method presented here was usedfor the automatic alignment of the three newly sequenced species and correctly identified unambiguousorthologs for more than 90% of known protein coding genes. It also identified the evolutionary events thatseparate the four species, discerning segmental duplications and gene loss, while correctly resolving genesthat duplicated before the divergence of the species compared.We then describe our methods for gene identification. We observed that in protein-coding genes, in-
sertions and deletions locally compensate for each other, thus preserving the reading frame of aminoacid translation. We quantified these properties by evaluating the reading frame conservation (RFC) innucleotide alignments across related species. Based on the metric for frame conservation, we developeda test to accept or reject open reading frames (ORFs) as biologically meaningful or not. The test showedstrong sensitivity and specificity and allowed us to revisit the genome of S. cerevisiae, reducing the overallgene count by 500 genes (10% of previously annotated genes) and refining the gene structure of hundredsof genes.We finally describe our methods to identify regulatory elements based on their conservation patterns
across all intergenic regions and the complete genome. The regulatory motif discovery methods presentedhere do not rely on previous knowledge of functionally related gene sets and in that way differ fromthe current literature on computational motif discovery. Based on genomewide conservation patterns ofknown motifs, we developed three conservation criteria that we used to discover novel motifs. We usedan enumeration approach to select strongly conserved motif cores, which we extended and collapsed intoa small number of candidate regulatory motifs. The motifs discovered include most previously publishedregulatory motifs and a number of noteworthy novel motifs. These show enrichment in functionally relatedgene sets, enabling us to assign candidate functions to novel motifs.The extensive knowledge of gene function in yeast has enabled us to validate the power of our methods
for discovering biological signals in closely related genomes by virtue of their conservation. The methodspresented are general and should be applicable to any species, given an appropriate set of related genomesfor comparative analysis. In particular, applying such comparative methods will be invaluable in the un-derstanding of the human genome, but presents numerous challenges in extracting signal from noise, giventhe increased genome size and complexity, both in gene content and regulatory complexity.
1. GENOME CORRESPONDENCE
The first step in comparative genomics is determining the correct correspondence of chromosomalsegments and functional elements across the species compared. This involves determining orthologous
METHODS IN COMPARATIVE GENOMICS 321
segments of DNA that descend from the same region in the common ancestor of the species compared andparalogous regions that arose by duplication events prior to the divergence of the species compared. Themapping of regions across two genomes can be one-to-one in absence of duplication events, one-to-manyif a region has undergone duplication or loss in one of the species, or many-to-many if duplication/lossevents have occurred in both lineages.Understanding the ancestry of the functional elements compared is central to our understanding and the
applications of genome comparison. Most comparative methods have focused on one-to-one orthologousregions, but it is equally important to recognize which segments have undergone duplication events andwhich segments were lost since the divergence of the species. Comparing segments that arose before thedivergence of the species may result in the wrong interpretations of sequence conservation and divergence.Further, in the presence of gene duplication, some of the evolutionary constraints that a region is underare relieved, and uniform models of evolution no longer capture the underlying selection for these sites.Thus, our methods for determining gene correspondence should account for duplication and loss eventsand ensure that the segments we compare are orthologous.We used genes as discrete genomic anchors in order to align and compare the species. We constructed
a bipartite graph connecting annotated protein-coding genes in S. cerevisiae with predicted protein-codinggenes in each of the other species based on sequence similarity at the amino acid level. This bipartitegraph contains the orthologous matches but also contains spurious matches due to shared domains betweenproteins of similar functions and gene duplication events that precede the divergence of the species.We developed an algorithm for resolving the correspondence of genes across the four species and
recognizing orthologous and paralogous genes. The algorithm presented has a number of attractive features.It uses a simple and intuitive graph theoretic framework that makes it easy to incorporate additionalheuristics or knowledge about the genes at hand. It represents matches between sets of genes instead ofonly one-to-one matches, thus dealing with duplication and loss events in a straightforward way. It usesthe additional information of the chromosomal positions of the compared genes, detecting stretches ofconserved gene order and using these to resolve additional orthologous matches. It accounts for all genescompared, resolving unambiguous matches instead of simply best matches, thus ensuring that all geneswith one-to-one correspondence are true orthologs. It works at a wide range of evolutionary distances andcan cope with unfinished genomes containing sequence gaps even within genes.
1.1. Establishing gene correspondence
Previously described algorithms for comparing gene sets have been widely used for various purposes,but they are not applicable to the problem at hand.Best Bidirectional Hits (BBH) (Fitch, 1970, 1995) identifies gene pairs that are best matches of each
other and marks them as orthologous. In the case of a recent gene duplication, however, only one of theduplicated genes will be marked as the ortholog without signaling the presence of additional homologs.Thus, no guarantees are given that best bidirectional matches will represent orthologous relations andincorrect one-to-one matches may be established.Clusters of Orthologous Genes (COG) (Tatusov et al., 1997, 2001) goes a step further and matches
groups of genes to groups of genes. Unfortunately, the grouping is too coarse, and clusters of orthologousgenes typically correspond to gene families that may have expanded before the divergence of the speciescompared. This inability to distinguish recent duplication events from more ancient duplication eventsmakes it inapplicable in this case, since the genome of S. cerevisiae contains hundreds of gene pairs thatwere anciently duplicated before the divergence of the species at hand (Wolfe and Shields, 1997). The COGmethod does not distinguish between copies of anciently duplicated genes, and hence many orthologousmatches would not be detected.We introduce the concept of a best unambiguous subset (BUS), namely, a group of genes such that all
best matches of any gene within the set are contained within the set and no best match of a gene outsidethe set is contained within the set. A BUS builds on both BBHs and COGs to resolve the correspondenceof genes across the species. The algorithm, at its core, represents the best match of every gene as a set ofgenes instead of a single best hit, which makes it more robust to slight differences in sequence similarity.A BUS can be isolated from the remainder of the bipartite gene correspondence graph while preservingall potentially orthologous matches. The BUS algorithm also allows a recursive application grouping the
322 KELLIS ET AL.
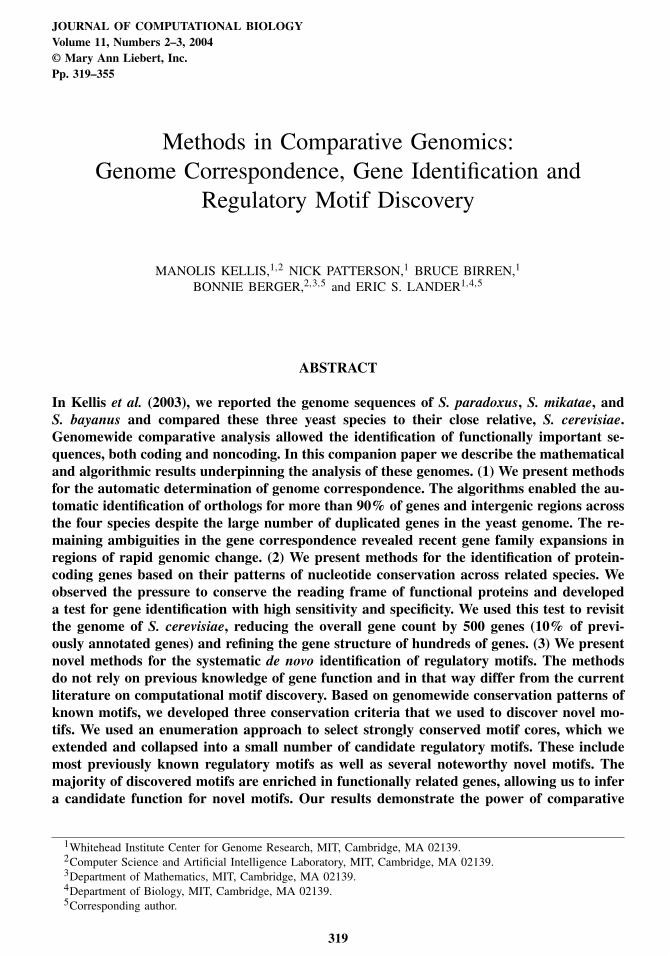
FIG. 1. Overview of graph separation. We constructed a bipartite graph based on the BLAST hits between genesA,B,C in one genome and genes 1,2,3 in a related genome. We considered both forward and reverse matches for near-optimality based on synteny and sequence similarity. Suboptimal matches were progressively eliminated simplifyingthe graph. We returned the connected components of the undirected simplified graph.
genes into progressively smaller subsets and retaining ambiguities until later in the pipeline when moreinformation becomes available. Such information includes the conserved gene order (synteny) betweenconsecutive one-to-one genes that allows the resolving of additional neighboring genes.
1.2. Overview of the algorithm
We formulated the problem of genomewide gene correspondence in a graph-theoretic framework. Werepresented the similarities between the genes as a bipartite graph connecting genes between two species(Fig. 1). We weighted every edge connecting two genes by both the amino acid sequence similarity betweenthe two genes and the overall length of the match.We separated this graph into progressively smaller subgraphs until the only remaining matches connected
true orthologs. To achieve this separation, we eliminated edges that are suboptimal in a series of steps.As a preprocessing step, we eliminated all edges that are less than 80% of the maximum-weight edgeboth in amino acid identity and in length (1.4). Based on the unambiguous matches that resulted from thisstep, we built blocks of conserved gene order (synteny blocks) when neighboring genes in one species hadone-to-one matches to neighboring genes in the other species; we used these blocks of conserved syntenyto resolve additional ambiguities by preferentially keeping matches within synteny blocks (1.5). We finallysearched for best unambiguous subsets (BUS), namely, subsets of genes that are locally optimal, such thatall best matches of genes within the group are contained within the group and no genes outside the grouphave matches within the group (1.6). These ensured that the bipartite graph is maximally separable, whilemaintaining all possibly orthologous relationships (1.7).When no further separation was possible, we returned the connected components of the final graph.
These contain the one-to-one orthologous pairs resolved, as well as a small number of homology groupscontaining sets of paralogous genes whose correspondence remained ambiguous.
1.3. Automatic annotation and graph construction
In this section, we describe the construction of the weighted bipartite graph G, representing the genecorrespondence across the species compared. We started with the genomic sequence of the species andthe publicly available gene catalogue of S. cerevisiae, namely, the start and stop coordinates of known andpredicted genes. We then predicted protein-coding genes for each newly sequenced genome. Finally, weconnected across each pair of species the genes that shared amino acid sequence similarity.The input to the algorithm is based on the complete genome for each species compared. For S. cere-
visiae, we used the public sequence available from the Saccharomyces Genome Database (SGD) at
METHODS IN COMPARATIVE GENOMICS 323
www.yeastgenome.org. SGD posts sixteen uninterrupted sequences, one for each chromosome. The se-quence was obtained by an international sequencing consortium and published in 1996. It was completedby a clone-based sequencing approach and directed sequence finishing to close all gaps. Subsequent tothe publication, updates to the original sequence have been incorporated in SGD based on resequencingof regions studied in labs around the world.The genome sequences of S. paradoxus, S. mikatae, and S. bayanus were obtained at the MIT/Whitehead
Institute Center for Genome Research. We used a whole-genome shotgun sequencing approach with paired-end sequence reads of 4 kb plasmid clones, with lab protocols as described at www.genome.wi.mit.edu. Weused ∼seven-fold redundant coverage; namely, every nucleotide in the genome was contained on averagein at least seven different reads. The information was then assembled with the Arachne computer program(Batzoglou et al., 2002; Jaffe et al., 2003) into a draft sequence for each genome.With the genome sequences at hand, we determined the set of protein-coding genes for each species.
For S. cerevisiae, we used the public gene catalogue at SGD. It was constructed by including all predictedprotein coding genes of at least 100 amino acids that do not overlap longer genes by more than 50%of their length. It was subsequently updated to include additional short genes supported by experimentalevidence and to reflect changes in the underlying sequence when resequencing revealed errors. For thethree newly sequenced species, we predicted all uninterrupted open reading frames (ORFs) starting with amethionine (start codon ATG) and containing at least 50 amino acids.We then constructed the bipartite graph connecting all predicted protein coding genes that share amino
acid sequence similarities across any two species. For this purpose, we first used protein BLAST (Altschulet al., 1990) to find all protein hits between the two protein sets (we used WU-BLAST BlastP withparameters W = 4 for the hit size in amino acids, hitdist = 60 for the distance between two hits, andE = 10−9 for the significance of the matches reported). Since the similarity between query protein x in onegenome and target protein y in another genome is sometimes split in multiple BLAST hits, we groupedall BLAST hits between x and y into a single match, weighted by the average amino acid percent identityacross all hits between x and y and by the total protein length aligned in BLAST hits. These matches formthe edges of the bipartite graph G, described in the following section.
1.4. Initial pruning of suboptimal matches
Let G = (X+Y,E) be a weighted bipartite graph describing the similarities between two sets of genesX and Y in the two species compared (Fig. 1, top left panel). Every edge e = (x, y) in E that connectsnodes x ∈ X and y ∈ Y was weighted by the overall amino acid similarity and length in BLAST hitsbetween genes x and y. When multiple BLAST hits connected x to y, we summed the nonoverlappingportions of these hits to obtain the total weight of the corresponding edge.We constructed graph D as the directed version of G by replacing every undirected edge e = (x, y) by
two directed edges (x, y) and (y, x) with the same weight as e in the undirected graph (Fig. 1, top rightpanel). This allowed us to rank edges incident from a node and construct subsets of D that contain onlythe top matches out of every node.We then used a relative cutoff to eliminate suboptimal matches that were significantly lower than the
best match for either incident node and hence unlikely to represent orthologous relationships. We used arelative cutoff, based on the divergence relative to the best match, rather than an absolute cutoff based onoverall divergence to ensure that potentially orthologous matches would be kept at any divergence and alsothat the algorithm would work at a range of evolutionary distances.We defined D80 as the subset of D containing for every node only the outgoing edges that are at least 80%
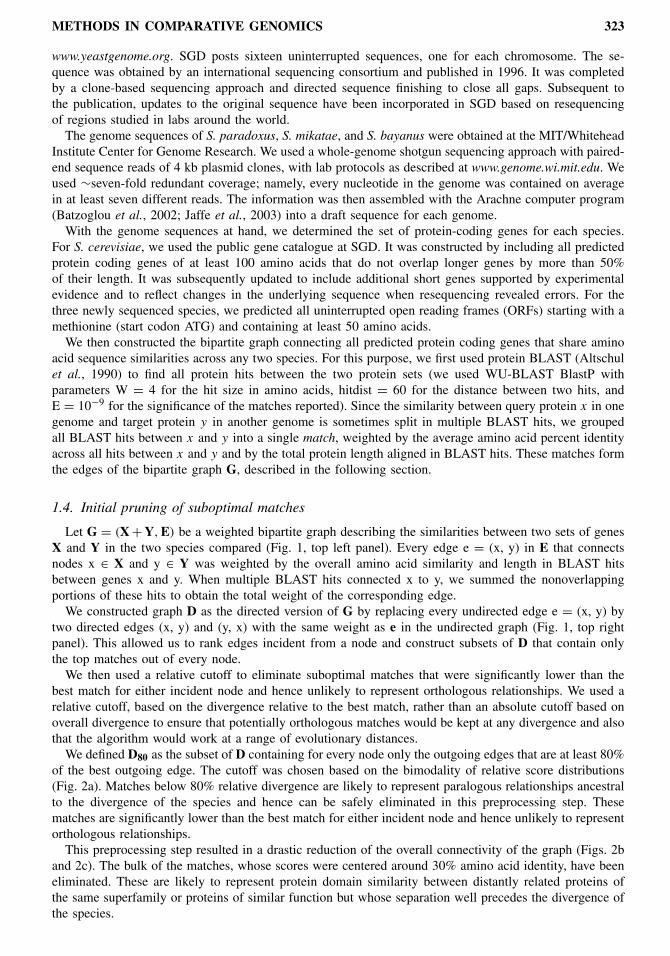
of the best outgoing edge. The cutoff was chosen based on the bimodality of relative score distributions(Fig. 2a). Matches below 80% relative divergence are likely to represent paralogous relationships ancestralto the divergence of the species and hence can be safely eliminated in this preprocessing step. Thesematches are significantly lower than the best match for either incident node and hence unlikely to representorthologous relationships.This preprocessing step resulted in a drastic reduction of the overall connectivity of the graph (Figs. 2b
and 2c). The bulk of the matches, whose scores were centered around 30% amino acid identity, have beeneliminated. These are likely to represent protein domain similarity between distantly related proteins ofthe same superfamily or proteins of similar function but whose separation well precedes the divergence ofthe species.
324 KELLIS ET AL.
FIG. 2. Pruning of suboptimal matches. We used a relative threshold for filtering out BLAST hits that are unlikely torepresent orthologous relationships. (a) Histogram of amino-acid percent identity of secondary matches as comparedto the strongest amino-acid percent identity found amidst matches shows a bimodal distribution. Dotted line indicatesrelative threshold chosen (80%), separating the two modes of the distribution. (b) Histogram of absolute percent identityfound in all matches between S. cerevisiae and S. bayanus, before applying the relative threshold. (c) Histogram ofabsolute percent identity found in matches above the relative threshold. Dotted horizontal line is indicative of scalingin the second histogram that contains fewer connections.
The distribution of the remaining matches peaks between 70% and 95% amino acid identity (Fig. 2c),which likely reflects the average evolutionary divergence of proteins at the evolutionary distance betweenthe species compared. However, since we used a relative threshold rather than an absolute one, matcheshave been kept at percent identities as low as 20% and 30%. These may represent rapidly evolvingproteins, possibly under positive selection with roles in speciation or environment adaptation. For example,the YBR184W gene encodes a protein longer than 500 amino acids in each species and is likely to beimportant in spore formation, but shows only 29% amino acid identity between S. cerevisiae and S. bayanus(and 15% across the four species). Its matches would have been lost had we used an absolute cutoff foreliminating matches, but they were kept using our relative cutoff.In particular, this preprocessing step increased the number of proteins with one-to-one correspondence
by 60% (from 2,790 to 4,648 for S. paradoxus; from 2,547 to 4,113 for S. mikatae; from 2,523 to 4,052for S. bayanus). This enabled us to create a relatively dense set of unique anchors, which we next used todefine blocks of conserved gene order (synteny) and resolve additional orthologs.
METHODS IN COMPARATIVE GENOMICS 325
1.5. Blocks of conserved synteny
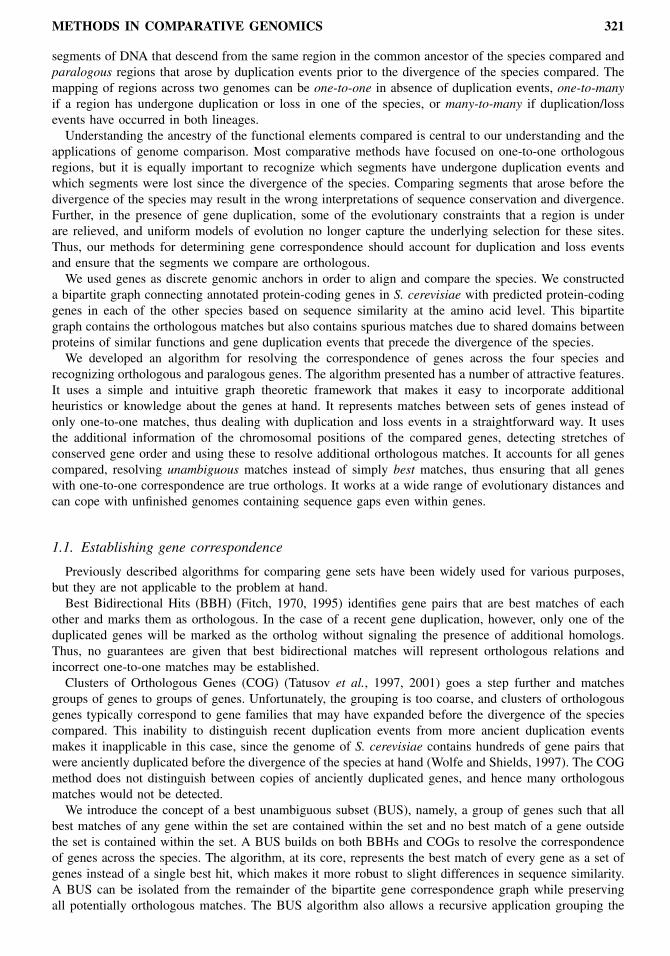
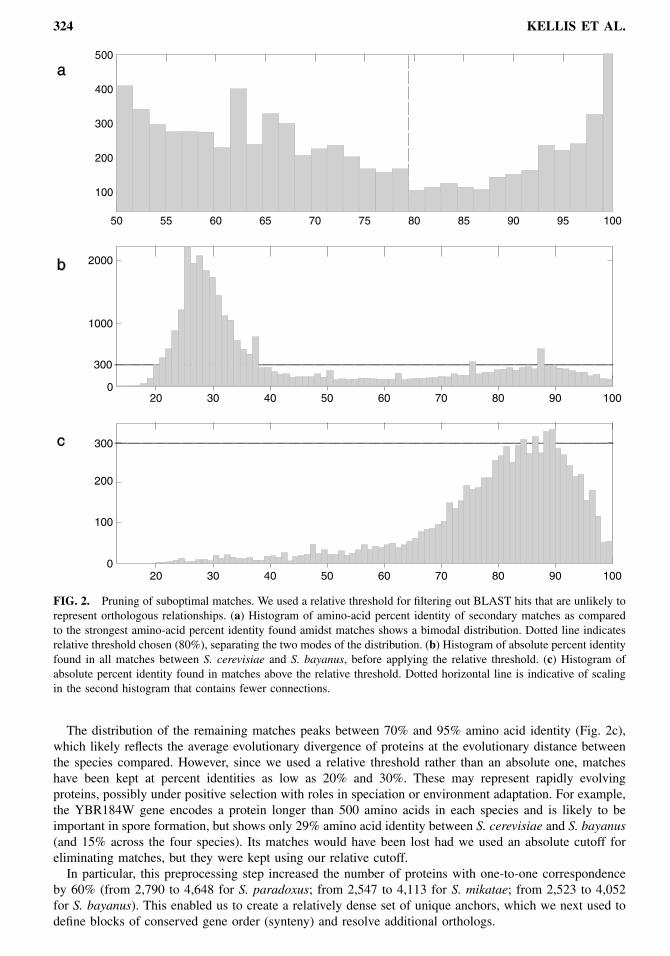
The initial pruning step created numerous unambiguous one-to-one matches (two-cycle directed sub-graphs in the bipartite graph) between proteins that do not have other closely related paralogs. We usedthese to construct blocks of conserved synteny based on the physical distance between consecutive matchedgenes and preferentially kept edges that connect additional genes within the block of conserved gene order(Fig. 3). Edges connecting these genes to genes outside the blocks were then ignored, as unlikely torepresent orthologous relationships. Without imposing an ordering on the scaffolds or the chromosomes,we associated every gene x with a fixed position (scaffold, start) within the assembly and every gene ywith a fixed position (chromosome, start) within S. cerevisiae. If three one-to-one unambiguous matches(x1, y1), (x2, y2), and (x4, y4) were such that x1, x2, x4 were physically near each other in one genomeand y1, y2, y4 were physically near each other in the other genome, we constructed a synteny block B =({x1, x2, x4}, {y1, y2, y4}). Thereafter, for a gene x3 that was proximal to {x1, x2, x4}, if an outgoingedge (x3, y3) existed such that y3 was proximal to {y1, y2, y4}, we ignored other outgoing edges (x3, y′)if y′ was not proximal to {y1, y2, y4}.We considered only synteny blocks that had a minimum of three genes before using them for resolving
ambiguities, to prevent being misled by sequence similarity of isolated genes. We set the maximum
FIG. 3. Using synteny information. Within blocks of conserved gene order (synteny), we preferentially keep thosematches that conserve gene order. Annotated S. cerevisiae ORFs and standard names are shown along the y axis.Predicted S. paradoxus ORFs and their matches are shown along the x axis, listed by decreasing scores. Unambiguousmatches are shown as grey dots and ambiguous matches are shown in black. In this example, YBR198C is selectedas the orthologous match based on synteny information, and matches to YCR084C and YPR178W are treated asparalogous.
326 KELLIS ET AL.
distance d for considering two neighboring genes as proximal to 20 kb. This parameter was set to matchthe estimated density of unique syntenic anchors. Since S. cerevisiae genes are on average 2 kb apart,and roughly two thirds of the genes have unique correspondence after the pruning step (roughly one thirdbefore the pruning step, see Section 1.4), we should expect a sufficient number of anchors within such aninterval. Further, transposable elements in yeast are relatively short, and this cutoff should tolerate eventwo tandem transposition events without interrupting a synteny block.If many genomic rearrangements have occurred since the separation of the species, or if the scaffolds
of the assembly are short, the syntenic segments will be shorter, and setting d to larger values might hurtthe performance. On the other hand, if the number of unambiguous genes is too small at the beginning ofthis step, the genes used as anchors will be sparse, and no synteny blocks will be possible for small valuesof d. We found this step to play a greater role as evolutionary distances between the species comparedbecame larger, and sequence similarity was no longer sufficient to resolve all the ambiguities.This step helped resolve genes that duplicated prior to the divergence of the species compared. Many of
these paralogs have preserved high sequence identity to each other and thus were not resolved by the initialpruning step that considered only sequence identity. In particular, more than 300 pairs of paralogs weregrouped in two-to-two homology groups before this step and were resolved based on synteny information.
1.6. Best unambiguous subsets
We finally separated out subgraphs that were connected to the remaining edges in the graph by solelynonmaximal edges. These subgraphs are such that the best match of any node within the subset is containedwithin the subset, and no node outside the subset has its best match within the subset. These two propertiesensure that the subsets are both best and unambiguous.We defined a best unambiguous subset (BUS) of the nodes of X∪S to be a subset S of genes, such that
∀x: x ∈ S ⇔ best(x) ⊆ S, where best(x) is the set of nodes incident to the maximum weight edges fromx. To construct a BUS, we first constructed D100, following the notation above, namely, the subset of Dthat contains only best matches out of a node (weights within 100% of the best edge). Note that multiplebest matches were possible based on our definition. In this graph-theoretic framework, a BUS is definedas a connected component of the undirected version of D100 (Fig. 1, bottom panels).Intuitively, a BUS is a set of genes that starts as a best bidirectional hit (BBH) and increases in size to
include all best edges incident to any gene in the set. Starting with the subset of nodes in any cycle inD100, we augmented the subset by following forward and reverse best edges, namely, including additionalnodes if their best match was within the subset or if they were the best match of a node in the subset.This ensured that separating a subset did not leave any node orphaned and did not remove the strictly bestmatch of any node. When no additional nodes needed to be included to make the component separable,the BUS condition was met and the connected component was obtained.Figure 4 shows a toy example of a similarity matrix. Genes A, B, and C in one genome are connected in
a complete bipartite graph to genes 1, 2, and 3 in another genome (ignoring for now synteny information).The sequence similarity between each pair is given in the matrix and corresponds to the edge weightconnecting the two genes in the bipartite graph. The set (A,1,2) forms a BUS, since the best matches of A,1, and 2 are all within the set and none of them represents the best match of a gene outside the set. Hence,the edges connecting (A,1,2) can be isolated as a subgraph without removing any orthologous relationships,and edges (B,1), (B,2), (C,1), (C,2), (A,3) can be ignored as nonorthologous. Similarly, (B,C,3) forms aBUS. The resulting bipartite graph is shown.This part of the algorithm allowed us to resolve the remaining orthologs, mostly due to subtelomeric
gene family expansions, small duplications, and other genes that did not benefit from synteny information.In genomes with many rearrangements or assemblies with low sequence coverage, which do not allowlong-range synteny to be established, this part of the algorithm will play a crucial role.
1.7. Performance of the algorithm
We applied this algorithm to automatically annotate the assemblies of the three species of yeast. OurPython implementation terminated within minutes for any of the pairwise comparisons. We successfullyresolved the graph of sequence similarities between the four species and found important biological im-plications in the resulting graph structure.
METHODS IN COMPARATIVE GENOMICS 327
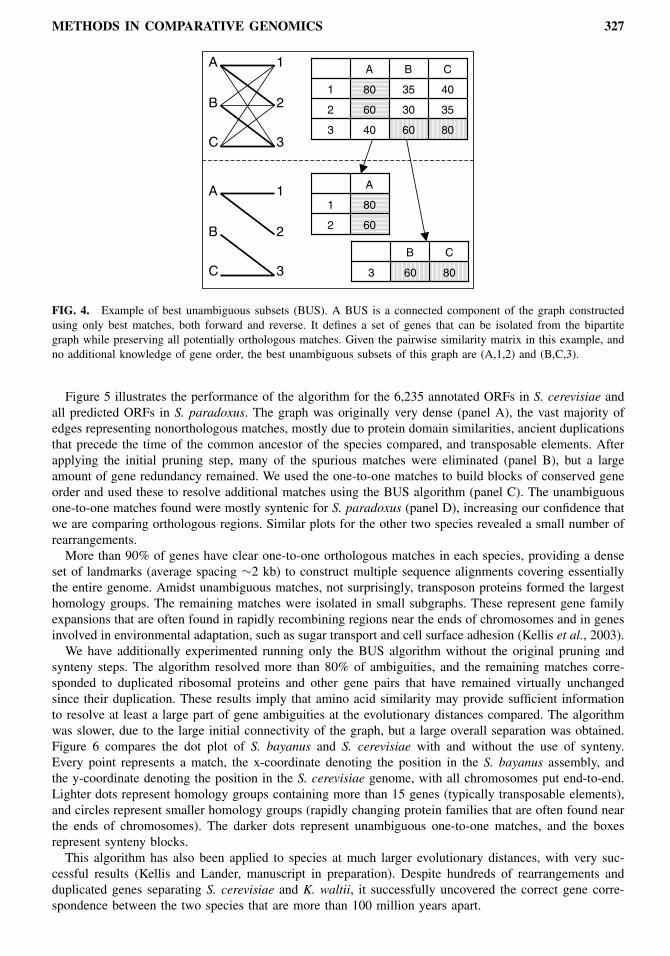
FIG. 4. Example of best unambiguous subsets (BUS). A BUS is a connected component of the graph constructedusing only best matches, both forward and reverse. It defines a set of genes that can be isolated from the bipartitegraph while preserving all potentially orthologous matches. Given the pairwise similarity matrix in this example, andno additional knowledge of gene order, the best unambiguous subsets of this graph are (A,1,2) and (B,C,3).
Figure 5 illustrates the performance of the algorithm for the 6,235 annotated ORFs in S. cerevisiae andall predicted ORFs in S. paradoxus. The graph was originally very dense (panel A), the vast majority ofedges representing nonorthologous matches, mostly due to protein domain similarities, ancient duplicationsthat precede the time of the common ancestor of the species compared, and transposable elements. Afterapplying the initial pruning step, many of the spurious matches were eliminated (panel B), but a largeamount of gene redundancy remained. We used the one-to-one matches to build blocks of conserved geneorder and used these to resolve additional matches using the BUS algorithm (panel C). The unambiguousone-to-one matches found were mostly syntenic for S. paradoxus (panel D), increasing our confidence thatwe are comparing orthologous regions. Similar plots for the other two species revealed a small number ofrearrangements.More than 90% of genes have clear one-to-one orthologous matches in each species, providing a dense
set of landmarks (average spacing ∼2 kb) to construct multiple sequence alignments covering essentiallythe entire genome. Amidst unambiguous matches, not surprisingly, transposon proteins formed the largesthomology groups. The remaining matches were isolated in small subgraphs. These represent gene familyexpansions that are often found in rapidly recombining regions near the ends of chromosomes and in genesinvolved in environmental adaptation, such as sugar transport and cell surface adhesion (Kellis et al., 2003).We have additionally experimented running only the BUS algorithm without the original pruning and
synteny steps. The algorithm resolved more than 80% of ambiguities, and the remaining matches corre-sponded to duplicated ribosomal proteins and other gene pairs that have remained virtually unchangedsince their duplication. These results imply that amino acid similarity may provide sufficient informationto resolve at least a large part of gene ambiguities at the evolutionary distances compared. The algorithmwas slower, due to the large initial connectivity of the graph, but a large overall separation was obtained.Figure 6 compares the dot plot of S. bayanus and S. cerevisiae with and without the use of synteny.Every point represents a match, the x-coordinate denoting the position in the S. bayanus assembly, andthe y-coordinate denoting the position in the S. cerevisiae genome, with all chromosomes put end-to-end.Lighter dots represent homology groups containing more than 15 genes (typically transposable elements),and circles represent smaller homology groups (rapidly changing protein families that are often found nearthe ends of chromosomes). The darker dots represent unambiguous one-to-one matches, and the boxesrepresent synteny blocks.This algorithm has also been applied to species at much larger evolutionary distances, with very suc-
cessful results (Kellis and Lander, manuscript in preparation). Despite hundreds of rearrangements andduplicated genes separating S. cerevisiae and K. waltii, it successfully uncovered the correct gene corre-spondence between the two species that are more than 100 million years apart.

328 KELLIS ET AL.
FIG. 5. Performance of the algorithm. Dot-plot representation of the bipartite graph. The 16 chromosomes ofS. cerevisiae are stacked end to end along the y-axis and the scaffolds of S. paradoxus are shown along the x-axis.Every point (x, y) represents an edge between a S. paradoxus gene at position y and a S. cerevisiae gene at positionx. (A) Full bipartite graph. (B) Graph resulting from initial pruning step. (C) Graph resulting from the use of BUSand synteny information. (D) Unambiguous one-to-one matches fall largely within syntenic segments, ensuring thatwe are comparing orthologous regions.
Additionally, the algorithm worked well with unfinished genomes, without requiring directed sequencingfor closing gaps. By working with sets of genes instead of one-to-one matches, this algorithm correctlygrouped in the same orthologous set all portions of genes that are split in two or multiple contigs inter-rupted by sequence gaps, whereas a best bidirectional hit would have instead matched only the longestportion and left part of a gene unmatched. Finally, since synteny blocks are only built on one-to-one un-ambiguous matches, the algorithm was robust to sequence contamination, when reads from other specieswere erroneously incorporated in the assembly. Foreign reads, even from more closely related species,were all marked as nonorthologous, since all features in these reads were never unique and hence not usedin synteny blocks. On the contrary, the same features in genuine contigs were surrounded by unique hitsthat helped resolve them as orthologous and mark the contaminating sequences as paralogous. Overall,the algorithm provided a good solution to determining genome correspondence, worked well at a range ofevolutionary distances, and was robust to sequencing artifacts of unfinished genomes.
1.8. Conclusion
We unambiguously resolved the one-to-one correspondence of more than 90% of S. cerevisiae genes.This provided us with a unique dataset to align and compare the evolutionary pressure of nearly everyregion in a complete eukaryotic genome across four closely related relatives. By ensuring that the regions
METHODS IN COMPARATIVE GENOMICS 329
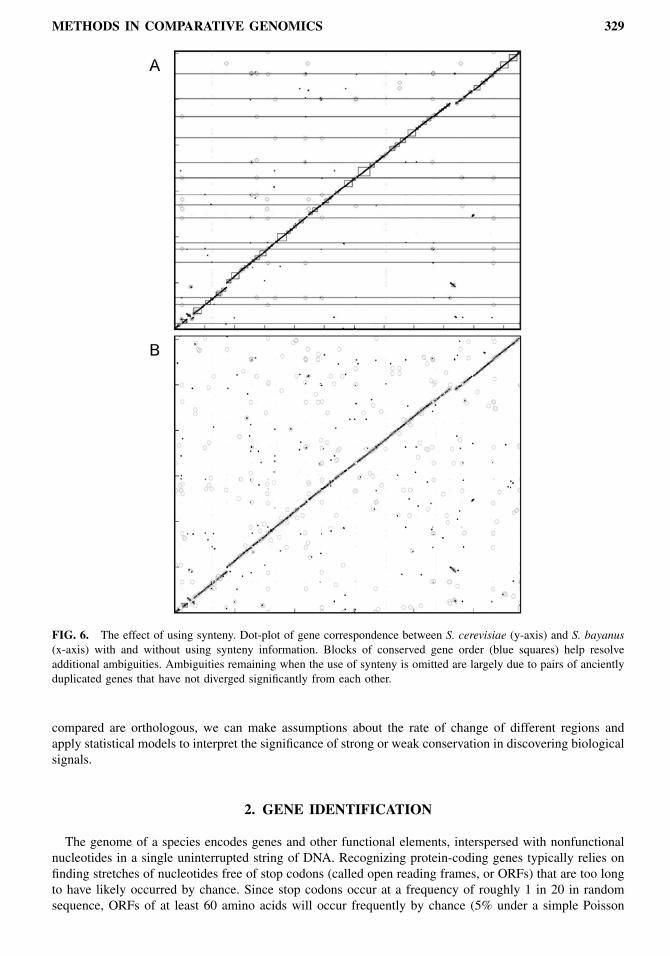
FIG. 6. The effect of using synteny. Dot-plot of gene correspondence between S. cerevisiae (y-axis) and S. bayanus(x-axis) with and without using synteny information. Blocks of conserved gene order (blue squares) help resolveadditional ambiguities. Ambiguities remaining when the use of synteny is omitted are largely due to pairs of ancientlyduplicated genes that have not diverged significantly from each other.
compared are orthologous, we can make assumptions about the rate of change of different regions andapply statistical models to interpret the significance of strong or weak conservation in discovering biologicalsignals.
2. GENE IDENTIFICATION
The genome of a species encodes genes and other functional elements, interspersed with nonfunctionalnucleotides in a single uninterrupted string of DNA. Recognizing protein-coding genes typically relies onfinding stretches of nucleotides free of stop codons (called open reading frames, or ORFs) that are too longto have likely occurred by chance. Since stop codons occur at a frequency of roughly 1 in 20 in randomsequence, ORFs of at least 60 amino acids will occur frequently by chance (5% under a simple Poisson
330 KELLIS ET AL.
model), and even ORFs of 150 amino acids will appear by chance in a large genome (0.05%). This posesa huge challenge for higher eukaryotes in which genes are typically broken into many, small exons (onaverage 125 nucleotides long for internal exons in mammals (International Human Genome SequencingConsortium, 2001)).The basic problem is distinguishing real genes—those ORFs encoding a translated protein product—
from spurious ORFs—the remaining ORFs whose presence is simply due to chance. The current publiccatalogue of yeast genes lists 6,062 predicted ORFs that could theoretically encode proteins of at least100 amino acids. Only two-thirds of these have been experimentally validated (known), and the remaining∼2000 ORFs are currently annotated as hypothetical. The total number of real protein-coding genes hasbeen a subject of considerable debate, with estimates ranging from 4,800 to 6,400 genes (Harrison et al.,2002; Kowalczuk et al., 1999; Velculescu et al., 1997). In mammalian genomes, estimates have rangedfrom 28,000 to more than 120,000 genes (Dunham, 2000; International Mouse Genome Consortium, 2002;Liang et al., 2000).In this section, we use the comparative information to recognize real genes based on their patterns of
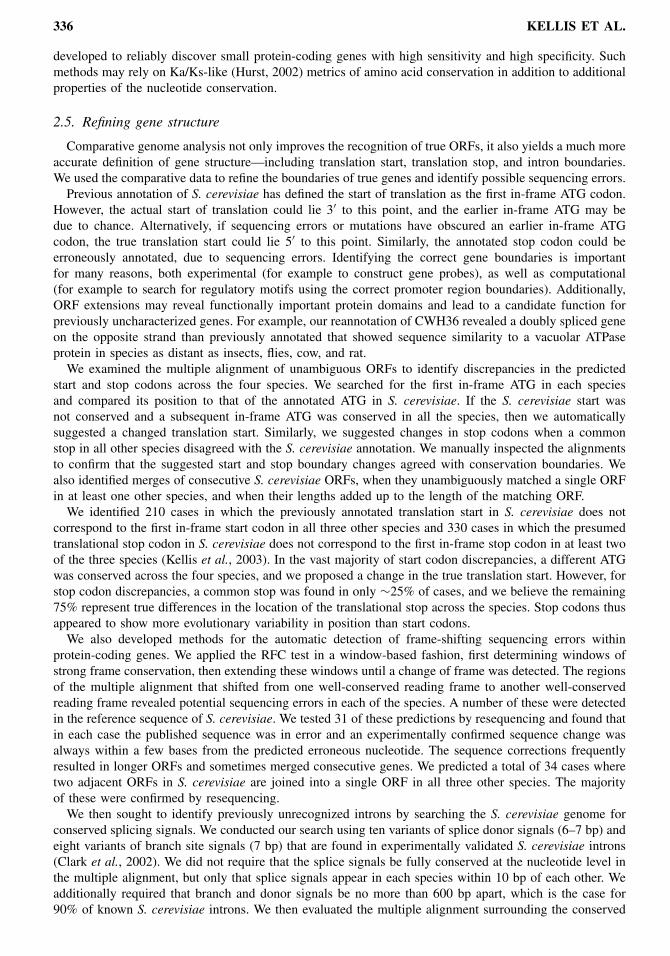
nucleotide conservation across evolutionary time. With the availability of genomewide alignments acrossthe four species, we first examined the different ways by which sequences change in known genes and inintergenic regions. The alignments of known genes revealed a clear pressure to preserve the reading frameof protein translation. We constructed a computational test to evaluate reading frame conservation (RFC)and showed that the method has high sensitivity and specificity in identifying protein-coding genes. Weused the RFC test to revisit the annotation of yeast, showed that more than 500 previously annotated ORFsare not meaningful, and discovered 43 novel ORFs that were previously overlooked. We additionally refinedthe gene structure of hundreds of genes, including translation start, stop, and exon boundaries. Overall, thesuggested changes affect nearly 15% of yeast genes.
2.1. Different conservation of genes and intergenic regions
We constructed genomewide nucleotide alignments across the four species, then examined the differ-ent properties of nucleotide conservation in genes and intergenic regions. Based on these properties, weconstructed a conservation-based test to identify biologically meaningful protein-coding genes.We used the one-to-one orthologous anchors to construct a nucleotide-level alignment of the genomes.
The strong conservation of local gene order and spacing allowed us to construct genome-wide multiplealignments. We aligned each gene together with its flanking intergenic regions using CLUSTALW (Thomp-son et al., 1994) for the multiple alignments across the four species. When sequence gaps were present inone or more species, we constructed the alignment in multiple steps. We first aligned the gapless speciescreating a base alignment. Then we aligned each ungapped portion of a species containing a gap onto thebase alignment, and constructed a consensus for that species based on the individually aligned portions.We marked sequence gaps between contigs by a dot and conflicts in independently aligned overlappingportions by N. Finally, we constructed a multiple alignment of the four species by merging the piecewisealignments, adding gaps where appropriate such that the sequences in common between these alignmentscontain identical sets of gaps.With sequence alignments at millions of positions across the four species, it is possible to obtain a precise
estimate of the rate of evolutionary change, including substitutions and insertion–deletions (indels), in thetree connecting the species. We counted transitions, transversions, insertions, and deletions within thesealignments and used these to estimate the rate of evolutionary change between the species. We countedthe rate of synonymous and nonsynonymous substitutions for every protein coding gene to find evidenceof positive selection. The detailed results will be described in a subsequent publication.We specifically compared the properties of nucleotide change in intergenic and genic (protein-coding)
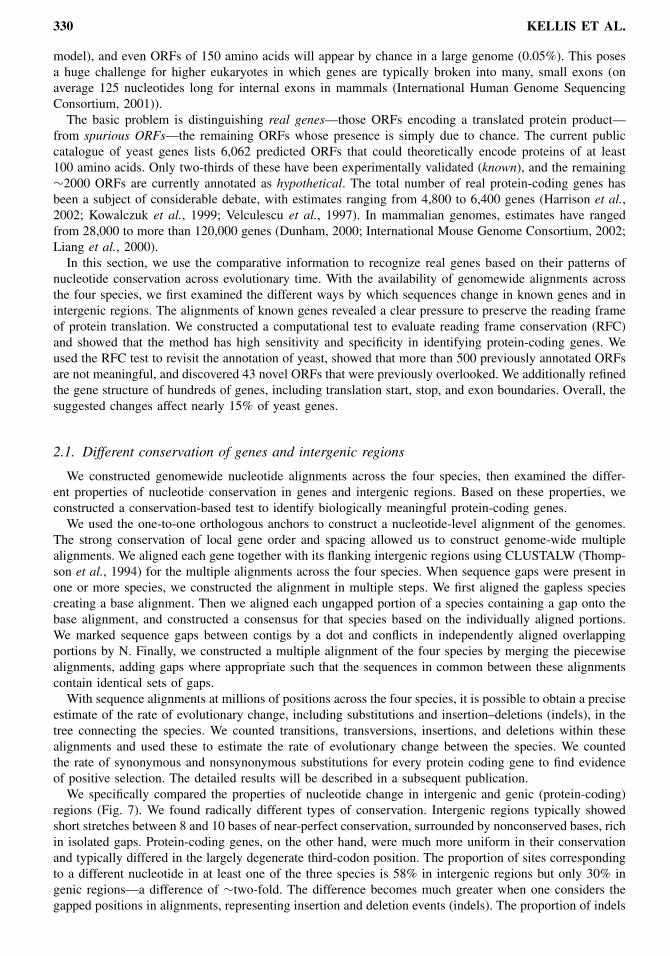
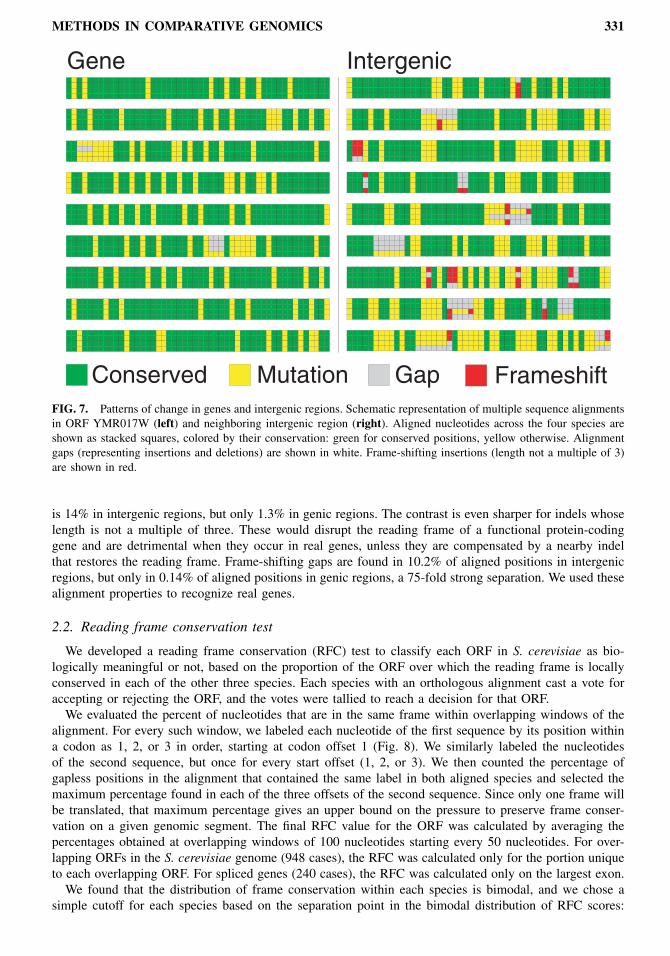
regions (Fig. 7). We found radically different types of conservation. Intergenic regions typically showedshort stretches between 8 and 10 bases of near-perfect conservation, surrounded by nonconserved bases, richin isolated gaps. Protein-coding genes, on the other hand, were much more uniform in their conservationand typically differed in the largely degenerate third-codon position. The proportion of sites correspondingto a different nucleotide in at least one of the three species is 58% in intergenic regions but only 30% ingenic regions—a difference of ∼two-fold. The difference becomes much greater when one considers thegapped positions in alignments, representing insertion and deletion events (indels). The proportion of indels
METHODS IN COMPARATIVE GENOMICS 331
FIG. 7. Patterns of change in genes and intergenic regions. Schematic representation of multiple sequence alignmentsin ORF YMR017W (left) and neighboring intergenic region (right). Aligned nucleotides across the four species areshown as stacked squares, colored by their conservation: green for conserved positions, yellow otherwise. Alignmentgaps (representing insertions and deletions) are shown in white. Frame-shifting insertions (length not a multiple of 3)are shown in red.
is 14% in intergenic regions, but only 1.3% in genic regions. The contrast is even sharper for indels whoselength is not a multiple of three. These would disrupt the reading frame of a functional protein-codinggene and are detrimental when they occur in real genes, unless they are compensated by a nearby indelthat restores the reading frame. Frame-shifting gaps are found in 10.2% of aligned positions in intergenicregions, but only in 0.14% of aligned positions in genic regions, a 75-fold strong separation. We used thesealignment properties to recognize real genes.
2.2. Reading frame conservation test
We developed a reading frame conservation (RFC) test to classify each ORF in S. cerevisiae as bio-logically meaningful or not, based on the proportion of the ORF over which the reading frame is locallyconserved in each of the other three species. Each species with an orthologous alignment cast a vote foraccepting or rejecting the ORF, and the votes were tallied to reach a decision for that ORF.We evaluated the percent of nucleotides that are in the same frame within overlapping windows of the
alignment. For every such window, we labeled each nucleotide of the first sequence by its position withina codon as 1, 2, or 3 in order, starting at codon offset 1 (Fig. 8). We similarly labeled the nucleotidesof the second sequence, but once for every start offset (1, 2, or 3). We then counted the percentage ofgapless positions in the alignment that contained the same label in both aligned species and selected themaximum percentage found in each of the three offsets of the second sequence. Since only one frame willbe translated, that maximum percentage gives an upper bound on the pressure to preserve frame conser-vation on a given genomic segment. The final RFC value for the ORF was calculated by averaging thepercentages obtained at overlapping windows of 100 nucleotides starting every 50 nucleotides. For over-lapping ORFs in the S. cerevisiae genome (948 cases), the RFC was calculated only for the portion uniqueto each overlapping ORF. For spliced genes (240 cases), the RFC was calculated only on the largest exon.We found that the distribution of frame conservation within each species is bimodal, and we chose a
simple cutoff for each species based on the separation point in the bimodal distribution of RFC scores:
332 KELLIS ET AL.
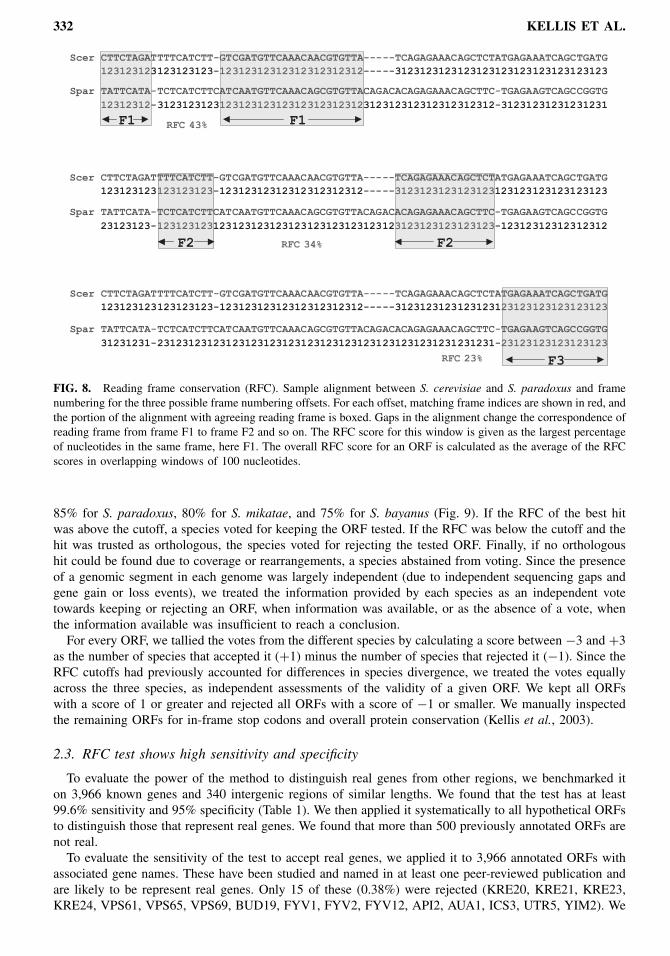
FIG. 8. Reading frame conservation (RFC). Sample alignment between S. cerevisiae and S. paradoxus and framenumbering for the three possible frame numbering offsets. For each offset, matching frame indices are shown in red, andthe portion of the alignment with agreeing reading frame is boxed. Gaps in the alignment change the correspondence ofreading frame from frame F1 to frame F2 and so on. The RFC score for this window is given as the largest percentageof nucleotides in the same frame, here F1. The overall RFC score for an ORF is calculated as the average of the RFCscores in overlapping windows of 100 nucleotides.
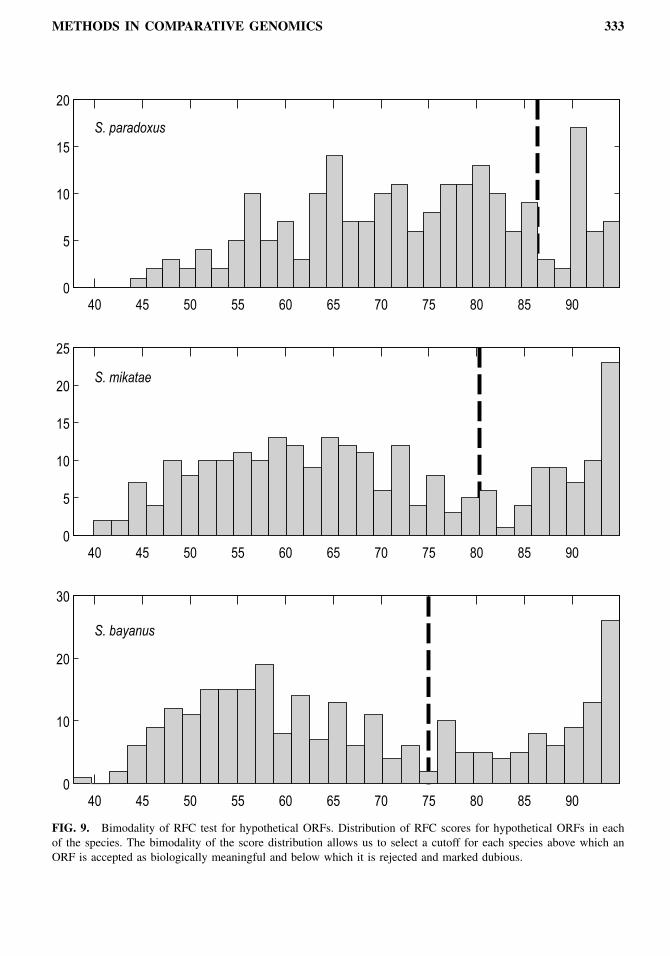
85% for S. paradoxus, 80% for S. mikatae, and 75% for S. bayanus (Fig. 9). If the RFC of the best hitwas above the cutoff, a species voted for keeping the ORF tested. If the RFC was below the cutoff and thehit was trusted as orthologous, the species voted for rejecting the tested ORF. Finally, if no orthologoushit could be found due to coverage or rearrangements, a species abstained from voting. Since the presenceof a genomic segment in each genome was largely independent (due to independent sequencing gaps andgene gain or loss events), we treated the information provided by each species as an independent votetowards keeping or rejecting an ORF, when information was available, or as the absence of a vote, whenthe information available was insufficient to reach a conclusion.For every ORF, we tallied the votes from the different species by calculating a score between −3 and +3
as the number of species that accepted it (+1) minus the number of species that rejected it (−1). Since theRFC cutoffs had previously accounted for differences in species divergence, we treated the votes equallyacross the three species, as independent assessments of the validity of a given ORF. We kept all ORFswith a score of 1 or greater and rejected all ORFs with a score of −1 or smaller. We manually inspectedthe remaining ORFs for in-frame stop codons and overall protein conservation (Kellis et al., 2003).
2.3. RFC test shows high sensitivity and specificity
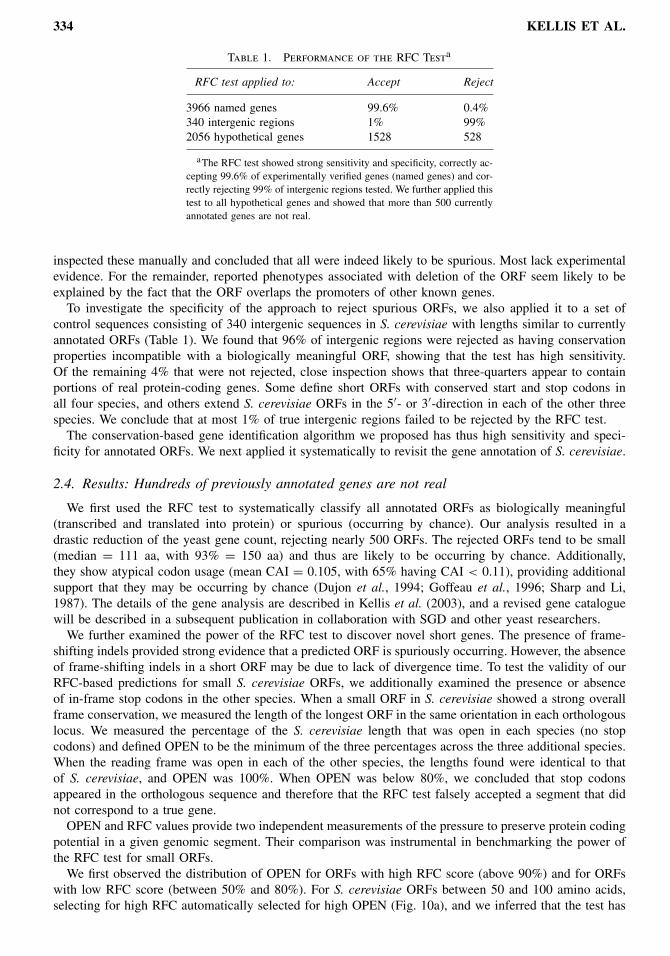
To evaluate the power of the method to distinguish real genes from other regions, we benchmarked iton 3,966 known genes and 340 intergenic regions of similar lengths. We found that the test has at least99.6% sensitivity and 95% specificity (Table 1). We then applied it systematically to all hypothetical ORFsto distinguish those that represent real genes. We found that more than 500 previously annotated ORFs arenot real.To evaluate the sensitivity of the test to accept real genes, we applied it to 3,966 annotated ORFs with
associated gene names. These have been studied and named in at least one peer-reviewed publication andare likely to be represent real genes. Only 15 of these (0.38%) were rejected (KRE20, KRE21, KRE23,KRE24, VPS61, VPS65, VPS69, BUD19, FYV1, FYV2, FYV12, API2, AUA1, ICS3, UTR5, YIM2). We
METHODS IN COMPARATIVE GENOMICS 333
FIG. 9. Bimodality of RFC test for hypothetical ORFs. Distribution of RFC scores for hypothetical ORFs in eachof the species. The bimodality of the score distribution allows us to select a cutoff for each species above which anORF is accepted as biologically meaningful and below which it is rejected and marked dubious.
334 KELLIS ET AL.
Table 1. Performance of the RFC Testa
RFC test applied to: Accept Reject
3966 named genes 99.6% 0.4%340 intergenic regions 1% 99%2056 hypothetical genes 1528 528
aThe RFC test showed strong sensitivity and specificity, correctly ac-cepting 99.6% of experimentally verified genes (named genes) and cor-rectly rejecting 99% of intergenic regions tested. We further applied thistest to all hypothetical genes and showed that more than 500 currentlyannotated genes are not real.
inspected these manually and concluded that all were indeed likely to be spurious. Most lack experimentalevidence. For the remainder, reported phenotypes associated with deletion of the ORF seem likely to beexplained by the fact that the ORF overlaps the promoters of other known genes.To investigate the specificity of the approach to reject spurious ORFs, we also applied it to a set of
control sequences consisting of 340 intergenic sequences in S. cerevisiae with lengths similar to currentlyannotated ORFs (Table 1). We found that 96% of intergenic regions were rejected as having conservationproperties incompatible with a biologically meaningful ORF, showing that the test has high sensitivity.Of the remaining 4% that were not rejected, close inspection shows that three-quarters appear to containportions of real protein-coding genes. Some define short ORFs with conserved start and stop codons inall four species, and others extend S. cerevisiae ORFs in the 5′- or 3′-direction in each of the other threespecies. We conclude that at most 1% of true intergenic regions failed to be rejected by the RFC test.The conservation-based gene identification algorithm we proposed has thus high sensitivity and speci-
ficity for annotated ORFs. We next applied it systematically to revisit the gene annotation of S. cerevisiae.
2.4. Results: Hundreds of previously annotated genes are not real
We first used the RFC test to systematically classify all annotated ORFs as biologically meaningful(transcribed and translated into protein) or spurious (occurring by chance). Our analysis resulted in adrastic reduction of the yeast gene count, rejecting nearly 500 ORFs. The rejected ORFs tend to be small(median = 111 aa, with 93% = 150 aa) and thus are likely to be occurring by chance. Additionally,they show atypical codon usage (mean CAI = 0.105, with 65% having CAI < 0.11), providing additionalsupport that they may be occurring by chance (Dujon et al., 1994; Goffeau et al., 1996; Sharp and Li,1987). The details of the gene analysis are described in Kellis et al. (2003), and a revised gene cataloguewill be described in a subsequent publication in collaboration with SGD and other yeast researchers.We further examined the power of the RFC test to discover novel short genes. The presence of frame-
shifting indels provided strong evidence that a predicted ORF is spuriously occurring. However, the absenceof frame-shifting indels in a short ORF may be due to lack of divergence time. To test the validity of ourRFC-based predictions for small S. cerevisiae ORFs, we additionally examined the presence or absenceof in-frame stop codons in the other species. When a small ORF in S. cerevisiae showed a strong overallframe conservation, we measured the length of the longest ORF in the same orientation in each orthologouslocus. We measured the percentage of the S. cerevisiae length that was open in each species (no stopcodons) and defined OPEN to be the minimum of the three percentages across the three additional species.When the reading frame was open in each of the other species, the lengths found were identical to thatof S. cerevisiae, and OPEN was 100%. When OPEN was below 80%, we concluded that stop codonsappeared in the orthologous sequence and therefore that the RFC test falsely accepted a segment that didnot correspond to a true gene.OPEN and RFC values provide two independent measurements of the pressure to preserve protein coding
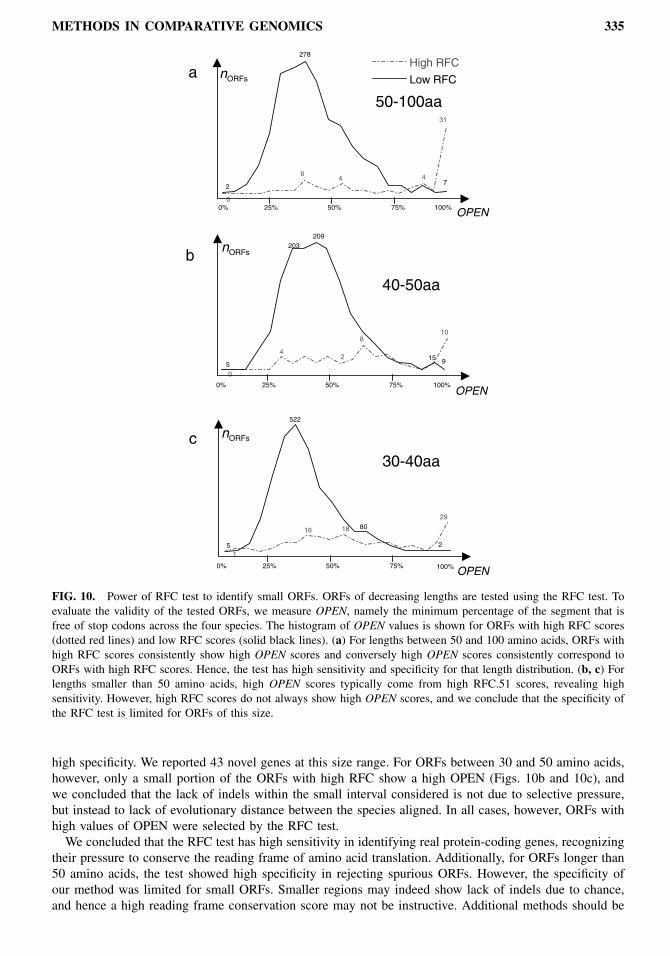
potential in a given genomic segment. Their comparison was instrumental in benchmarking the power ofthe RFC test for small ORFs.We first observed the distribution of OPEN for ORFs with high RFC score (above 90%) and for ORFs
with low RFC score (between 50% and 80%). For S. cerevisiae ORFs between 50 and 100 amino acids,selecting for high RFC automatically selected for high OPEN (Fig. 10a), and we inferred that the test has
METHODS IN COMPARATIVE GENOMICS 335
FIG. 10. Power of RFC test to identify small ORFs. ORFs of decreasing lengths are tested using the RFC test. Toevaluate the validity of the tested ORFs, we measure OPEN, namely the minimum percentage of the segment that isfree of stop codons across the four species. The histogram of OPEN values is shown for ORFs with high RFC scores(dotted red lines) and low RFC scores (solid black lines). (a) For lengths between 50 and 100 amino acids, ORFs withhigh RFC scores consistently show high OPEN scores and conversely high OPEN scores consistently correspond toORFs with high RFC scores. Hence, the test has high sensitivity and specificity for that length distribution. (b, c) Forlengths smaller than 50 amino acids, high OPEN scores typically come from high RFC.51 scores, revealing highsensitivity. However, high RFC scores do not always show high OPEN scores, and we conclude that the specificity ofthe RFC test is limited for ORFs of this size.
high specificity. We reported 43 novel genes at this size range. For ORFs between 30 and 50 amino acids,however, only a small portion of the ORFs with high RFC show a high OPEN (Figs. 10b and 10c), andwe concluded that the lack of indels within the small interval considered is not due to selective pressure,but instead to lack of evolutionary distance between the species aligned. In all cases, however, ORFs withhigh values of OPEN were selected by the RFC test.We concluded that the RFC test has high sensitivity in identifying real protein-coding genes, recognizing
their pressure to conserve the reading frame of amino acid translation. Additionally, for ORFs longer than50 amino acids, the test showed high specificity in rejecting spurious ORFs. However, the specificity ofour method was limited for small ORFs. Smaller regions may indeed show lack of indels due to chance,and hence a high reading frame conservation score may not be instructive. Additional methods should be
336 KELLIS ET AL.
developed to reliably discover small protein-coding genes with high sensitivity and high specificity. Suchmethods may rely on Ka/Ks-like (Hurst, 2002) metrics of amino acid conservation in addition to additionalproperties of the nucleotide conservation.
2.5. Refining gene structure
Comparative genome analysis not only improves the recognition of true ORFs, it also yields a much moreaccurate definition of gene structure—including translation start, translation stop, and intron boundaries.We used the comparative data to refine the boundaries of true genes and identify possible sequencing errors.Previous annotation of S. cerevisiae has defined the start of translation as the first in-frame ATG codon.
However, the actual start of translation could lie 3′ to this point, and the earlier in-frame ATG may bedue to chance. Alternatively, if sequencing errors or mutations have obscured an earlier in-frame ATGcodon, the true translation start could lie 5′ to this point. Similarly, the annotated stop codon could beerroneously annotated, due to sequencing errors. Identifying the correct gene boundaries is importantfor many reasons, both experimental (for example to construct gene probes), as well as computational(for example to search for regulatory motifs using the correct promoter region boundaries). Additionally,ORF extensions may reveal functionally important protein domains and lead to a candidate function forpreviously uncharacterized genes. For example, our reannotation of CWH36 revealed a doubly spliced geneon the opposite strand than previously annotated that showed sequence similarity to a vacuolar ATPaseprotein in species as distant as insects, flies, cow, and rat.We examined the multiple alignment of unambiguous ORFs to identify discrepancies in the predicted
start and stop codons across the four species. We searched for the first in-frame ATG in each speciesand compared its position to that of the annotated ATG in S. cerevisiae. If the S. cerevisiae start wasnot conserved and a subsequent in-frame ATG was conserved in all the species, then we automaticallysuggested a changed translation start. Similarly, we suggested changes in stop codons when a commonstop in all other species disagreed with the S. cerevisiae annotation. We manually inspected the alignmentsto confirm that the suggested start and stop boundary changes agreed with conservation boundaries. Wealso identified merges of consecutive S. cerevisiae ORFs, when they unambiguously matched a single ORFin at least one other species, and when their lengths added up to the length of the matching ORF.We identified 210 cases in which the previously annotated translation start in S. cerevisiae does not
correspond to the first in-frame start codon in all three other species and 330 cases in which the presumedtranslational stop codon in S. cerevisiae does not correspond to the first in-frame stop codon in at least twoof the three species (Kellis et al., 2003). In the vast majority of start codon discrepancies, a different ATGwas conserved across the four species, and we proposed a change in the true translation start. However, forstop codon discrepancies, a common stop was found in only ∼25% of cases, and we believe the remaining75% represent true differences in the location of the translational stop across the species. Stop codons thusappeared to show more evolutionary variability in position than start codons.We also developed methods for the automatic detection of frame-shifting sequencing errors within
protein-coding genes. We applied the RFC test in a window-based fashion, first determining windows ofstrong frame conservation, then extending these windows until a change of frame was detected. The regionsof the multiple alignment that shifted from one well-conserved reading frame to another well-conservedreading frame revealed potential sequencing errors in each of the species. A number of these were detectedin the reference sequence of S. cerevisiae. We tested 31 of these predictions by resequencing and found thatin each case the published sequence was in error and an experimentally confirmed sequence change wasalways within a few bases from the predicted erroneous nucleotide. The sequence corrections frequentlyresulted in longer ORFs and sometimes merged consecutive genes. We predicted a total of 34 cases wheretwo adjacent ORFs in S. cerevisiae are joined into a single ORF in all three other species. The majorityof these were confirmed by resequencing.We then sought to identify previously unrecognized introns by searching the S. cerevisiae genome for
conserved splicing signals. We conducted our search using ten variants of splice donor signals (6–7 bp) andeight variants of branch site signals (7 bp) that are found in experimentally validated S. cerevisiae introns(Clark et al., 2002). We did not require that the splice signals be fully conserved at the nucleotide level inthe multiple alignment, but only that splice signals appear in each species within 10 bp of each other. Weadditionally required that branch and donor signals be no more than 600 bp apart, which is the case for90% of known S. cerevisiae introns. We then evaluated the multiple alignment surrounding the conserved
METHODS IN COMPARATIVE GENOMICS 337
FIG. 11. Revised gene catalogue. Our comparative analysis has revised the yeast gene annotation, affecting nearly15% of all currently annotated genes. We found that 528 previously annotated ORFs are not real genes, identified 43novel short ORFs that were previously overlooked, proposed merges of 34 pairs of consecutive ORFs, proposed 286boundary changes (210 start changes and 76 stop changes), and identified 58 novel introns.
signals for three properties: (1) a conserved acceptor signal, [CT]AG, 3′ of the branch site, (2) high RFC5′ of the donor signal and 3′ of the acceptor signal, and (3) low RFC within the intron. Roughly half of theconserved donor/branch pairs met our additional requirements, yielding a total of 58 novel introns (Kelliset al., 2003). Of these, 20 were independently discovered by Ares and colleagues using techniques suchas microarray hybridization (Clark et al., 2002). Our remaining predictions are currently being tested incollaboration with Ares and colleagues.
2.6. Conclusion: Revised yeast gene catalog
Based on the analysis above, we proposed a revised yeast gene catalog consisting of 5,538 ORFs greaterthan 100 amino acids in length. This reflects the proposed elimination of 503 ORFs (366 from the RFCtest, 105 by manual inspection and 32 through merging). A total of 20 ORFs in SGD remain unresolved.Complete information about the gene catalog is provided in Kellis et al. (2003), and will be discussed morefully in a subsequent manuscript in collaboration with SGD and other yeast investigators. The revised genecount is consistent with at least two recent predictions based on light shotgun coverage of related species(Blandin et al., 2000; Wood et al., 2001). We believe that this represents a reasonably accurate descriptionof the yeast gene set, because the methodology has high sensitivity and specificity and the evidence isunambiguous for the vast majority of ORFs. Nonetheless, some errors are likely to remain. The resultscould be confirmed and remaining uncertainties resolved by sequencing of additional related yeast species,as well as by other experimental methods.Despite the intensive study of S. cerevisiae to date, comparative genome analysis resulted in a major
revision of the yeast gene catalog affecting more than 15% of all ORFs (Fig. 11). The results suggestthat comparative analysis of a modest collection of species can permit accurate definition of genes andtheir structure. Comparative analysis can complement the primary sequence of a species and providegeneral rules for gene discovery that do not rely solely on known splicing signals for gene discovery.Previous studies have shown that such methods are also applicable to the understanding of mammaliangenes (Batzoglou et al., 2000), and they will be invaluable in identifying all human genes. The ability toobserve the evolutionary pressures that nucleotide sequences are subjected to radically changes our powerfor signal discovery.
3. REGULATORY MOTIF DISCOVERY
Regulatory motifs are short DNA sequences that are used to control the expression of genes, dictatingthe conditions under which a gene will be turned on or off. Each motif is typically recognized by a specificDNA-binding protein called a transcription factor (TF). A transcription factor binds precise sites in thepromoter region of target genes in a sequence-specific way, but this contact can tolerate some degreeof sequence variation. Thus, different binding sites may contain slight variations of the same underlyingmotif, and the definition of a regulatory motif should capture these variations while remaining as specificas possible.
338 KELLIS ET AL.
The direct identification of regulatory motifs presents numerous challenges. By their nature, they are veryshort (6 to 15 bp), frequently degenerate, and can appear at varying distances and orientations upstream oftarget genes. Unlike genes that contain clear start and stop codons, as well as well-defined splicing signals,motifs have no detectable sequence features, and they are indistinguishable from random sequences of thesame length. Their identification has thus relied heavily on experimental intervention, such as mutationalanalysis of promoter regions or genomewide gene expression studies under various environmental cellperturbations.
3.1. Comparison with previous work
Computationally, discovering regulatory motifs amounts to extracting signal from noise. When the motifssearched are expected to be more frequent than other patterns of the same length, one can apply discoveryalgorithms such as expectation maximization (EM) or Gibbs sampling and others reviewed by Stormo(2000). These were pioneered by Lawrence and coworkers (Lawrence et al., 1993) and made popular insoftware programs such as MEME (Bailey and Elkan, 1994; Grundy et al., 1997), AlignACE (Hugheset al., 2000; Roth et al., 1998; Tavazoie et al., 1999) or BioProspector (Liu et al., 2001).These methods have typically been applied to the upstream sequences of small sets of genes, but are
not applicable to a genomewide discovery. Instead, k-mer counting methods have been used to find shortsequences that occur more frequently in intergenic regions, as compared to coding regions in a genome-widefashion (Hampson et al., 2002). However, these typically find very degenerate sequences (such as poly-Aor poly-T) and have shown limited power to separate regulatory motifs from the mostly nonfunctionalintergenic regions. This is largely due to the small number of functional instances of regulatory motifs, ascompared to the large number of nonfunctional nucleotides. The discovery of regulatory motifs still reliesheavily on extensive experimentation.Comparative genomics provides a powerful way to distinguish regulatory motifs from nonfunctional
patterns based on their conservation. Over evolutionary time, mutations accumulate in nonfunctional nu-cleotides whereas changes in functional nucleotides are detrimental and eliminated by natural selection.Hence, by comparing related genomes, we can increase our ability to separate signal from noise basedon evolutionary conservation. Phylogenetic footprinting methods have traditionally applied this idea torecognize islands of conservation in individual promoter regions (Blanchette et al., 2002; Blanchette andTompa, 2002; Jiao et al., 2002; McCue et al., 2001; McGuire et al., 2000; Oeltjen et al., 1997; Pennacchioand Rubin, 2001; Tompa, 2001). Similarly, conservation has been used to distinguish possibly functionalinstances of previously known regulatory motifs (Gelfand et al., 2000; Levy and Hannenhalli, 2002; Lootset al., 2002).In this paper, we address the genomewide discovery of the dictionary of regulatory motifs in an organism.
Namely, we are interested in going beyond the individual islands of conservation and discovering the subtlesignals that cross-cut these islands. Regulatory motifs may appear in slight variations in different intergenicregions, and our methods should be able to discover positions that tolerate sequence degeneracy, whilecapturing the full sequence specificity in constrained positions. Additionally, we are interested in the abilityto discover regulatory motifs directly from genome sequence, relying solely on conservation informationand without use of biological knowledge of gene function, expression, or transcription factor binding.We studied the conservation patterns of known regulatory motifs to derive conservation criteria that
would allow us to discover new motifs. We evaluated motif conservation at the genomewide level, si-multaneously observing all conserved and nonconserved instances of a motif throughout the genome. Byobserving multiple conserved instances of a motif, we increased our predictive power over traditional meth-ods that work with individual islands of conservation. Genomewide metrics enabled increased specificityby eliminating bases that may be conserved in individual sites by chance alone but not in most sites.Similarly, they enabled increased sensitivity in discovering degenerate motif positions that may be weaklyconserved at any one site but show a conservation preference across the genome.Our motif discovery strategy consisted of an exhaustive enumeration and testing of short sequence pat-
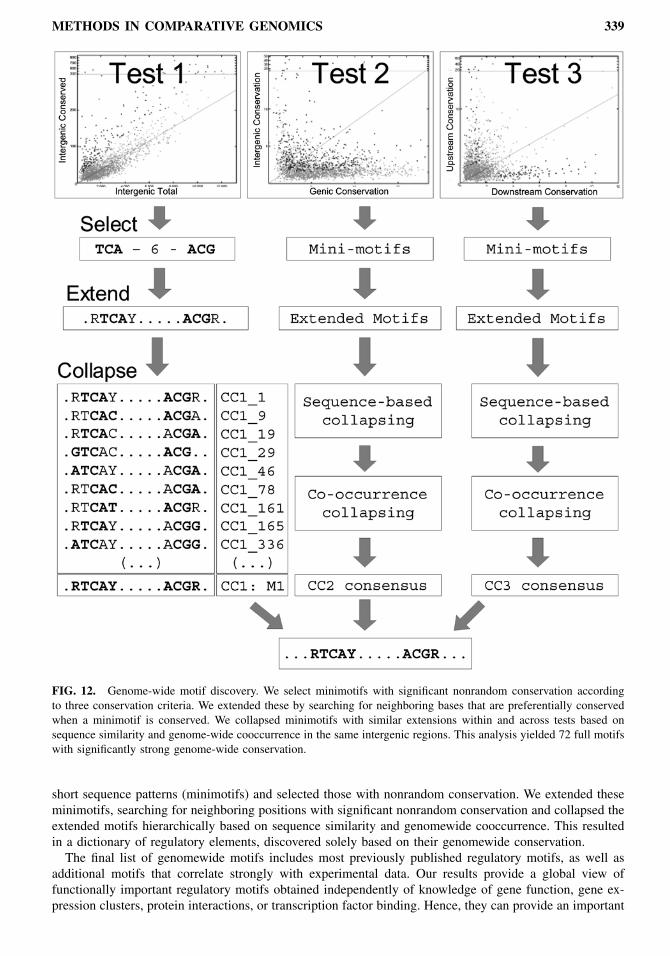
terns (minimotifs) to find strongly conserved motif cores, followed by a motif refinement and collapsingstep that ultimately produced a small number of full motifs (Fig. 12). We introduce three different con-servation criteria (CC) for testing candidate motifs: overall genomewide intergenic conservation (CC1),preference for intergenic conservation over genic conservation (CC2), and differential conservation inupstream-only versus downstream-only regions (CC3). Using these three criteria, we tested a large set of
METHODS IN COMPARATIVE GENOMICS 339
FIG. 12. Genome-wide motif discovery. We select minimotifs with significant nonrandom conservation accordingto three conservation criteria. We extended these by searching for neighboring bases that are preferentially conservedwhen a minimotif is conserved. We collapsed minimotifs with similar extensions within and across tests based onsequence similarity and genome-wide cooccurrence in the same intergenic regions. This analysis yielded 72 full motifswith significantly strong genome-wide conservation.
short sequence patterns (minimotifs) and selected those with nonrandom conservation. We extended theseminimotifs, searching for neighboring positions with significant nonrandom conservation and collapsed theextended motifs hierarchically based on sequence similarity and genomewide cooccurrence. This resultedin a dictionary of regulatory elements, discovered solely based on their genomewide conservation.The final list of genomewide motifs includes most previously published regulatory motifs, as well as
additional motifs that correlate strongly with experimental data. Our results provide a global view offunctionally important regulatory motifs obtained independently of knowledge of gene function, gene ex-pression clusters, protein interactions, or transcription factor binding. Hence, they can provide an important
340 KELLIS ET AL.
link between these data sources of cell state towards understanding the dynamic nature of the cell and thecomplexity of regulatory interactions.
3.2. Genomewide discovery of motif cores
Regulatory motif discovery requires the ability to explore the space of possible sequences and a scoringscheme that allows the selection of relevant motifs. Gibbs sampling and expectation-maximization discov-ery methods (Stormo, 2000; Tavazoie et al., 1999) explore motif space by directly sampling the genome, theperformance of which can be very dependent on initialization. On the other hand, enumeration approaches(Hampson et al., 2002) have had the disadvantage that the motifs discovered are frequently too simplisticto adequately capture the sequence specificity of transcription factors. We used a mixed approach, first ex-ploring sequence space by the exhaustive enumeration of short sequence patterns, then refining the patternswith nonrandom conservation to construct full motifs that include degenerate motif positions. We chose touse a finite alphabet representation rather than the more general position weight matrices for ease of manip-ulation of motifs, but also for the ability to use enumeration approaches. We recognize that more generalrepresentations might better capture the versatility of transcription factor binding and additional speciesmight be necessary to fully specify the additional parameters, but these will be the subject of future work.To select a form of short sequence compact enough to allow enumeration, but also general enough
to resemble biologically important regulatory motifs, we studied the types of recognition sequences oftranscription factors in yeast. These regulatory motifs depend on the three-dimensional structure that atranscription factor assumes at its protein-DNA contact. Two main types of contact account for nearly allknown regulatory motifs in yeast: either a single stretch of nucleotides typically six to eight base pairslong, or two smaller stretches separated by a gap of unspecified nucleotides that are not involved in therecognition. For example, the Gal4 transcription factor binds DNA as a dimer, each part contacting threebase pairs, the two halves separated by a gap of 11 unspecified nucleotides (one full turn of the doublehelix). The associated regulatory motif is CGG(N)11CCG, where N can be any of the four bases. On theother hand, factors like Mbp1 and Cbf1 contact DNA at a contiguous stretch of base pairs, recognizingrespectively the motifs ACGCGT and RTCACRTG, where R = [AG].We defined a minimotif to be a short sequence pattern of the type XYZ-m-UVW, consisting of two
stretches of specified nucleotides, each stretch exactly three base pairs long, and the two stretches separatedby a fixed gap of m unspecified nucleotides. These minimotifs will serve as seeds in sequence space forconstructing full motifs in the following section. Both Gal4 and Mbp1 can be expressed directly asminimotifs, respectively, CGG-11-CCG and ACG-0-CGT, by allowing for a zero-length gap. However, itis only through the motif optimization stage (see Section 3.2) that a motif like Cbf1 can be constructed.Multiple seeds may lead to the construction of Cbf1, such as TCA-0-CGT, TCA-1-GTG, etc. Hence,although insufficient to directly capture the exact sequence of each regulatory motif, minimotifs allow usto explore motif space and follow strongly conserved seeds.To explore sequence space, we enumerated all minimotifs with gap size m between 0 and 21 nucleotides.
For a given gap size, there are 46 = 4,096 possible sequences, but only 2,080 unique minimotifs, con-sidering a motif and its reverse complement as the same motif. This resulted in a total of 45,760 distinctminimotifs. We assumed that the large majority of these show a conservation typical of random sequences,and thus minimotifs provided an internal control for estimating a basal rate of conservation (the averagerate of conservation at the evolutionary distance separating the species in absence of selective pressure).We then compared the conservation rate of each candidate minimotif to this basal conservation rate inorder to evaluate the nonrandomness of its conservation.In order to derive conservation signatures that allow us to distinguish real motifs from nonfunctional
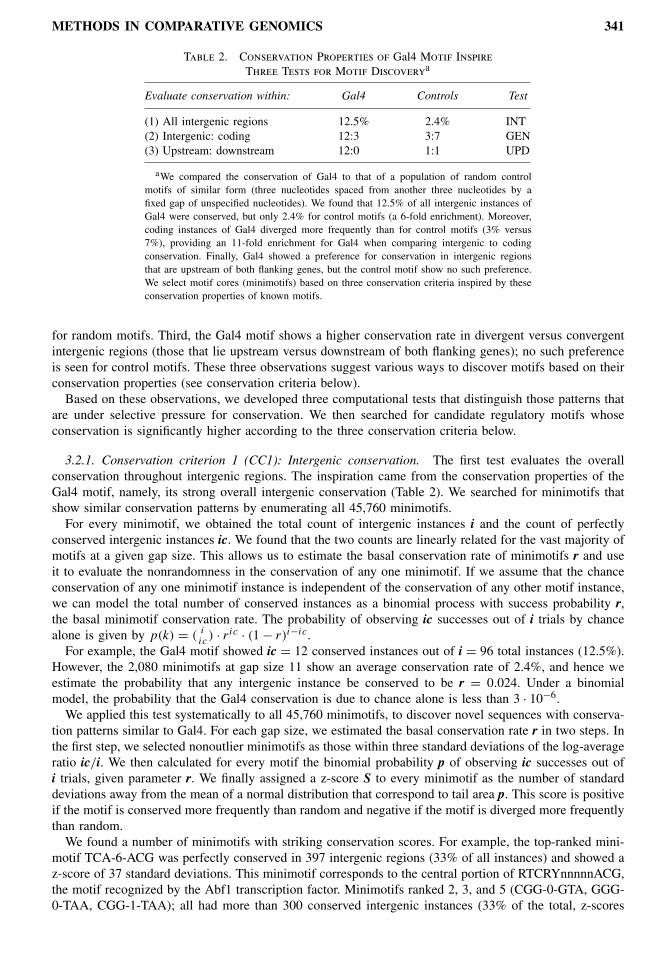
sequences, we studied the conservation patterns of known motifs and compared these to random motifs.For example, in the S. cerevisiae genome, the Gal4 motif occurs a total of 96 times in intergenic regionsand 415 times in genic (protein-coding) regions. The motif displays certain striking conservation properties(Table 2). First, occurrences of the Gal4 motif in intergenic regions have a conservation rate (proportionconserved across all four species) that is ∼five-fold higher than for random minimotifs (12.5% versus2.4%). Second, the Gal4 motif is preferentially conserved in intergenic regions rather than in genic regions(12.5% versus 3%). By contrast, random motifs are less frequently conserved in intergenic regions thangenic regions (3.1% versus 7.0%), reflecting the higher overall level of conservation in genic regions.Thus, the relative conservation rate in intergenic versus genic regions is ∼11-fold higher for Gal4 than
METHODS IN COMPARATIVE GENOMICS 341
Table 2. Conservation Properties of Gal4 Motif InspireThree Tests for Motif Discoverya
Evaluate conservation within: Gal4 Controls Test
(1) All intergenic regions 12.5% 2.4% INT(2) Intergenic: coding 12:3 3:7 GEN(3) Upstream: downstream 12:0 1:1 UPD
aWe compared the conservation of Gal4 to that of a population of random controlmotifs of similar form (three nucleotides spaced from another three nucleotides by afixed gap of unspecified nucleotides). We found that 12.5% of all intergenic instances ofGal4 were conserved, but only 2.4% for control motifs (a 6-fold enrichment). Moreover,coding instances of Gal4 diverged more frequently than for control motifs (3% versus7%), providing an 11-fold enrichment for Gal4 when comparing intergenic to codingconservation. Finally, Gal4 showed a preference for conservation in intergenic regionsthat are upstream of both flanking genes, but the control motif show no such preference.We select motif cores (minimotifs) based on three conservation criteria inspired by theseconservation properties of known motifs.
for random motifs. Third, the Gal4 motif shows a higher conservation rate in divergent versus convergentintergenic regions (those that lie upstream versus downstream of both flanking genes); no such preferenceis seen for control motifs. These three observations suggest various ways to discover motifs based on theirconservation properties (see conservation criteria below).Based on these observations, we developed three computational tests that distinguish those patterns that
are under selective pressure for conservation. We then searched for candidate regulatory motifs whoseconservation is significantly higher according to the three conservation criteria below.
3.2.1. Conservation criterion 1 (CC1): Intergenic conservation. The first test evaluates the overallconservation throughout intergenic regions. The inspiration came from the conservation properties of theGal4 motif, namely, its strong overall intergenic conservation (Table 2). We searched for minimotifs thatshow similar conservation patterns by enumerating all 45,760 minimotifs.For every minimotif, we obtained the total count of intergenic instances i and the count of perfectly
conserved intergenic instances ic. We found that the two counts are linearly related for the vast majority ofmotifs at a given gap size. This allows us to estimate the basal conservation rate of minimotifs r and useit to evaluate the nonrandomness in the conservation of any one minimotif. If we assume that the chanceconservation of any one minimotif instance is independent of the conservation of any other motif instance,we can model the total number of conserved instances as a binomial process with success probability r,the basal minimotif conservation rate. The probability of observing ic successes out of i trials by chancealone is given by p(k) = (
iic
) · ric · (1− r)i−ic.For example, the Gal4 motif showed ic = 12 conserved instances out of i = 96 total instances (12.5%).
However, the 2,080 minimotifs at gap size 11 show an average conservation rate of 2.4%, and hence weestimate the probability that any intergenic instance be conserved to be r = 0.024. Under a binomialmodel, the probability that the Gal4 conservation is due to chance alone is less than 3 · 10−6.We applied this test systematically to all 45,760 minimotifs, to discover novel sequences with conserva-
tion patterns similar to Gal4. For each gap size, we estimated the basal conservation rate r in two steps. Inthe first step, we selected nonoutlier minimotifs as those within three standard deviations of the log-averageratio ic/i. We then calculated for every motif the binomial probability p of observing ic successes out ofi trials, given parameter r. We finally assigned a z-score S to every minimotif as the number of standarddeviations away from the mean of a normal distribution that correspond to tail area p. This score is positiveif the motif is conserved more frequently than random and negative if the motif is diverged more frequentlythan random.We found a number of minimotifs with striking conservation scores. For example, the top-ranked mini-
motif TCA-6-ACG was perfectly conserved in 397 intergenic regions (33% of all instances) and showed az-score of 37 standard deviations. This minimotif corresponds to the central portion of RTCRYnnnnnACG,the motif recognized by the Abf1 transcription factor. Minimotifs ranked 2, 3, and 5 (CGG-0-GTA, GGG-0-TAA, CGG-1-TAA); all had more than 300 conserved intergenic instances (33% of the total, z-scores
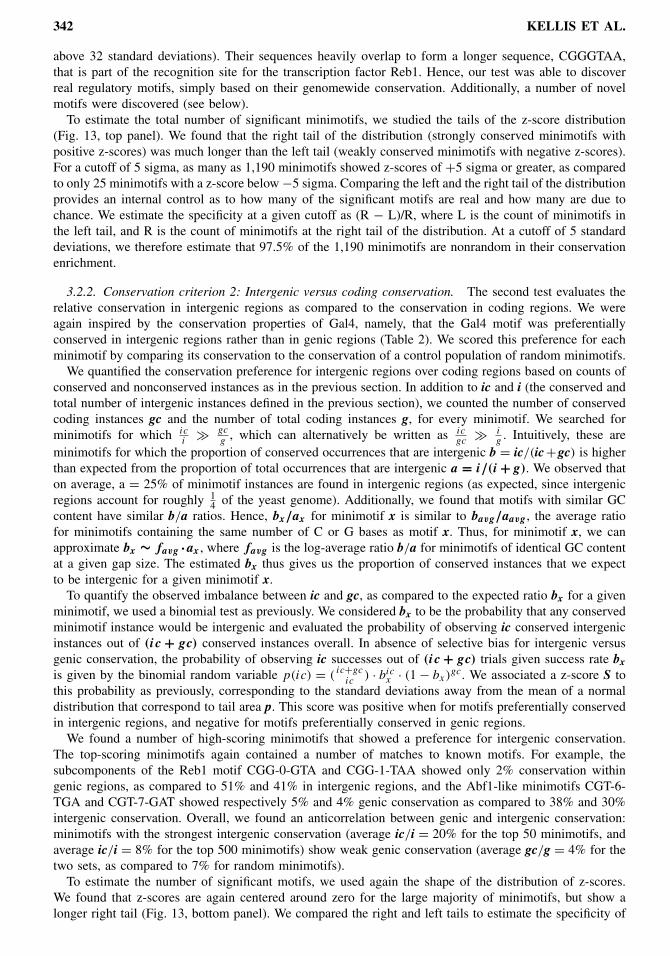
342 KELLIS ET AL.
above 32 standard deviations). Their sequences heavily overlap to form a longer sequence, CGGGTAA,that is part of the recognition site for the transcription factor Reb1. Hence, our test was able to discoverreal regulatory motifs, simply based on their genomewide conservation. Additionally, a number of novelmotifs were discovered (see below).To estimate the total number of significant minimotifs, we studied the tails of the z-score distribution
(Fig. 13, top panel). We found that the right tail of the distribution (strongly conserved minimotifs withpositive z-scores) was much longer than the left tail (weakly conserved minimotifs with negative z-scores).For a cutoff of 5 sigma, as many as 1,190 minimotifs showed z-scores of +5 sigma or greater, as comparedto only 25 minimotifs with a z-score below−5 sigma. Comparing the left and the right tail of the distributionprovides an internal control as to how many of the significant motifs are real and how many are due tochance. We estimate the specificity at a given cutoff as (R − L)/R, where L is the count of minimotifs inthe left tail, and R is the count of minimotifs at the right tail of the distribution. At a cutoff of 5 standarddeviations, we therefore estimate that 97.5% of the 1,190 minimotifs are nonrandom in their conservationenrichment.
3.2.2. Conservation criterion 2: Intergenic versus coding conservation. The second test evaluates therelative conservation in intergenic regions as compared to the conservation in coding regions. We wereagain inspired by the conservation properties of Gal4, namely, that the Gal4 motif was preferentiallyconserved in intergenic regions rather than in genic regions (Table 2). We scored this preference for eachminimotif by comparing its conservation to the conservation of a control population of random minimotifs.We quantified the conservation preference for intergenic regions over coding regions based on counts of
conserved and nonconserved instances as in the previous section. In addition to ic and i (the conserved andtotal number of intergenic instances defined in the previous section), we counted the number of conservedcoding instances gc and the number of total coding instances g, for every minimotif. We searched forminimotifs for which ic
i� gc
g, which can alternatively be written as ic
gc� i
g. Intuitively, these are
minimotifs for which the proportion of conserved occurrences that are intergenic b = ic/(ic+gc) is higherthan expected from the proportion of total occurrences that are intergenic a = i/(i +g). We observed thaton average, a = 25% of minimotif instances are found in intergenic regions (as expected, since intergenicregions account for roughly 1
4 of the yeast genome). Additionally, we found that motifs with similar GCcontent have similar b/a ratios. Hence, bx/ax for minimotif x is similar to bavg/aavg , the average ratiofor minimotifs containing the same number of C or G bases as motif x. Thus, for minimotif x, we canapproximate bx ∼ favg ·ax , where favg is the log-average ratio b/a for minimotifs of identical GC contentat a given gap size. The estimated bx thus gives us the proportion of conserved instances that we expectto be intergenic for a given minimotif x.To quantify the observed imbalance between ic and gc, as compared to the expected ratio bx for a given
minimotif, we used a binomial test as previously. We considered bx to be the probability that any conservedminimotif instance would be intergenic and evaluated the probability of observing ic conserved intergenicinstances out of (ic + gc) conserved instances overall. In absence of selective bias for intergenic versusgenic conservation, the probability of observing ic successes out of (ic + gc) trials given success rate bxis given by the binomial random variable p(ic) = (
ic+gcic
) · bicx · (1− bx)
gc. We associated a z-score S tothis probability as previously, corresponding to the standard deviations away from the mean of a normaldistribution that correspond to tail area p. This score was positive when for motifs preferentially conservedin intergenic regions, and negative for motifs preferentially conserved in genic regions.We found a number of high-scoring minimotifs that showed a preference for intergenic conservation.
The top-scoring minimotifs again contained a number of matches to known motifs. For example, thesubcomponents of the Reb1 motif CGG-0-GTA and CGG-1-TAA showed only 2% conservation withingenic regions, as compared to 51% and 41% in intergenic regions, and the Abf1-like minimotifs CGT-6-TGA and CGT-7-GAT showed respectively 5% and 4% genic conservation as compared to 38% and 30%intergenic conservation. Overall, we found an anticorrelation between genic and intergenic conservation:minimotifs with the strongest intergenic conservation (average ic/i = 20% for the top 50 minimotifs, andaverage ic/i = 8% for the top 500 minimotifs) show weak genic conservation (average gc/g = 4% for thetwo sets, as compared to 7% for random minimotifs).To estimate the number of significant motifs, we used again the shape of the distribution of z-scores.
We found that z-scores are again centered around zero for the large majority of minimotifs, but show alonger right tail (Fig. 13, bottom panel). We compared the right and left tails to estimate the specificity of
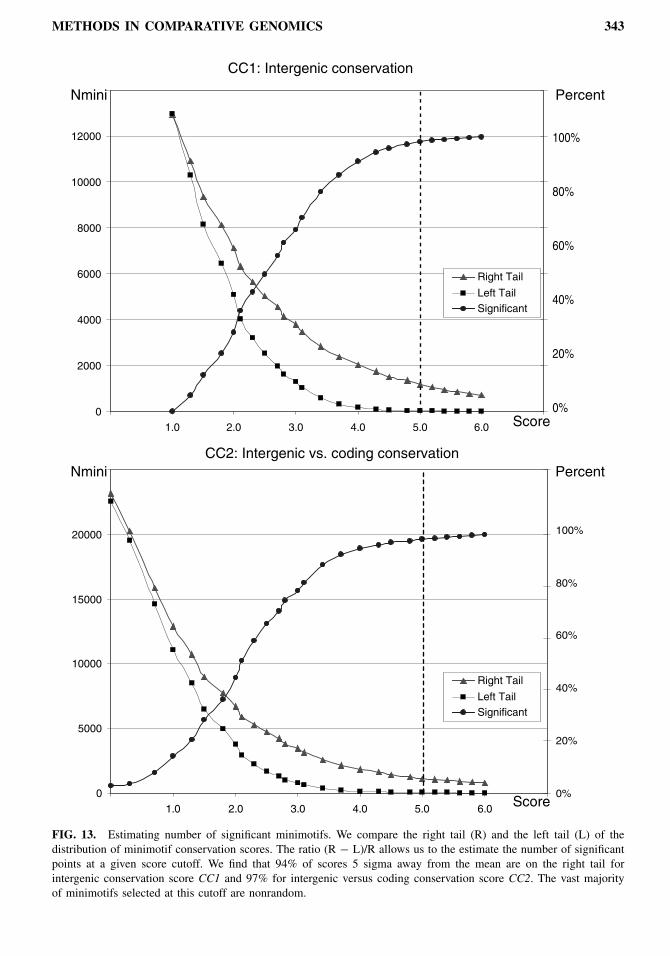
METHODS IN COMPARATIVE GENOMICS 343
FIG. 13. Estimating number of significant minimotifs. We compare the right tail (R) and the left tail (L) of thedistribution of minimotif conservation scores. The ratio (R − L)/R allows us to the estimate the number of significantpoints at a given score cutoff. We find that 94% of scores 5 sigma away from the mean are on the right tail forintergenic conservation score CC1 and 97% for intergenic versus coding conservation score CC2. The vast majorityof minimotifs selected at this cutoff are nonrandom.
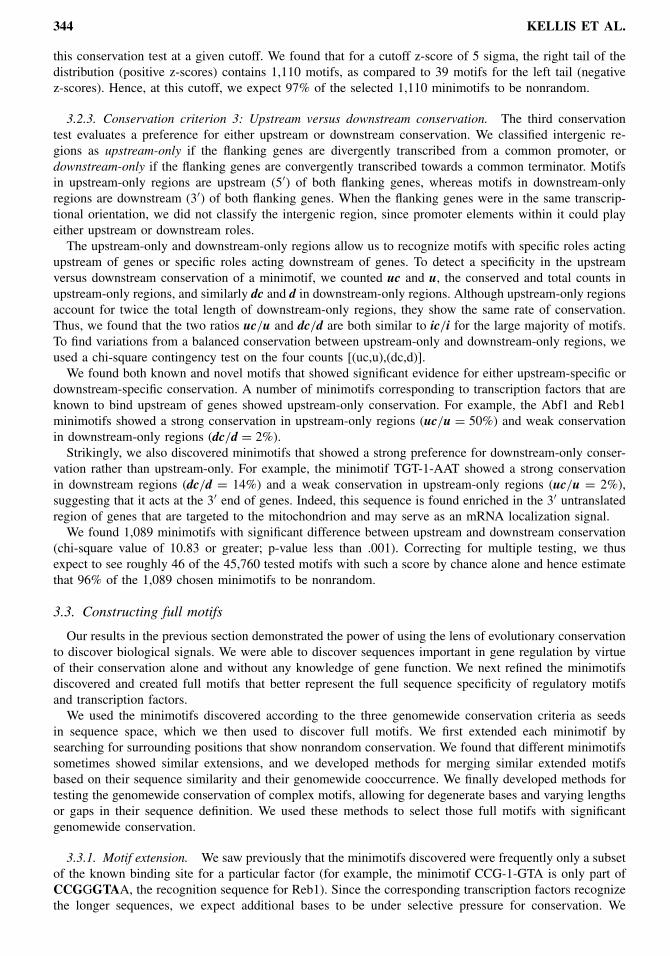
344 KELLIS ET AL.
this conservation test at a given cutoff. We found that for a cutoff z-score of 5 sigma, the right tail of thedistribution (positive z-scores) contains 1,110 motifs, as compared to 39 motifs for the left tail (negativez-scores). Hence, at this cutoff, we expect 97% of the selected 1,110 minimotifs to be nonrandom.
3.2.3. Conservation criterion 3: Upstream versus downstream conservation. The third conservationtest evaluates a preference for either upstream or downstream conservation. We classified intergenic re-gions as upstream-only if the flanking genes are divergently transcribed from a common promoter, ordownstream-only if the flanking genes are convergently transcribed towards a common terminator. Motifsin upstream-only regions are upstream (5′) of both flanking genes, whereas motifs in downstream-onlyregions are downstream (3′) of both flanking genes. When the flanking genes were in the same transcrip-tional orientation, we did not classify the intergenic region, since promoter elements within it could playeither upstream or downstream roles.The upstream-only and downstream-only regions allow us to recognize motifs with specific roles acting
upstream of genes or specific roles acting downstream of genes. To detect a specificity in the upstreamversus downstream conservation of a minimotif, we counted uc and u, the conserved and total counts inupstream-only regions, and similarly dc and d in downstream-only regions. Although upstream-only regionsaccount for twice the total length of downstream-only regions, they show the same rate of conservation.Thus, we found that the two ratios uc/u and dc/d are both similar to ic/i for the large majority of motifs.To find variations from a balanced conservation between upstream-only and downstream-only regions, weused a chi-square contingency test on the four counts [(uc,u),(dc,d)].We found both known and novel motifs that showed significant evidence for either upstream-specific or
downstream-specific conservation. A number of minimotifs corresponding to transcription factors that areknown to bind upstream of genes showed upstream-only conservation. For example, the Abf1 and Reb1minimotifs showed a strong conservation in upstream-only regions (uc/u = 50%) and weak conservationin downstream-only regions (dc/d = 2%).Strikingly, we also discovered minimotifs that showed a strong preference for downstream-only conser-
vation rather than upstream-only. For example, the minimotif TGT-1-AAT showed a strong conservationin downstream regions (dc/d = 14%) and a weak conservation in upstream-only regions (uc/u = 2%),suggesting that it acts at the 3′ end of genes. Indeed, this sequence is found enriched in the 3′ untranslatedregion of genes that are targeted to the mitochondrion and may serve as an mRNA localization signal.We found 1,089 minimotifs with significant difference between upstream and downstream conservation
(chi-square value of 10.83 or greater; p-value less than .001). Correcting for multiple testing, we thusexpect to see roughly 46 of the 45,760 tested motifs with such a score by chance alone and hence estimatethat 96% of the 1,089 chosen minimotifs to be nonrandom.
3.3. Constructing full motifs
Our results in the previous section demonstrated the power of using the lens of evolutionary conservationto discover biological signals. We were able to discover sequences important in gene regulation by virtueof their conservation alone and without any knowledge of gene function. We next refined the minimotifsdiscovered and created full motifs that better represent the full sequence specificity of regulatory motifsand transcription factors.We used the minimotifs discovered according to the three genomewide conservation criteria as seeds
in sequence space, which we then used to discover full motifs. We first extended each minimotif bysearching for surrounding positions that show nonrandom conservation. We found that different minimotifssometimes showed similar extensions, and we developed methods for merging similar extended motifsbased on their sequence similarity and their genomewide cooccurrence. We finally developed methods fortesting the genomewide conservation of complex motifs, allowing for degenerate bases and varying lengthsor gaps in their sequence definition. We used these methods to select those full motifs with significantgenomewide conservation.
3.3.1. Motif extension. We saw previously that the minimotifs discovered were frequently only a subsetof the known binding site for a particular factor (for example, the minimotif CCG-1-GTA is only part ofCCGGGTAA, the recognition sequence for Reb1). Since the corresponding transcription factors recognizethe longer sequences, we expect additional bases to be under selective pressure for conservation. We
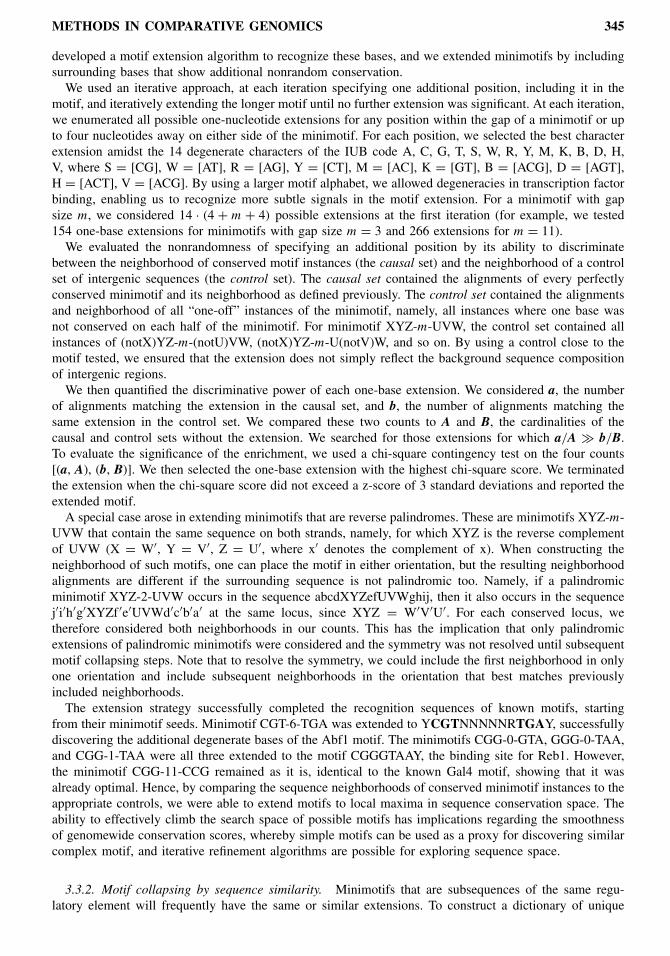
METHODS IN COMPARATIVE GENOMICS 345
developed a motif extension algorithm to recognize these bases, and we extended minimotifs by includingsurrounding bases that show additional nonrandom conservation.We used an iterative approach, at each iteration specifying one additional position, including it in the
motif, and iteratively extending the longer motif until no further extension was significant. At each iteration,we enumerated all possible one-nucleotide extensions for any position within the gap of a minimotif or upto four nucleotides away on either side of the minimotif. For each position, we selected the best characterextension amidst the 14 degenerate characters of the IUB code A, C, G, T, S, W, R, Y, M, K, B, D, H,V, where S = [CG], W = [AT], R = [AG], Y = [CT], M = [AC], K = [GT], B = [ACG], D = [AGT],H = [ACT], V = [ACG]. By using a larger motif alphabet, we allowed degeneracies in transcription factorbinding, enabling us to recognize more subtle signals in the motif extension. For a minimotif with gapsize m, we considered 14 · (4 + m + 4) possible extensions at the first iteration (for example, we tested154 one-base extensions for minimotifs with gap size m = 3 and 266 extensions for m = 11).We evaluated the nonrandomness of specifying an additional position by its ability to discriminate
between the neighborhood of conserved motif instances (the causal set) and the neighborhood of a controlset of intergenic sequences (the control set). The causal set contained the alignments of every perfectlyconserved minimotif and its neighborhood as defined previously. The control set contained the alignmentsand neighborhood of all “one-off” instances of the minimotif, namely, all instances where one base wasnot conserved on each half of the minimotif. For minimotif XYZ-m-UVW, the control set contained allinstances of (notX)YZ-m-(notU)VW, (notX)YZ-m-U(notV)W, and so on. By using a control close to themotif tested, we ensured that the extension does not simply reflect the background sequence compositionof intergenic regions.We then quantified the discriminative power of each one-base extension. We considered a, the number
of alignments matching the extension in the causal set, and b, the number of alignments matching thesame extension in the control set. We compared these two counts to A and B, the cardinalities of thecausal and control sets without the extension. We searched for those extensions for which a/A � b/B.To evaluate the significance of the enrichment, we used a chi-square contingency test on the four counts[(a, A), (b, B)]. We then selected the one-base extension with the highest chi-square score. We terminatedthe extension when the chi-square score did not exceed a z-score of 3 standard deviations and reported theextended motif.A special case arose in extending minimotifs that are reverse palindromes. These are minimotifs XYZ-m-
UVW that contain the same sequence on both strands, namely, for which XYZ is the reverse complementof UVW (X = W′, Y = V′, Z = U′, where x′ denotes the complement of x). When constructing theneighborhood of such motifs, one can place the motif in either orientation, but the resulting neighborhoodalignments are different if the surrounding sequence is not palindromic too. Namely, if a palindromicminimotif XYZ-2-UVW occurs in the sequence abcdXYZefUVWghij, then it also occurs in the sequencej′i′h′g′XYZf ′e′UVWd′c′b′a′ at the same locus, since XYZ = W′V′U′. For each conserved locus, wetherefore considered both neighborhoods in our counts. This has the implication that only palindromicextensions of palindromic minimotifs were considered and the symmetry was not resolved until subsequentmotif collapsing steps. Note that to resolve the symmetry, we could include the first neighborhood in onlyone orientation and include subsequent neighborhoods in the orientation that best matches previouslyincluded neighborhoods.The extension strategy successfully completed the recognition sequences of known motifs, starting
from their minimotif seeds. Minimotif CGT-6-TGA was extended to YCGTNNNNNRTGAY, successfullydiscovering the additional degenerate bases of the Abf1 motif. The minimotifs CGG-0-GTA, GGG-0-TAA,and CGG-1-TAA were all three extended to the motif CGGGTAAY, the binding site for Reb1. However,the minimotif CGG-11-CCG remained as it is, identical to the known Gal4 motif, showing that it wasalready optimal. Hence, by comparing the sequence neighborhoods of conserved minimotif instances to theappropriate controls, we were able to extend motifs to local maxima in sequence conservation space. Theability to effectively climb the search space of possible motifs has implications regarding the smoothnessof genomewide conservation scores, whereby simple motifs can be used as a proxy for discovering similarcomplex motif, and iterative refinement algorithms are possible for exploring sequence space.
3.3.2. Motif collapsing by sequence similarity. Minimotifs that are subsequences of the same regu-latory element will frequently have the same or similar extensions. To construct a dictionary of unique
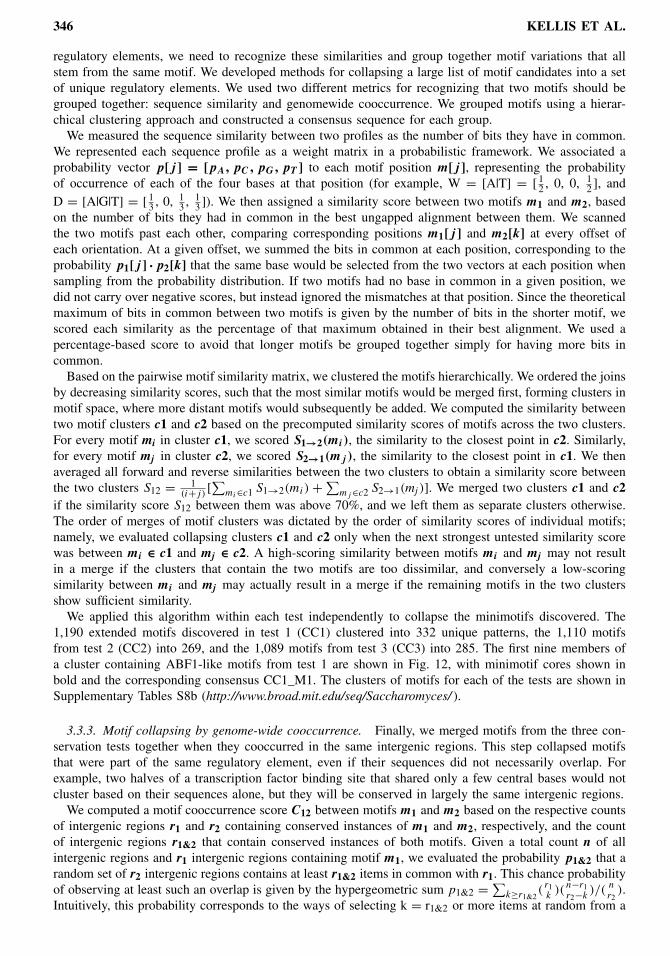
346 KELLIS ET AL.
regulatory elements, we need to recognize these similarities and group together motif variations that allstem from the same motif. We developed methods for collapsing a large list of motif candidates into a setof unique regulatory elements. We used two different metrics for recognizing that two motifs should begrouped together: sequence similarity and genomewide cooccurrence. We grouped motifs using a hierar-chical clustering approach and constructed a consensus sequence for each group.We measured the sequence similarity between two profiles as the number of bits they have in common.
We represented each sequence profile as a weight matrix in a probabilistic framework. We associated aprobability vector p[j ] = [pA, pC, pG, pT ] to each motif position m[j ], representing the probabilityof occurrence of each of the four bases at that position (for example, W = [A|T] = [ 12 , 0, 0,
12 ], and
D = [A|G|T] = [ 13 , 0,13 ,
13 ]). We then assigned a similarity score between two motifs m1 and m2, based
on the number of bits they had in common in the best ungapped alignment between them. We scannedthe two motifs past each other, comparing corresponding positions m1[j ] and m2[k] at every offset ofeach orientation. At a given offset, we summed the bits in common at each position, corresponding to theprobability p1[j ] ·p2[k] that the same base would be selected from the two vectors at each position whensampling from the probability distribution. If two motifs had no base in common in a given position, wedid not carry over negative scores, but instead ignored the mismatches at that position. Since the theoreticalmaximum of bits in common between two motifs is given by the number of bits in the shorter motif, wescored each similarity as the percentage of that maximum obtained in their best alignment. We used apercentage-based score to avoid that longer motifs be grouped together simply for having more bits incommon.Based on the pairwise motif similarity matrix, we clustered the motifs hierarchically. We ordered the joins
by decreasing similarity scores, such that the most similar motifs would be merged first, forming clusters inmotif space, where more distant motifs would subsequently be added. We computed the similarity betweentwo motif clusters c1 and c2 based on the precomputed similarity scores of motifs across the two clusters.For every motif mi in cluster c1, we scored S1→2(mi), the similarity to the closest point in c2. Similarly,for every motif mj in cluster c2, we scored S2→1(mj ), the similarity to the closest point in c1. We thenaveraged all forward and reverse similarities between the two clusters to obtain a similarity score betweenthe two clusters S12 = 1
(i+j)[∑mi∈c1 S1→2(mi) + ∑
mj ∈c2 S2→1(mj )]. We merged two clusters c1 and c2if the similarity score S12 between them was above 70%, and we left them as separate clusters otherwise.The order of merges of motif clusters was dictated by the order of similarity scores of individual motifs;namely, we evaluated collapsing clusters c1 and c2 only when the next strongest untested similarity scorewas between mi ∈ c1 and mj ∈ c2. A high-scoring similarity between motifs mi and mj may not resultin a merge if the clusters that contain the two motifs are too dissimilar, and conversely a low-scoringsimilarity between mi and mj may actually result in a merge if the remaining motifs in the two clustersshow sufficient similarity.We applied this algorithm within each test independently to collapse the minimotifs discovered. The
1,190 extended motifs discovered in test 1 (CC1) clustered into 332 unique patterns, the 1,110 motifsfrom test 2 (CC2) into 269, and the 1,089 motifs from test 3 (CC3) into 285. The first nine members ofa cluster containing ABF1-like motifs from test 1 are shown in Fig. 12, with minimotif cores shown inbold and the corresponding consensus CC1_M1. The clusters of motifs for each of the tests are shown inSupplementary Tables S8b (http://www.broad.mit.edu/seq/Saccharomyces/ ).
3.3.3. Motif collapsing by genome-wide cooccurrence. Finally, we merged motifs from the three con-servation tests together when they cooccurred in the same intergenic regions. This step collapsed motifsthat were part of the same regulatory element, even if their sequences did not necessarily overlap. Forexample, two halves of a transcription factor binding site that shared only a few central bases would notcluster based on their sequences alone, but they will be conserved in largely the same intergenic regions.We computed a motif cooccurrence score C12 between motifs m1 and m2 based on the respective counts
of intergenic regions r1 and r2 containing conserved instances of m1 and m2, respectively, and the countof intergenic regions r1&2 that contain conserved instances of both motifs. Given a total count n of allintergenic regions and r1 intergenic regions containing motif m1, we evaluated the probability p1&2 that arandom set of r2 intergenic regions contains at least r1&2 items in common with r1. This chance probabilityof observing at least such an overlap is given by the hypergeometric sum p1&2 = ∑
k≥r1&2(r1k)(
n−r1r2−k
)/(nr2
).Intuitively, this probability corresponds to the ways of selecting k = r1&2 or more items at random from a
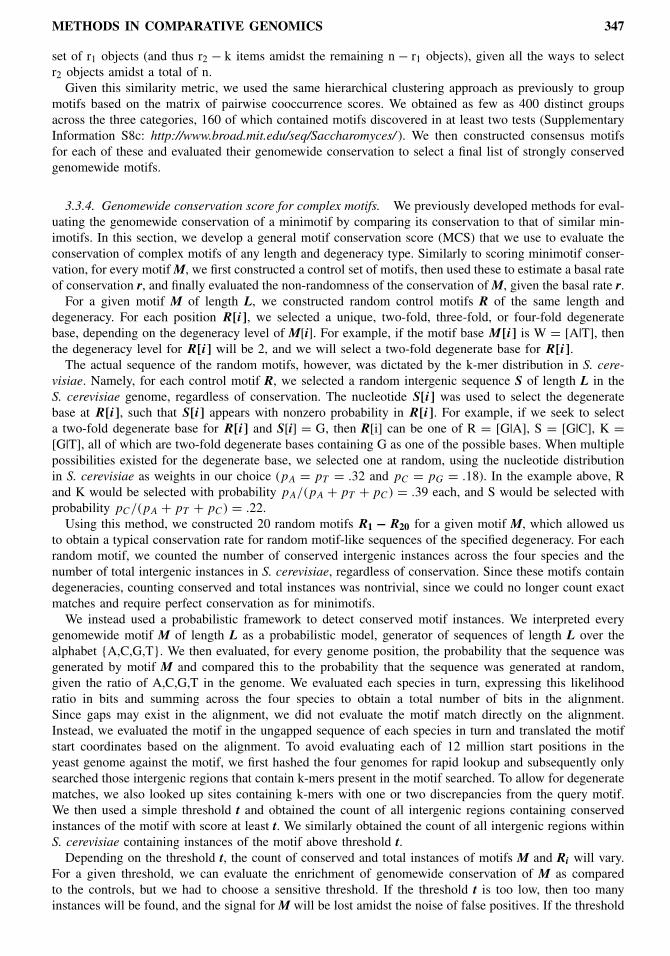
METHODS IN COMPARATIVE GENOMICS 347
set of r1 objects (and thus r2 − k items amidst the remaining n − r1 objects), given all the ways to selectr2 objects amidst a total of n.Given this similarity metric, we used the same hierarchical clustering approach as previously to group
motifs based on the matrix of pairwise cooccurrence scores. We obtained as few as 400 distinct groupsacross the three categories, 160 of which contained motifs discovered in at least two tests (SupplementaryInformation S8c: http://www.broad.mit.edu/seq/Saccharomyces/ ). We then constructed consensus motifsfor each of these and evaluated their genomewide conservation to select a final list of strongly conservedgenomewide motifs.
3.3.4. Genomewide conservation score for complex motifs. We previously developed methods for eval-uating the genomewide conservation of a minimotif by comparing its conservation to that of similar min-imotifs. In this section, we develop a general motif conservation score (MCS) that we use to evaluate theconservation of complex motifs of any length and degeneracy type. Similarly to scoring minimotif conser-vation, for every motif M, we first constructed a control set of motifs, then used these to estimate a basal rateof conservation r, and finally evaluated the non-randomness of the conservation of M, given the basal rate r.For a given motif M of length L, we constructed random control motifs R of the same length and
degeneracy. For each position R[i], we selected a unique, two-fold, three-fold, or four-fold degeneratebase, depending on the degeneracy level of M[i]. For example, if the motif base M[i] is W = [A|T], thenthe degeneracy level for R[i] will be 2, and we will select a two-fold degenerate base for R[i].The actual sequence of the random motifs, however, was dictated by the k-mer distribution in S. cere-
visiae. Namely, for each control motif R, we selected a random intergenic sequence S of length L in theS. cerevisiae genome, regardless of conservation. The nucleotide S[i] was used to select the degeneratebase at R[i], such that S[i] appears with nonzero probability in R[i]. For example, if we seek to selecta two-fold degenerate base for R[i] and S[i] = G, then R[i] can be one of R = [G|A], S = [G|C], K =[G|T], all of which are two-fold degenerate bases containing G as one of the possible bases. When multiplepossibilities existed for the degenerate base, we selected one at random, using the nucleotide distributionin S. cerevisiae as weights in our choice (pA = pT = .32 and pC = pG = .18). In the example above, Rand K would be selected with probability pA/(pA + pT + pC) = .39 each, and S would be selected withprobability pC/(pA + pT + pC) = .22.Using this method, we constructed 20 random motifs R1 − R20 for a given motif M, which allowed us
to obtain a typical conservation rate for random motif-like sequences of the specified degeneracy. For eachrandom motif, we counted the number of conserved intergenic instances across the four species and thenumber of total intergenic instances in S. cerevisiae, regardless of conservation. Since these motifs containdegeneracies, counting conserved and total instances was nontrivial, since we could no longer count exactmatches and require perfect conservation as for minimotifs.We instead used a probabilistic framework to detect conserved motif instances. We interpreted every
genomewide motif M of length L as a probabilistic model, generator of sequences of length L over thealphabet {A,C,G,T}. We then evaluated, for every genome position, the probability that the sequence wasgenerated by motif M and compared this to the probability that the sequence was generated at random,given the ratio of A,C,G,T in the genome. We evaluated each species in turn, expressing this likelihoodratio in bits and summing across the four species to obtain a total number of bits in the alignment.Since gaps may exist in the alignment, we did not evaluate the motif match directly on the alignment.Instead, we evaluated the motif in the ungapped sequence of each species in turn and translated the motifstart coordinates based on the alignment. To avoid evaluating each of 12 million start positions in theyeast genome against the motif, we first hashed the four genomes for rapid lookup and subsequently onlysearched those intergenic regions that contain k-mers present in the motif searched. To allow for degeneratematches, we also looked up sites containing k-mers with one or two discrepancies from the query motif.We then used a simple threshold t and obtained the count of all intergenic regions containing conservedinstances of the motif with score at least t. We similarly obtained the count of all intergenic regions withinS. cerevisiae containing instances of the motif above threshold t.Depending on the threshold t, the count of conserved and total instances of motifs M and Ri will vary.
For a given threshold, we can evaluate the enrichment of genomewide conservation of M as comparedto the controls, but we had to choose a sensitive threshold. If the threshold t is too low, then too manyinstances will be found, and the signal for M will be lost amidst the noise of false positives. If the threshold
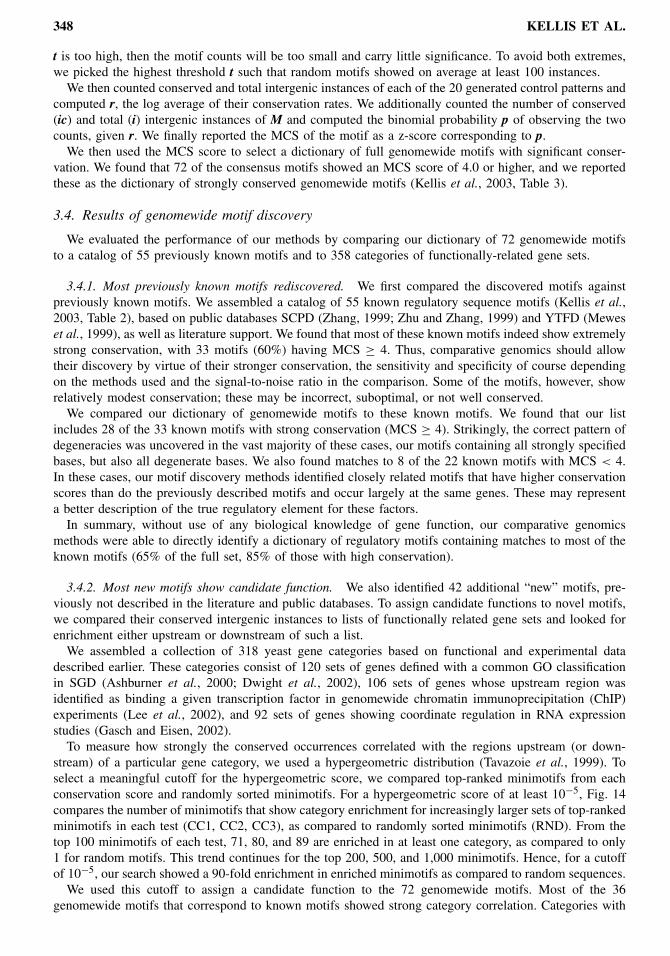
348 KELLIS ET AL.
t is too high, then the motif counts will be too small and carry little significance. To avoid both extremes,we picked the highest threshold t such that random motifs showed on average at least 100 instances.We then counted conserved and total intergenic instances of each of the 20 generated control patterns and
computed r, the log average of their conservation rates. We additionally counted the number of conserved(ic) and total (i) intergenic instances of M and computed the binomial probability p of observing the twocounts, given r. We finally reported the MCS of the motif as a z-score corresponding to p.We then used the MCS score to select a dictionary of full genomewide motifs with significant conser-
vation. We found that 72 of the consensus motifs showed an MCS score of 4.0 or higher, and we reportedthese as the dictionary of strongly conserved genomewide motifs (Kellis et al., 2003, Table 3).
3.4. Results of genomewide motif discovery
We evaluated the performance of our methods by comparing our dictionary of 72 genomewide motifsto a catalog of 55 previously known motifs and to 358 categories of functionally-related gene sets.
3.4.1. Most previously known motifs rediscovered. We first compared the discovered motifs againstpreviously known motifs. We assembled a catalog of 55 known regulatory sequence motifs (Kellis et al.,2003, Table 2), based on public databases SCPD (Zhang, 1999; Zhu and Zhang, 1999) and YTFD (Meweset al., 1999), as well as literature support. We found that most of these known motifs indeed show extremelystrong conservation, with 33 motifs (60%) having MCS ≥ 4. Thus, comparative genomics should allowtheir discovery by virtue of their stronger conservation, the sensitivity and specificity of course dependingon the methods used and the signal-to-noise ratio in the comparison. Some of the motifs, however, showrelatively modest conservation; these may be incorrect, suboptimal, or not well conserved.We compared our dictionary of genomewide motifs to these known motifs. We found that our list
includes 28 of the 33 known motifs with strong conservation (MCS ≥ 4). Strikingly, the correct pattern ofdegeneracies was uncovered in the vast majority of these cases, our motifs containing all strongly specifiedbases, but also all degenerate bases. We also found matches to 8 of the 22 known motifs with MCS < 4.In these cases, our motif discovery methods identified closely related motifs that have higher conservationscores than do the previously described motifs and occur largely at the same genes. These may representa better description of the true regulatory element for these factors.In summary, without use of any biological knowledge of gene function, our comparative genomics
methods were able to directly identify a dictionary of regulatory motifs containing matches to most of theknown motifs (65% of the full set, 85% of those with high conservation).
3.4.2. Most new motifs show candidate function. We also identified 42 additional “new” motifs, pre-viously not described in the literature and public databases. To assign candidate functions to novel motifs,we compared their conserved intergenic instances to lists of functionally related gene sets and looked forenrichment either upstream or downstream of such a list.We assembled a collection of 318 yeast gene categories based on functional and experimental data
described earlier. These categories consist of 120 sets of genes defined with a common GO classificationin SGD (Ashburner et al., 2000; Dwight et al., 2002), 106 sets of genes whose upstream region wasidentified as binding a given transcription factor in genomewide chromatin immunoprecipitation (ChIP)experiments (Lee et al., 2002), and 92 sets of genes showing coordinate regulation in RNA expressionstudies (Gasch and Eisen, 2002).To measure how strongly the conserved occurrences correlated with the regions upstream (or down-
stream) of a particular gene category, we used a hypergeometric distribution (Tavazoie et al., 1999). Toselect a meaningful cutoff for the hypergeometric score, we compared top-ranked minimotifs from eachconservation score and randomly sorted minimotifs. For a hypergeometric score of at least 10−5, Fig. 14compares the number of minimotifs that show category enrichment for increasingly larger sets of top-rankedminimotifs in each test (CC1, CC2, CC3), as compared to randomly sorted minimotifs (RND). From thetop 100 minimotifs of each test, 71, 80, and 89 are enriched in at least one category, as compared to only1 for random motifs. This trend continues for the top 200, 500, and 1,000 minimotifs. Hence, for a cutoffof 10−5, our search showed a 90-fold enrichment in enriched minimotifs as compared to random sequences.We used this cutoff to assign a candidate function to the 72 genomewide motifs. Most of the 36
genomewide motifs that correspond to known motifs showed strong category correlation. Categories with
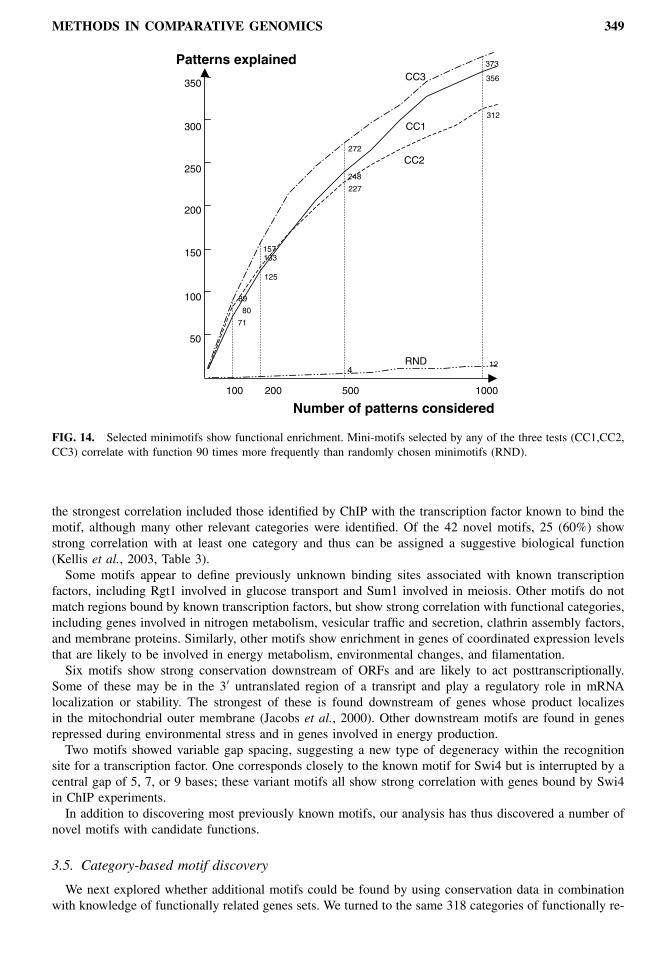
METHODS IN COMPARATIVE GENOMICS 349
FIG. 14. Selected minimotifs show functional enrichment. Mini-motifs selected by any of the three tests (CC1,CC2,CC3) correlate with function 90 times more frequently than randomly chosen minimotifs (RND).
the strongest correlation included those identified by ChIP with the transcription factor known to bind themotif, although many other relevant categories were identified. Of the 42 novel motifs, 25 (60%) showstrong correlation with at least one category and thus can be assigned a suggestive biological function(Kellis et al., 2003, Table 3).Some motifs appear to define previously unknown binding sites associated with known transcription
factors, including Rgt1 involved in glucose transport and Sum1 involved in meiosis. Other motifs do notmatch regions bound by known transcription factors, but show strong correlation with functional categories,including genes involved in nitrogen metabolism, vesicular traffic and secretion, clathrin assembly factors,and membrane proteins. Similarly, other motifs show enrichment in genes of coordinated expression levelsthat are likely to be involved in energy metabolism, environmental changes, and filamentation.Six motifs show strong conservation downstream of ORFs and are likely to act posttranscriptionally.
Some of these may be in the 3′ untranslated region of a transript and play a regulatory role in mRNAlocalization or stability. The strongest of these is found downstream of genes whose product localizesin the mitochondrial outer membrane (Jacobs et al., 2000). Other downstream motifs are found in genesrepressed during environmental stress and in genes involved in energy production.Two motifs showed variable gap spacing, suggesting a new type of degeneracy within the recognition
site for a transcription factor. One corresponds closely to the known motif for Swi4 but is interrupted by acentral gap of 5, 7, or 9 bases; these variant motifs all show strong correlation with genes bound by Swi4in ChIP experiments.In addition to discovering most previously known motifs, our analysis has thus discovered a number of
novel motifs with candidate functions.
3.5. Category-based motif discovery
We next explored whether additional motifs could be found by using conservation data in combinationwith knowledge of functionally related genes sets. We turned to the same 318 categories of functionally re-
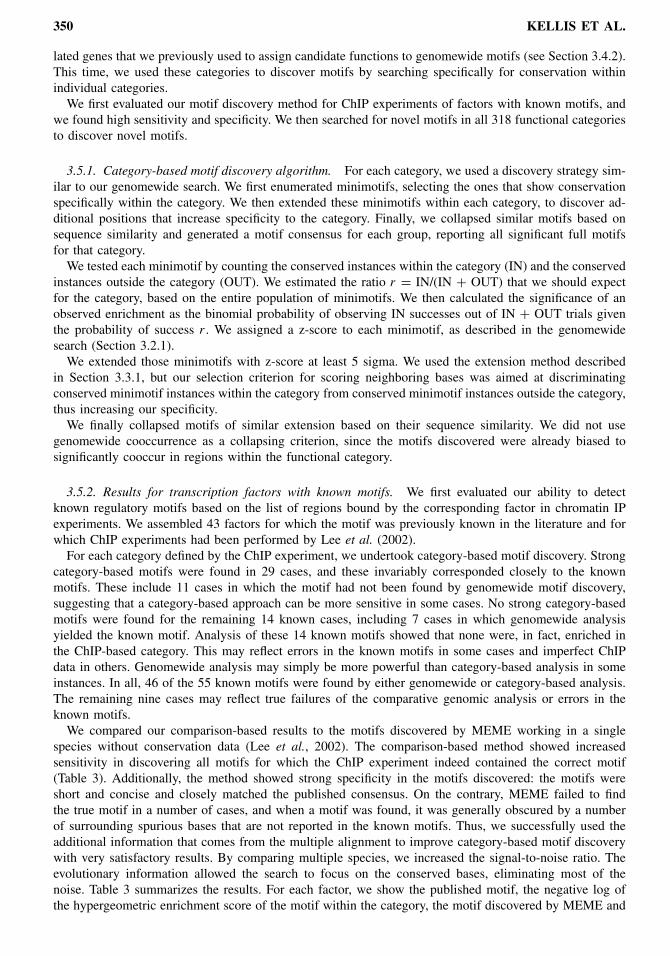
350 KELLIS ET AL.
lated genes that we previously used to assign candidate functions to genomewide motifs (see Section 3.4.2).This time, we used these categories to discover motifs by searching specifically for conservation withinindividual categories.We first evaluated our motif discovery method for ChIP experiments of factors with known motifs, and
we found high sensitivity and specificity. We then searched for novel motifs in all 318 functional categoriesto discover novel motifs.
3.5.1. Category-based motif discovery algorithm. For each category, we used a discovery strategy sim-ilar to our genomewide search. We first enumerated minimotifs, selecting the ones that show conservationspecifically within the category. We then extended these minimotifs within each category, to discover ad-ditional positions that increase specificity to the category. Finally, we collapsed similar motifs based onsequence similarity and generated a motif consensus for each group, reporting all significant full motifsfor that category.We tested each minimotif by counting the conserved instances within the category (IN) and the conserved
instances outside the category (OUT). We estimated the ratio r = IN/(IN + OUT) that we should expectfor the category, based on the entire population of minimotifs. We then calculated the significance of anobserved enrichment as the binomial probability of observing IN successes out of IN + OUT trials giventhe probability of success r . We assigned a z-score to each minimotif, as described in the genomewidesearch (Section 3.2.1).We extended those minimotifs with z-score at least 5 sigma. We used the extension method described
in Section 3.3.1, but our selection criterion for scoring neighboring bases was aimed at discriminatingconserved minimotif instances within the category from conserved minimotif instances outside the category,thus increasing our specificity.We finally collapsed motifs of similar extension based on their sequence similarity. We did not use
genomewide cooccurrence as a collapsing criterion, since the motifs discovered were already biased tosignificantly cooccur in regions within the functional category.
3.5.2. Results for transcription factors with known motifs. We first evaluated our ability to detectknown regulatory motifs based on the list of regions bound by the corresponding factor in chromatin IPexperiments. We assembled 43 factors for which the motif was previously known in the literature and forwhich ChIP experiments had been performed by Lee et al. (2002).For each category defined by the ChIP experiment, we undertook category-based motif discovery. Strong
category-based motifs were found in 29 cases, and these invariably corresponded closely to the knownmotifs. These include 11 cases in which the motif had not been found by genomewide motif discovery,suggesting that a category-based approach can be more sensitive in some cases. No strong category-basedmotifs were found for the remaining 14 known cases, including 7 cases in which genomewide analysisyielded the known motif. Analysis of these 14 known motifs showed that none were, in fact, enriched inthe ChIP-based category. This may reflect errors in the known motifs in some cases and imperfect ChIPdata in others. Genomewide analysis may simply be more powerful than category-based analysis in someinstances. In all, 46 of the 55 known motifs were found by either genomewide or category-based analysis.The remaining nine cases may reflect true failures of the comparative genomic analysis or errors in theknown motifs.We compared our comparison-based results to the motifs discovered by MEME working in a single
species without conservation data (Lee et al., 2002). The comparison-based method showed increasedsensitivity in discovering all motifs for which the ChIP experiment indeed contained the correct motif(Table 3). Additionally, the method showed strong specificity in the motifs discovered: the motifs wereshort and concise and closely matched the published consensus. On the contrary, MEME failed to findthe true motif in a number of cases, and when a motif was found, it was generally obscured by a numberof surrounding spurious bases that are not reported in the known motifs. Thus, we successfully used theadditional information that comes from the multiple alignment to improve category-based motif discoverywith very satisfactory results. By comparing multiple species, we increased the signal-to-noise ratio. Theevolutionary information allowed the search to focus on the conserved bases, eliminating most of thenoise. Table 3 summarizes the results. For each factor, we show the published motif, the negative log ofthe hypergeometric enrichment score of the motif within the category, the motif discovered by MEME and
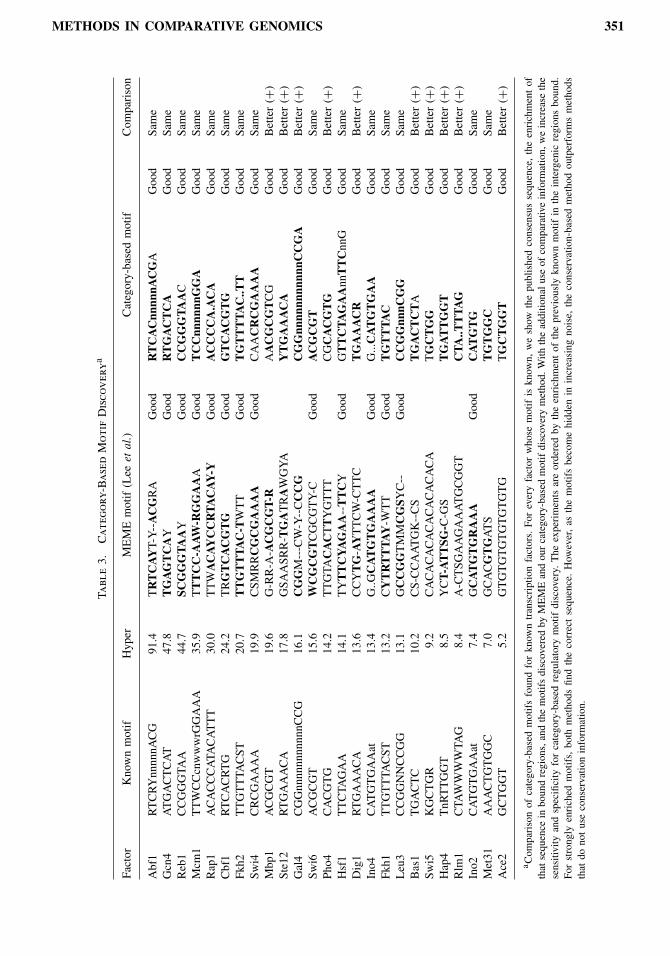
METHODS IN COMPARATIVE GENOMICS 351
Table3.
Category-Based
MotifDiscovery
a
Factor
Knownmotif
Hyper
MEMEmotif(Leeetal.)
Category-basedmotif
Com
parison
Abf1
RTCRYnnnnnACG
91.4
TRTCAYT-Y--ACGRA
Good
RTCACnn
nnnA
CGA
Good
Same
Gcn4
ATGACTCAT
47.8
TGAGTCAY
Good
RTGACTCA
Good
Same
Reb1
CCGGGTA
A44.7
SCGGGTAAY
Good
CCGGGTAAC
Good
Same
Mcm1
TTWCCcnwwwrGGAAA
35.9
TTTCC-A
AW-R
GGAAA
Good
TCCnn
nnnn
GGA
Good
Same
Rap1
ACACCCATACATTT
30.0
TTWACAYCCRTACAY-Y
Good
ACCCCA.ACA
Good
Same
Cbf1
RTCACRTG
24.2
TRGTCACGTG
Good
GTCACGTG
Good
Same
Fkh2
TTGTTTACST
20.7
TTGTTTAC-TWTT
Good
TGTTTTAC..T
TGood
Same
Swi4
CRCGAAAA
19.9
CSM
RRCGCGAAAA
Good
CAACRCGAAAA
Good
Same
Mbp1
ACGCGT
19.6
G-RR-A-A
CGCGT-R
AACGCGTCG
Good
Better(+)
Ste12
RTGAAACA
17.8
GSA
ASR
R-T
GATRAWGYA
YTGAAACA
Good
Better(+)
Gal4
CGGnnnnnnnnnnnCCG
16.1
CGGM---CW-Y--CCCG
CGGnn
nnnn
nnnn
nCCGA
Good
Better(+)
Swi6
ACGCGT
15.6
WCGCGTCGCGTY-C
Good
ACGCGT
Good
Same
Pho4
CACGTG
14.2
TTGTA
CACTTYGTTT
CGCACGTG
Good
Better(+)
Hsf1
TTCTAGAA
14.1
TYTTCYAGAA--TTCY
Good
GTTCTAGAAnn
TTCnnG
Good
Same
Dig1
RTGAAACA
13.6
CCYTG-AYTTCW-CTTC
TGAAACR
Good
Better(+)
Ino4
CATGTGAAat
13.4
G..G
CATGTGAAAA
Good
G...CATGTGAA
Good
Same
Fkh1
TTGTTTACST
13.2
CYTRTTTAY-W
TT
Good
TGTTTAC
Good
Same
Leu3
CCGGNNCCGG
13.1
GCCGGTMMCGSY
C--
Good
CCGGnn
nCGG
Good
Same
Bas1
TGACTC
10.2
CS-CCAATGK--CS
TGACTCTA
Good
Better(+)
Swi5
KGCTGR
9.2
CACACACACACACACACA
TGCTGG
Good
Better(+)
Hap4
TnRTTGGT
8.5
YCT-ATTSG
-C-GS
TGATTGGT
Good
Better(+)
Rlm1
CTAWWWWTAG
8.4
A-CTSG
AAGAAATGCGGT
CTA..T
TTAG
Good
Better(+)
Ino2
CATGTGAAat
7.4
GCATGTGRAAA
Good
CATGTG
Good
Same
Met31
AAACTGTGGC
7.0
GCACGTGATS
TGTGGC
Good
Same
Ace2
GCTGGT
5.2
GTGTGTGTGTGTGTG
TGCTGGT
Good
Better(+)
a Com
parisonofcategory-based
motifsfoundforknowntranscriptionfactors.Foreveryfactorwhosemotifisknown,weshow
thepublishedconsensussequence,theenrichmentof
thatsequenceinboundregions,andthemotifsdiscovered
byMEMEandourcategory-based
motifdiscoverymethod.With
theadditionaluseofcomparativeinformation,weincreasethe
sensitivityandspecificityforcategory-based
regulatorymotifdiscovery.The
experimentsareorderedby
theenrichmentofthepreviouslyknownmotifintheintergenicregionsbound.
Forstronglyenriched
motifs,bothmethods
findthecorrectsequence.However,asthemotifsbecomehidden
inincreasing
noise,theconservation-basedmethodoutperformsmethods
thatdo
notuseconservationinformation.
352 KELLIS ET AL.
a quality assessment, the motif discovered by our method, as well as the corresponding category-basedscore and a quality assessment, and finally, the comparison of our method to MEME. The performance ofMEME degraded for less enriched motifs, but our comparison-based method consistently found the correctmotif.
3.5.3. New category-based motifs found. We then applied the approach to all 318 gene categories.A total of 181 enriched motifs were identified, with similar motifs arising frequently from different cate-gories. Merging such motifs resulted in 52 distinct motifs, of which 43 were already found by the analysesdescribed above. The remaining nine motifs represent new category-based motifs (Kellis et al., 2003,Table 4.3), including the following.Three novel motifs are associated with genes that are bound by the transcription factors Rap1, Ste12,
and Cin5, respectively. Rap1 is known to bind incomplete or degenerate instances of the published motif,and the new motif may confer additional specificity. The motif associated with Ste12 is the known bindingsite for the partner transcription factor Tec1, suggesting that Ste12 binding is strongly associated with itspartner under the conditions examined. Similarly, the novel motif associated with Cin5 may be that ofa partner transcription factor. Three novel motifs are associated with the GO category for carbohydratetransport, fatty-acid oxidation, and glycolysis–glycogenesis, respectively. Three novel motifs are associatedwith an expression cluster (cluster 37) that includes many genes involved in energy metabolism and stressresponse.
3.5.4. Motif reuse across multiple categories. Category-based motif discovery contributes only a mod-est number of additional motifs beyond those found by genomewide analysis, confirming the relativelysmall number of regulatory motifs in yeast. Such a limited count is surprising, given the large number ofcoordinately transcribed processes in yeast.Additionally, the motifs discovered across different categories largely overlap. Each motif was discovered
on average in three different categories. This overlap is certainly to be expected between functionally relatedcategories, such as the chromatin IP experiment for Gcn4 and the expression cluster of genes involvedin amino acid biosynthesis, as well as the GO annotations for amino acid biosynthesis, all of which areenriched in the Gcn4 motif, the master regulator of amino acid metabolism.More surprisingly, however, different transcription factors are often enriched in the same motif (which
may be due to cooperative binding), and the same motif appears enriched in multiple expression clustersand functional categories. For example, Cbf1, Met4, and Met31 share a motif, and so do Hsf1, Msn2and Msn4; Fkh1 and Fkh2; Fhl1 and Rap1; Ste12 and Dig1; Swi5 and Ace2; Swi6, Swi4, Ash1 andMbp1. Also, a single motif involved in environmental stress response is discovered repeatedly in numerousexpression clusters and in functional categories ranging from secretion, cell organization and biogenesis,transcription, ribosome biogenesis, and rRNA processing.Hence, the set of regulatory motifs that are specific to exactly one functional category seems limited.
This can hamper category-based motif discovery methods, when a category will rarely be enriched in onlyone motif and a motif will rarely be enriched in only one category.Additionally, a category-based approach faces a number of inherent experimental limitations. On one
hand, the expression clusters we have used, although constructed over an impressive array of experiments,are still limited to the relatively few experimental conditions characterized in the lab, as compared tothe versatility of responses yeast cells undergo in nature. Similarly, the functional categories we used arelimited to the few well-characterized processes in yeast, and the molecular function of nearly two thousandgenes remains unknown.A genomewide approach presents a new and powerful paradigm to understanding the dictionary of
regulatory motifs. By discovering in an unbiased way the complete set of conserved sequence elements,we now have the building blocks for subsequent analyses of regulation.An important future direction will be the understanding of the versatility of fine-grain gene regulation
given a small number of regulatory motifs. Such a versatility may be rooted in a combinatorial control ofgene expression, and understanding motif combinations rather than individual motifs will be crucial in thisexploration. Additionally, as chromatin state information becomes available, understanding the large-scaleeffects of histone modifications and chromatin structure in yeast will prove invaluable in our study ofhigher eukaryotes.
METHODS IN COMPARATIVE GENOMICS 353
4. CONCLUSION
Our results show that comparative analysis with closely related species can be invaluable in under-standing a genome. Comparisons reveal the way different regions change and the constraints they face,providing clues as to their use. Even in a genome as compact and well studied as that of S. cerevisiae,much remains to be learned about the gene content. We found that nearly a tenth of all annotated genesare spurious, adjusted the boundaries of hundreds of genes, and discovered 43 new short genes and 58novel introns. Moreover, our comparisons have enabled a glimpse into the dynamic nature of the cell, bydiscovering a complete set of regulatory motifs in a de novo way, without knowledge of gene function.Our methods rediscovered most previously known regulatory motifs as well as a number of novel motifswith candidate functions. Such regulatory signals are present within the primary sequence of S. cerevisiae,but represent only a small fraction of all intergenic regions. Under the lens of evolutionary conserva-tion, these signals stand out from the nonconserved noise. Hence, in studying any genome, comparativeanalysis of closely related species can provide the basis for a global understanding of all functionalelements.
5. ACKNOWLEDGMENTS
We would like to acknowledge the continuous help of the SGD curators and in particular Mike Cherry,Kara Dolinski, and Dianna Fisk. We thank Tony Lee, Nicola Rinaldi, Rick Young, and Julia Zeitlingerfor discussions and for providing prepublication chromatin immunoprecipitation data. We thank MikeEisen and Audrey Gasch for discussions and for providing prepublication clusters of expression data.We thank Jon Butler, Sarah Calvo, Matt Endrizzi, James Galagan, David Jaffe, Joseph Lehar, Li-JunMa, and all the people at the MIT/Whitehead Institute Center for Genome Research for their help anddiscussions. We thank Ziv Bar-Joseph, John Barnett, Tim Danford, David Gifford, and Tommi Jaakkolain the MIT Computer Science and Artificial Intelligence Laboratory, and Gerry Fink, Ernest Fraenkel,Ben Gordon, Trey Ideker, Sue Lindquist, and Owen Ozier in the Whitehead Institute for their help anddiscussions.
REFERENCES
Altschul, S.F., Gish, W., Miller, W., Myers, E.W., and Lipman, D.J. 1990. Basic local alignment search tool. J. Mol.Biol. 215, 403–410.
Ashburner, M., Ball, C.A., Blake, J.A., Botstein, D., Butler, H., Cherry, J.M., Davis, A.P., Dolinski, K., Dwight,S.S., Eppig, J.T., Harris, M.A., Hill, D.P., Issel-Tarver, L., Kasarskis, A., Lewis, S., Matese, J.C., Richardson, J.E.,Ringwald, M., Rubin, G.M., and Sherlock, G. 2000. Gene ontology: Tool for the unification of biology. The GeneOntology Consortium. Nature Genet. 25, 25–29.
Bailey, T.L., and Elkan, C. 1994. Fitting a mixture model by expectation maximization to discover motifs in biopoly-mers. Proc. Int. Conf. Intell. Syst. Mol. Biol. 2, 28–36.
Batzoglou, S., Jaffe, D.B., Stanley, K., Butler, J., Gnerre, S., Mauceli, E., Berger, B., Mesirov, J.P., and Lander, E.S.2002. ARACHNE: A whole-genome shotgun assembler. Genome Res. 12, 177–189.
Batzoglou, S., Pachter, L., Mesirov, J.P., Berger, B., and Lander, E.S. 2000. Human and mouse gene structure: Com-parative analysis and application to exon prediction. Genome Res. 10, 950–958.
Blanchette, M., Schwikowski, B., and Tompa, M. 2002. Algorithms for phylogenetic footprinting. J. Comp. Biol. 9,211–223.
Blanchette, M., and Tompa, M. 2002. Discovery of regulatory elements by a computational method for phylogeneticfootprinting. Genome Res. 12, 739–748.
Blandin, G., Durrens, P., Tekaia, F., Aigle, M., Bolotin-Fukuhara, M., Bon, E., Casaregola, S., de Montigny, J.,Gaillardin, C., Lepingle, A., Llorente, B., Malpertuy, A., Neuveglise, C., Ozier-Kalogeropoulos, O., Perrin, A.,Potier, S., Souciet, J., Talla, E., Toffano-Nioche, C., Wesolowski-Louvel, M., Marck, C., and Dujon, B. 2000.Genomic exploration of the hemiascomycetous yeasts: 4. The genome of Saccharomyces cerevisiae revisited. FEBSLett. 487, 31–36.
Clark, T.A., Sugnet, C.W., and Ares Jr., M. 2002. Genomewide analysis of mRNA processing in yeast using splicing-specific microarrays. Science 296, 907–910.
354 KELLIS ET AL.
Dujon, B., Alexandraki, D., Andre, B., Ansorge, W., Baladron, V., Ballesta, J.P., Banrevi, A., Bolle, P.A., Bolotin-Fukuhara, M., Bossier, P., et al. 1994. Complete DNA sequence of yeast chromosome XI. Nature 369, 371–378.
Dunham, I. 2000. The gene guessing game. Yeast 17, 218–224.Dwight, S.S., Harris, M.A., Dolinski, K., Ball, C.A., Binkley, G., Christie, K.R., Fisk, D.G., Issel-Tarver, L., Schroeder,M., Sherlock, G., Sethuraman, A., Weng, S., Botstein, D., and Cherry, J.M. 2002. Saccharomyces Genome Database(SGD) provides secondary gene annotation using the Gene Ontology (GO). Nucl. Acids Res. 30, 69–72.
Fitch, W.M. 1970. Distinguishing homologous from analogous proteins. Syst. Zool. 19, 99–113.Fitch, W.M. 1995. Uses for evolutionary trees. Philos. Trans. R. Soc. Lond. B Biol. Sci. 349, 93–102.Gasch, A.P., and Eisen, M.B. 2002. Exploring the conditional coregulation of yeast gene expression through fuzzyk-means clustering. Genome Biol. 3, RESEARCH0059.
Gelfand, M.S., Koonin, E.V., and Mironov, A.A. 2000. Prediction of transcription regulatory sites in Archaea by acomparative genomic approach. Nucl. Acids Res. 28, 695–705.
Goffeau, A., Barrell, B.G., Bussey, H., Davis, R.W., Dujon, B., Feldmann, H., Galibert, F., Hoheisel, J.D., Jacq, C.,Johnston, M., Louis, E.J., Mewes, H.W., Murakami, Y., Philippsen, P., Tettelin, H., and Oliver, S.G. 1996. Life with6000 genes. Science 274, 546, 563–547.
Grundy, W.N., Bailey. T.L., Elkan, C.P., and Baker, M.E. 1997. Meta-MEME: Motif-based hidden Markov models ofprotein families. Comput. Appl. Biosci. 13, 397–406.
Hampson, S., Kibler, D., and Baldi, P. 2002. Distribution patterns of over-represented k-mers in non-coding yeastDNA. Bioinformatics 18, 513–528.
Harrison, P.M., Kumar, A., Lang, N., Snyder, M., and Gerstein, M. 2002. A question of size: the eukaryotic proteomeand the problems in defining it. Nucl. Acids Res. 30, 1083–1090.
Hughes, J.D., Estep, P.W., Tavazoie, S., and Church, G.M. 2000. Computational identification of cis-regulatory ele-ments associated with groups of functionally related genes in Saccharomyces cerevisiae. J. Mol. Biol. 296, 1205–1214.
Hurst, L.D. 2002. The Ka/Ks ratio: Diagnosing the form of sequence evolution. Trends Genet. 18, 486.International Human Genome Sequencing Consortium. 2001. Initial sequencing and analysis of the human genome.Nature, 860–921.
International Mouse Genome Consortium. 2002. Initial sequencing and comparative analysis of the mouse genome.Nature 420, 520–562.
Jacobs Anderson, J.S., and Parker, R. 2000. Computational identification of cis-acting elements affecting post-transcriptional control of gene expression in Saccharomyces cerevisiae. Nucl. Acids Res. 28, 1604–1617.
Jaffe, D.B., Butler, J., Gnerre, S., Mauceli, E., Lindblad-Toh, K., Mesirov, J.P., Zody, M.C., and Lander, E.S. 2003.Whole-genome sequence assembly for Mammalian genomes: Arachne 2. Genome Res. 13, 91–96.
Jiao, K., Nau, J.J., Cool, M., Gray, W.M., Fassler, J.S., and Malone, R.E. 2002. Phylogenetic footprinting revealsmultiple regulatory elements involved in control of the meiotic recombination gene, REC102. Yeast 19, 99–114.
Kellis, M., Patterson, N., Endrizzi, M., Birren, B., and Lander, E.S. 2003. Sequencing and comparison of yeast speciesto identify genes and regulatory elements. Nature 423, 241–254.
Kowalczuk, M., Mackiewicz, P., Gierlik, A., Dudek, M.R., and Cebrat, S. 1999. Total number of coding open readingframes in the yeast genome. Yeast 15, 1031–1034.
Lawrence, C.E., Altschul, S.F., Boguski, M.S., Liu, J.S., Neuwald, A.F., and Wootton, J.C. 1993. Detecting subtlesequence signals: A Gibbs sampling strategy for multiple alignment. Science 262, 208–214.
Lee, T.I., Rinaldi, N.J., Robert, F., Odom, D.T., Bar-Joseph, Z., Gerber, G.K., Hannett, N.M., Harbison, C.T., Thompson,C.M., Simon, I., Zeitlinger, J., Jennings, E.G., Murray, H.L., Gordon, D.B., Ren, B., Wyrick, J.J., Tagne, J.B., Volkert,T.L., Fraenkel, E., Gifford, D.K., and Young, R.A. 2002. Transcriptional regulatory networks in Saccharomycescerevisiae. Science 298, 799–804.
Levy, S., and Hannenhalli, S. 2002. Identification of transcription factor binding sites in the human genome sequence.Mamm. Genome 13, 510–514.
Liang, F., Holt, I., Pertea, G., Karamycheva, S., Salzberg, S.L., and Quackenbush, J. 2000. Gene index analysis of thehuman genome estimates approximately 120,000 genes. Nat. Genet. 25, 239–240.
Liu, X., Brutlag, D.L., and Liu, J.S. 2001. BioProspector: Discovering conserved DNA motifs in upstream regulatoryregions of co-expressed genes. Pac. Symp. Biocomput., 127–138.
Loots, G.G., Ovcharenko, I., Pachter, L., Dubchak, I., and Rubin, E.M. 2002. rVista for comparative sequence-baseddiscovery of functional transcription factor binding sites. Genome Res. 12, 832–839.
McCue, L., Thompson, W., Carmack, C., Ryan, M.P., Liu, J.S., Derbyshire, V., and Lawrence, C.E. 2001. Phylogeneticfootprinting of transcription factor binding sites in proteobacterial genomes. Nucl. Acids Res. 29, 774–782.
McGuire, A.M., Hughes, J.D., and Church, G.M. 2000. Conservation of DNA regulatory motifs and discovery of newmotifs in microbial genomes. Genome Res. 10, 744–757.
Mewes, H.W., Heumann, K., Kaps, A., Mayer, K., Pfeiffer, F., Stocker, S., and Frishman, D. 1999. MIPS: A databasefor genomes and protein sequences. Nucl. Acids Res. 27, 44–48.
METHODS IN COMPARATIVE GENOMICS 355
Oeltjen, J.C., Malley, T.M., Muzny, D.M., Miller, W., Gibbs, R.A., and Belmont, J.W. 1997. Large-scale comparativesequence analysis of the human and murine Bruton’s tyrosine kinase loci reveals conserved regulatory domains.Genome Res. 7, 315–329.
Pennacchio, L.A., and Rubin, E.M. 2001. Genomic strategies to identify mammalian regulatory sequences. Nat. Rev.Genet. 2, 100–109.
Roth, F.P., Hughes, J.D., Estep, P.W., and Church, G.M. 1998. Finding DNA regulatory motifs within unalignednoncoding sequences clustered by whole-genome mRNA quantitation. Nat. Biotechnol. 16, 939–945.
Sharp, P.M., and Li, W.H. 1987. The codon Adaptation Index—a measure of directional synonymous codon usagebias, and its potential applications. Nucl. Acids Res. 15, 1281–1295.
Stormo, G.D. 2000. DNA binding sites: Representation and discovery. Bioinformatics 16, 16–23.Tatusov, R.L., Koonin, E.V., and Lipman, D.J. 1997. A genomic perspective on protein families. Science 278, 631–637.Tatusov, R.L., Natale, D.A., Garkavtsev, I.V., Tatusova, T.A., Shankavaram, U.T., Rao, B.S., Kiryutin, B., Galperin,M.Y., Fedorova, N.D., and Koonin, E.V. 2001. The COG database: New developments in phylogenetic classificationof proteins from complete genomes. Nucl. Acids Res. 29, 22–28.
Tavazoie, S., Hughes, J.D., Campbell, M.J., Cho, R.J., and Church, G.M. 1999. Systematic determination of geneticnetwork architecture. Nat. Genet. 22, 281–285.
Thompson, J.D., Higgins, D.G., and Gibson, T.J. 1994. CLUSTAL W: improving the sensitivity of progressive multiplesequence alignment through sequence weighting, position-specific gap penalties and weight matrix choice. Nucl.Acids Res. 22, 4673–4680.
Tompa, M. 2001. Identifying functional elements by comparative DNA sequence analysis. Genome Res. 11, 1143–1144.Velculescu, V.E., Zhang, L., Zhou, W., Vogelstein, J., Basrai, M.A., Bassett Jr., D.E., Hieter, P., Vogelstein, B., andKinzler, K.W. 1997. Characterization of the yeast transcriptome. Cell 88, 243–251.
Wolfe, K.H., and Shields, D.C. 1997. Molecular evidence for an ancient duplication of the entire yeast genome. Nature387, 708–713.
Wood, V., Rutherford. K.M., Ivens, A., Rajandream, M.-A., and Barrell, B. 2001. A re-annotation of the Saccaromycescerevisiae genome. Comparative and Functional Genomics 2, 143–154.
Zhang, M.Q. 1999. Promoter analysis of co-regulated genes in the yeast genome. Comput. Chem. 23, 233–250.Zhu, J., and Zhang, M.Q. 1999. SCPD: A promoter database of the yeast Saccharomyces cerevisiae. Bioinformatics15, 607–611.
Address correspondence to:Eric S. Lander
Department of BiologyMassachusetts Institute of Technology
77 Massachusetts AvenueCambridge, MA 02139
and
Bonnie BergerRoom 2-373
Mathematics DepartmentMIT
Cambridge, MA 02139
E-mail: [email protected] and [email protected]