Methods for recognition of actuarial gains and …...METHODS FOR RECOGNITION OF ACTUARIAL GAINS AND...
40
Methods for recognition of actuarial gains and losses under IAS 19
Transcript of Methods for recognition of actuarial gains and …...METHODS FOR RECOGNITION OF ACTUARIAL GAINS AND...
Methods for recognition of actuarial gains and losses under IaS 19
40
aBOUt aCCa
ACCA (the Association of Chartered Certified Accountants) is the global body for professional accountants. We aim to offer business-relevant, first-choice qualifications to people of application, ability and ambition around the world who seek a rewarding career in accountancy, finance and management.
We support our 140,000 members and 404,000 students throughout their careers, providing services through a network of 83 offices and centres. Our global infrastructure means that exams and support are delivered – and reputation and influence developed – at a local level, directly benefiting stakeholders wherever they are based, or plan to move to, in pursuit of new career opportunities. Our focus is on professional values, ethics, and governance, and we deliver value-added services through our global accountancy partnerships, working closely with multinational and small entities to promote global standards and support.
We use our expertise and experience to work with governments, donor agencies and professional bodies to develop the global accountancy profession and to advance the public interest.
Our reputation is grounded in over 100 years of providing world-class accounting and finance qualifications. We champion opportunity, diversity and integrity, and our long traditions are complemented by modern thinking, backed by a diverse, global membership. By promoting our global standards, and supporting our members wherever they work, we aim to meet the current and future needs of international business.
© The Association of Chartered Certified Accountants, 2010
This paper extends the authors’ 2008 work, published by ACCA as Adoption of IAS 19 by Europe’s Premier Listed Companies. Based on an analysis of defined-benefit pension disclosures in the UK, Germany, and France, the research shows that, in 2008, use of the IAS 19 full recognition methods remained the norm for UK companies comprising the FTSE 100. More importantly, in comparison with the earlier study, these new findings reveal that use of the IAS 19 full recognition methods increased significantly among Germany’s DAX 30 and France’s CAC 40 companies between 2005 and 2008. Additionally, this paper presents the IAS 19 method selected for the recognition of actuarial gains and losses for all other German and French listed companies in 2008.
Methods for recognition of actuarial gains and losses under IAS 19
Professor Donna L. Street University of Dayton
Professor Martin Glaum Justus-Liebig-Universität Giessen

METHODS FOR RECOGNITION OF ACTUARIAL GAINS AND LOSSES UNDER IAS 19 3
Contents
1. Introduction 5
2. Objective of the current study 6
3. Sample selection 7
4. Descriptive statistics 9
5. Method selected for recognition of actuarial gains and losses 10
6. Funded status of defined-benefit pension plans 15
7. Estimated impact on equity of moving from the corridor method to full recognition 16
8. Discount rates used by companies 18
9. Summary 24
References 27
Appendix: Tables 28

4
METHODS FOR RECOGNITION OF ACTUARIAL GAINS AND LOSSES UNDER IAS 19 5
Since 2008, the International Accounting Standards Board (IASB) has been undertaking a project aimed at improving pension accounting. Its immediate objective is to complete limited-scope amendments to International Accounting Standard (IAS) 19 by mid-2011, pending a fundamental review of all aspects of post-employment benefit accounting. On the basis of a review of comments received about the March 2008 discussion paper, Preliminary Views on Amendments to IAS 19 Employee Benefits (IASB 2008), and further input received from a broad range of stakeholders, the IASB has determined to develop three separate exposure drafts (EDs). The three EDs will address the following issues:
the recognition and presentation of changes in the •defined-benefit obligation and in plan assets, disclosures and other issues raised in the comment letters that can be addressed expeditiously
the discount rate for measuring employee benefits, and•
contribution-based promises, potentially as part of a •comprehensive review of pension accounting.
At the end of April 2010, the IASB issued the first of the three envisaged EDs with a comment period ending 6 September 2010. The ED proposes immediate recognition of defined-benefit pension costs, including actuarial gains and losses. Furthermore, the ED proposes that re-measurement cost,1 including actuarial gains and losses, will be recognised via the Statement of Other Recognised Income and Expense (SORIE). After 2011, the IASB will consider whether to address the remaining issues of measurement of defined-benefit plans (eg the continuous issue of the discount rate used for measuring employee benefits) and the accounting for contribution-based benefit promises.
1. The IASB ED (paragraph 7) defines re-measurement costs to include (a) actuarial gains and losses on the defined-benefit obligation; (b) the return on plan assets, excluding amounts included in net interest on the net defined-benefit liability (asset); and (c) any changes in the effect of the limit described in paragraph 115B, excluding amounts included in net interest on the net defined-benefit liability (asset).
The research findings presented in this report extend the work published by ACCA as Adoption of IAS 19 by Europe’s Premier Listed Companies, research report no. 100 (Fasshauer et al. 2008). It supports the IASB’s proposal to eliminate the corridor method and require full recognition of actuarial gains and losses. This report shows that, although the use of full recognition methods has increased in key European countries since 2005, use of the corridor method remains relatively widespread among German and French listed companies.
This report additionally extends the benchmarking analysis of pension assumptions reported by Fasshauer et al. (2008). Its focus is the discount rate assumptions reported from 2005 to 2008, because these are the most important and problematic assumptions. Furthermore, the discount rate as noted above is subject to reconsideration by the IASB. For each sub-sample, the research finds that the standard deviation for the discount rate used during year 2008 was approximately 0.25% or higher, with one sub-sample (French listed companies, excluding the CAC 40) exhibiting a standard deviation of 0.66%. Given the sensitivity of the recognised defined-benefit obligation to even a small swing in the discount rate, the findings regarding the discount rate assumptions used at the onset of the financial crisis should be of great interest to policymakers and other financial statement users. It additionally reports the mean discount rates used between 2005 and 2008 and illustrates the rising discount-rate trend for the sub-samples studied.
1. Introduction
6
In 2008, ACCA published Adoption of IAS 19 by Europe’s Premier Listed Companies (Fasshauer et al. 2008).The research report provides the authors’ in-depth analysis and evaluation of the defined-benefit pension plan disclosures provided in 2005 by companies constituting the premier segments of 20 European stock exchanges. Among other things, the authors
identified the method these companies selected under •IAS 19 for the recognition of actuarial gains and losses
assessed the balance sheet impact of using the two IAS •19 full recognition methods, in contrast to the traditional corridor approach; and
conducted a benchmarking analysis of the most •important actuarial assumptions, including the discount rates disclosed by companies constituting each of the stock market indices.
Fasshauer et al. (2008) report that in 2005 the relatively new IAS 19 option of full recognition of actuarial gains and losses through the SORIE, based on the UK’s Financial Reporting Standard (FRS) 17, was widely accepted not only in the UK and Ireland, but also in countries with high unfunded defined-benefit pension obligations, such as Germany. Nonetheless, the authors stress that among the 265 European blue chips included in their sample, a slim majority (136 out of 265) used the corridor approach to recognise actuarial gains and losses.
Fasshauer et al.’s findings (2008) support the IASB’s position that it is undesirable to allow choices for the recognition of actuarial gains and losses. They also provide evidence that the financial statement impact of using different methods for the recognition of actuarial gains and losses is often material, especially from a balance sheet perspective, and that the flexibility allowed under IAS 19 impedes the comparability of financial statements. Notably, the findings highlight that IAS 19 enables some European companies to achieve material off-balance sheet financing using the corridor method. In 2005, sample companies using the corridor on average overstated their equity by 3.43% and understated their recognised net pension liability by 41.02%.
The present technical report extends the work of Fasshauer et al. (2008) and is based on an analysis of defined-benefit pension disclosures of 342 companies listed in the UK, Germany, and France that reported on material defined-benefit pension plans in year 2008. The research shows that, in year 2008, use of the IAS 19 full recognition methods remained the norm for UK companies comprising the FTSE 100. More importantly, in comparison with the earlier study, these new findings reveal that use of the IAS 19 full recognition methods increased significantly among Germany’s DAX 30 and France’s CAC 40 companies between 2005 and 2008.
Additionally, this report presents the IAS 19 method selected for the recognition of actuarial gains and losses for all other German and French listed companies in 2008. It finds that, as of year 2008, full recognition of actuarial gains and losses was the preference of a slight majority of other French listed companies, whereas nearly two-thirds of other German listed companies use the corridor approach. Hence, in Germany the preference for the recognition method appears to depend on the size and listing status (ie full recognition is more wide-spread among DAX 30 companies than among smaller German listed companies); the same does not hold for French companies.
In light of the IASB proposal to require all companies to use full recognition methods, this work provides some additional insight regarding the impact that moving from the corridor method to full recognition of actuarial gains and losses would have on companies currently using the corridor approach.
Lastly, the report examines the discount rate assumptions reported by sample companies in 2008. The findings are highly relevant given the impact of the financial crisis on discount/interest rates and the IASB’s consideration of adding a project to its agenda to address the discount rate specified by IAS 19.
2. Objective of the current study
METHODS FOR RECOGNITION OF ACTUARIAL GAINS AND LOSSES UNDER IAS 19 7
Fasshauer et al.’s sample (2008) was based on companies constituting Europe’s 20 premier stock market indices. The final sample, however, included companies from only 17 exchanges, as three of the initial indices considered did not include any companies with material defined-benefit pension plans. Some companies were deleted from the sample for various reasons, including not providing an English-language annual report, being cross-listed, and using US Generally Accepted Accounting Principles (GAAP). The first-mentioned exclusion is justified on the grounds that English language reports are likely to be the focus of international investors. Furthermore, to include these companies would have required the use of languages unavailable to the authors.
To extend Fasshauer et al.’s findings (2008), as noted above, the research focused its investigation on companies constituting the premier stock market indices of Europe’s three largest economies: the UK, Germany, and France. Moreover, it expanded the sample to include all other German and French listed companies meeting the selection criteria. It did not expand the earlier report’s UK sub-sample beyond the FTSE 100, primarily because that report’s UK sub-sample was relatively large in absolute numbers. Secondly, in line with UK GAAP prior to the transition to IFRS in 2005, Fasshauer et al. (2008) identified a strong preference for the full recognition through the SORIE option; hence, no further insights from enlarging this country sub-sample can be expected.
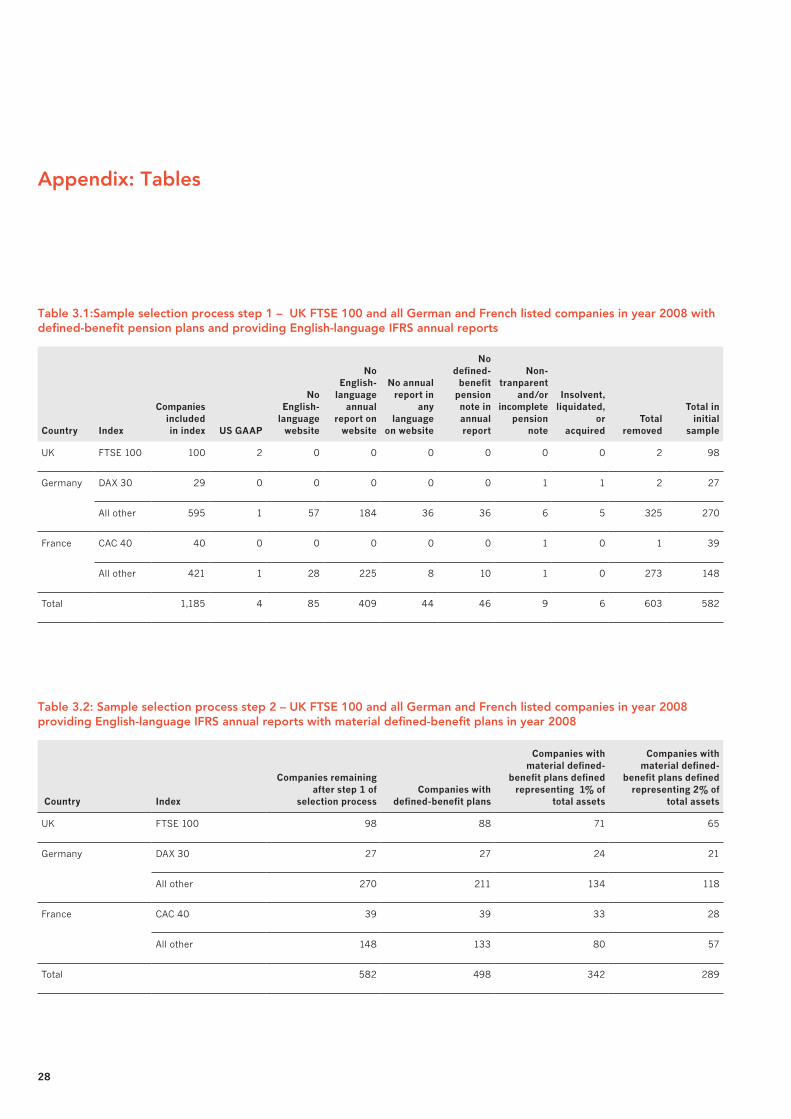
The sample selection process included two steps. Step one obtained a list of the UK FTSE 100 and of all German and French listed companies for the year 2008. As reflected in Table 3.1 (page 28), the total number of companies within the FTSE 100 in 2008 was 100. Two companies were deleted because they used US GAAP instead of IFRS. Hence after step one, 98 FTSE 100 companies remained.
As of 2008, the DAX 30 comprised 29 companies. One of these was deleted owing to an incomplete defined-benefit pension footnote that did not include key disclosures required for inclusion in the study. An additional company was deleted because it was acquired by another DAX 30 company during the year. At the end of step one, 27 of the DAX 30 companies remained in the sample.
During 2008, apart from the DAX 30 companies, 595 other German companies were listed on the Frankfurt Stock Exchange. A substantial number of companies were deleted for various reasons including: one provided English language financial statements prepared under US GAAP as opposed to IFRS; 57 did not have an English-language website; 184 did not provide English-language financial statements on the website; 36 did not provide an annual report in any language on the website; 36 did not provide a defined-benefit pension footnote in the annual report, suggesting that they do not have material defined-benefit plans; six had unclear or incomplete defined-benefit pension disclosures; and five were liquidated, became insolvent, or were acquired by another company during the year. At the conclusion of step one, 297 German listed companies (ie 27 DAX 30 and 270 others) remained for possible inclusion in the sample.
To maximise the accuracy of the hand-collected data for the reconciliations required under IAS 19, a spreadsheet format was used that required inputting each of the specific items specified by IAS 19 as well as an ‘other’ category. This enabled us to verify that the sum of the individual items included in the reconciliations equalled the difference between the starting and ending points for each of the reconciliations. In the few cases where this was not the case, the annual report was revisited to identify the source of the discrepancy, and any data entry errors were corrected. In a few instances, ‘errors’ were within the annual report disclosures and not a result of data entry error by this study. The majority of the other German listed companies eliminated from the sample for incomplete or unclear pension footnotes are associated with instances where the preceding and additional data accuracy checks incorporated into the spreadsheet led us to question the accuracy of key IAS 19 disclosures.
One of the other German listed companies deleted from the sample owing to an incomplete or unclear footnote offered defined-benefit pension plans only to members of the management board. Hence the detailed disclosures required by IAS 19 may have been viewed as irrelevant.
3. Sample selection
8
For another German listed company that was deleted, it is unclear what portion of ‘pensions and other retirement benefits’ relate to defined-benefit obligations. Hence, it is possible that the defined-benefit obligation is immaterial, thereby justifying the extremely limited disclosure.
Of the 40 companies constituting the CAC 40 in 2008, one with a material defined-benefit obligation was deleted from the sample owing to an incomplete pension footnote. The deleted company used the corridor method. Hence, after step one, 39 of the CAC 40 companies remained for possible inclusion in the sample.
In 2008, apart from the CAC 40, 421 companies were listed on the French exchange. Again, a considerable number of companies were deleted for various reasons including that: one provided English language financial statements prepared under US GAAP as opposed to IFRS; 28 did not have an English-language website; 225 did not provide English-language financial statements on the website; eight did not provide an annual report in any language on their website; ten did not provide a defined-benefit pension footnote in the annual report, suggesting that they do not have material defined-benefit plans; and one had unclear defined-benefit pension disclosures. After step one, 187 (ie 39 CAC 40 and 148 other) companies listed on the French exchange remained for possible inclusion in the sample.
For the one other French listed company deleted owing to an unclear or incomplete pension note, the company disclosed only the method used to account for defined-benefit obligations (the corridor method), the assumptions used to determine the defined-benefit obligations, and a sensitivity analysis for the discount rate used. All other disclosures required by IAS 19 were missing.
Step two identified companies with material defined-benefit pension plans. Materiality was assessed as having a defined-benefit obligation equal to 1% or more of total assets. As reflected in Table 3.2 (page 28), using a materiality level of 1%, the final sample comprises 342 companies. If the materiality threshold is increased to 2% of total assets the number of relevant companies drops to 289 (see Table 3.2).
For all companies with year-ends other than 31 December (eg companies with a 31 March, 30 June, or 30 September year-end), the 2008/09 annual report has been used in the analysis. To simplify discussion in this paper, all statements are referred to as being from 2008.
METHODS FOR RECOGNITION OF ACTUARIAL GAINS AND LOSSES UNDER IAS 19 9
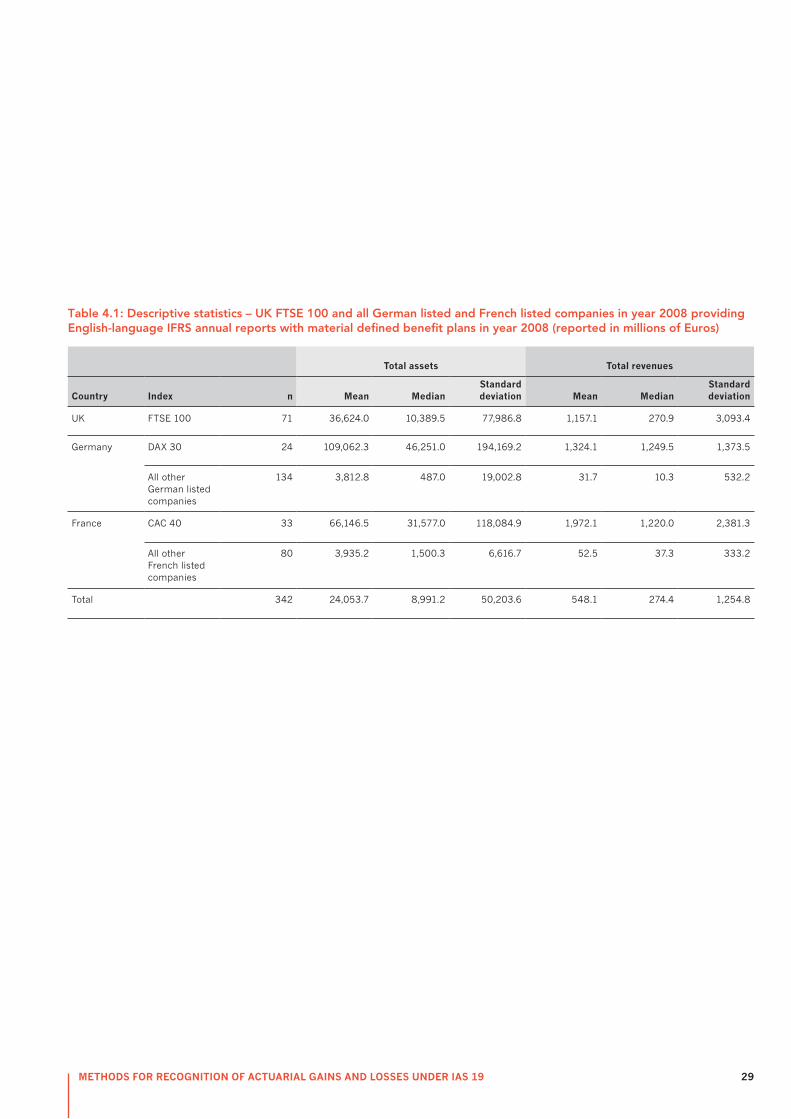
Average company size measured by total assets and by total revenues is reported by country/index in Table 4.1 (page 29). On the basis of total assets, the average company size measured by the mean is €24,053.7 million; the median is €8,991.2. As indicated by the substantial standard deviation (€50,203.6 million), the companies vary greatly in size.2 Measured by mean total assets, the largest companies are the DAX 30 companies, with average total assets of €109,062.3 million, followed by the CAC 40 companies, with average total assets of €66,146.5 million. The smallest companies are the other French listed companies and the other German listed companies with average total assets, based on the mean, of €3,935.2 million and €3,812.8 million, respectively.
Average total revenue, based on the mean, is €548.1 million. Again, the standard deviation is substantial at €1,254.8 million. The largest companies, on the basis of mean total revenues, are the CAC 40 (€1,972.1 million). The smallest companies, on the basis of mean total revenues, are the other German listed (€31.7 million) and other French listed companies (€52.5 million).
2. When assessing company size by total assets, it should be noted that the sample comprises companies from all industry sectors, including the financial sector, where companies often have very large balance sheets.
4. Descriptive statistics
10
USe Of fUll ReCOgnItIOn MethODS InCReaSeS fOR eUROpean BlUe ChIpS fROM 2005 thROUgh 2007
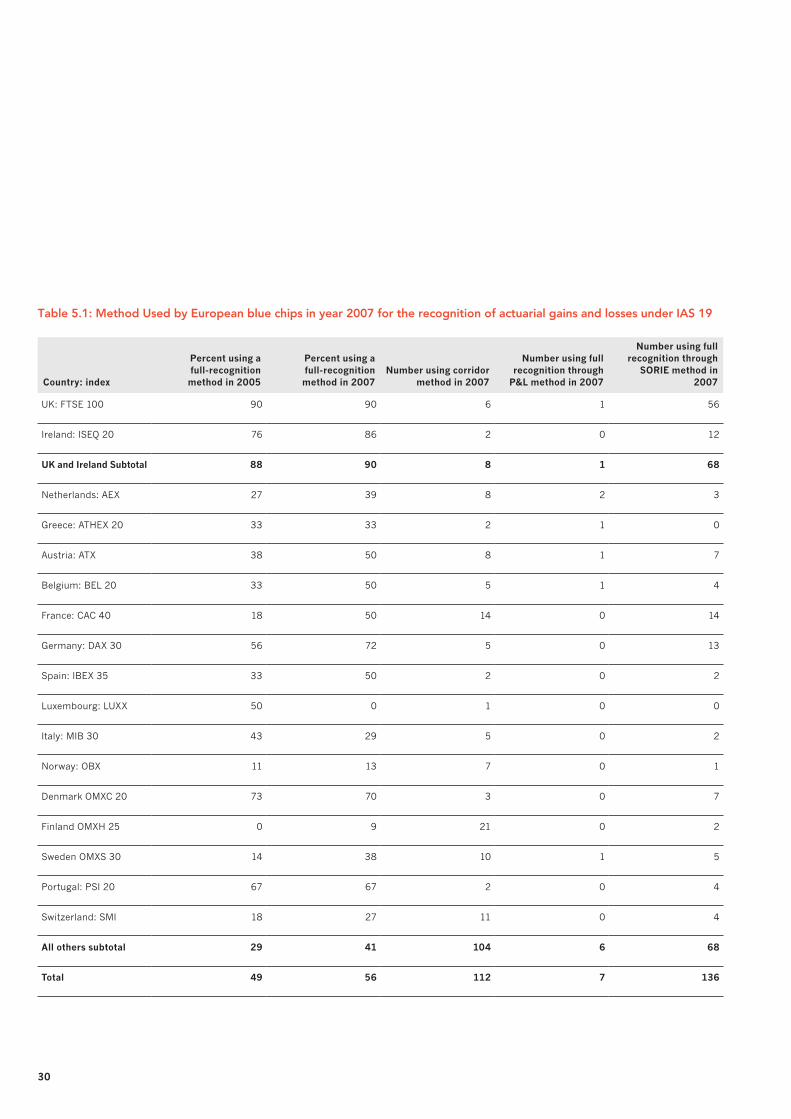
In March 2009, ACCA and the Federation of European Accountants (FEE) hosted a pension accounting seminar in Brussels where Fasshauer and Street updated some of the findings of Fasshauer et al. (2008) by supplying updated data for the years 2006 and 2007. In regard to the methods adopted for recognition of actuarial gains and losses, Fasshauer and Street reported on a trend towards greater use of the full recognition methods. In the year 2007, of the 255 European blue chips reporting on material defined-benefit pension plans, 44% used the corridor method, 3% used the full recognition through P&L method, and 53% used the full recognition through SORIE method. Indeed as shown in Table 5.1 (page 30) between 2005 and 2007, the proportion of blue chip companies using a full recognition method increased in 11 countries. Notable increases in the use of the full recognition through SORIE method between 2005 and 2007 occurred among the DAX 30 (56% to 72%) and CAC 40 (18% to 50%) companies.
Excluding the UK and Ireland, however, as of 2007 the corridor method remained the preferred method: 59% used the corridor method, 3% used the full recognition through P&L method, and 38% used the full recognition through SORIE method.
During the ACCA and FEE seminar, Fasshauer and Street also noted some of the changes in accounting policy disclosures provided by companies moving from the corridor approach to full recognition in year 2006 or year 2007. Some companies indicated that the move to full recognition more fairly represented the company’s assets and liabilities and that the balance sheet provided a more accurate representation of the funding status of the plans. For example, in its 2007 annual report, Alcatel SA states:
On January 1, 2007, Alcatel-Lucent adopted (with retrospective effect as of January 1, 2005) the option offered by Amendment to IAS 19 ‘Employee benefits – Actuarial gains and losses, Group plans and Disclosures’, to immediately recognize all actuarial gains and losses….in the Statement of Recognized Income and Expense (SORIE). Management believes that the change will more fairly present the fair value of assets and liabilities related to retiree benefits in the company’s balance sheet and eliminate significant volatility in its results of operations for certain plans...Previously, Alcatel-Lucent applied the corridor method…
5. Method selected for recognition of actuarial gains and losses
In the ‘Basis for Conclusions’ accompanying its April ED, the IASB (2010, BC 10) states the following.
In the Board’s view, immediate recognition provides the most useful information to users of financial statements because:
(a) the resulting amounts in the statements of financial position and comprehensive income are relevant to users of financial statements and easier for them to understand. In contrast, deferred recognition can produce misleading amounts…(b) it improves comparability across entities by eliminating the options allowed by IAS 19.
Before issuing the ED, the IASB clearly stated its preference for immediate recognition as noted above in the Board’s 2008 discussion paper (IASB 2008) and before that in the basis for conclusions accompanying its 2004 amendment to IAS 19 (IASB 2004), adding the full recognition through SORIE option. Hence, when preparing IFRS financial statements in 2005, the majority for the first time, European blue chip companies must have been cognisant of the IASB’s preference and should have viewed full recognition as representing the future of accounting for defined-benefit plans. On the basis of their review of the year 2005 defined-benefit pension disclosures of 265 European blue chips, however, Fasshauer et al. (2008) show that in 2005 a slim majority (136) used the corridor method for the recognition of actuarial gains and losses. Full recognition of actuarial gains and losses was practised by 129 companies, with seven reporting these gains and losses in P&L and 122 reporting them in the SORIE.
Fasshauer et al. (2008) also identify considerable cross-country variation in the method selected for recognition of actuarial gains and losses. The relatively high voluntary use of full recognition methods, as preferred by the IASB, was driven primarily by UK and Irish companies. For these companies, the IAS 19 option of full recognition through the SORIE is ‘home grown’ and consistent with UK Financial Reporting Standard (FRS) 17. Fasshauer et al. (2008) report that 90% of the UK FTSE 100 companies and 76% of the Irish ISEQ 20 companies in their sample used a full recognition method, compared with only 29% (51 of 176) in all other countries. Use of the full recognition through SORIE option was also widespread among blue chips in Portugal (67%), Denmark (64%) and Germany (55%, representing 10 of 18 DAX 30). Only 18% (5 of 28) of the French CAC 40 companies selected full recognition in 2005.
METHODS FOR RECOGNITION OF ACTUARIAL GAINS AND LOSSES UNDER IAS 19 11
In its 2006 footnotes, Deutsche Telekom AG states:
From its consolidated financial statements as of December 31, 2006, Deutsche Telekom recognizes actuarial gains and losses in the period in which they occur outside profit or loss in retained earnings…Deutsche Telekom believes that fully recognizing actuarial gains and losses when they occur results in a better presentation of the financial position in the balance sheet, since hidden reserves and liabilities are realized and the financial statements thus provide more relevant information. This change in accounting policy results in an increase of the...pension liability in the amount of the unrecognized actuarial gains and losses in the balance sheet.
In the company’s 2006 footnotes, Roche Holding AG states:
The Roche Group has been using International Financial Reporting Standards (IFRS) to report its consolidated results since 1990.…The only significant changes that relate to the Roche Group financial statements arise from IAS 19 (revised) ‘Employee benefits’, in particular with respect to defined benefit pension and other post-employment benefits. These changes have been implemented effective 1 January 2006 and the comparative 2005 results have been restated for these changes from those previously published.
Defined benefit plans – actuarial gains and losses, All actuarial gains and losses are now recognised immediately and recorded directly to equity. Previously actuarial gains and losses below a certain threshold were not recognised and those above this threshold were only recognised progressively. As a result of this change the Group’s consolidated balance sheet more accurately represents the funding status of the various plans.
Nestlé is another seasoned IFRS user; its 2006 footnote disclosure explains the impact of moving to full recognition on the amounts recognised in the company’s financial statements.
The Group has applied for the first time in 2006 the option of IAS 19 § 93A ss. whereby actuarial gains and losses are recognised in the period in which they occur outside the income statement in equity…2005 comparatives have been restated as follows: As at 1 January 2005, ‘Employee benefits assets’ decreased by CHF 896 million and ‘Employee benefits liabilities’ increased by CHF 2470 million. The related ‘Deferred tax assets’ increased by CHF 702 million and ‘Deferred tax liabilities’ decreased by CHF 431 million. These amounts reduced equity attributable to shareholders of the parent by CHF 2219 million and minority interests by CHF 14 million.
MethOD SeleCteD By UK, geRMan, anD fRenCh lISteD COMpanIeS In 2008 fOR ReCOgnItIOn Of aCtUaRIal gaInS anD lOSSeS
This study extends Fasshauer et al (2008) and the findings reported by Fasshauer and Street at the March 2009 ACCA and FEE Brussels round table to ascertain whether additional companies within the premier stock market index in each of Europe’s three largest economies (ie the UK FTSE 100, German DAX 30 and French CAC 40) migrated to full recognition between 2005 and 2008. Findings are also reported for all other listed companies in Germany and France. Among the sample companies, in year 2008, 55% used a full-recognition method for the recognition of actuarial gains and losses. Following the cross-country variation identified by Fasshauer et al. (2008), the findings are now reported by country and index.
12
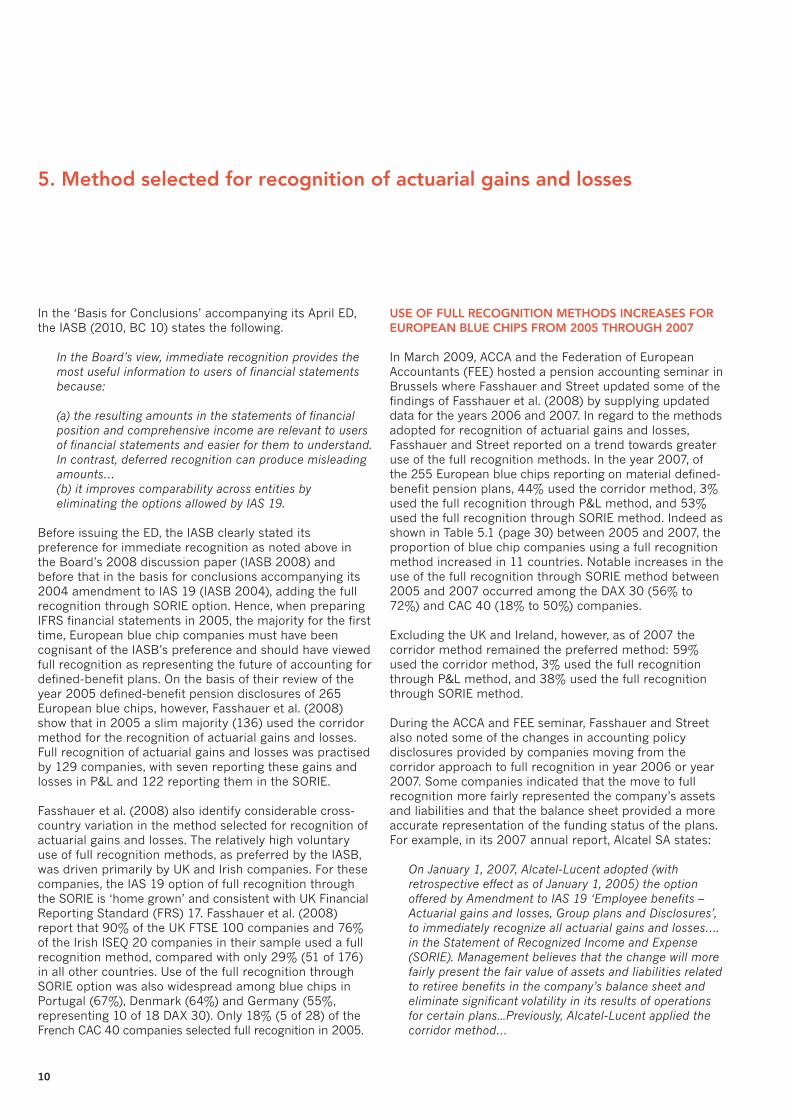
Corridor: 6 companies (8%)
Full recognition through P&L: 2 companies (3%)
Full recognition through SORIE: 63 companies
(89%)
figure 5.1: UK ftSe 100 – IaS 19 method selected for recognition of actuarial gains and losses in 2008
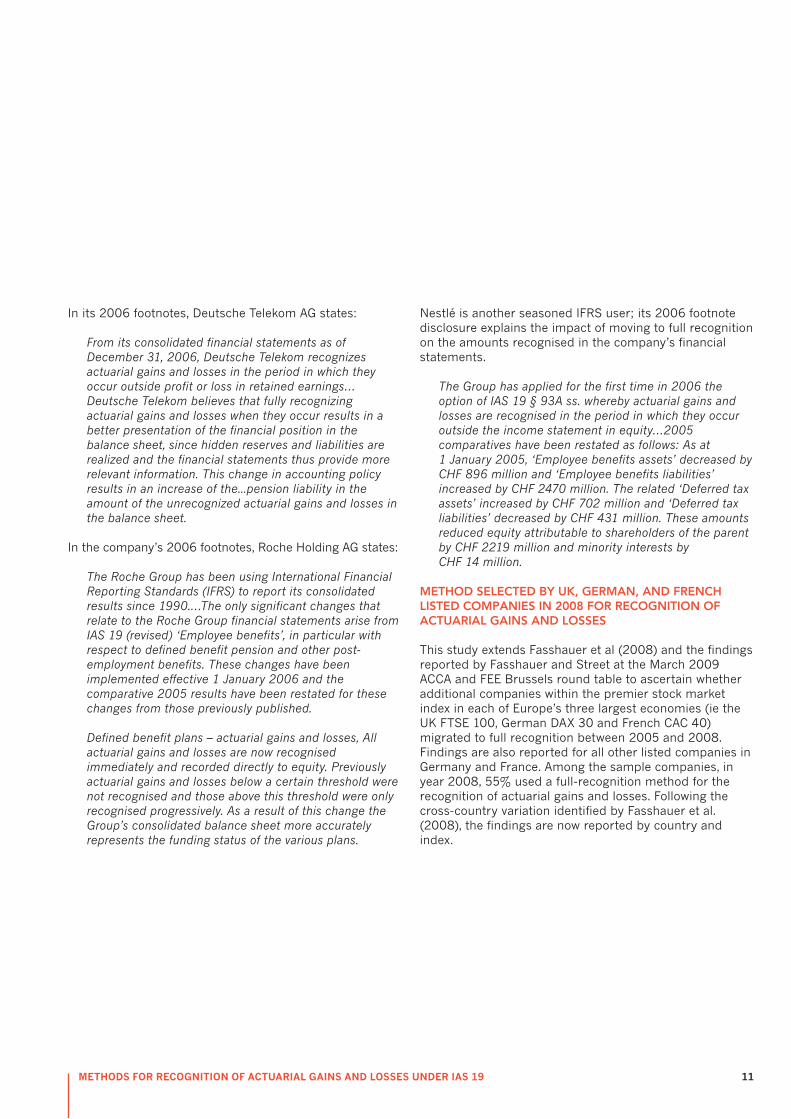
figure 5.2: germany’s DaX 30 – IaS 19 method selected for recognition of actuarial gains and losses in 2008
Corridor: 8 companies (33%)
Full recognition through SORIE:
16 companies (67%)
UK ftSe 100As shown in Figure 5.1, the review of FTSE 100 footnote disclosures in 2008 reveals that for companies with material defined-benefit obligations, full recognition remained the overwhelming norm at that time. For companies with defined-benefit obligations representing at least one per cent of total assets, 89% and 3% recognised actuarial gains and losses through the SORIE and P&L, respectively. Findings based on a materiality level of two per cent are comparable.
The percentages reported above are for companies with defined-benefit obligations representing at least one per cent of total assets. Results are comparable for companies with material defined-benefit plans representing at least two per cent of total assets: corridor: five companies (8%) / full recognition through P&L: two companies (3%) / full recognition through SORIE: 58 companies (89%).
DaX 30For year 2005, Fasshauer et al (2008), show that the national preference was also for full recognition among DAX 30 blue chips, with a slight majority (56%; 10 of 18) using the full recognition through SORIE method. As shown in Figure 5.2, the review of year 2008 disclosures by DAX 30 companies reveals that use of the full recognition through SORIE option grew to 67%.
The percentages reported above are for companies with defined-benefit obligations representing at least one per cent of total assets. Results are comparable for companies with material defined-benefit plans representing at least two per cent of total assets: corridor: seven companies (33%) / full recognition through SORIE: 14 companies (67%).
METHODS FOR RECOGNITION OF ACTUARIAL GAINS AND LOSSES UNDER IAS 19 13
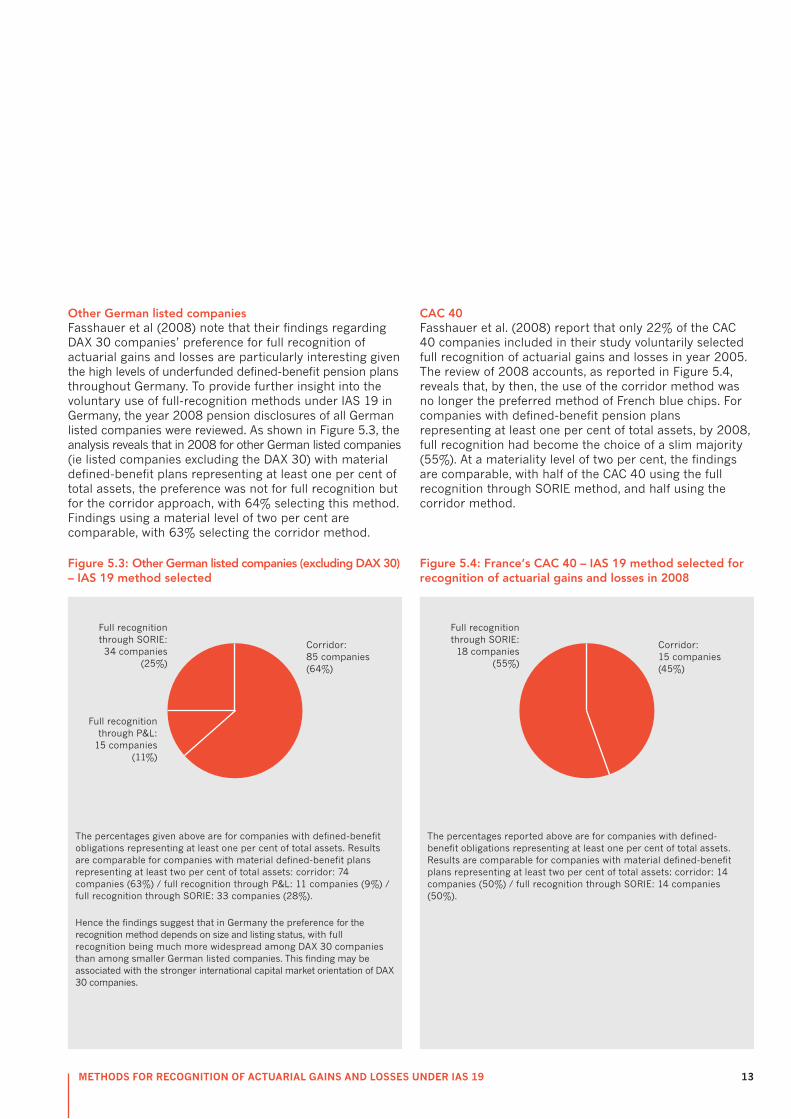
figure 5.4: france’s CaC 40 – IaS 19 method selected for recognition of actuarial gains and losses in 2008
Corridor: 15 companies (45%)
Full recognition through SORIE: 18 companies
(55%)
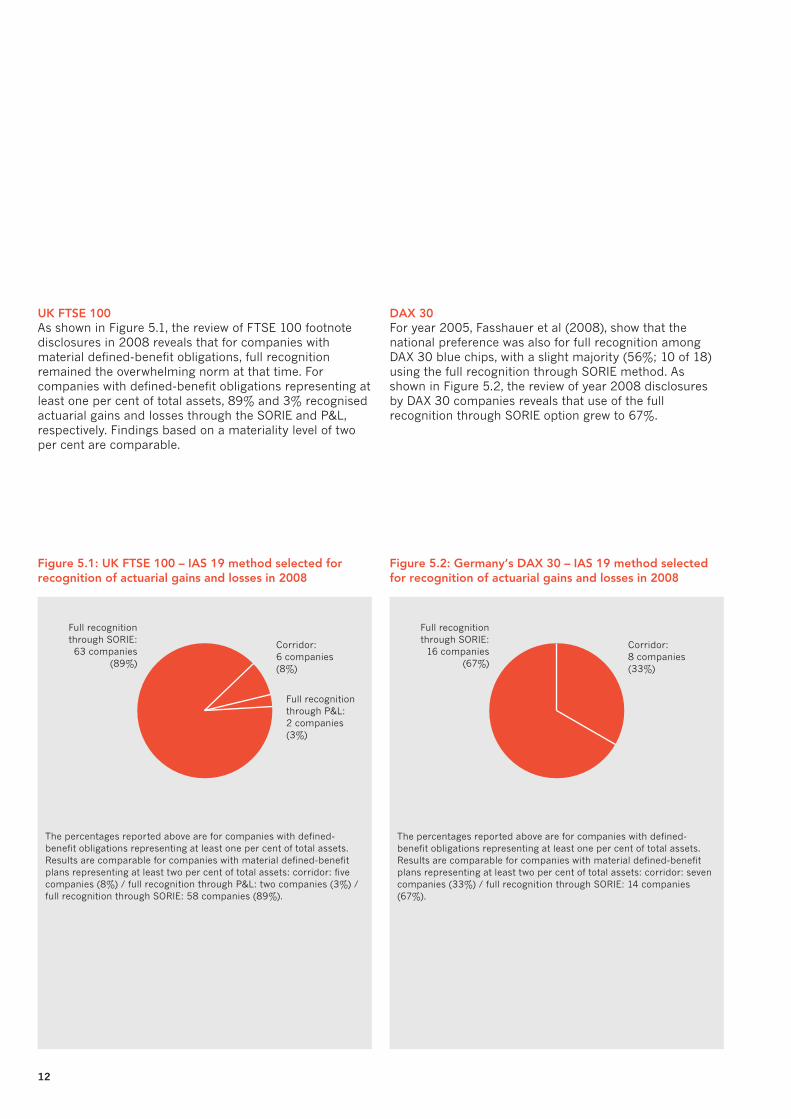
Corridor: 85 companies (64%)
Full recognition through SORIE: 34 companies
(25%)
Full recognition through P&L:
15 companies (11%)
figure 5.3: Other german listed companies (excluding DaX 30) – IaS 19 method selected
Other german listed companiesFasshauer et al (2008) note that their findings regarding DAX 30 companies’ preference for full recognition of actuarial gains and losses are particularly interesting given the high levels of underfunded defined-benefit pension plans throughout Germany. To provide further insight into the voluntary use of full-recognition methods under IAS 19 in Germany, the year 2008 pension disclosures of all German listed companies were reviewed. As shown in Figure 5.3, the analysis reveals that in 2008 for other German listed companies (ie listed companies excluding the DAX 30) with material defined-benefit plans representing at least one per cent of total assets, the preference was not for full recognition but for the corridor approach, with 64% selecting this method. Findings using a material level of two per cent are comparable, with 63% selecting the corridor method.
The percentages given above are for companies with defined-benefit obligations representing at least one per cent of total assets. Results are comparable for companies with material defined-benefit plans representing at least two per cent of total assets: corridor: 74 companies (63%) / full recognition through P&L: 11 companies (9%) / full recognition through SORIE: 33 companies (28%).
Hence the findings suggest that in Germany the preference for the recognition method depends on size and listing status, with full recognition being much more widespread among DAX 30 companies than among smaller German listed companies. This finding may be associated with the stronger international capital market orientation of DAX 30 companies.
CaC 40Fasshauer et al. (2008) report that only 22% of the CAC 40 companies included in their study voluntarily selected full recognition of actuarial gains and losses in year 2005. The review of 2008 accounts, as reported in Figure 5.4, reveals that, by then, the use of the corridor method was no longer the preferred method of French blue chips. For companies with defined-benefit pension plans representing at least one per cent of total assets, by 2008, full recognition had become the choice of a slim majority (55%). At a materiality level of two per cent, the findings are comparable, with half of the CAC 40 using the full recognition through SORIE method, and half using the corridor method.
The percentages reported above are for companies with defined-benefit obligations representing at least one per cent of total assets. Results are comparable for companies with material defined-benefit plans representing at least two per cent of total assets: corridor: 14 companies (50%) / full recognition through SORIE: 14 companies (50%).
14
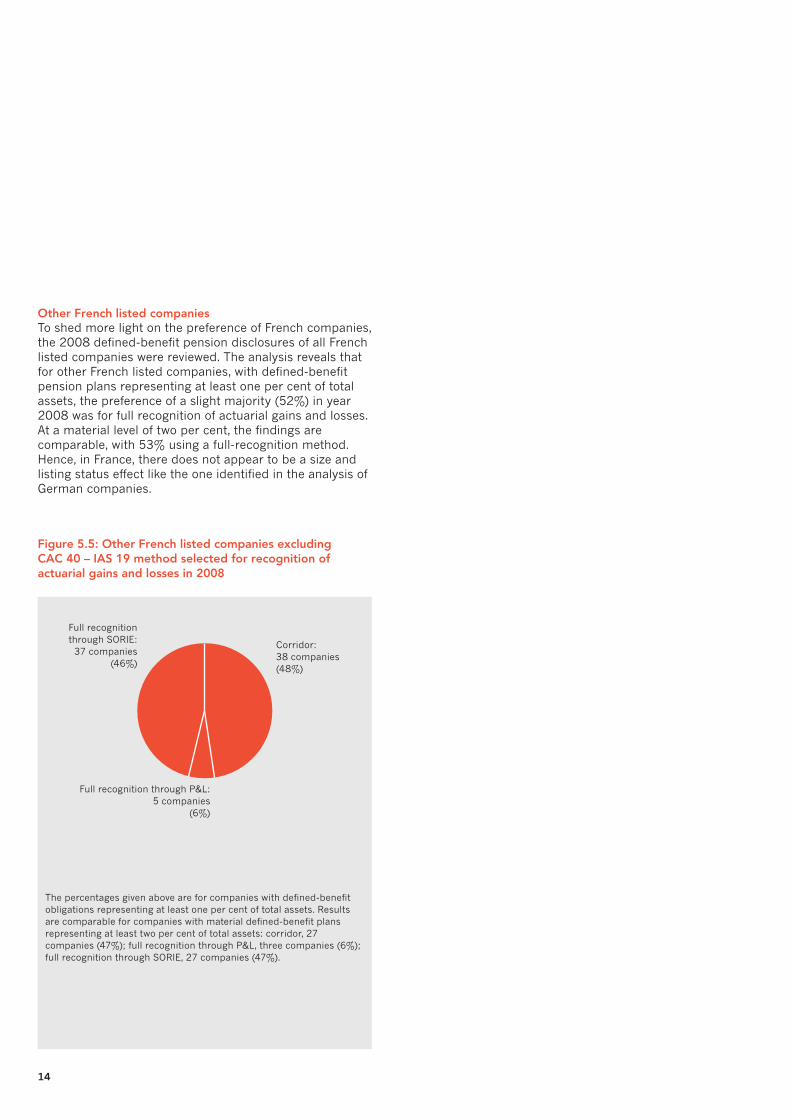
figure 5.5: Other french listed companies excluding CaC 40 – IaS 19 method selected for recognition of actuarial gains and losses in 2008
Corridor: 38 companies (48%)
Full recognition through SORIE: 37 companies
(46%)
Full recognition through P&L: 5 companies
(6%)
Other french listed companiesTo shed more light on the preference of French companies, the 2008 defined-benefit pension disclosures of all French listed companies were reviewed. The analysis reveals that for other French listed companies, with defined-benefit pension plans representing at least one per cent of total assets, the preference of a slight majority (52%) in year 2008 was for full recognition of actuarial gains and losses. At a material level of two per cent, the findings are comparable, with 53% using a full-recognition method. Hence, in France, there does not appear to be a size and listing status effect like the one identified in the analysis of German companies.
The percentages given above are for companies with defined-benefit obligations representing at least one per cent of total assets. Results are comparable for companies with material defined-benefit plans representing at least two per cent of total assets: corridor, 27 companies (47%); full recognition through P&L, three companies (6%); full recognition through SORIE, 27 companies (47%).
METHODS FOR RECOGNITION OF ACTUARIAL GAINS AND LOSSES UNDER IAS 19 15
For companies using the corridor method, important information regarding the funded status of the defined-benefit pension plans (the difference between the defined-benefit obligation and the fair value of the plan assets) is provided only in the footnotes and is not fully recognised in the balance sheet. On the basis of their study of European blue chips, Fasshauer et al. (2008) report that on average (mean), the defined-benefit obligation exceeded the fair value of plan assets in 2005 for every country in their sample. The companies with the greatest levels of underfunding were Spain, Germany and France, with the defined-benefit obligation on average exceeding the fair value of the plan assets by €4,322.9 million, €3,712.5 million and €1,853.3 million respectively.
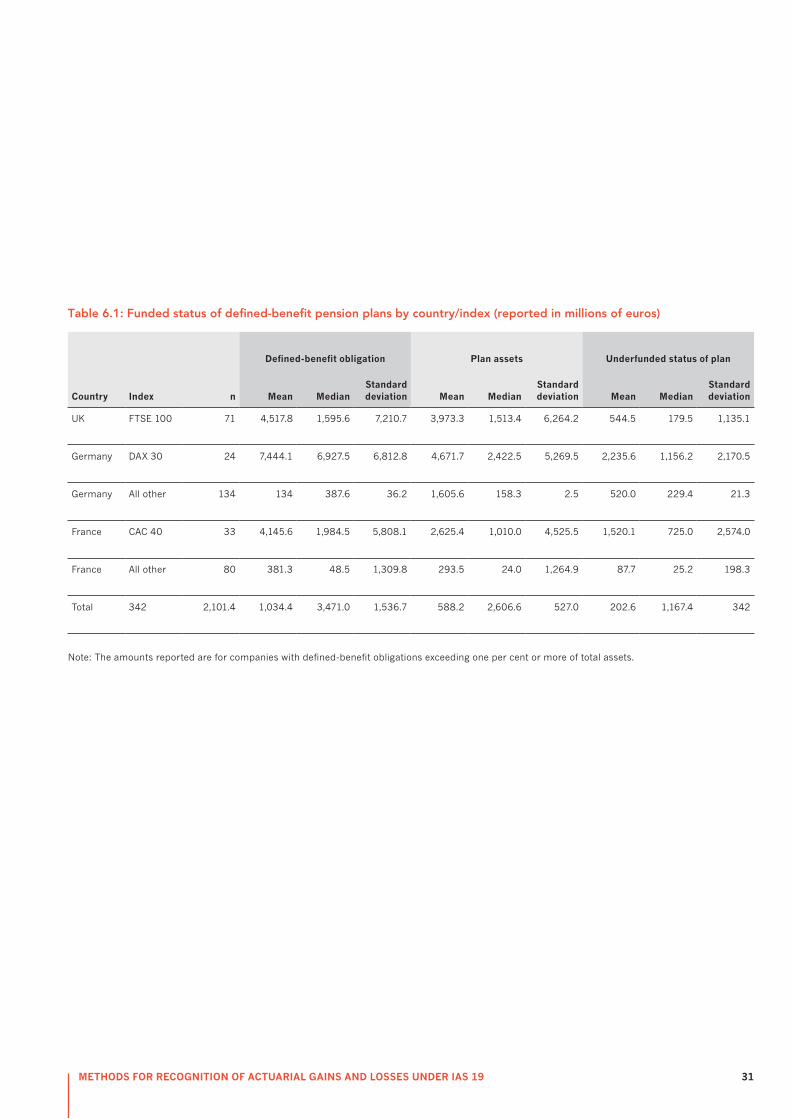
Table 6.1 (page 31) shows, for companies with material defined-benefit pension plans, the funded status, as of year 2008, for the FTSE 100; the DAX 30; all other listed companies in Germany; the CAC 40; and all other listed companies in France. For each sub-sample, on average, the plans are underfunded. The defined-benefit obligation on average exceeds the fair value of the plan assets by €544.5 million for the FTSE 100, €2,235.6 million for the DAX 30, €520.0 million for all other German listed companies, €1,520.1 million for CAC 40 companies, and €87.7 million for all other French listed companies. The standard deviation of €1,135.1 million, €2,574.0 million, and €198.3 million is very substantial for the FTSE 100, CAC 40, and other French listed companies, respectively.
Comparing these findings with those of Fasshauer et al. (2008) for 2005 reveals that the level of underfunding has decreased somewhat in all three countries (for example, the mean level of underfunding for the FTSE 100 in the UK was €894.8 million in 2005, compared with €544.5 million at the end of 2008). This might appear somewhat surprising, given the severe financial crisis that unfolded in 2008. For example, the UK stock market experienced a drop of more than 30% in that year. Decreases in the value of companies’ plan assets caused by the stock market tumble were, however, more than offset by discount-rate-induced decreases in the values of the pension obligations (see Johnson 2008). The change in the discount rate, in turn, also warrants consideration. While the rate on UK government bonds was at a historical low at the end of 2008, according to IAS 19 paragraph 78, companies must use a high-quality corporate bond yield to discount expected future pension payments. In practice, many UK companies use a particular index rate, the iBoxx AA rate, and this index increased sharply in the autumn of 2008, mainly because most of the bonds underlying the index are issued by banks (Johnson 2008). The use of this particular index rate may have led to rather questionable accounting consequences. This issue is revisited in Chapter 8 on discount rate assumptions.
6. funded status of defined-benefit pension plans
16
While Fasshauer et al. (2008) provide limited direct evidence of what drives a company’s decision to follow the corridor approach or a full recognition approach in accounting for actuarial gains and losses, their review of the ratios of underfunded balances to shareholders’ equity and net balances of unrecognised actuarial gains and losses to shareholders’ equity provides some indirect evidence of what may be driving this accounting policy decision for some companies.
fUnDeD StatUS Of DefIneD-BenefIt planS DIvIDeD By ShaRehOlDeRS’ eqUIty
For companies with underfunded plans (after excluding companies with negative equity), Fasshauer et al. (2008) show that for the year 2005, on average, the excess of the defined-benefit obligation over plan assets, based on the mean/median, represented 17%/9% of total shareholders’ equity. The standard deviation was 24%. If we consider the mean, the average ratio of underfunding to shareholders’ equity was very high for companies in Germany (37%), the UK (22%), Belgium (21%) and Portugal (20%).
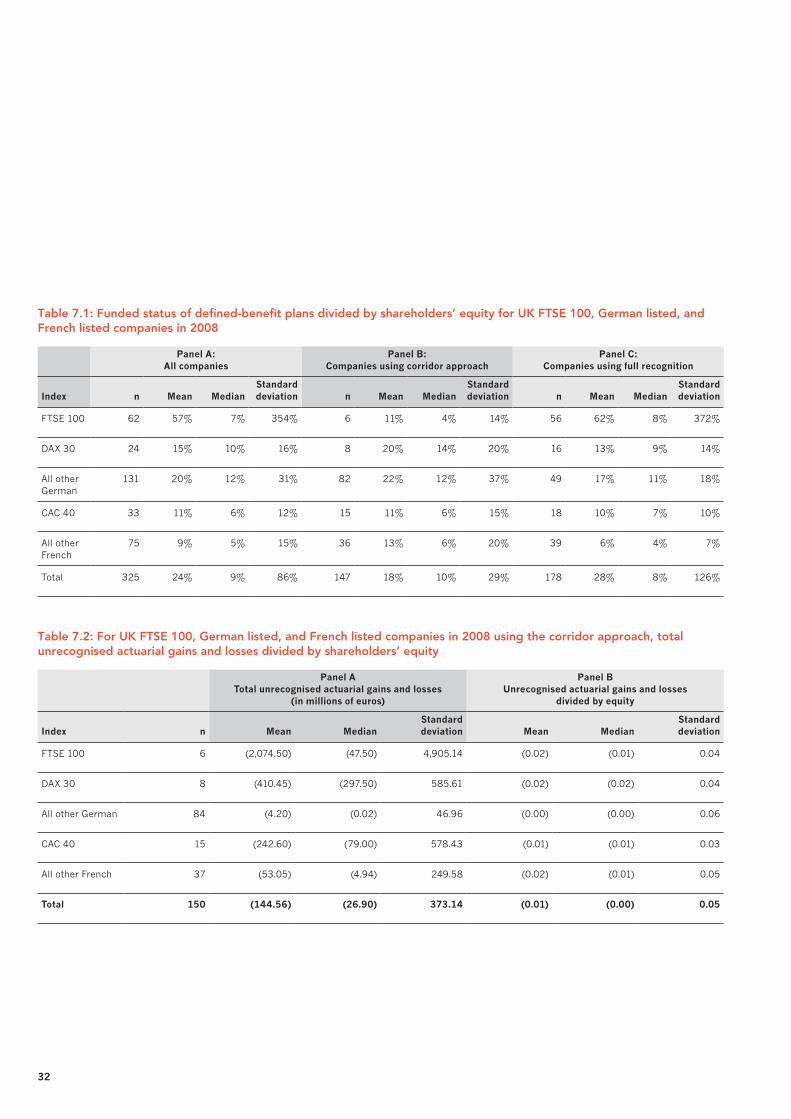
For the sample companies with underfunded plans (after excluding companies with negative equity), Table 7.1 (page 32) reports the excess of the defined-benefit obligation over the fair value of the plans’ assets (funded status) as a percentage of shareholders’ equity. As reported in Panel A of Table 7.1, for the mean/median, the average level of underfunding to shareholders’ equity for the 325 companies is 24%/9%. For the median, the average ratio of underfunding to shareholders’ equity for the UK FTSE is 7%; the standard deviation is very high at 354%. Overall, the highest average levels of underfunding expressed as a percentage of equity are found in Germany, where the mean/median ratios are 15%/10% and 20%/12% for the DAX 30 and all other German listed companies, respectively. In general, the ratio of underfunding to equity is lowest for French companies. For the CAC 40 and other French listed companies, the mean and median ratios are 11%/6%, and 9%/5%, respectively. These findings reflect not only the companies’ funding policies but also the relative importance of pensions in the three countries studied. Defined-benefit pension plans have historically been prevalent in the UK and Germany but not so widespread in France.
Panels B and C of Table 7.1 show the ratios of underfunding to equity for companies using the corridor and the full-recognition methods, respectively. The findings provide some evidence that higher levels of underfunding may have motivated certain DAX 30 companies to select the corridor method. Specifically, for DAX 30 companies, the mean/median ratio of underfunding to equity is 20%/14% for those companies using the corridor method, in contrast to 13%/9% for companies using the full recognition through SORIE method. The findings for the German small-cap companies point in the same direction, but the differences are not as pronounced, in particular not for the median (ie 12% for the corridor approach versus 11% for full recognition). Furthermore, while the findings show no noticeable differences in funding levels of companies using the corridor and full-recognition approaches among French CAC 40 companies, the findings for the other, smaller French listed companies again suggest that high levels of underfunding may be associated with a preference for the corridor approach. For these companies the mean/median ratio of underfunding to equity is 13%/6% for corridor-approach companies and 6%/4% for full-recognition companies.
7. estimated impact on equity of moving from the corridor method to full recognition
METHODS FOR RECOGNITION OF ACTUARIAL GAINS AND LOSSES UNDER IAS 19 17
tOtal UnReCOgnISeD aCtUaRIal gaInS anD lOSSeS aS a peRCentage Of ShaRehOlDeRS’ eqUIty
For companies using the corridor approach, Fasshauer et al.’s findings (2008) based on the ratio of unrecognised actuarial gains and losses to equity suggest that, ignoring tax implications, the mean/median impact of the recognition of currently unrecognised actuarial gains and losses would be to reduce equity on average by 4%/2%. Of particular interest, the ratio of unrecognised actuarial gains and losses to equity based on the mean was greatest for the four Irish (16%), eight German (11%) and two Portuguese (11%) companies using the corridor. As a majority of the companies based in these countries used the full recognition through SORIE option in 2005, the potential impact on equity of adopting a full recognition method for these Irish, German and Portuguese companies may represent their rationale for deviating from the national norm.
For the sample companies, total unrecognised actuarial gains and losses divided by shareholders’ equity are reported in Table 7.2 (page 32) Panel B for companies using the corridor method (after excluding companies with negative equity) in year 2008. The findings suggest that, ignoring tax implications, the mean/median impact of the recognition of currently unrecognised actuarial gains and losses for the sample companies would be to reduce equity on average by 1%/0%. The mean-based ratio of unrecognised actuarial gains and losses to equity was greatest for the FTSE 100, DAX 30, and all other French listed companies at 2%. Consistent with the findings of Fasshauer et al. (2008), this finding for six FTSE 100 companies and eight DAX 30 companies may help explain why they selected the corridor approach over the full recognition norm used by the majority of the companies within these indices.
18
In their review of the year 2005, discount (interest) rate assumption disclosures provided by European blue chips, Fasshauer et al. (2008) show that most of the companies differentiate the rates provided on the basis of the various geographic areas where their main pension plans are located. Therefore, Fasshauer et al. (2008) use this presentation format for their benchmarking analysis.
IAS 19 (paragraph 120A (n)) requires companies to disclose the assumptions underlying their pension accounting in absolute terms (ie as an absolute percentage) and not just as a margin between different percentages or other variables. In terms of transparency, most of the companies examined by Fasshauer et al. (2008) that used geographic presentation complied with this requirement by disclosing specific rates/assumptions for their respective home countries and for other countries/regions. Nonetheless, some disclosed only ranges or spans. Fasshauer et al. (2008) note that disclosing ranges or spans, without additional disclosure to guide the financial statement user, may hinder comparability and decrease transparency, thereby not adhering to the spirit of IAS 19.
IAS 19 (paragraph 78) requires companies to determine the discount rate used to estimate post-employment benefit obligations ‘by reference to market yields at the balance sheet date on high quality corporate bonds’. The standard also mandates that the currency and term of these bonds ‘shall be consistent with the currency and estimated term of the post-employment benefit obligations’. Since bond yields vary depending on the currency of denomination, meaningful benchmarking comparisons can be made only within countries.
In the study of defined-benefit pension plan disclosures for the year 2008, we extend the benchmarking analysis of Fasshauer et al. (2008) for discount rates based on companies’ country of domicile. Similarly, we exclude companies that used presentation formats other than geography and disclosed only ranges/spans. The following Figures illustrate how the discount rates reported by companies within each of the five indices cluster around the mean. For each sub-sample, we report only for those companies using the fiscal year end most common to the sub-sample and domiciled in the country hosting the index.
ftSe 100
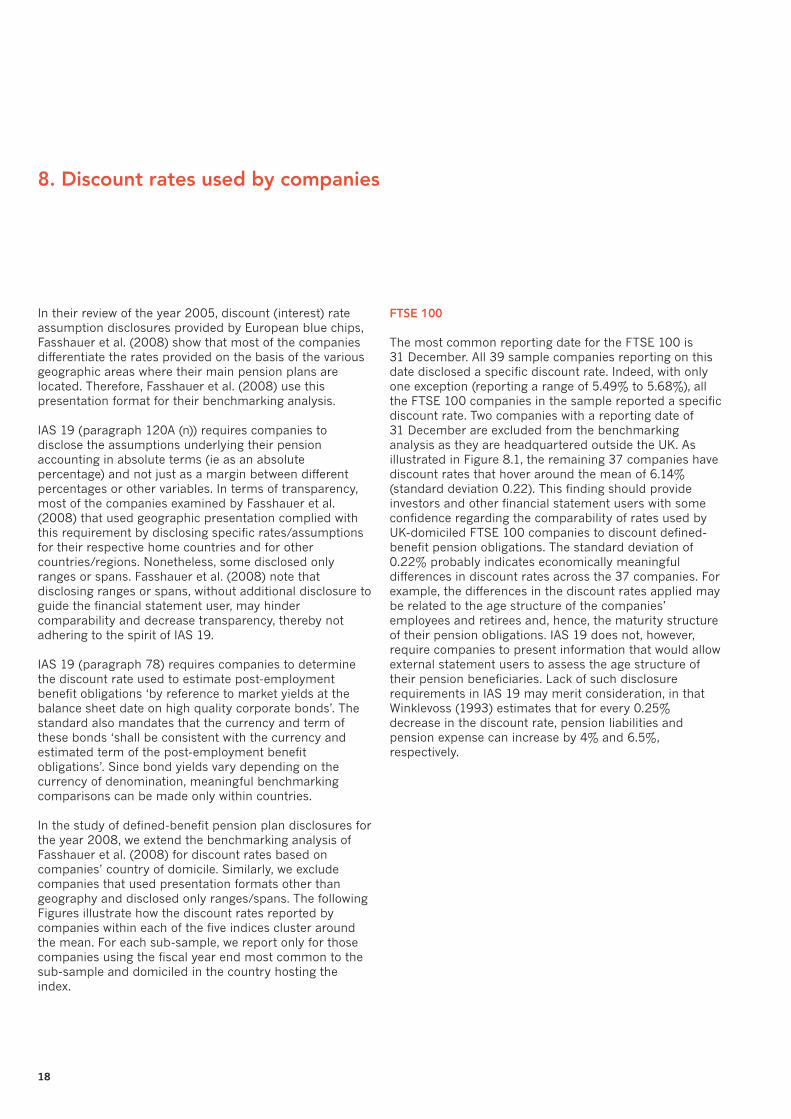
The most common reporting date for the FTSE 100 is 31 December. All 39 sample companies reporting on this date disclosed a specific discount rate. Indeed, with only one exception (reporting a range of 5.49% to 5.68%), all the FTSE 100 companies in the sample reported a specific discount rate. Two companies with a reporting date of 31 December are excluded from the benchmarking analysis as they are headquartered outside the UK. As illustrated in Figure 8.1, the remaining 37 companies have discount rates that hover around the mean of 6.14% (standard deviation 0.22). This finding should provide investors and other financial statement users with some confidence regarding the comparability of rates used by UK-domiciled FTSE 100 companies to discount defined-benefit pension obligations. The standard deviation of 0.22% probably indicates economically meaningful differences in discount rates across the 37 companies. For example, the differences in the discount rates applied may be related to the age structure of the companies’ employees and retirees and, hence, the maturity structure of their pension obligations. IAS 19 does not, however, require companies to present information that would allow external statement users to assess the age structure of their pension beneficiaries. Lack of such disclosure requirements in IAS 19 may merit consideration, in that Winklevoss (1993) estimates that for every 0.25% decrease in the discount rate, pension liabilities and pension expense can increase by 4% and 6.5%, respectively.
8. Discount rates used by companies
METHODS FOR RECOGNITION OF ACTUARIAL GAINS AND LOSSES UNDER IAS 19 19
figure 8.1: ftSe 100 – discount rate used year end 31 December 2008
Mean 6.14%; median 6.20%, standard deviation 0.22%.
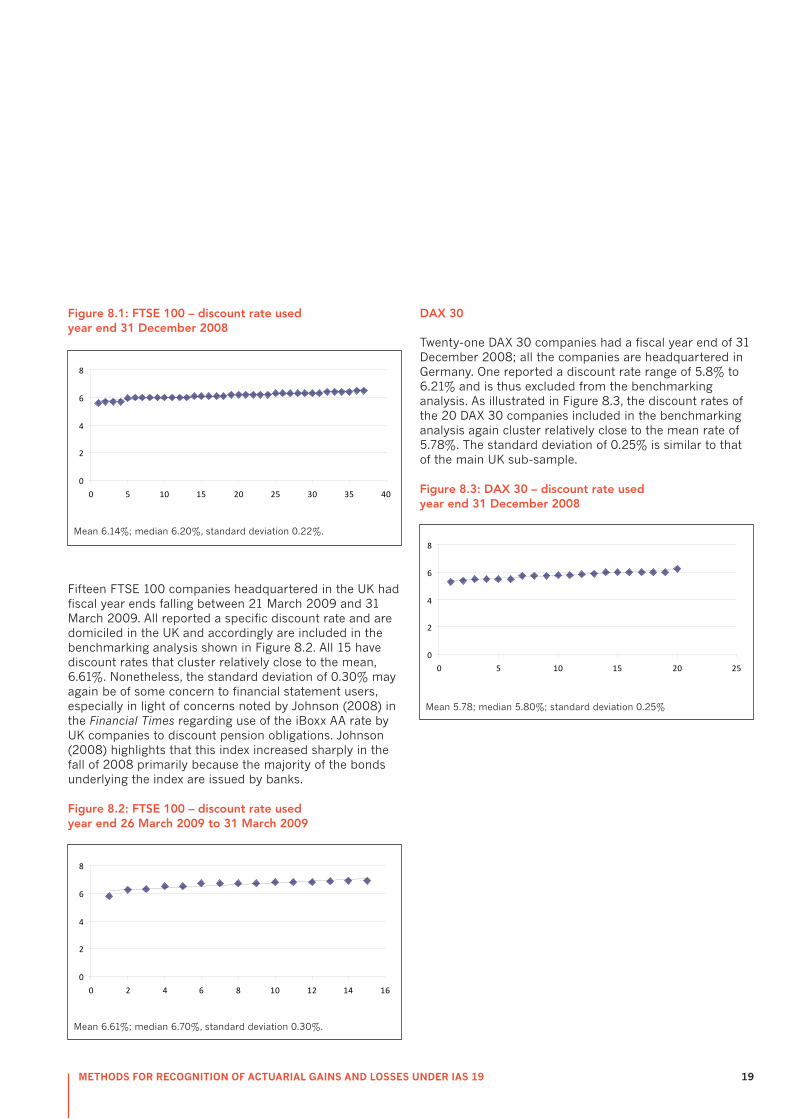
Fifteen FTSE 100 companies headquartered in the UK had fiscal year ends falling between 21 March 2009 and 31 March 2009. All reported a specific discount rate and are domiciled in the UK and accordingly are included in the benchmarking analysis shown in Figure 8.2. All 15 have discount rates that cluster relatively close to the mean, 6.61%. Nonetheless, the standard deviation of 0.30% may again be of some concern to financial statement users, especially in light of concerns noted by Johnson (2008) in the Financial Times regarding use of the iBoxx AA rate by UK companies to discount pension obligations. Johnson (2008) highlights that this index increased sharply in the fall of 2008 primarily because the majority of the bonds underlying the index are issued by banks.
figure 8.2: ftSe 100 – discount rate used year end 26 March 2009 to 31 March 2009
Mean 6.61%; median 6.70%, standard deviation 0.30%.
DaX 30
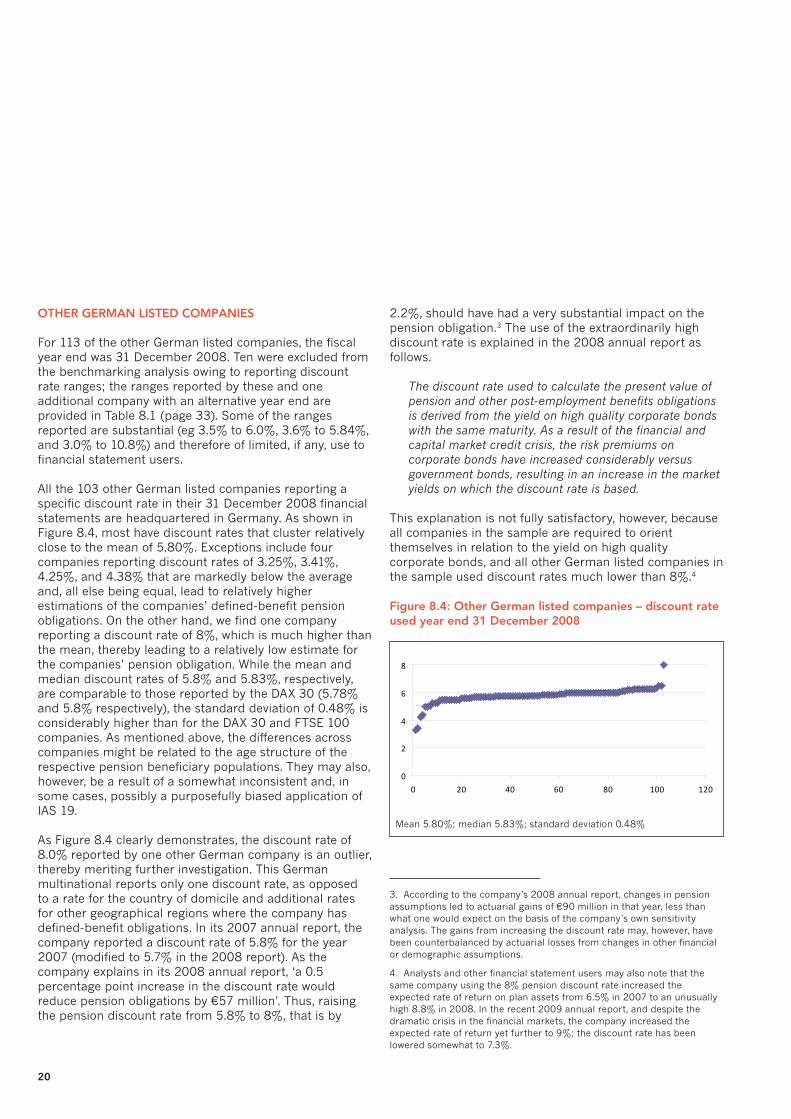
Twenty-one DAX 30 companies had a fiscal year end of 31 December 2008; all the companies are headquartered in Germany. One reported a discount rate range of 5.8% to 6.21% and is thus excluded from the benchmarking analysis. As illustrated in Figure 8.3, the discount rates of the 20 DAX 30 companies included in the benchmarking analysis again cluster relatively close to the mean rate of 5.78%. The standard deviation of 0.25% is similar to that of the main UK sub-sample.
figure 8.3: DaX 30 – discount rate used year end 31 December 2008
Mean 5.78; median 5.80%; standard deviation 0.25%
FTSE 100: Discount Rate UsedYear end 31/12/2008
0
2
4
6
8
0 5 10 15 20 25 30 35 40
FTSE 100: Discount Rate Used: Year end 26/3/09-31/3/09
0
2
4
6
8
0 2 4 6 8 10 12 14 16
DAX 30: Discount Rate Used: Year end 31/12/2008
0
2
4
6
8
0 5 10 15 20 25
20
OtheR geRMan lISteD COMpanIeS
For 113 of the other German listed companies, the fiscal year end was 31 December 2008. Ten were excluded from the benchmarking analysis owing to reporting discount rate ranges; the ranges reported by these and one additional company with an alternative year end are provided in Table 8.1 (page 33). Some of the ranges reported are substantial (eg 3.5% to 6.0%, 3.6% to 5.84%, and 3.0% to 10.8%) and therefore of limited, if any, use to financial statement users.
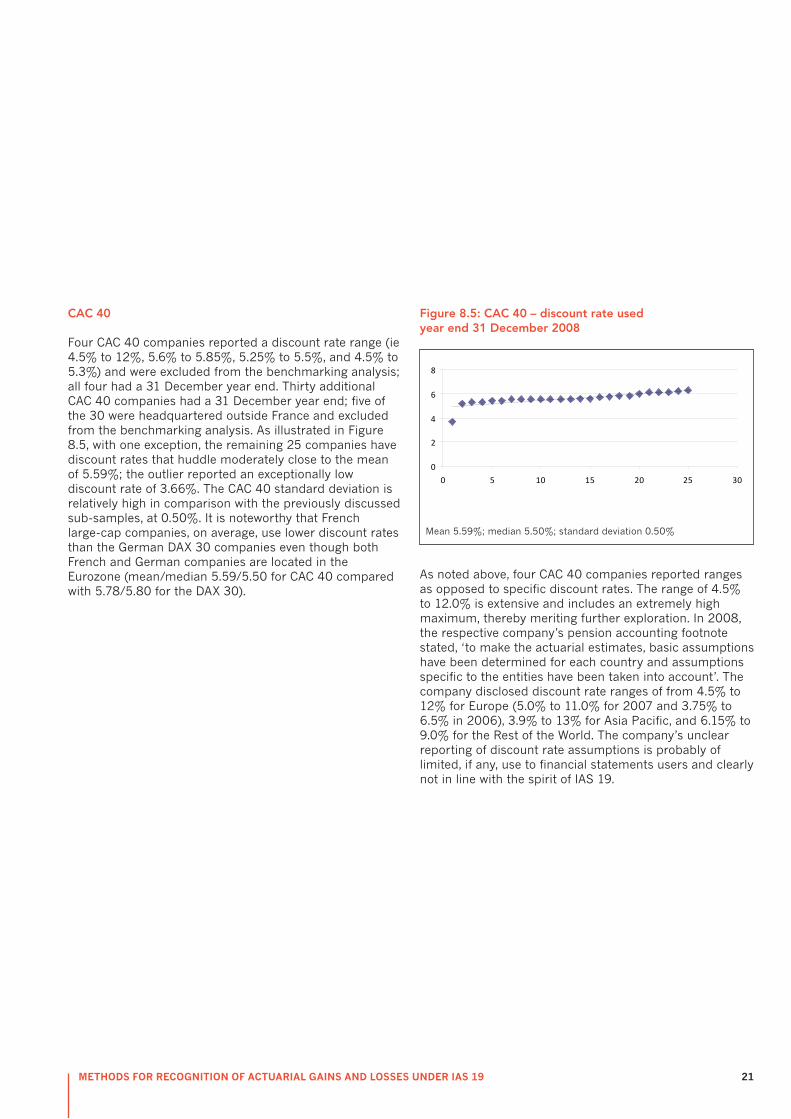
All the 103 other German listed companies reporting a specific discount rate in their 31 December 2008 financial statements are headquartered in Germany. As shown in Figure 8.4, most have discount rates that cluster relatively close to the mean of 5.80%. Exceptions include four companies reporting discount rates of 3.25%, 3.41%, 4.25%, and 4.38% that are markedly below the average and, all else being equal, lead to relatively higher estimations of the companies’ defined-benefit pension obligations. On the other hand, we find one company reporting a discount rate of 8%, which is much higher than the mean, thereby leading to a relatively low estimate for the companies’ pension obligation. While the mean and median discount rates of 5.8% and 5.83%, respectively, are comparable to those reported by the DAX 30 (5.78% and 5.8% respectively), the standard deviation of 0.48% is considerably higher than for the DAX 30 and FTSE 100 companies. As mentioned above, the differences across companies might be related to the age structure of the respective pension beneficiary populations. They may also, however, be a result of a somewhat inconsistent and, in some cases, possibly a purposefully biased application of IAS 19.
As Figure 8.4 clearly demonstrates, the discount rate of 8.0% reported by one other German company is an outlier, thereby meriting further investigation. This German multinational reports only one discount rate, as opposed to a rate for the country of domicile and additional rates for other geographical regions where the company has defined-benefit obligations. In its 2007 annual report, the company reported a discount rate of 5.8% for the year 2007 (modified to 5.7% in the 2008 report). As the company explains in its 2008 annual report, ‘a 0.5 percentage point increase in the discount rate would reduce pension obligations by €57 million’. Thus, raising the pension discount rate from 5.8% to 8%, that is by
2.2%, should have had a very substantial impact on the pension obligation.3 The use of the extraordinarily high discount rate is explained in the 2008 annual report as follows.
The discount rate used to calculate the present value of pension and other post-employment benefits obligations is derived from the yield on high quality corporate bonds with the same maturity. As a result of the financial and capital market credit crisis, the risk premiums on corporate bonds have increased considerably versus government bonds, resulting in an increase in the market yields on which the discount rate is based.
This explanation is not fully satisfactory, however, because all companies in the sample are required to orient themselves in relation to the yield on high quality corporate bonds, and all other German listed companies in the sample used discount rates much lower than 8%.4
figure 8.4: Other german listed companies – discount rate used year end 31 December 2008
Mean 5.80%; median 5.83%; standard deviation 0.48%
3. According to the company’s 2008 annual report, changes in pension assumptions led to actuarial gains of €90 million in that year, less than what one would expect on the basis of the company’s own sensitivity analysis. The gains from increasing the discount rate may, however, have been counterbalanced by actuarial losses from changes in other financial or demographic assumptions.
4. Analysts and other financial statement users may also note that the same company using the 8% pension discount rate increased the expected rate of return on plan assets from 6.5% in 2007 to an unusually high 8.8% in 2008. In the recent 2009 annual report, and despite the dramatic crisis in the financial markets, the company increased the expected rate of return yet further to 9%; the discount rate has been lowered somewhat to 7.3%.
Other German Companies: Discount Rate Used: Year End 31/12/2008
0
2
4
6
8
0 20 40 60 80 100 120
METHODS FOR RECOGNITION OF ACTUARIAL GAINS AND LOSSES UNDER IAS 19 21
CaC 40
Four CAC 40 companies reported a discount rate range (ie 4.5% to 12%, 5.6% to 5.85%, 5.25% to 5.5%, and 4.5% to 5.3%) and were excluded from the benchmarking analysis; all four had a 31 December year end. Thirty additional CAC 40 companies had a 31 December year end; five of the 30 were headquartered outside France and excluded from the benchmarking analysis. As illustrated in Figure 8.5, with one exception, the remaining 25 companies have discount rates that huddle moderately close to the mean of 5.59%; the outlier reported an exceptionally low discount rate of 3.66%. The CAC 40 standard deviation is relatively high in comparison with the previously discussed sub-samples, at 0.50%. It is noteworthy that French large-cap companies, on average, use lower discount rates than the German DAX 30 companies even though both French and German companies are located in the Eurozone (mean/median 5.59/5.50 for CAC 40 compared with 5.78/5.80 for the DAX 30).
figure 8.5: CaC 40 – discount rate used year end 31 December 2008
Mean 5.59%; median 5.50%; standard deviation 0.50%
As noted above, four CAC 40 companies reported ranges as opposed to specific discount rates. The range of 4.5% to 12.0% is extensive and includes an extremely high maximum, thereby meriting further exploration. In 2008, the respective company’s pension accounting footnote stated, ‘to make the actuarial estimates, basic assumptions have been determined for each country and assumptions specific to the entities have been taken into account’. The company disclosed discount rate ranges of from 4.5% to 12% for Europe (5.0% to 11.0% for 2007 and 3.75% to 6.5% in 2006), 3.9% to 13% for Asia Pacific, and 6.15% to 9.0% for the Rest of the World. The company’s unclear reporting of discount rate assumptions is probably of limited, if any, use to financial statements users and clearly not in line with the spirit of IAS 19.
CAC 40: Discount Rate Used Year End 31/12/2008
0
2
4
6
8
0 5 10 15 20 25 30
22
OtheR fRenCh lISteD COMpanIeS
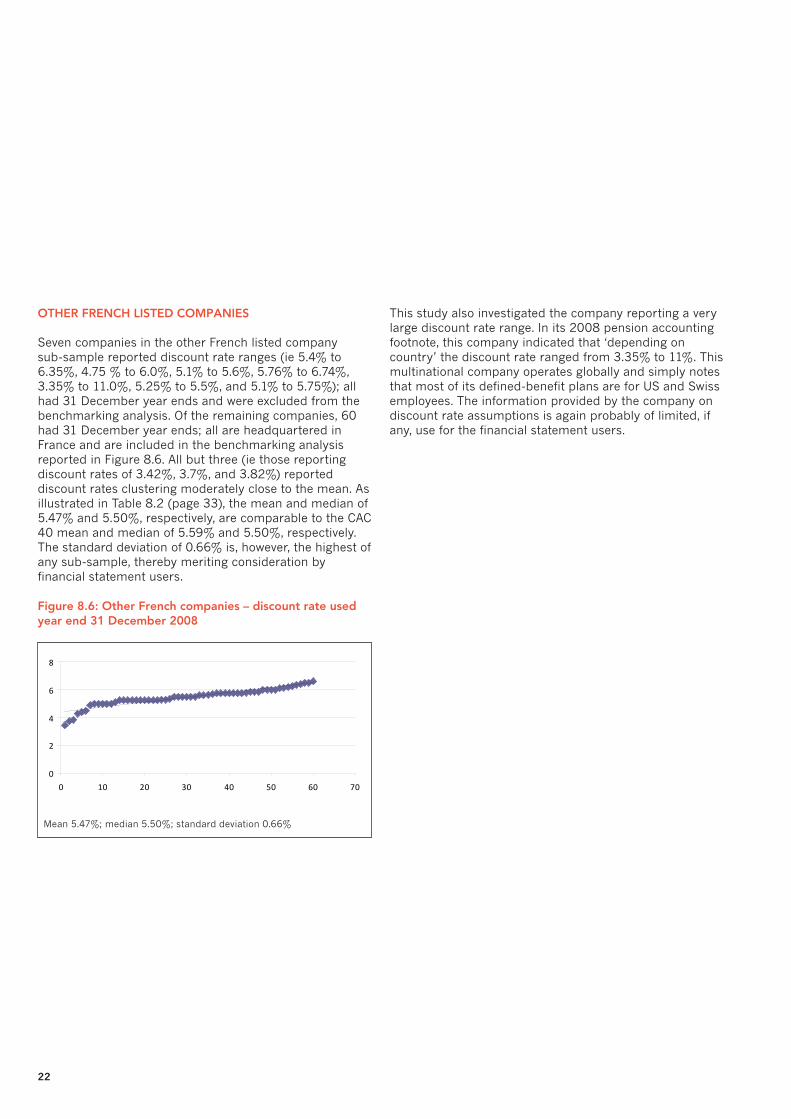
Seven companies in the other French listed company sub-sample reported discount rate ranges (ie 5.4% to 6.35%, 4.75 % to 6.0%, 5.1% to 5.6%, 5.76% to 6.74%, 3.35% to 11.0%, 5.25% to 5.5%, and 5.1% to 5.75%); all had 31 December year ends and were excluded from the benchmarking analysis. Of the remaining companies, 60 had 31 December year ends; all are headquartered in France and are included in the benchmarking analysis reported in Figure 8.6. All but three (ie those reporting discount rates of 3.42%, 3.7%, and 3.82%) reported discount rates clustering moderately close to the mean. As illustrated in Table 8.2 (page 33), the mean and median of 5.47% and 5.50%, respectively, are comparable to the CAC 40 mean and median of 5.59% and 5.50%, respectively. The standard deviation of 0.66% is, however, the highest of any sub-sample, thereby meriting consideration by financial statement users.
figure 8.6: Other french companies – discount rate used year end 31 December 2008
Mean 5.47%; median 5.50%; standard deviation 0.66%
This study also investigated the company reporting a very large discount rate range. In its 2008 pension accounting footnote, this company indicated that ‘depending on country’ the discount rate ranged from 3.35% to 11%. This multinational company operates globally and simply notes that most of its defined-benefit plans are for US and Swiss employees. The information provided by the company on discount rate assumptions is again probably of limited, if any, use for the financial statement users.
Other French Companies: Discount Rate Used: Year End 31/12/2008
0
2
4
6
8
0 10 20 30 40 50 60 70
METHODS FOR RECOGNITION OF ACTUARIAL GAINS AND LOSSES UNDER IAS 19 23
RISe In DISCOUnt RateS fROM 2005 thROUgh 2008
Table 8.3 (page 34) reports descriptive statistics for the discount rate assumptions reported by FTSE 100, DAX 30 and CAC 40 companies with 31 December fiscal year ends for 2005 through 2008. The discount rate increased each year for all three blue chip indices. If we look at the mean, the rate climbed from 4.82% to 6.14% for the FTSE 100; 4.25% to 5.78% for the DAX 30; and 4.33% to 5.59 for the CAC 40. As noted previously, discount rate increases result in large decreases in defined-benefit obligations. Furthermore, part of the discount-rate increase (and the corresponding obligation decreases) in 2008 may have occurred because in practice many of these companies orient themselves to the iBoxx AA rate. As noted previously, this rate is strongly influenced by bonds issued by banks, which suffered dramatically in 2008 (Johnson 2008).
In the company’s 2008 annual report, Salzgitter – a DAX 30 company – discusses the limitations of the iBoxx index. On pages 194 and 195 on its annual report, Salzgitter explains:
Due to the financial market/credit crisis there are a number of market distortions which are affecting the returns on even high-quality corporate bonds and which are therefore having an impact on the actuarial interest rates derived from them, with the result that, as of the balance sheet date, bonds from corporations in the financial sector were still providing disproportionately high market returns. It was against this backdrop that the company decided to eliminate the financial bonds in the iBoxx index when deriving the yield curve. This resulted in an unchanged actuarial interest rate of 5.25%, compared with the previous year, as of the balance sheet date.
It is important to note that the 2008 discount rate of 5.25% used by Salzgitter is lower than the mean discount rate of 5.78% used by the sub-sample of DAX 30 companies. The rate is also lower than the mean discount rates of 6.14% and 5.59% used by FTSE 100 and CAC 40 companies.
As highlighted by Salzgitter, unless adjusted for the effect of the banking crisis, the use of the iBoxx AA rate by non-financial companies in year 2008 may have led to questionable accounting effects. Altogether one might question whether the substantial discount-rate-induced decreases in the pension obligations are an economically meaningful representation of the true effects of the financial crisis on the companies’ financial situation.
For every year between 2005 and 2008, the standard deviation of FTSE 100 companies with 31 December year ends is less than 0.25%. With the exception of 2006 (0.14%), the standard deviation for DAX 30 companies equals or slightly exceeds 0.25%. For the CAC 40, the standard deviation for the discount rate is 0.32% in both 2005 and 2006 and rises slightly to 0.37% in 2007. The increase to 0.50% in 2008 is substantial and represents the largest of the sub-samples.
24
This technical report extends the findings of Fasshauer et al. (2008) and provides further evidence supporting the IASB’s proposal, in its outstanding ED, to eliminate the corridor method and require full recognition of actuarial gains and losses. We find that use of IAS 19’s full recognition methods has increased among European listed companies since 2005 in the interest of providing ‘more relevant information’ by ‘more fairly presenting the fair value of assets and liabilities’ and thereby more ‘accurately representing the funding status of the plans’.5 Even so, use of the corridor method remains relatively widespread among German and French listed companies, especially among German small caps.
For year-end 2008, the findings, for listed companies constituting the domestic market for Europe’s three largest economies, reveal that full recognition remained the overwhelming norm (mean 92%) for FTSE 100 companies. For Germany’s DAX 30 companies, use of the full recognition through SORIE option grew from 56% in 2005 to 67% in 2008. Nonetheless, the findings indicate that the corridor method was the preference of other German listed companies in 2008, with approximately two-thirds selecting this method. Thus, the findings for Germany suggest that the preference for the recognition method depends on size and listing status, with full recognition being substantially more widespread among DAX 30 companies than among smaller German listed companies. This finding may be associated with the stronger international capital market orientation of DAX 30 companies.
For CAC 40 companies, we find that full recognition methods for actuarial gains and losses has evolved from being the preference of a small minority of 22% in 2005 to becoming the choice of a slim majority of 55% in 2008. The findings are similar for French small caps, with a slight majority of 52% selecting full recognition in 2008. Thus, in France, no evidence is found of the size and listing status effect identified for German companies.
5. Quotations taken from various annual reports quoted in Chapter 5 of this report.
For companies using the IAS 19 corridor method, important information regarding the funded status of defined-benefit pension plans is disclosed only in the footnotes and is not fully recognised in the balance sheet. For the sample companies we find that, on average, the defined-benefit pension plans are underfunded. On average, the defined-benefit obligation exceeds the fair value of the plan assets by €544.5 million for the FTSE 100, €2,235.6 million for the DAX 30, €520.0 million for all other German listed companies, €1,520.1 million for CAC 40 companies, and €87.7 million for all other French listed companies. There is very substantial standard deviation of €1,135.1 million, €2,574.0 million, and €198.3 million for FTSE 100, CAC 40, and other French companies, respectively.
Compared with Fasshauer et al.’s findings (2008), the 2008 results reveal that the level of underfunding has decreased somewhat since 2005 in all three countries. While this may at first appear surprising given the severe financial and credit crisis that emerged in 2008, decreases in the value of companies’ plan assets caused by the market decline were more than compensated by a discount-rate-driven decrease in the value of defined-benefit obligations. The analysis of discount rate assumptions reported in 2008 by sample companies supports concerns that some European companies may have selected discount rates that allowed them to understate recognised defined-benefit obligations.
For each sub-sample, we have calculated the ratio of underfunding (the excess of the defined-benefit obligation over the fair value of plan assets) to shareholders’ equity for companies using the corridor and those using full recognition methods. We find some evidence that higher levels of underfunding may have motivated certain DAX 30 companies to select the corridor method. For DAX 30 companies, the mean/median ratio of underfunding to equity is 20%/14% for those companies using the corridor method compared with 13%/9% for companies using the full recognition through SORIE method. The findings for German small-caps are similar, but the differences are not as pronounced, in particular not for the median (ie 12% for the corridor approach versus 11% for full recognition). Furthermore, while we do not find noticeable differences in funding levels of companies using the corridor and full-recognition methods among French CAC 40 companies,
9. Summary
METHODS FOR RECOGNITION OF ACTUARIAL GAINS AND LOSSES UNDER IAS 19 25
the findings for the smaller French listed companies again suggest that high levels of underfunding may be associated with a preference for the corridor approach. For French small caps, the mean/median ratio of underfunding to equity is 13%/6% for corridor approach companies and 6%/4% for full-recognition companies.
For companies using the corridor approach, the analysis also indicates that, ignoring tax implications, the mean/median impact of recognising currently unrecognised actuarial gains and losses would be to reduce equity for sample companies on average by 1% (mean)/0% (median). If we look at the mean, the ratio of unrecognised actuarial gains and losses to equity was greatest for the FTSE 100, DAX 30, and all other French listed companies at 2%. The finding for six FTSE 100 companies and eight DAX 30 companies may provide some insight into why these companies chose the corridor method over the full recognition methods used by the majority of the companies represented in these indices.
We additionally extend Fasshauer et al.’s benchmarking analysis of discount rate assumptions (2008). For this analysis, we exclude companies that used presentation formats other than geography, disclosing only ranges/spans, and headquartered outside the country hosting the index. For FTSE 100 companies with 31 December year ends and meeting the benchmarking criteria, all 37 had discount rates that drift around the mean of 6.14% (standard deviation 0.22). The finding should provide financial statement users with some confidence regarding the comparability of rates that UK-domiciled FTSE 100 companies are using to discount defined-benefit pension obligations. The standard deviation is probably associated with economically meaningful variations in discount rates across the companies. For example, variations in the discount rates used may be associated with the age structure of the companies’ employees and retirees and, accordingly, the maturity structure of their pension obligations. IAS 19 does not, however, require disclosures that enable external users to assess the age structure of pension beneficiaries. The absence of such disclosure requirements in IAS 19 may merit consideration by the IASB, in that Winklevoss (1993) estimates that for a 0.25% decrease in the discount rate, pension liabilities and pension expenses can rise 4% and 6.5%, respectively.
The 20 DAX 30 companies with 31 December year ends included in the benchmarking analysis also hover fairly close to the mean discount rate of 5.78%. In line with the UK sub-sample, the standard deviation is 0.25%. One hundred and three other German listed companies with a 31 December year end are included in the benchmarking analysis. Again, most report discount rates relatively close to the mean of 5.80%. Exceptions include four companies that report discount rates substantially below the average, which, all other things being equal, leads to relatively higher valuations of the companies’ pension obligations. Additionally, we identify one company reporting a discount rate of 8%, which is much higher than the mean, thus, leading to a relatively low estimate of its pension obligation.
While the mean and median discount rates of 5.8% and 5.83%, respectively, for the other German listed companies are comparable to those reported by the DAX 30 (5.78% and 5.8% respectively), the standard deviation of 0.48% is notably higher than for the DAX 30 and FTSE 100 companies. As discussed previously, the differences across companies might be related to the age structure of the respective pension beneficiary populations. Such differences may also, however, be associated with a somewhat inconsistent and, in some instances perhaps deliberately, biased application of IAS 19. The potential for such bias, particularly if associated with use of the iBoxx rate in 2008, is explained as noted previously in the 2008 pension disclosures of the DAX 30 company Salzgitter and by Johnson (2008) in the Financial Times.
Twenty-five CAC 40 companies with 31 December year ends are included in the benchmarking analysis; with the exception of one, all have discount rates that cluster moderately close to the mean of 5.59%. The outlier reported an exceptionally low discount rate of 3.66%. The CAC 40 standard deviation is relatively high in comparison with the previously discussed subsamples at 0.50%. It is notable that French large-caps, on average, use lower discount rates than the German DAX 30 companies, even though both French and German companies are located in the Eurozone (mean/median 5.59/5.50 for CAC 40 in contrast to 5.78/5.80 for the DAX 30).
26
Sixty other French listed companies with 31 December year ends were included in the benchmarking analysis. All but three (ie 3.42%, 3.7%, and 3.82%) reported discount rates hovering moderately close to the mean. The mean and median of 5.47% and 5.50%, respectively, are comparable to the CAC 40 mean and median of 5.59% and 5.50%, respectively. Nonetheless, the standard deviation of 0.66% is the highest of any of the sub-samples, hence meriting consideration by financial statement users.
The analysis of discount rates reported from 2005 to 2008 by FTSE 100, DAX 30, and CAC 40 companies with 31 December year ends reveals that the mean discount rate increased each year for all three blue chip indices. Looking at the mean, the rate climbed from 4.82% to 6.14% for the FTSE 100; 4.25% to 5.78% for the DAX 30; and 4.33% to 5.59 for the CAC 40. As noted before, discount rate increases result in large decreases in defined-benefit obligations. Some of the discount-rate increases (and corresponding obligation decreases) in 2008 may have been because many companies oriented themselves to the iBoxx AA rate. This rate is heavily influenced by bonds issued by banks, which suffered dramatically in 2008. Unless modified for the effect of the banking crisis, as alluded to by Salzgitter in its 2008 annual report (see Chapter 8), use of the iBoxx AA rate by non-financial companies may have led to questionable accounting effects. Indeed, one might question whether the sizeable discount-rate-induced decreases in pension obligations are an economically meaningful representation of the true effects of the financial crisis on the companies’ financial situation.
In conclusion, the findings reveal that, while the use of the IAS 19 full-recognition methods has increased in European since 2005, use of the corridor method remains relatively widespread among German and French listed companies. We additionally find that, ignoring tax implications, the mean/median impact of the recognition of currently unrecognised actuarial gains and losses for the sample companies using the corridor method would be to reduce equity on average by 1%/0%. The ratio of unrecognised actuarial gains and losses to equity was greatest for the FTSE 100, DAX 30, and all other French listed companies at 2%. Combined these findings support the IASB’s proposal to eliminate the corridor method and require full recognition of actuarial gains and losses.
The analysis of discount rate assumptions reported by sample companies in 2008 also should encourage the IASB to move forward in developing an ED addressing the discount rate used for measuring employee benefits. Furthermore, the review of discount rates indicates that several companies are not fully complying with the spirit of IAS 19. Several companies reported discount rate ranges/spans as opposed to specific points, and some multinationals with pension plans in several geographic regions reported only one rate. The latter should be of considerable concern to regulators and auditors.
METHODS FOR RECOGNITION OF ACTUARIAL GAINS AND LOSSES UNDER IAS 19 27
Fasshauer, J., Glaum, M. and Street, D.L. (2008), Adoption of IAS 19 by Europe’s Premier Listed Companies, research report no. 100 [online PDF report], <http://www.accaglobal.com/pubs/general/activities/research/research_archive/rr-100-001.pdf>, accessed 30 September 2010.
IASB (International Accounting Standards Board) (2004), IAS 19 amended Employee Benefits, December (London).
IASB (International Accounting Standards Board) (2008), Preliminary Views on Amendments to IAS 19: Employee Benefits, discussion paper, March (London).
IASB (International Accounting Standards Board) (2010), Defined Benefit Plans: Proposed Amendments to IAS 19, exposure draft (London).
Johnson, S. (2008), ‘UK Pensions Beat the Crash’ [online text], 19 October, Financial Times, <http://us.ft.com/ftgateway/superpage.ft?news_id=fto101920081613587192>, accessed 30 September 2010.
Winklevoss, H.E. (1993), Pension Mathematics with Numerical Illustrations, 2nd ed. (Philadelphia: University of Pennsylvania).
References
28
table 3.1:Sample selection process step 1 – UK ftSe 100 and all german and french listed companies in year 2008 with defined-benefit pension plans and providing english-language IfRS annual reports
Country Index
Companies included in index US GAAP
No English-
language website
No English-
language annual
report on website
No annual report in
any language
on website
No defined-
benefit pension note in annual report
Non-tranparent
and/or incomplete
pension note
Insolvent, liquidated,
or acquired
Total removed
Total in initial
sample
UK FTSE 100 100 2 0 0 0 0 0 0 2 98
Germany DAX 30 29 0 0 0 0 0 1 1 2 27
All other 595 1 57 184 36 36 6 5 325 270
France CAC 40 40 0 0 0 0 0 1 0 1 39
All other 421 1 28 225 8 10 1 0 273 148
Total 1,185 4 85 409 44 46 9 6 603 582
table 3.2: Sample selection process step 2 – UK ftSe 100 and all german and french listed companies in year 2008 providing english-language IfRS annual reports with material defined-benefit plans in year 2008
Country Index
Companies remaining after step 1 of
selection processCompanies with
defined-benefit plans
Companies with material defined-
benefit plans defined representing 1% of
total assets
Companies with material defined-
benefit plans defined representing 2% of
total assets
UK FTSE 100 98 88 71 65
Germany DAX 30 27 27 24 21
All other 270 211 134 118
France CAC 40 39 39 33 28
All other 148 133 80 57
Total 582 498 342 289
appendix: tables
METHODS FOR RECOGNITION OF ACTUARIAL GAINS AND LOSSES UNDER IAS 19 29
table 4.1: Descriptive statistics – UK ftSe 100 and all german listed and french listed companies in year 2008 providing english-language IfRS annual reports with material defined benefit plans in year 2008 (reported in millions of euros)
Total assets Total revenues
Country Index n Mean MedianStandard deviation Mean Median
Standard deviation
UK FTSE 100 71 36,624.0 10,389.5 77,986.8 1,157.1 270.9 3,093.4
Germany DAX 30 24 109,062.3 46,251.0 194,169.2 1,324.1 1,249.5 1,373.5
All other German listed companies
134 3,812.8 487.0 19,002.8 31.7 10.3 532.2
France CAC 40 33 66,146.5 31,577.0 118,084.9 1,972.1 1,220.0 2,381.3
All other French listed companies
80 3,935.2 1,500.3 6,616.7 52.5 37.3 333.2
Total 342 24,053.7 8,991.2 50,203.6 548.1 274.4 1,254.8
30
table 5.1: Method Used by european blue chips in year 2007 for the recognition of actuarial gains and losses under IaS 19
Country: index
Percent using a full-recognition
method in 2005
Percent using a full-recognition method in 2007
Number using corridor method in 2007
Number using full recognition through
P&L method in 2007
Number using full recognition through
SORIE method in 2007
UK: FTSE 100 90 90 6 1 56
Ireland: ISEQ 20 76 86 2 0 12
UK and Ireland Subtotal 88 90 8 1 68
Netherlands: AEX 27 39 8 2 3
Greece: ATHEX 20 33 33 2 1 0
Austria: ATX 38 50 8 1 7
Belgium: BEL 20 33 50 5 1 4
France: CAC 40 18 50 14 0 14
Germany: DAX 30 56 72 5 0 13
Spain: IBEX 35 33 50 2 0 2
Luxembourg: LUXX 50 0 1 0 0
Italy: MIB 30 43 29 5 0 2
Norway: OBX 11 13 7 0 1
Denmark OMXC 20 73 70 3 0 7
Finland OMXH 25 0 9 21 0 2
Sweden OMXS 30 14 38 10 1 5
Portugal: PSI 20 67 67 2 0 4
Switzerland: SMI 18 27 11 0 4
All others subtotal 29 41 104 6 68
Total 49 56 112 7 136
METHODS FOR RECOGNITION OF ACTUARIAL GAINS AND LOSSES UNDER IAS 19 31
table 6.1: funded status of defined-benefit pension plans by country/index (reported in millions of euros)
Defined-benefit obligation Plan assets Underfunded status of plan
Country Index n Mean MedianStandard deviation Mean Median
Standard deviation Mean Median
Standard deviation
UK FTSE 100 71 4,517.8 1,595.6 7,210.7 3,973.3 1,513.4 6,264.2 544.5 179.5 1,135.1
Germany DAX 30 24 7,444.1 6,927.5 6,812.8 4,671.7 2,422.5 5,269.5 2,235.6 1,156.2 2,170.5
Germany All other 134 134 387.6 36.2 1,605.6 158.3 2.5 520.0 229.4 21.3
France CAC 40 33 4,145.6 1,984.5 5,808.1 2,625.4 1,010.0 4,525.5 1,520.1 725.0 2,574.0
France All other 80 381.3 48.5 1,309.8 293.5 24.0 1,264.9 87.7 25.2 198.3
Total 342 2,101.4 1,034.4 3,471.0 1,536.7 588.2 2,606.6 527.0 202.6 1,167.4 342
Note: The amounts reported are for companies with defined-benefit obligations exceeding one per cent or more of total assets.
32
table 7.1: funded status of defined-benefit plans divided by shareholders’ equity for UK ftSe 100, german listed, and french listed companies in 2008
Panel A: All companies
Panel B: Companies using corridor approach
Panel C: Companies using full recognition
Index n Mean MedianStandard deviation n Mean Median
Standard deviation n Mean Median
Standard deviation
FTSE 100 62 57% 7% 354% 6 11% 4% 14% 56 62% 8% 372%
DAX 30 24 15% 10% 16% 8 20% 14% 20% 16 13% 9% 14%
All other German
131 20% 12% 31% 82 22% 12% 37% 49 17% 11% 18%
CAC 40 33 11% 6% 12% 15 11% 6% 15% 18 10% 7% 10%
All other French
75 9% 5% 15% 36 13% 6% 20% 39 6% 4% 7%
Total 325 24% 9% 86% 147 18% 10% 29% 178 28% 8% 126%
table 7.2: for UK ftSe 100, german listed, and french listed companies in 2008 using the corridor approach, total unrecognised actuarial gains and losses divided by shareholders’ equity
Panel A Total unrecognised actuarial gains and losses
(in millions of euros)
Panel B Unrecognised actuarial gains and losses
divided by equity
Index n Mean MedianStandard deviation Mean Median
Standard deviation
FTSE 100 6 (2,074.50) (47.50) 4,905.14 (0.02) (0.01) 0.04
DAX 30 8 (410.45) (297.50) 585.61 (0.02) (0.02) 0.04
All other German 84 (4.20) (0.02) 46.96 (0.00) (0.00) 0.06
CAC 40 15 (242.60) (79.00) 578.43 (0.01) (0.01) 0.03
All other French 37 (53.05) (4.94) 249.58 (0.02) (0.01) 0.05
Total 150 (144.56) (26.90) 373.14 (0.01) (0.00) 0.05
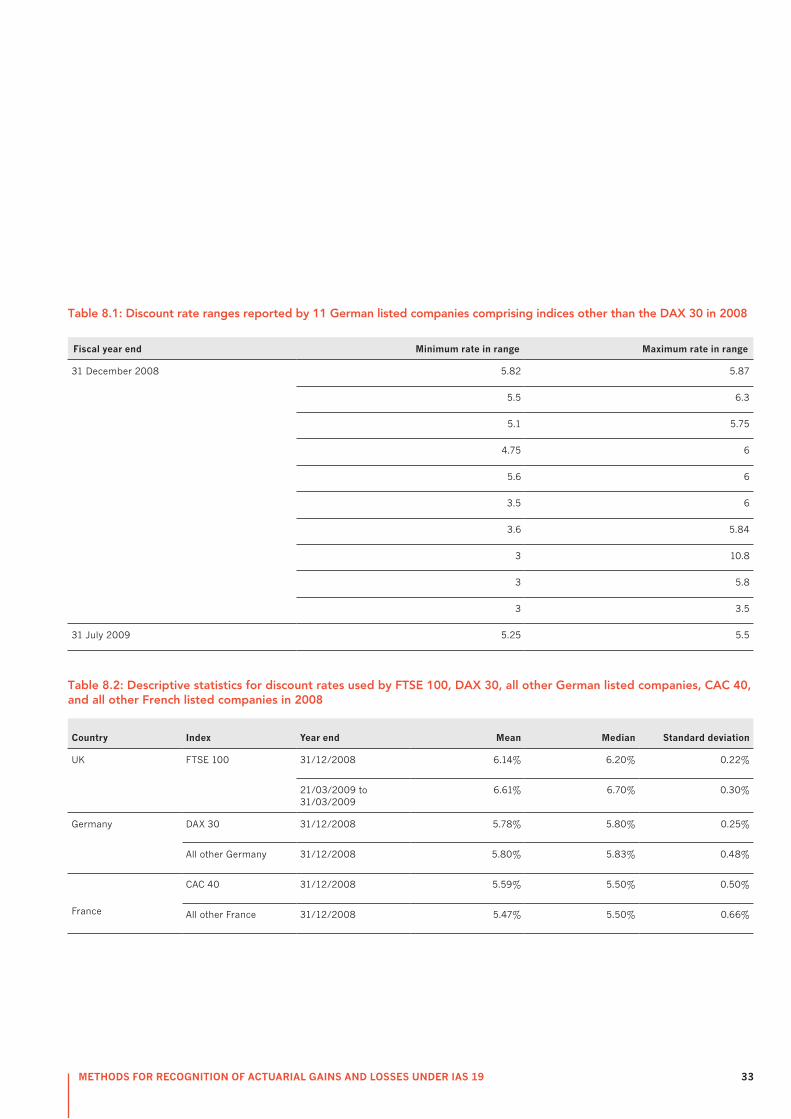
METHODS FOR RECOGNITION OF ACTUARIAL GAINS AND LOSSES UNDER IAS 19 33
table 8.1: Discount rate ranges reported by 11 german listed companies comprising indices other than the DaX 30 in 2008
Fiscal year end Minimum rate in range Maximum rate in range
31 December 2008 5.82 5.87
5.5 6.3
5.1 5.75
4.75 6
5.6 6
3.5 6
3.6 5.84
3 10.8
3 5.8
3 3.5
31 July 2009 5.25 5.5
table 8.2: Descriptive statistics for discount rates used by ftSe 100, DaX 30, all other german listed companies, CaC 40, and all other french listed companies in 2008
Country Index Year end Mean Median Standard deviation
UK FTSE 100 31/12/2008 6.14% 6.20% 0.22%
21/03/2009 to 31/03/2009
6.61% 6.70% 0.30%
Germany DAX 30 31/12/2008 5.78% 5.80% 0.25%
All other Germany 31/12/2008 5.80% 5.83% 0.48%
France
CAC 40 31/12/2008 5.59% 5.50% 0.50%
All other France 31/12/2008 5.47% 5.50% 0.66%
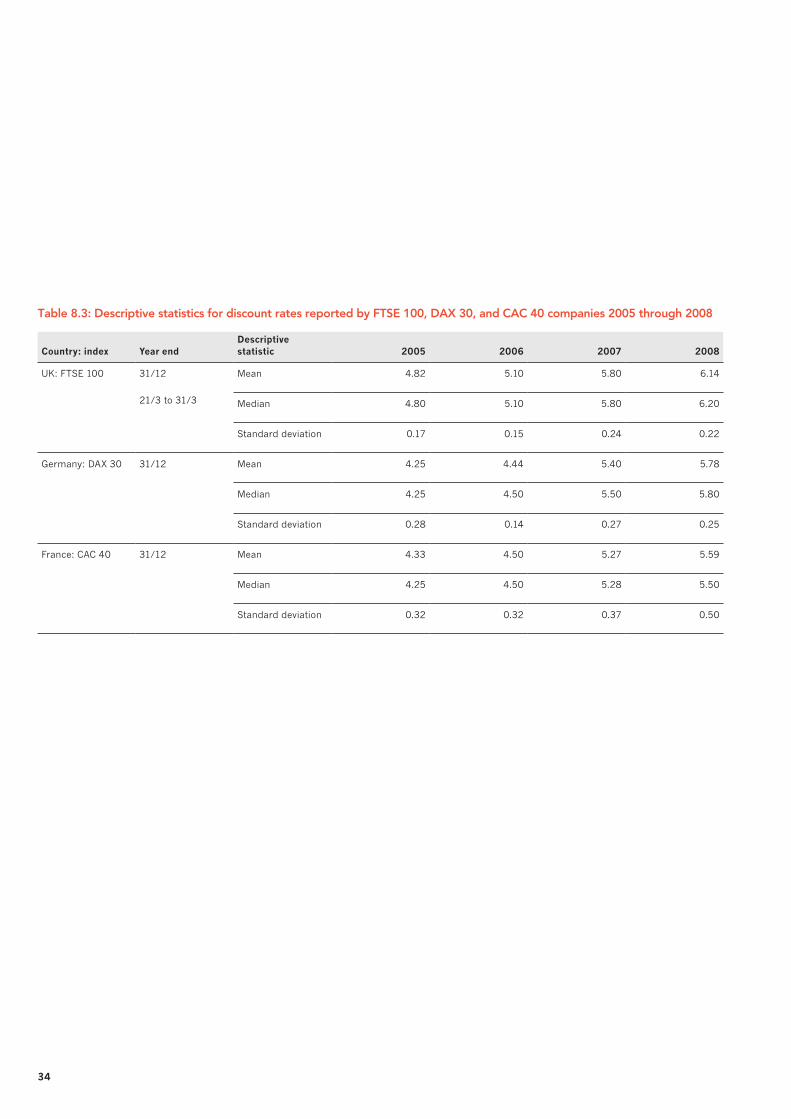
34
table 8.3: Descriptive statistics for discount rates reported by ftSe 100, DaX 30, and CaC 40 companies 2005 through 2008
Country: index Year endDescriptive statistic 2005 2006 2007 2008
UK: FTSE 100 31/12
21/3 to 31/3
Mean 4.82 5.10 5.80 6.14
Median 4.80 5.10 5.80 6.20
Standard deviation 0.17 0.15 0.24 0.22
Germany: DAX 30 31/12 Mean 4.25 4.44 5.40 5.78
Median 4.25 4.50 5.50 5.80
Standard deviation 0.28 0.14 0.27 0.25
France: CAC 40 31/12 Mean 4.33 4.50 5.27 5.59
Median 4.25 4.50 5.28 5.50
Standard deviation 0.32 0.32 0.37 0.50

METHODS FOR RECOGNITION OF ACTUARIAL GAINS AND LOSSES UNDER IAS 19 35

36


POL-TP-MRAGL
ACCA 29 Lincoln's Inn Fields London WC2A 3EE United Kingdom / +44 (0)20 7059 5000 / www.accaglobal.com