Methods for Measuring Shrinkage - DSPACE · Page 1 Introduction Shrinkage is widely viewed as a...
22
Paper Title: Methods for Measuring Shrinkage Publication details: Security Journal V19 N4 pp 228-240 Authors: Paul Chapman 1 Senior Research Fellow Cranfield School of Management, Cranfield University. Bedfordshire. MK43 0AL United Kingdom. Telephone +44 1234 751122 Fax +44 1234 751712 Email: [email protected] Simon Templar Teaching Fellow Cranfield School of Management, Cranfield University. Abstract This paper presents findings from research amongst European grocery retailers into their methods for measuring shrinkage. The findings indicate that: there is no dominant method for valuing or stating shrinkage; shrinkage in the supply chain is frequently overlooked; data is essential in pinpointing where and when loss occurs and that many retailers collect data at the stock keeping unit, SKU, level and do so every six months. These findings reveal that it is difficult to benchmark between retailers due to inconsistencies between measurement methods and that there are opportunities for many of the retailers surveyed to improve their shrinkage measurement by adopting known good practice. 1 Corresponding author
Transcript of Methods for Measuring Shrinkage - DSPACE · Page 1 Introduction Shrinkage is widely viewed as a...

Paper Title: Methods for Measuring Shrinkage Publication details: Security Journal V19 N4 pp 228-240 Authors: Paul Chapman1 Senior Research Fellow
Cranfield School of Management, Cranfield University. Bedfordshire. MK43 0AL United Kingdom. Telephone +44 1234 751122 Fax +44 1234 751712 Email: [email protected] Simon Templar Teaching Fellow Cranfield School of Management, Cranfield University.
Abstract This paper presents findings from research amongst European grocery retailers into their methods for measuring shrinkage. The findings indicate that: there is no dominant method for valuing or stating shrinkage; shrinkage in the supply chain is frequently overlooked; data is essential in pinpointing where and when loss occurs and that many retailers collect data at the stock keeping unit, SKU, level and do so every six months. These findings reveal that it is difficult to benchmark between retailers due to inconsistencies between measurement methods and that there are opportunities for many of the retailers surveyed to improve their shrinkage measurement by adopting known good practice.
1 Corresponding author

Page 1
Introduction Shrinkage is widely viewed as a significant problem in retail management. It is also
viewed as an area of opportunity to deliver bottom line profit (Berlin, 1982). However,
there are several aspects to shrinkage that lack common agreement, not least there are
competing views on how to measure shrinkage; the amount of shrinkage in particular
sectors; its causes; and what actions are effective in its reduction. In order to make
progress with these various issues a necessary first step is to clarify the nature of the
shrinkage problem by establishing an appropriate means of measurement, which is the
focus of this paper. In particular, this work examines the methods for measuring shrinkage
in Europe’s Fast Moving Consumer Goods sector (FMCG), a study supported by ECR
Europe, a de-facto trade association for grocery retailers and FMCG manufacturers
operating in Europe2.
Europe’s grocery retailing sector had a turnover in 2003 that exceeded €1,000 billion
(Beck, 2004). This business sector can be characterised as complex (Pal and Byran, 2003)
and with a diverse population of organisations. Across this varied business landscape cuts
the common issue of shrinkage. There are a range of different views on this issue with the
management attitude in some organisations treating it as a regrettable but inherent part of
doing business (Kennish, 1985) while to others it is a key opportunity to improve returns
(Berlin, 1982). Recent research into this topic has shown shrinkage to be an important
issue for the grocery sector to consider, not least because shrinkage cost Europe’s FMCG
grocery industry €24 billion in 2003 (Beck, 2004).
Shrinkage has been found to be unevenly distributed and concentrates on certain products
and certain locations (Beck, Chapman and Peacock, 2003) with these phenomena termed
Hot Products (Clark, 1999) and Hot Stores (Beck and Chapman, 2003) respectively. Hot
products are those specific items that incur losses considerably higher than even
apparently similar lines, for example a particular product in a particular size of packaging
that is affected more than other lines in the same category. Hot stores are particular stores
within the same retail chain that have losses more than double the average for that chain.
The ability to identify and track these phenomena relies upon the effective measurement
of shrinkage by stock keeping unit (SKU) and by location, and to be able to do this over
time.

Page 2
In order to manage shrinkage it is clear that the right metrics must be in place. The
objective of this paper is therefore to present a view on the methods for measuring
shrinkage and specifically to:
• Review the methods for measuring shrinkage in order to list and describe
alternative approaches and methods.
• Establish the extent to which these methods are employed in practice in the
European FMCG sector.
• Identify the implications this study’s findings may have on methods of shrinkage
measurement in the future.
By achieving these aims, this work contributes to the retail industry by drawing together
understanding on shrinkage measurement, reporting on common practice and providing a
guide to shrinkage measurement.
Methods for Measuring Shrinkage In order to examine how shrinkage can be measured, a literature review was conducted
that deconstructed this topic into (1) the components of shrinkage and (2) methods for
valuing shrinkage. These two sub-topics are introduced and discussed below. Shrinkage
can result from several causes (Levine and Jackson, 2002). These causes tend to be
summarised into either (i) a set of categories or (ii) known and unknown shrinkage. These
two approaches are described below.
Categories of Shrinkage
Typically the categorisation of shrinkage tends to comprise four categories. Beck (2003)
defines the four categories he uses as follows:
Process Failures
Losses due to operating procedures within the organisation including products which have
become out of date, or have been reduced in price; incorrect pricing; product
identification errors; incorrect stock counting; products which have been damaged;
scanning errors; and errors in deliveries to the stores (e.g. short deliveries due to errors in
picking and dispatch from distribution centres).
Internal Theft
2 Information on ECR Europe is available on their website, www.ecrnet.org

Page 3
The unauthorised taking of goods or cash from a store at any time of the day or night by
staff employed by the company (including contract staff, for instance third party security
staff or maintenance workers). This includes staff theft, collusion between customers and
staff, employees eating stock, till shortages and the deliberate manipulation of prices.
External Theft
The unauthorised taking of goods or cash from a store at any time of the day or night by
customers or other non-company employees. This includes incidents of shoplifting,
fraudulent return of goods, till snatches and burglary (breaking and entering a store whilst
it is closed).
Inter-company Fraud
Losses due to suppliers or their agents deliberately delivering less goods than retailers are
eventually charged for by them, or retailers deliberately returning fewer goods to
manufacturers/suppliers than agreed/specified. This includes vendor and contractor fraud.
For retailers this refers to losses due to discrepancies in the goods supplied by third parties
and not from their own distribution centres.
Although the nomenclature varies, these four categories are similar to those used by other
authors, as shown by the examples contained in Table I.
TAKE IN TABLE I
The differences in nomenclature appear relatively minor and there appears to be a level of
consistency between the four sets of categories. However caution still needs to be applied
when considering the results of measurement that use these different classification
systems as the definitions of what lies within, or is excluded from, is not consistent across
them.
Known and Unknown Shrinkage
It is also appears common for shrinkage to be categorised as being ‘known’ or ‘unknown’
(Beck et al, 2003) or ‘retail crime losses’ and ‘unexplained stock losses’ (Grasso, 2003).
Known shrinkage is the loss that has been identified, recorded and processed. Examples
of known shrinkage include:
• Known theft processed.
• Known errors processed, such as out-of-date or damages.
• Cost of sales adjustments, such as tasting, mark downs or out-of-date.

Page 4
• Other, such as donations.
Unknown/unexplained shrinkage is the inventory shortage identified following a physical
stock-take. The findings from a physical audit take precedent over the book stock record
(Knapp and Knapp, 2000), with the difference between the two numbers being the amount
of the inventory shortage.
The nature and causes of unknown shrinkage are not identifiable, hence its name.
However attempts are regularly made to apportion unknown shrinkage in to the same
categories used to measure known shrinkage (see for example Bamfield, 2004; Beck,
2004; Grasso, 2003; Hollinger and Langton, 2004). These efforts tend to survey the
practitioner community and ask respondents to estimate how much of their unknown loss
can be attributed to each category. Needless to say, numerous authors express their
concerns about this method (for example Beck, Chapman and Peacock, 2003; Bernstein,
1963; Oliphant and Oliphant, 2001) and indicate that the findings from such research are
unreliable.
Methods for Valuing Shrinkage Retail stock can be classified in to a number of different types of stock, including:
• Goods or other assets purchased for resale.
• Consumable stores, e.g. carrier bags.
• Raw materials and components, e.g. a joint of ham to be carved in the delicatessen.
• Work in progress, e.g. partly baked bread.
• Finished goods.
The valuation calculation of each classification will be different, therefore stock can be
valued in a different way depending on where it is and how it has been processed. This
calculation needs to be consistent with the regulatory instruments, such as the Statement
of Standard Accounting Practice and International Accounting Standards. Examples of
stock valuation are shown in Table II.
TAKE IN TABLE II
Accounting practices point towards using different methods of valuation of goods
depending on their status. The merits of this for financial reporting are undisputable

Page 5
however it appears that in practice few retailers are able to do this when measuring
shrinkage. This would require constantly updated information on each batch of goods
concerning their purchase price; their status in the supply chain, i.e. to determine what
costs had been incurred during work in progress and whether they had become finished
goods; and a view on the saleability of the goods to determine their net realisable value.
Instead retailers appear to opt for a more simple method of valuation, such as:
• Sales value.
• Purchase price.
• Transfer cost.
Each of these methods of valuation possesses strengths and weaknesses, which are
summarised in Table III.
TAKE IN TABLE III
Each of the valuation methods has its merits and retailers should consider the possibility
of using more than one method of valuation. However this raises the concern that data
based on different valuations could mix and create more problems than the benefit
accrued. This problem would be overcome if the cost components associated with goods
were available. Valuation and also conversion between different methods of valuation
could then be achieved by including or excluding particular cost components.
In order to gauge current practice, the methods of stock valuation reported in the accounts
of selected retailers that support ECR Europe were examined. The findings from these
reports are summarised in Table IV.
TAKE IN TABLE IV
Table IV shows the various companies inventory valuation policy categorised against the
menu of methods listed in the column headings. Definitions for the inventory valuation
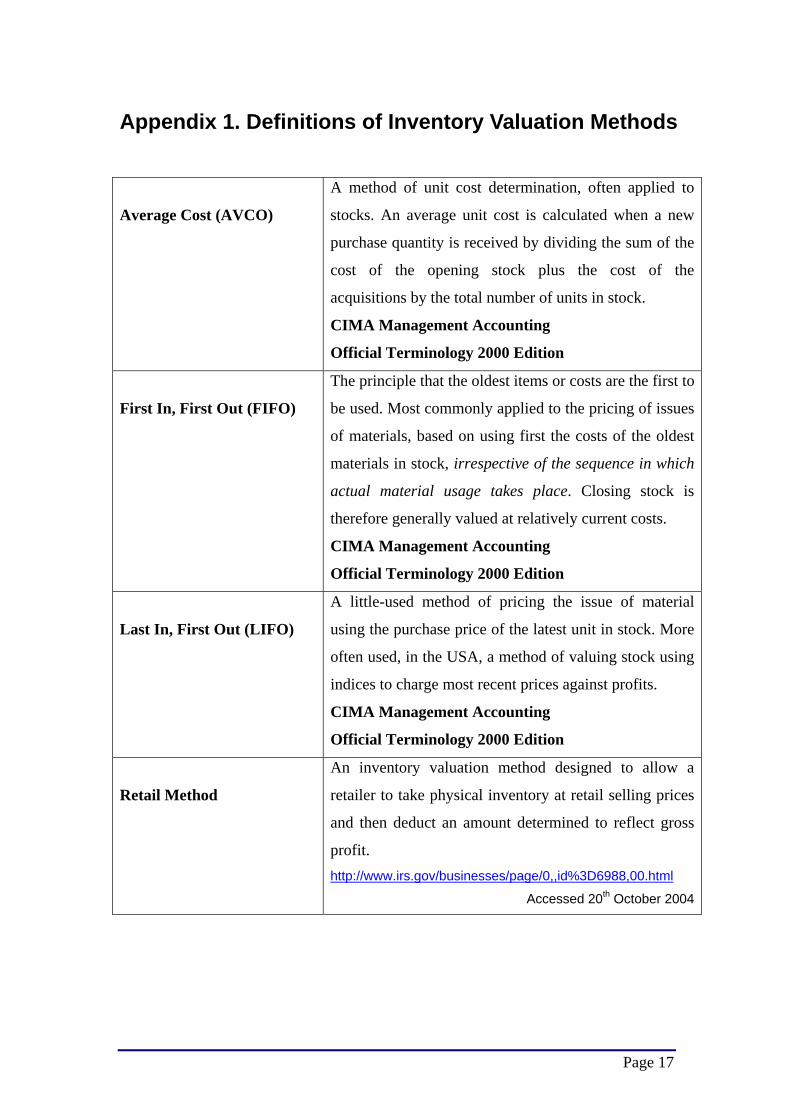
methods used in Table IV are provided in Appendix 1.
The main finding from this investigation in to inventory valuation policy is that there is no
dominant method for valuing stock and there are examples where companies employ
more than one method of inventory valuation e.g. Wal*Mart.

Page 6
Survey of Methods for Measuring Shrinkage The literature review identified a range of alternative approaches and methods to
measuring shrinkage. In order to establish a view of the current practices employed by
European retailers a survey was undertaken.
The survey examined a range of issues relating to shrinkage in the FMCG sector, where
one of these issues was the methods used to measure shrinkage. Other issues included the
levels of shrinkage and the organisational functions involved in addressing shrinkage the
findings of which are to be reported separately, elsewhere. This meant that the survey was
fairly long and required an extensive amount of effort to complete. One of the affects of
this was to reduce the response level, a point discussed below.
The survey was carried out in 2004 across 25 European countries. Carrying out research
that attempts to collect comparable data from different countries is notoriously difficult –
besides the obvious problems of language, difficulties can emerge with meaning and
terminology. The survey instrument for FMCG retailers was translated into 7 languages
(Czech, French, German, Italian, Polish, Portuguese and Spanish) and was distributed to
senior members of security departments, audit departments, or senior members of staff
with responsibility for loss prevention in major retail companies. Overall, 239
questionnaires were sent out to companies in 25 countries. The sample was selected based
upon targeting companies that they were primarily grocery related businesses and had the
largest share of the market within their own country (using data sourced from Planet
Retail, a company that markets such data). The aim of this approach was to maximise
representation within the survey of each national market across Europe. The focus on
grocery businesses, as opposed to other types of retailer, reflects the area of interest of the
research team and gives continuity to the data returned by these organisations, with each
facing similar issues. The implications for generalisability and representativeness are
discussed later in this paper.
On average, for those countries selected to be included in the analysis, the market share of
the respondents varied between 10 and 40 per cent. In total, the study received 31
responses from retailers, a 13% response rate. These businesses had a total turnover of

Page 7
€137.2 billion or 13.7% of the total European market share. This response rate is
relatively low and therefore restricts the ability to generalise the findings from this work.
However the research team viewed 31 responses as providing sufficient information to
enable meaningful analysis to take place around a limited set of topics. The analysis
method was not unduly affected by the limitations of the sample size as only basic
quantitative techniques were employed. This primarily involved entering the data from the
returned questionnaires into a MS Excel spreadsheet. This allowed basic counts of the
data to be made, for example to determine the frequency (stated as a percentage) that a
particular criterion was met. More advanced statistical tests on the data were not
necessary as they generally fell beyond the aims of this research.
Results
The results of the survey are presented here under following five headings:
• Finding 1. The extent to which known loss and unknown loss are included in the
calculation of shrinkage.
• Finding 2. The supply chain issues included in the measure of shrinkage.
• Finding 3. The extent to which different costing methods are used to value shrinkage.
• Finding 4. The resolution to which shrinkage data is captured.
• Finding 5. The frequency with which shrinkage data is gathered.
Finding 1. The extent to which known loss and unknown loss are included in the
calculation of shrinkage
All companies that responded to the survey included unknown loss in their calculation of
shrinkage. Ninety percent of respondents also included known loss in their calculation of
shrinkage. These findings indicate that most companies consider shrinkage to consist of
both known and unknown losses. However not all companies include known loss in their
calculation. Those companies that do not include known loss in their calculation of
shrinkage appear to define shrinkage as being those losses that can not be attributed to a
known cause.
Page 8
Store Related Issues Included in the Measure of Shrinkage
Known loss can be categorised under a number of headings. Examples of the more
common causes of known loss recorded at stores include:
• Out of date, where the shelf life of a good has been reached and it cannot be sold.
• Damage, where a good has been damaged and cannot be sold.
• Price marked downs, where the price of a good has been reduced, e.g. because the
good is nearing the end of its sales life or has been damaged.
• Donations, where a good has been donated freely and not sold.
The survey sought to establish which of these categories were normally included by the
retailer when calculating their rate of stock loss. The findings from the survey are
presented in Table V.
TAKE IN TABLE V
The findings from the survey show that most retailers include out of date, damage and
price mark downs in their calculation of shrinkage. A small number of companies include
donations. It may be that not all companies have a policy that allows goods to be donated.
Equally it may be the case that those companies that do allow donations do not view them
as a form of shrinkage. Several companies indicated that they employ ‘other’ categories
under which they classify their loss although this was marked without listing what these
categories were.
Finding 2. The Supply Chain Issues Included in the Measure of Shrinkage
Shrinkage can occur in a retailer’s supply chain as well as in stores. In order to understand
whether this was measured, retailers were asked whether they recorded shrinkage in their
supply chain. The findings from the survey are shown above in Table VI.
TAKE IN TABLE VI
These results show that more than a half of retailers include losses in their regional
distribution centres in their calculation of shrinkage. Slightly more than a third includes
losses in transport, i.e. between distribution centres or between a distribution centre and

Page 9
the stores. Fewer still included losses by third party logistics service providers in their
calculation of shrinkage.
Not all retailers in the survey operate a distribution network, using instead direct
distribution to store by suppliers. However these companies are the exception and do not
make a notable impact to the results shown above. Instead, the results point to retailers
failing to measure the losses that undoubtedly occur in their supply chain.
Finding 3. The Extent to Which Different Costing Methods are used to Value
Shrinkage
The discussion presented earlier described the various ways in which shrinkage can be
valued. The survey sought to identify which of these methods are used in practice. The
results of the survey are shown in Table VII.
TAKE IN TABLE VII
The findings from the survey show that whilst the most common method of shrinkage
valuation was the ‘retail sales value’ method (52%), there is not a dominant method of
shrinkage valuation amongst European grocery retailers. Instead there is widespread use
of both retail sales value and cost price as the preferred method of valuation. The one
method that receives little support is the transfer cost method.
Finding 4. The Resolution to Which Shrinkage Data is Captured
The resolution to which shrinkage data is captured was examined by considering the
capture of data for both locations and products. Data on shrinkage can be captured
according to the location where it was discovered. Retailers could therefore record
location shrinkage for each of their stores. Alternatively they may capture this data for the
company as a whole.
Data on product loss can be captured at various levels of detail. The highest detail is at the
level of individual stock keeping units, SKU (also known as ‘references’ in many
European countries). Where SKU data is not recorded, losses may be recorded for a
category. Categories typically consist of between two hundred and a thousand related
products. The lowest level of detail is to collate all loss data together into a single,

Page 10
company wide shrinkage figure. The findings from the survey of shrinkage data resolution
are presented in Table VIII.
TAKE IN TABLE VIII
Companies could report multiple levels of data capture, hence the results do not add up to
one hundred percent. With regard to location, companies tended to record their shrinkage
by individual store although not all companies did this. Most companies compiled
shrinkage for the company as a whole although this was less than the number that
reported collating it by store. This shows that not all companies who collect shrinkage
data by store compile this data at the company level.
The resolution of data on shrinkage by product shows that most companies have data by
SKU, although not all. Two companies that did not collect data by SKU collected their
data by category. The remainder collected data at a global level.
Finding 5. The Frequency with Which Shrinkage Data is Gathered
The frequency with which retailers undertake stock audits was the final topic surveyed.
Stock audits are a popular mechanism for collecting data and companies have several
options on how often to undertake them. Stock audits tend to be undertaken to determine
the assets of the company for financial reporting reasons on an annual or bi-annual basis.
The amount of goods found to be held by the company can be compared against the
company’s records, with discrepancies noted. Inventory counting can take place at times
other than the stock audit for financial reporting reasons. These instances tend to occur to
provide information for stock control. Measurement for stock control seems to occur
monthly or less. Given the erratic number of days in months this converts into periods of
four or five weeks. The survey sought to establish the frequency with which shrinkage
data is gathered in terms of these three time periods of annually, bi-annually and less than
five weeks.
A second time related issue explored in the survey was to establish whether retailers audit
shrinkage when a store manager leaves. The rationale being that a manager may influence
the results of a stock audit, leaving behind a shrinkage issue that could not be attributed to
them when it comes to light at a subsequent stock audit. The findings from the survey on
the frequency with which shrinkage data is gathered are presented in Table IX.
Page 11
TAKE IN TABLE IX
The survey found that most organisations collect their shrinkage data bi-annually with
most of the remaining collecting it annually. Less than fourteen percent of respondents
gather data every five weeks or less. No companies reported collecting data when a
manager leaves a store.
Discussion of Results The findings from the survey provide useful insight into the methods for measuring
shrinkage used by European grocery retailers. Caution needs to be applied when
reviewing these results owing to the relatively small number of respondents to the survey
(31 companies), especially when seeking to extend the understanding provided by the
findings. With this proviso in mind it still remains possible to paint an overall picture
from these findings that reveals pockets of good practice in shrinkage measurement
however this appears to be limited to a few companies that possess a system of
measurement capable of effectively informing decision making.
At a more specific level of finding, the numbers of retailers that use retail sales value or
cost price to value shrinkage are roughly comparable. Both approaches have their merits
and issues so the choice of method should depend on company objectives. Caution needs
to apply when comparing between levels of shrinkage that have been valued differently,
therefore it is important to clarify the valuation method used by a particular company
when reviewing its performance.
In light of accounting discrepancies in industry in general, e.g. at Enron, and in grocery
retailing in particular, e.g. at Ahold, stewardship cannot be sidelined, highlighting a role
for valuing shrinkage at cost price. However effective management of shrinkage presents
the opportunity to dramatically improve financial performance and this opportunity needs
to be aggressively pursued, which is where valuing shrinkage at retail value is
advantageous. This points to the need for both methods for valuing shrinkage to be
employed. The challenge for management is to use these methods in harmony,
recognising when they should and should not be used and to maintain consistency that
allows data to be converted between formats without degradation.
Encouragingly, data is generally gathered on both known and unknown shrinkage. This
demonstrates that retailers are aware of both issues when measuring shrinkage in their
Page 12
stores, although some gaps remain in the consistency with which the range of known
losses are reported. Less promising is the low level of data collection in the supply chain.
There is a strong indication that when losses in the supply chain are not identified they
become attributed to stores. Consequentially the poor level of data collection in the supply
chain will over-emphasise the amount of loss in stores and underplay the scale in the
supply chain.
The uneven balance in measurement between stores and the supply chain indicates that
stores are the main focus for shrinkage management, with the critical role of effective
supply chain operations overlooked. This suggests that retailers do not view shrinkage
holistically and continue to treat it in a simplistic, isolated manner. Evidence to support
this supposition is that despite the focus on shrinkage in stores, retailers are generally
limited in their ability to collate detailed data by store and by SKU level or to be able to
aggregate this data up for the company as a whole.
A systemic approach requires the ability to gather data at the lowest level and collate it at
a macro level for analysis. The results from the survey suggest that retailers are strongest
at collecting data at the micro level but the problem is that they are not converting it into
macro level data.
Where micro level data is collated to the macro level, this would allow the investigation
of phenomena such as Hot Stores and Hot Products. The ability to navigate between top
level data and the underlying detail provides the capability to identify where
concentrations of shrinkage lie and then to drill in to those key areas of loss in detail using
data mining techniques. This capability was not found to be widespread amongst the
survey respondents.
A key finding from prior research is the importance of being able to focus attention on
Hot Products and Hot Stores. Without the ability to gather data on shrinkage by SKU and
by store, retailers cannot focus efforts on to their key areas of loss. Equally, detailed data
needs to be accessible so it can be aggregated from SKU and store and analysed at the
company level.
Data should be collected on a regular basis to allow decisions to be made on emerging
trends and to track the effect of shrinkage management efforts. Good practice is to
increase the frequency that data is gathered. The majority of companies reported that they
collect data at six-month intervals. Several companies demonstrate that it is possible to

Page 13
collect data monthly. These frequent updates on performance are likely to reinforce
efforts to drive improvements and to keep abreast of changes in the pattern of shrinkage
such as its scale, location and types of product affected.
Conclusions Shrinkage affects shoppers in a number of ways including reduced on-shelf availability,
reduced assortment, defensive merchandising and higher prices. None of these provide
shopper satisfaction, hence sales are depressed and profits foregone. In addition to lost
sales, shrinkage also affects the profits of retailers through associated additional cost.
The findings from this research respond to this situation by reviewing the measures
needed to inform management decision making and identifying good practice in place in
the sector. In summary, this consists of collecting data:
• By product and location.
• Frequently, robustly and consistently.
• Across the supply chain, in stores (sales floor and back of store), transportation and
distribution centres.
This data will clearly identify where shrinkage is occurring and inform management
decision making on where to direct corrective action to control loss.
The scale of the impact of shrinkage on shopper satisfaction and retailer profitability is
sufficient to warrant senior management attention and investment in gathering the data
necessary to guide management decisions. An effective response requires the
development of a measurement system that consists of two parts:
• A database containing a breakdown of the cost components of each SKU.
• Data on shrinkage by SKU, by location (e.g. store or distribution centre), and by time.
The first part of the measurement system provides reference data on each product, which
would be set up when a product is introduced by the retailer. This provides the cost
breakdown of a single unit. The second part of the measurement system provides a record
on how many items are lost, from where and when. When brought together, these two
data sources provide a valuable input to management that informs them on the overall

Page 14
scale of shrinkage and both cost and lost profit implications. This data will enable them to
determine where and when losses occur, allowing resources to be deployed to diagnose,
address and resolve key issues.
It is acknowledged that data should be reported to different people in different ways. For
example it seems likely that store managers need different information than buyers and
the same will be true for other key stakeholders such as regional security managers, Board
members, the media and shareholders. It is therefore the case that having the capability to
measure shrinkage is only one component of the overall challenge of reducing shrinkage.
There remains the challenge of being able to make good use of these measures through
data analysis (e.g. data mining) and through dissemination of key summaries to the
various stakeholders required to direct and undertake concerted action.

Page 15
References Bamfield, J. (2004) Shrinkage, shoplifting and the cost of retail crime in Europe: a cross-
sectional analysis of major retailers in 16 European countries. International Journal of
Retail & Distribution Management. Vol. 32, No 5, pp. 235–241.
Beck, A. (2004) Shrinkage In Europe 2004: A Survey of Stock Loss in the Fast Moving
Consumer Goods Sector. ECR Europe, Brussels.
Beck, A. and Chapman, P (2003) Hot Spots in the Supply Chain: Developing an
Understanding of What Makes Some Retail Stores Vulnerable to Shrinkage. ECR Europe,
Brussels.
Beck, A., Chapman, P. and Peacock, C. (2003) Shrinkage: A Collaborative Approach to
Reducing Stock Loss in the Supply Chain. ECR Europe, Brussels
Berlin, P. (1982) Why Does Low Shrinkage Seem so Tough to Achieve? Retail Control.
Vol. 50, No. 10, pp. 14–20.
Bernstein, J.E. (1963) Curbing Losses and Errors in Retail Store Operations. New York
Certified Public Accountant. Oct. 1963, pp. 706–714.
Clarke, R. (1999) Hot Products: Understanding, Anticipating and Reducing Demand for
Stolen Goods. Home Office Police Research Series No. 112. London: HMSO.
Grasso, S. (ed.) (2003) 11th Annual Retail Crime Survey 2003. British Retail Consortium,
London.
Guthrie, J.C. (2003) 2003 National Survey of Retail Theft and Security. NZ Centre for
Retail Research and Studies Industry Report 2003.1 ISBN 1-877156-23-X.
Hollinger, R.C. and Langton, L. (2004) 2003 National Retail Security Survey. University
of Florida, Gainesville, FL.

Page 16
Kennish, J.W. (1985) Employee Theft: A Systems Approach. The Internal Auditor. Vol.
42, No. 4, pp. 26–29.
Knapp, M.C. and Knapp, C.A. (2000) Perry Drugs Stores, Inc.: Accounting and Control
Issues for Inventory in a Retail Environment. Issues in Accounting Education. Vol. 15,
No. 2, pp. 237–55.
Leaver, D. (1993) Legal and Social Changes Affecting UK Retailers’ Response to
Consumer Theft. International Journal of Retail & Distribution Management. Vol. 21, No.
8, pp. 29–33.
Levine, S.Z and Jackson, C.J. (2002) Aggregated Personality, Climate and Demographic
Factors as Predictors of Departmental Shrinkage. Journal of Business and Psychology.
Vol. 17, No. 2, pp. 287–297.
Oliphant, B.J. and Oliphant, G.C. (2001) Using a Behavior-Based Method to Identify and
Reduce Employee Theft. International Journal of Retail & Distribution Management.
Vol. 29, No. 10, pp. 442–451.
Pal, J.W. and Byran, J.W. (2003) The Five Ss of Retail Operations: A Model and Tool for
Improvement. International Journal of Retail & Distribution Management. Vol. 31, No.
10, pp. 518–528.
Page 17
Appendix 1. Definitions of Inventory Valuation Methods
Average Cost (AVCO)
A method of unit cost determination, often applied to
stocks. An average unit cost is calculated when a new
purchase quantity is received by dividing the sum of the
cost of the opening stock plus the cost of the
acquisitions by the total number of units in stock.
CIMA Management Accounting
Official Terminology 2000 Edition
First In, First Out (FIFO)
The principle that the oldest items or costs are the first to
be used. Most commonly applied to the pricing of issues
of materials, based on using first the costs of the oldest
materials in stock, irrespective of the sequence in which
actual material usage takes place. Closing stock is
therefore generally valued at relatively current costs.
CIMA Management Accounting
Official Terminology 2000 Edition
Last In, First Out (LIFO)
A little-used method of pricing the issue of material
using the purchase price of the latest unit in stock. More
often used, in the USA, a method of valuing stock using
indices to charge most recent prices against profits.
CIMA Management Accounting
Official Terminology 2000 Edition
Retail Method
An inventory valuation method designed to allow a
retailer to take physical inventory at retail selling prices
and then deduct an amount determined to reflect gross
profit. http://www.irs.gov/businesses/page/0,,id%3D6988,00.html
Accessed 20th October 2004

Page 18
Author Categories of Shrinkage
Beck, Chapman
and Peacock,
2003
Process failures Internal theft External theft Inter-company
fraud
Guthrie, 2003
Administrative
error
Employee theft Customer theft Theft by
supplier
Hollinger and
Langton, 2004
Administrative
/ paper error
Employee theft Shoplifting Vendor fraud
Leaver, 1993 Poor
administration
Employee theft Consumer theft Supplier theft
Oliphant and
Oliphant, 2001
Administrative
error
Employee theft Shoplifting Vendor fraud
Table I. Categories of Shrinkage Employed by Various Authors
Stock Type Method of Valuation
Raw Materials Purchase price but are reduced to net replacement
cost if lower.
Work In Progress Valued at the cost of materials plus manufacturing
labour and overheads.
Finished Goods Valued at the lower of purchase price,
manufacturing cost and net realisable value.
Table II. Examples of Stock Valuations. (Source: Chopping and Stephens)
Method of
Valuation &
Definition
Strengths Weaknesses

Page 19
Sales value.
The sales price of
the good
• Presents a big number that
grabs attention.
• Factors in the margin.
• Easiest valuation to find.
• Margin is not always fully
understood (e.g. purchasing
margin versus sales margin).
Purchase price
The price that the
good was
purchased for
• Most compatible measure
with balance sheet & tax
dept. calculations.
• Prudent (accounting)
approach.
• Fails to accommodate
overhead apportioning.
• Need to know the margin if
working back from sales
price.
Transfer cost
Purchase price
plus apportioned
costs
• The valuation of all costs
incurred.
• Useful when dealing with
retail brands.
• Most difficult to calculate.
Table III. Strengths and Weaknesses of Alternative Methods of Shrinkage Valuation

Page 20
Inventory Valuation Method
Company Retail
Method
Retail
Price
Purchase
Price FIFO AVCO
AVCO
/ FIFO
AVCO
/ LIFO
Ahold
(2003) Auchan
(2003) Carrefour
(2004) Focus
Wickes
(2002)
Marks &
Spencer
(2004)
Metro
(2003) Sainsbury
(2004) Sonae
(2003) Tesco
(2004) Wal*Mart
(2004)
Domestic
(LIFO)
Wal*Mart
Foreign
Operations
(FIFO)
Sam’s
Club
Table IV. Inventory Valuation Policy. (Source: Company’s Report and Accounts (year in
brackets))

Page 21
Out of Date Damage Price Mark
Down
Donations Other
Process
Survey Results 77% 77% 61% 23% 16%
Table V. Store Related Issues Included in the Measure of Shrinkage
Losses at
RDCs
Losses in
Transport
Losses by
3PLs
Other
Survey Results 58% 35% 19% 0%
Table VI. Supply Chain Issues Included in the Measure of Shrinkage
Retail Sales
Value
Cost Price Transfer
Cost
Other
Survey Results 52% 39% 3% 6%
Table VII. The Extent to Which Retail Sales Value, Cost Price or Transfer Cost are Used
to Value Shrinkage
Company Store Category SKU
Survey Results 61% 84% 55% 71%
Table VIII. The Resolution to Which Shrinkage Data is Captured
Annually Every 6
months
Every 5
weeks or
less
When
Manager
Leaves
Survey Results 21% 66% 14% 0%
Table IX. Frequency of Stock Audits.