METHODOLOGY - Shodhgangashodhganga.inflibnet.ac.in/bitstream/10603/640/11/11_chapter3.pdf ·...
33
- CHAPTER 3 METHODOLOGY > Sample 9 Tools and variables 9 Procedure adopted 9 Consolidation of data 9 Statistical techniques used for analysis > Method of analysis
Transcript of METHODOLOGY - Shodhgangashodhganga.inflibnet.ac.in/bitstream/10603/640/11/11_chapter3.pdf ·...

- CHAPTER 3
METHODOLOGY
> Sample 9 Tools and variables 9 Procedure adopted
9 Consolidation of data 9 Statistical techniques used for analysis
> Method of analysis

Numerous psychological correlates have been hypothesised to play a role in cardiovascular
diseases. A methodology has to be used to identify these factors to collect data on each
factor and decide the hierarchy of importance. Methodology in general refers to the
techniques of securing knowledge regarding the universe. Methodology is a universally
significant step in any research because the fruitfulness and validity of the information that is
secured in the study depends largely upon the authenticity and perfection of itsmethodology.
This chapter gives details regarding the sample selected for the study and the tools used.
Details of administration of the test materials and the procedure followed are separately
presented.
3.1 SAMPLE
Selection of the sample is a crucial step in any research study. In order for the results to
provide valid conclusions the sample should be adequate and representative. The adequacy
of the sample is determined by the size, and the representativeness is determined by its
similarity to the population of the study.
Three groups of respondents were selected for the present study. The first group includes
cardiovascular patients. Cardiovascular disease is a broad area and it is not possible to
examine it as a single unit. Hence, eight cardiac disease types have been included in this
category, viz.; Myocardial Infarction (MI), Angina (AN), Cardiac Surgery (CS), Essential
Hypertension (EH), Arrhythmia (ARR), Atherosclerosis (ATH), Endocarditis (EN) and
Pericarditis (PE). Fifty patients each from these cardiac disease types were selected on the
basis of the diagnosis of expert cardiologists, to constitute the cardiac disease group.
The second group of the study sample is a non-cardiac patient group. Fifty patients with
diseases other than cardiovascular diseases were randomly selected to be included in this
group. Care has been given to exclude patients with or having the history of cardiovascular
disease from this group. The third group of the sample comprised a control group of fifty
normal individuals. Care has been given to exclude individuals with a history of any major
illness.

-40- There are several methods available for selecting a sample size. The population for the
present study is very large and considering the time and cost involved, it was decided to fix
the sample size as 50 in each of the groups. Care has been taken to see that the selected
individuals form a representative sample of the total population.
The cardiac and non-cardiac patients were selected from different hospitals in the state of
Kerala. Purposive sampling technique was used for this purpose. A purposive sample isone,
which is arbitrarily selected for the reason that there is ample evidence of its representative
nature.
3.1.1 Age
Age has a major role in moulding the individuality of any individual. Generally, people have
specific behaviour patterns at different age levels. To a great extent, the behaviour of an
individual is influenced by his age. The details regarding the age of the selected subjects in
each of the disease category are presented in table 3.1.
Table 3.1 Distribution of the sample with regard to age
1 - 3 0 Groups / 30-39 I 40-49 1 50-59 1 60-69 70 +
Nwmal
Non-cardiac Patient
Myocardial Infarction
Angina
Cardiac Surgery -~ ~~~ - .~~~
Essential Hypertension ~ . . ~ . ~ ~ ~ ~ ~ ~ ~ ~ ~ ~ ~ ~
Arkyhmia -
Alhefeselwesis
Endocarditis
Pericardilis
Column total 78 92 120 I10 82 18

-41- Sample distribubon with respect to age in different groups show that the majority of the
Myocardial Infarctlon patlents fall under the age group 50-59 and 60-69 and the Angina and
Endocarditis patients in the range 50-59. Most of the cardiac surgery, essential hypertension,
and pericarditis patients were in 40-49 age range. Similarly the arrhythmia patiintscome in
30-39 group and Atherosclerosis patients in 30-49 age group.
3.1.2 Sex, religion and place of residence wise classification of the subjects
An important aspect considered while selecting the sample was the influence of sex. There
can be differences among males and females with respect to the occurrence of
cardiovascular diseases. Hence the subjects were taken from both sexes. Similarly, to a
great extent the individual's behaviour is influenced by the religion and it may alsoaffecttheir
life style as they're by the occurrence of cardiovascular diseases. Hence the subjects are
taken considering their religion also. Considering the importance of the locale of the
residence of patients, the subjects are taken from rural as well as urban areas. Details of the
-, sex, religion and place of residence -wise classification are given in table 3.2.
Table 3.2 Distribution of the sample with regard to sex, religion and place of residence
Noncardiac patient
Total 263 237 221 228 51 292 208

42 Sample distr~butlon with respect to male and female representation in different groups
indicates that there IS a h~gher male representation in the MI, EH and PE groups. In all
the other groups the male-female representatlon 1s more or less same. Break up of the
sample with regard to place of residence show that the cardiac patient groups belong
mere to rural area Patlents from the three major religions, viz., Hindu, Christian and
Muslim have been ~ncluded in th~s study
3.1.3 Socio-economic status (SES) wise classification o f the subjects
Education, occupation and income have been found to be potential factors influencing
the adjustment and personality characteristics of an individual. Taking this aspect into
consideration, a SES-wise classification also was made. The personal data schedule
given to the subject is given in appendix 1.
Measurement of Socio-Economic Status
Many Socio-economic status scales are available for measuring the socio-economic
-, status of the subjects Soclo-economic status was computed on the basis of the needed
data for the present study with reference to the scales developed by Kuppuswamy
(1962). Pillal (1973). Nair (1976). and lyer (1977). For the present purpose, the socio-
economic status of the subjects is measured in terms of three variables viz. education,
occupation and income. The computation used by the researcher is an adapted version,
modified according to the income level of respondents at the time of administration.
Education: Classification and Weightago
On the basis of education, subjects were classified into seven categories. For subjects
C with professional or gostgracluate degrees, a score of ten is given. In the case of
subjects with Bachelor's degree like BA I BSc, a score of eight; for subjects with
education up to hlgher secondary or pre-degree, a ssore of five; for subjects who have
studied up to S.S.L.C, a score of four; subjects W ~ Q have studied up te middle school
(Standard VII), a score of two; subjects who have completed lower primary, a score of
one; and who are illiterate is given zero score,

42a Occupation: Classification and Weightage
Subjects were class~fied into six categories on occupational basis as high professional,
semi professional, skilled, semi skilled, unskilled and unemployed,
High Professiona!~
This group consists of individuals who have very high education and are engaged in
decision making process, laying down policies and executing them like doctors,
engineers, lawyers, principals of colleges, readers, professors, bank managers,
buisiness executives, university officials, heads of research organisations, heads of
departments of government, big land holders, secretaries and assistant secretaries to
government, state or district level officers, chief executive of quasi -governmental body,
etc. For this category a weightage of 10 score is given.
Semi professionals
This group consists of occupations which require college education. Here job is of
routine nature This group includes lecturers, chemists, teachers, officers at sub district
level, public health workers, superintendent of any government office, contractors, sub
inspector of police, excise inspector, sub registrars. For this category a weightage of 8 is
given.
Skilled workers
This group consists of workers who have a long period of training in semplisated tasks.
Mechanics, fitters, electricians, drivers, painters, photographers, masons, carlagnkrs,
document writers, vakil-clerks, head constables of police and village officers can be
inGluded in this category. A weightage of 7 is given for this category,
Semi skilled workers
This group includes occupations which require some training on the part of the persons-
shop keepers, attendsrs, farmers, small s6ale meghants, and pglice 68nsfablsS 68me
under this category. The weightage given to this category is 4.
42b Un skilled workers
All persons who are doing work which involves neither education nor training belong to
the unskilled group The watchman, labourers, peon and coolie belong to this category.
A score of 2 is given for this category
Unemployed
The unemployed includes persons who are unemployed irrespective of their education or
training. Zero weightage is given to this category.
Income: Classification and weightage
On the basis of monthly income also, subjects were classified into six categories. Forthe
group having monthly income of Rs 80001- and above, a score of 10 is given. For the
group having monthly income in the range of Rs 43511- to Rs 80001- ; a score of 8; for
the group having monthly income in the range of Rs 34511- to Rs 43501-, a scoreof 6; for
a group having monthly income in the range of Rs 26011- to 34501-, a score of 4; for the
group having monthly income in the range of 17511- to Rs 26001-, a score 2 is given. For
the group having monthly income of Rs 17501- and below, a score of 1 is given.
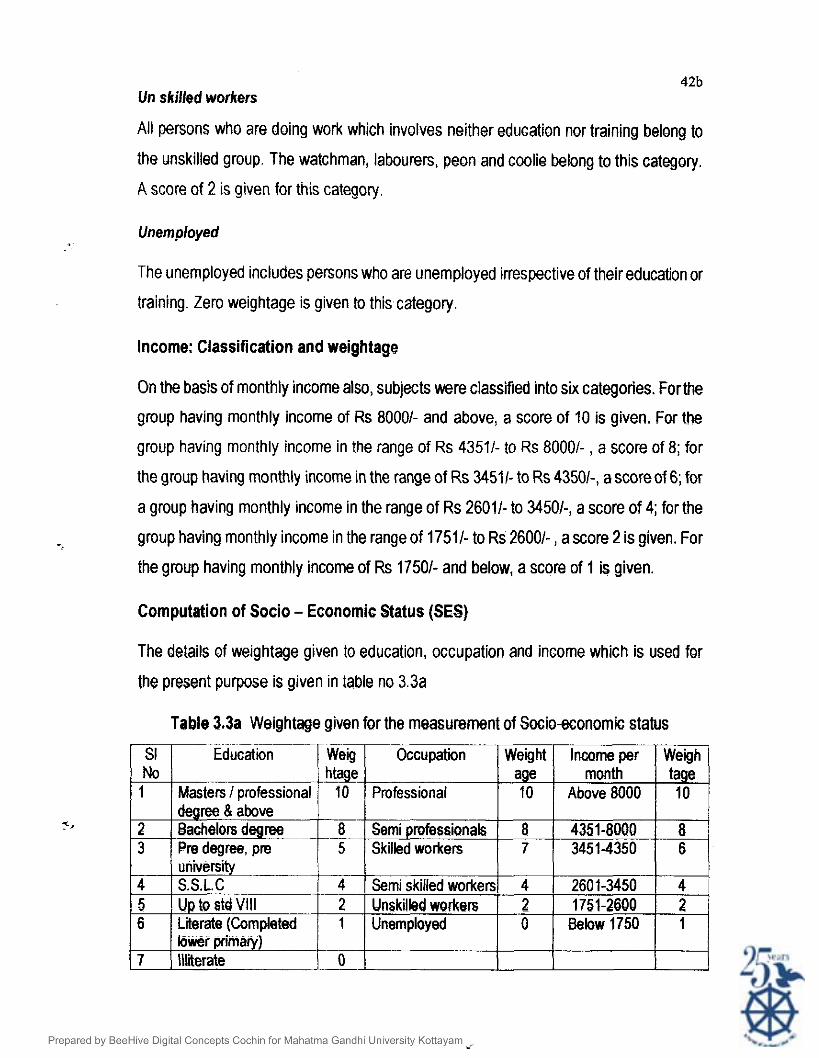
Computation of Socio - Economic Status (SES)
The details of weightage given to education, occupation and in~ome which is used for
the present purpose is given in table no 3.3a
Table 3.3a Weightage given for the measurement of Socio-economic status --
Occupation
d ree & above -.-- 8
Bre degree, pre 5
Weight age 10
2
Semi professionals Skilled workers
Income per month
Above 8000
Sem~ skilled workers blnskilled werkers Unemployed
Weigh tage 10
8 7
4 2 0
4351-8000 3451-4350
8 6
260 1-3450 1751-2688
Below 1750
4 1 2 1

42c The total of the scores obtained for the three dimensions of SES designated above
yielded a composite score for each subject. The mean value of the composite score was
found to be 16.68 and Standad Deviation (SD) value as 4.05. Using normal probability
distribution, the subjects were divided into three groups. The mean value plus one SD
was found to be 20,73, and those who scored above this was taken as high SES group.
The mean value minus one SD was found to be 12.63, and those who scored less than
the value was taken as low SES group. The subjects who scored between 12.63 and
20.73 were taken as middle SES gmu?
The table 3.3b shows the sample distribution with respect to SES. Sample distribution
with respect to SES in all the eight cardiac groups, shows that a considerably good
number of patients belong to middle socio economic group.
Table 3.3 Distribution of the sample with regard to socio-economic status
Arrhythmia ! . -~ ~- ~ -~ - -~~
I I i
I 1 22 1 1 7 i Atheroscleros~s
~~~ ~ ~-
10 1 25 1 15 - 21 I I
Endocarditis I 12 --
~
i I . ~ i lo i
Pencarditis - 1 i 7 20 f :: 15 1
1 . ~ - ~~~ ~
1 Total 125 239 136
~-~ ~- ~ ~- r-- +~. Socio Economic Status
3.2 TOOLS AND VARIABLES
I ~ ~
Low
Although cardiovascular recovery may be important to long-term cardiovascular health,
its biopsychosocial correlates have received much less attention than the correlates of
Middle High b . I I I Normal ! 7 27 i 6 I
~. --. I I / on-cardiac parlent I io 1 23 I
10
12
~ ~~ ----- I iviyoc~lrdial Infarction 1 20 -_ - . 1- Angina I I 17
~ ~ i
20
21
! Cardiac Surgery I - - - - .
12
Essential Hyuertension ! 8
26
28
12
14

43- cardiovascuiar reactivity. Hence the present study is an attempt to explore the psychological
correlates of cardiovascular disorders. Numerous psychological factors have been
hypothesised to play a role in cardiovascular diseases. To find these psychological factors,
sets of inventories were used, including a personal data schedule. The tools are
1. Personal Data Schedule
2. Stress lnventory
3. Type A Behaviour lnventory
4. Depression lnventory
5. StateTrait Personality lnventory
6. Personality lnventory
7. Generalised T Scale
8. Self-Esteem lnventory
Among the said tools, three were developed for the present purpose, they being stress -, inventory, type A behaviour inventory and depression inventory. Apart from this,
Spielberger's StateTrait personality inventory has been translated into Malayalam and
standardised for the present purpose.
3.2.1 PERSONAL DATA SCHEDULE
The information regarding the subject's personal aspects are collected using the personal
data schedule (PDS). PDS consists of a set of unstructured questions for eliciting information
like age, sex, locale, educational qualifications, occupation, nature of family, food habits,
family atmosphere, prior history of illness, hereditary factors and habits. This is expected to
give a clear understanding about the patient's personal background, which is an important
component in the present study.
3.2.2 STRESS INVENTORY - TOOL DEVELOPMENT
Defining Stress
The term 'stress' has been defined, generally in three ways (Coyne & Holroyd, 1982). First,
stress is commonly defined in terms of particular events in the environment. According to the
-44- stimulus views of stress certain events are particularly likely to produce feelings of tension or
upset the person experiencing the stimuli. Thus stress is seen as being a characteristic of
environmental stimuli. Researchers using this definition of stress have focussed their
attention on how people respond to different events believed to be stressful. This view
assumes that different people respond similarly to given events and thusthe amountofstress
that people are experiencing can be determined by assessing the events that have occurred
in their lives (Holmes & Rahe, 1967).
Stress has also been defined in terms of the reactions that people have in stressful situations.
This response definition of stress focuses on the physiological and psychological effects of
particular events. Hans Selye (1976, 1982) has argued that any time an organism is
challenged, it will exhibit a particular pattern of physiological responses, including the release
of various hormones and changes in heart rate, blood pressure, respiration and
gastrointestinal activity. These responses are essentially the same regadlessof thestimulus
., that evoked them. Hence the important features of stress are to be found in how the person
reacts, as opposed to the events to which the person has been exposed.
A third approach to stress argues that stress is best understood as a process that
incorporates both the events experienced and psychological and physiological responses to
those events (Coyne & Holroyd, 1982, Lazurus & Folkman, 1984). In this view the critical
determinant of stress is how the person perceives and responds to different events. What is
important is not the event itself, but how it is interpreted by the person. This approach to
stress introduces a psychological dimension that is missing in the other definitions. In
particular, stress is understood as a transaction between the person and the environment, in
which the person approaches the situation along with available resources for coping with
those situations.
For the present purpose, the following definition is used. "Stress is a transition between the
person and the environment that includes the person's appraisal of the challenges posed by
the situation as well as resources available for coping up with the challenges along with the
psychological and physiological responses to those perceived challengesn.
45-
The Measurement of Stress
In general stress is measured in four different but complementary ways (Baum et al, 1982).
Researchers using a stimulus definition of stress have tended to emphasise self-reports,
whereas researchers defining stress in terms of performance use psycho-physiological
andlor biochemical measures. From a process point of view none of these measures is
sufficient in itself. Rather each is useful for examining a particular apect of stress and a
complete analysis requires a combination of measures. The ultimate test of a measure is the
extent to which it is reliable and useful in predicting a given outcome.
Among measures of stress, self-report measures are by far the most commonly used. Self-
report measures are attractive to investigators because they are often straightforward in
format and easy to administer and score. For the present study it has been decided to
prepare an inventory in order to measure the level of stress in individual.
Description of Ule Stress Inventory ->
The present inventory is prepared and standardised in order to measure the level of stress in
individual, as there is no inventory available for this purpose, especially in Malayalarn. The
inventory developed has been named as Stress Inventory.
The variables selected for the stress inventory are
1. Family stress
2. Social stress
3. Personal stress and
4. Occupational stress
The review of related literature shows that the above mentioned variables have a remarkaMe
influence on patients and the present inventory is developed with a view to measure these
variables.
The stress inventory contains four subscales with 18 items each, with a total of 72 items
capable of eliciting different components of stress. The descriptions are given below.

-46-
I . Family Stress
The behaviour, needs and personality of each member of afamily, and the interaction with
other members of the family system, may produce stress. As an important variable, family
stress measures various aspects related to family life such as a lack of satisfaction with the
home atmosphere, unreasonable demands, conflict among family members, ill health of the
family members, lack of freedom and independence, uncomfortable physical facilities, etc.
2. Social Stress
Social stress can be defined as an unfavourable perception of the social event and its
dynamics. Any variable that indicates how much social upheaval a society is experiencing
can potentially be used as a measure of the stress of that society's population. In this
variable, 'social stress' measures factors related to social relationship, unemployment,
violence, noise, crowding, pollution, cramped living conditions, loneliness and isolation etc.
3. Personal Stress
Emotion tends to accompany stress, and people often use their emotional status to evaluate
their stress. Most of the time, the sources of stress arewithin the person. People are likely to
find conflict stressful when the choices involve many features, when opposing motivational
forces have fairly equal strength and when the 'ivory' choices can lead to very negative
consequences. In this variable, personal stress measures factors related to worries, anxiety,
fears, anger, sensitiveness, depression, conflicts etc,
4. Occupational Stress
Almost all people at sometime in their life experience stress that relates to their occupation.
m e n these stressful situations are minor and brief, and have little impact on the person. But
for many people, the stress is intense and continuous for long periodsof time. In any form of
paid employment there are a large number of potential sources of stress: the charateriskof
job itself, the role of the person in the organisation, interpersonal relationship atwork, career
development pressures, the climate and structure of the organisation and the problems
associated with the organisation and outside world etc. are some of the factors.
Draft Scale
The drafl scale consisted of 18 Items under each of the four subscales along with
instructions for responding. The following are the instructions given to the subject.
In our day-to-day life, we have to face different circumstances at different spheres of lie.
When we face these situations, we experience stress and tension. But the degree of stress
may vary from person to person. Some statements (events) have been given to find out the
degree of stress experienced, when you are in such a situation. Carefully read thestatements
and indicate the intensity of stress you might have experienced during the situations
described in each statement. In the response column adjacent to the statements, four
choices, viz., very high, huh, somewhat and not at all are given. Indicate yourresponse in the
response column with a ' J' mark.
Scoring
Scoring was done by using the separate keys for each variable. Four-point scale has been
used to measure the intensity of stress. There are positive and negative items in the four
subscales and score of 4,3,2 or 1 is given for a positive item and a score of 1,2,3 or 4 is given
for a negative item. The score ranges from a minimum of 18 and a maximum of 72. The draft
scale has been printed along with the instructions. The scale was named as Stress Inventory.
A copy of the draft scale is given in appendix 2.
Administration of the Draft Scale and Item Analysis
The draft scale was administered to a sample of 200 cardiac patients admitted in various
hospitals in the state of Kerala. The response column has been scored using the scoring key.
The item analysis of the stress inventory was done using the Mathew Item Analysis Table
(Mathew, 1982). This table gives item criterion correlation (Phicoefficient) arid percentageof
subjects making the keyed answer (P value), from P values at the tails of the distribution
according to the criterion.
48-
The response sheets were arranged in the order of the criterion score, which is usually the
total score of the trial form of the test itself. The response sheets were arranged in an order
and fifty response sheets each from the top and bottom were designated as 'upper tail' and
'lower tail' (the 25% of the subjects with the highest total score - upper tail, and the 25%of the
subjects with the lowest total score - lower tail). For each item, count the number of testees
giving the keyed answer (when there are four response categories, t h e m responses getting
the larger weights in scoring can be considered as Ule keyed answer) in each of the tails.
Calculated the percentages of individuals giving the keyed answer in each of the tails.
The final percentage needed for reading the item indices from the table are
(a) PI - Percentage of individuals in the lower tail marking the keyed answer, and
(b) Pu - Percentage of individuals in the upper tail marking the keyed answer.
In the table, first locate the 'PI' value of the item given as heading. Then locate the 'Pu' value
of the item along the left margin and read the corresponding 'Phi' and 'P' vdues. The required
number of items was selected from among items having the highestcorrelation value (Phi).
The details regarding the PI, Pu, Phi and P valuesoffamily stress inventory are presented as
appendix 3.
Final Scale
Out of the 72 items in the draft scale of the stress inventory, 60 items were selected for the
final scale, in which 15 items each were selected from among the four subscales. The
instructions and scoring procedures for the final scale were exactly the same as that of the
draft scale. Copy of the final scale is given in appendix 4.
Reliability
There are different methods for estimating the reliability of a test For the present test, the
test-retest method was used to find out the reliability. Test-retest method involves repetition
of a test on the same gmup immediately or after the lapse of some days, and computation of

correlations between the first and second set of scores. The correlation coefficient thus
obtained indicates the extent or magnitude of the agreement between the two sets of scores
and is often called the coefficient ot stability.
Here the reliability was established separately for the four subscales. The final tool, aflerthe
item analysis, has been administered to the subjects for collecting the data. From this, 70
subjects have been selected at random for calculating the test-retest reliability. Then, after a
week the test was again administered to the identified 70 subjects and a second score was
obtained. The correlation between these two sets of scores was calculated using Pearson
Product Moment Correlations. The reliability value coefficients of the foursubscales are 0.95
(family stress), 0.86 (social stress), 0.95 (personal stress) and 0.94 (occupational stress)
respectively. The high correlation value shows the higher rate of reliability ofstress inventory.
Validity
Validity of a test or evaluation device can be defined as the degree to which the test
measures arid what it intends to measure. There are different types of validity meant for
different purposes. For the stress inventory, it could be claimed that the scale has face
validity, as the items are prepared on the basis of the various components of stress and also
because the final scale has been prepared after item analysis.
Apart from this concurrent validity was also calculated. Concurrent validity calculated by
showing how well the test scores obtained in the newly developed inventory correspond to
already accepted questionnaireslinventory performance made at the same time. In this a
correlation coefficient between the two sets of measures was calculated as an index of
validity. For this, scores of stress inventory were validated against the concerned medical
practitioner's ratings of the patients on this aspect, using a five point rating scale. The values
of the four subscales are as follows, family stress: 0.82, social stress: 0.72, personal stress:
0.80 and occupational stress: 0.94. Hence it could be claimed that the test has high validity.

3.2.3 TYPE A BEHAVIOUR INVENTORY - TOOL DEVELOPMENT
Type A Behaviouc Concepts and Definiiions
Speculation concerning the role of behavioural and environmental factors associated with the
pathogenesis of CHD has been noted in the writings of such medical luminaries as Harvey,
1628, and Osler, 1892 (cf. Weiss et al1984) who believed that CHD was more closely related
to emotion and overwork than to other predisposing factors. It has only been within the past
25 years, hawever, that the term 'coronary prone behaviour' has come into use, refening to a
broad somewhat diffuse body of literature, which includes research on stress, significant life
events, social support networks etc. The most systematic body of evidence linking behaviour
and coronary heart disease can be attributed to the seminal work of two cardiologists,
Friedman and Rosenman (1974) who in the course of their clinical practice identified a
constellation of behaviour (Type A) consistently noted in the majority of their patients.
Friedman and Rosenman (1974) describe type A behaviour pattem as "a particular complex
of traits including excessive competitive drives, aggressiveness, impatience and hurried
sense of time urgency. Individuals displaying this pattern seem to be engaged in chronic
ceaseless and often fruitless struggle within themselves, with others, with circumstances,
with time and sometimes with life itself.
The type A behaviour pattern includes ambitiousness, aggressiveness, c o m p e t i t i ~ and
impatience and specific behaviours such as alertness, muscle tenseness, rapid and emphatic
speech, emotional reactions such as enhanced irritation, signs of anger. Type A person
differs from others with classic anxiety states, who on finding overwhelming challenges
experiences anxiety and often withdraw or seek support or counsel from others. Type A
confidently grapples with challenges while anxiety subjects' retreat from similar situations.
Persons identied as Type B is characterised by the relative absence of these behaviours
(Rosenman & Chesney, 1982). Type A behaviour is distinguishable from of stress, in that
this pattern is not a distressed response but a style of overt behaviour used to confront life
situations. Type A behaviour pattem may be elicited from pleasant or troubling situations
especially situations that are perceived as challenges (Rosenman & Chesney, 1982).

-5r- Type A behaviour pattern might be partially emerging out of certain personal or behavioural
predisposition. But it is largely elicitable on environmental challenges. That is, if the
challenges are severe enough, any person might exhibit a type A behaviour pattem. Thus it
will be seen that 'Type A behaviour is not a personality type but asetof typical behavioural
responses including both an environmental and an intrinsic component.
DeveIopment of the Type A Behaviour Scale
The scale was prepared and standardised in-order to measure the type A behaviour pattem
of the cardiac patients, as there is no scale available in Malayalam language for the purpose.
The scale measures only one variable, and it is named as Type A Behaviour. The scale
contains 18 items. Items in this scale measures the behaviour pattem of cardiac patients,
which includes ambitiousness, aggressiveness, competitiveness and impatience, emotional
reactions, hostility combined with time urgency and excessive involvement with their work.
Draft Scale
The draft scale consisted of 18 items along with instructions and response column also
provided against each statement. The following were the instmtions given to the subjects:
Some statements related to your behaviour and experiences aregiven below. Please indicate
whether it is right or wrong, for the statement, concerned. In the response column, against
each skment, two choices, 'right and 'wrong' are given. Read each statement carefully and
indicate your response with a 'J ' mark.
Administration and ltem Analysis of the D M Scale
The drafI scale was administered to a sample of 200 cardiac patients admitted in various
hospitals. Giving a score of 'one' for right and 'zero' for wrong has scored the responses.
The item analysis of type A behaviour inventory was done using the Mathew ltem Analysis
Table (Mathew, 1982). The details pertaining to the item analysis procedure is given in the
previous section of this chapter (Administration and item analysis of the stress inventory,
page 47-48). The drafI tool is presented as appendix 5 and the details of the PI, Pu, Phi and P
values of type A inventory are presented as appendix 6.
-52- Final Scale
Out of the 18 items in the draft scale, 15 were selected and included in the final scale. The
instructions and scoring procedure for the final scale were exactly the same as that of the
draft scale. Copy of the final scale presented as appendix 7.
For the present purpose, test-retest method was used to flnd out the reliability of the test The
procedure in detail was presented in the 'reliability' section of stress inventory (page 48-49).
The correlation thus obtained for the type A behaviour inventory was 0.61.
Validity
For the type A behaviour inventoly, it could be claimed that the scale has face validity,
because the items are prepared on the various components of type A behaviour pattern and
also the final scale has been prepared after item analysis. Apart from this, concurrent validity
is also calculated. For this, scores of type behaviour was validated against the ratings (five
point scale) made by the concerned medical practitioners. The correlation value thus
obtained was 0.86. Hence it could be claimed that the test has high validity.
3.2.4 DEPRESSION INVENTORY - TOOL DEVELOPMENT
Depression -Concepts
Depression is known as theS'cornrnon cold* of psychological disorders (Seligman 1973). The
word 'depressed' is widely used in our everyday vocabulary. People say they are depressed
when they are sad or upset or in a bad mood. However, a depression serious enough to be
considered a'severe mental disorder' consists of an overwhelming sadness thatimmobilises
and arrests the entire course of a person's l ie (Omstein, 1985).
Depressive disorders incotprate a spectrum of psychological dysfunction, which vary
considerably in severity, frequency and duration. At one end of the spectrum is the
experience of normal depression, a transient period of sadness and fatigue, generally

-53-
responding to clearly identifiable stressors. The moods associated with normal depression
vary in length, but usually continue no longer than two weeks. If the depressed mood
continues for a longer period of time, and growing thoughts of despair and hopelessness
develop, the problem approaches clinical depressive disorder.
Depressive disorders generally involve an unpredictable pattern of symptoms. This includes
loss of interest and pleasure, loss of appetite, decrease in energy level, sense of
worthlessness, difficulty in concentrating and thoughts about death. Other featuresthat might
be experienced by the depressed person are anxiety, phobias, over-concem about health,
fearfulness and irritability.
Description of the Depression Inventory
The present inventory was developed on the basis of the Beck's Depression Inventory and
his cognitive theory of depression. The cognitive theory proposed by Aaron Beck is based on
the relationship between thought and affect in human beings. Beck and co-workers
suggested that errors in thinking cause depression. He noted that depressed people seem to
hold a negative triad of beliefs that include
1. a view of self as unworthy and deficient
2. a view of the world as cruel and aversive, and
3. a hopeless view of the future.
The negative triads of beliefs lead to cognitive distortions in the depressed patients including
problems such as
/
1. Arbitrary influence, a conclusion drawn in absence of suflicient information
2. Selective abstraction, a conclusion on the basis of, but are of many elements
3. Overgeneralization, an overall sweeping conclusion drawn on the basis of single,
perhaps trivial events, and
4. Magnification and minimisation, or gross errors in evaluating performance.

-54- Thus depressed people tend to think in distorted ways. These distortions precipitate new
problems and exacerbate old ones, leading to a vicious circle in which depression is
continually increased.
The present inventory was designed to measure the depth of depression. Its items were
based on observations of attitudes and symptoms characteristic of depressed patients. Most
of the symptoms and attitudes associated with depression were accounted for, since the
numbers of reported symptoms were found to be associated with the depth of depression.
Some of those symptoms and attitudes are sadness, sense of failure, dissatisfaction, self-
dislike, work inhibition, sleep disturbance, loss of appetite and loss of libido.
Draft Scale
The inventory consisted of 18 items designed to measure the depth of depression.
Statements were printed in a single page along with the instructions and the response
column. The inventory measures only one variable, i.e., depression. The following
instructions were given.
"A number of statements that people use to describe themselves are given below Read each
statement and put a 'J ' mark in the appropriate space provided in the response column to
indicate how you feel. There are no right or wrong answers. Do not spend too much time on
any statement. In the response column against each statement four choices A, B, C or D-
denoting almost never, sometimes, often and almst always, respectively are given.
The scoring is done as follows. A score of 4,3,2 or 1 is given to the category A, B, C or D fora
positive statement and a score of 1,2,3 or 4 is given to the category A, B, C or D for a
negabie item respecbvely. The scores are then summed up to obtain the depression score of
an individual. The maximum score will be 72 and the minimum, 18. The draft tool is
presented as appendix 8
Administration and Item Analysis
The draft scale was administered to a sample of 200 cardiovascular patients admitted in
various hospitals in the state of Kerala. The item analysis of the depression inventory was
-55-
done by using the Mathew Item Analysis Table (Mathew, 1982). The details regarding the
procedure were given in the previous section (47-48). The PI, Pu, Phi and P values of items
in the depression inventory are presented as appendix 9.
Final Scale
Of the 18 items in the draft scale, 15 items were selected for the final tool. The instructions
and the scoring procedures for the final scale was exactly the same as that of the draft scale.
Copy of the final scale is presented as appendix 10.
Reliability
The test-retest method was used to find out the reliability of the depression inventory. The
final tool, after the item analysis has been administered to the subjectsfor collecting thedata.
From this, 70 subjects have been selected at random for calculating the test-retest reliability.
After a week, the test was again administered to the identified 70 subjects and a second set
of scores was obtained. (Procedure in detail is presented in pages 48-49). The correlation
coefficient thus obtained for the depression inventory was 0.91. The high correlation value
shows the higher rate of reliability of the depression inventory.
Validity
To find out the validity of the depression inventory concurrent validity method is used. Forthis
the scores of depression inventory were validated against the concerned medical
practitioner's ratings of the patients on depression, using a five point rating scde. (Detzik are
presented in page 49). The correlation value thus obtained is 0.73.
3.2.5 STATE TRAIT PERSONALITY INVENTORY - MALAYALAM ADAPTATION
The State Trait Personality lnventory was developed by Spielberger et al(1979). For the
present study a Malayalam language adaptation of the State Trait Personality Inventory
(STPI) was done and used for data collection. As a first step it has been translated into
Malayalam without making any change in the structure or patkm of the original version. The
item analysis has been done and the reliability and validity coefficients w r e also found out

-56-
State and Trait Dimensions of Personality- Concepts
Freud's danger signal theory and Cattel and Scheier's concept of state and trait anxiety as
refined and elaborated by Spielberger provided the conceptual framework of the State Trait
Anxiety Inventory (STAI). Spielberger, Gorsuch and Lushene (1970) developed the STAI for
assessing state anxiety and trait anxiety in research and clinical practice, The thearetical
importance and heuristic value of this distinction have been increasingly recognised in
anxiety research. This distiwtion provided the COtIceptUal framework for the construction of
psychometric inventories to assess anger and curiosity as emotional states and personality
traits (Spielberger 1979,1980; Spielberger et al 1979,1985). In the light of these evidence
Spielberger et al (1979) developed the STPl to provide reliable, relatively brief, self-report
scales for assessing the personality traits. Although originally developed as a research
instrument for investigating the phenomena in normal adults, the STPl hasalso been found to
be useful medical and surgical patients.
Description of the StateTrait Personality Inventory
The STPl consisted of six subscale; state and trait anxiety, state and trait curiosity and state
and trait anger. The three STPl state subscales are referred to as state anxiety, state
curiosity and state anger; each subscale consisted of 10 items. Similarly 3 STPl trait
subscales referred to as trait anxiety, trait curiosity and trait anger contains 10 items each.
Subjects respond to the STPl state items in terms of how they feel at a particular moment by
rating on a four-point scale, i.e; (a) Not at all, (b) Somewhat, (c) Moderately so and (d) Very
much so. In responding to STPl trait items, subjects indicate how they generdlyfeel by rating
on a four-point scale: 1. Almost never 2. Sometimes 3. Often, and 4. Almost always.
The scoring was done as follows: A score of 1,2,3 or 4 is given to the category a, b, cord for
a positive statement and a score of 4,3,2 or 1 is given to the category 1,2,3 or 4 for anegative
statement. To obtain the score for state and trait anxiety, state and trait curiosity and state
and trait aqer subscales, simply sum the weighted scores for the 10 items that comprise
each subscale. The possibie scores for each subscale can vary from 10 to 40.

-57-
Subscales
STPl was developed to assess the state and trait dimensions of anxiety, curiosity and anger.
Anxiety, curiosity and anger that are being experienced at the present time were labelled as
state dimension and the degree of anxiety, curiosity and anger that a person habitually
experience was known as trait dimension.
1. State and Trait Anxiety
State anxiety was defined as a transitory emotional reaction that consists of feelings of
tension, apprehension, nervousness and worry and activation of the autonomic nervous
system. Trait anxiety refers to relatively stable individual differences in anxiety proneness,
i.e., the differences between people in the tendency to perceive stressful situations as
dangerous of threatening and to respond to such situations with elevations in the intensity.
2. State and Trait Curiosity
It measures both the trait (a person's general tendency) and the state (the intensity of feelings
at a particular moment) dimensions of curiosity. Curiosity means the desire or inclination to
know or learn about anything, ranging from what is novel or strange to a desire of knowing
what one has no right to know. Some of the factors for assessing curiosity are
inquisitiveness, studiousness, concemedness, solicitousm, mental activity etc.
3. State and Trait Anger
State anger was defined as an emotional state or condition that consists of subp3vefeelings
of irritation, annoyance, fury and rage with concomitant activation or arousal of the autonomic
nervous system. It will vary in intensity and fluctuate over time as a function of affronting
injustice or frustration resulti ng from the blocking of goal directed behaviour. The trait anger
was defined in terms of individual differences in the frequency that state anger was
experienced over time.
Draft Scale
The draft scale of the Malayalarn version of the STPl consisted of 60 items, 10 items in each
variable. It consists of 6 subscales: state and trait anxiety, state and trait curiosity and state

-58-
and trait anger. For the present purpose, the original version of the STPl has been translated
into Malayalam without making any change. Instructions, administrations and scoring are
exactly same as of the original version, which was presented in details in the above section
(description of the STPI).
The instructions for the state scale were as follows. "A number of statements people use to
describe themselves are given below. Read each statement and then put a 'J' mark in the
appropriate space on the answer column to indicate how you feel right now. There are no
right or wrong answers. Do not spend too much time on any statement but give the answer,
which seems to describe your present feelings best".
The instructions for the trait scale are as follows: "A number of statements that people have
used todescribe themselves are given below. Read each statement and then put a'/' mark
in the appropriate space on the answer column to indicate how you generally feel. There are
no right or wrong answers. Do not spend too much time on any one statement but give the &
answer which seems to describe how you generally feel."
The draft scale was printed along with the space for responses. A copy of the draft scale is
given in appendix 1 1.
Administration and ltem Analysis
The draft scale was administered to a sample of 200 cardiac patients. The item analysis of
the STPl was done using the Mathew ltem Analysis Table (Mathew 1982). The details
pertaining to the procedure was exactly the same as that which was used in the development
of stress inventory ( page riu 47-48). PI, Pu, Phi and P values are presented as appendix 12.
Final Scale
From among the 60 items in the draft scale Malayalam adaptation of the STPI, 48 itemswere
selected for the final scale, 8 items each in the six subscales. The instruction and scoring
procedures for the final scale was exactly the same as that of the draft scale. A copy of the
final scale is given in appendix 13.

59-
Reliability
Spielberget's StateTrait Personality lnventory (STPI) has got higher reliability on all the six
variables. Apart from this, the test-retest method was used to find out the reliability of the
Malayalam adaptation of STPI. Procedure in details presented in the reliability section of
stress inventory (page 4849). The correlation values of STPl are presented in table 3.12.
Table 3.4 The correlation values of the original and adapted version of the STPl
. Validity
Validity was established for the original version of STPI with the parent scales, namely State
Trait Anxiety Inventory (STAI), StateTrait Curiosity lnventory (STCI) and StateTrait Anger
lnventory (STAgI). Apart from this, the Malayalam adaptation of STPl has also to find out the
concurrent validity for all the six variables. The scores of six variables were validated qainst
the ratings (five point scale) and presented in table 3.13.
Table 3.5 The correlation values of the original and adapted version of the STPI

-60-
3.2.5 PERSONALITY INVENTORY
Eysenck Personality Inventory (EPI) developed by Eysenck was used to measure the
personality dimensions of Extroversion (E) I Introversion (I) and Neuroticism (N). A
Malayalam adaptation of the EPI constructed by Ammal(1977) was used for the present
study. The inventory has two forms (Form A and Form B) with 56 items each; 24 each in
lntroversion I Extroversion and Neuroticism scale and 8 items in the lle scale. Forthe p m t
study Form B has been used and is attached as appendix 14. The variables studied were
introversion I extroversion and neumticism.
1. Introversion / Extroversion
According to Eysenck, "The typical extrovert is sociable, likes parties, has many friends, need
to have people to talk to, and does not like reading or studying himself. Hecravesexcitement,
takes chances, often sticks his neck out, acts on the spur of the moment and is generally an
. impulsive individual, He is fond of practical jokes, always has a ready answer, and get-erally
likes change. He is carefree easygoing, optimistic and likes to laugh and be meny. He prefers
to keep moving and doing things, tends to be aggressive and loses his temper quickly. His
feelings are not kept under tight control and he is not always a reliable person.
The typical introvert is quiet, retiring sort of person, introspective, fond of books rather than
people, he is reserved and distant except to intimate friends. He tends to plan ahead, 'looks
before he leaps' and disrupts the impulse of the moment. He does not llke excitement; take
matters of evelyday life with proper seriousness and llkes a well-ordered mode of life. He
keeps his feelings under close control, seldom behaves in an aggressive manner and does
not lose his temper easily. He is reliable, somewhat pessimistic and places great value on
ethical standards.
High neumticism scores are indicative of emotional liability and over-activity. High scoring
individuals tend to be emotionally over responsive and have difficulties in returning lo normal

-61-
state after emotional experiences. The neuroticism is widely used to refer to a personality
type which is predisposed to develop neurotic symptoms under even relatively mild stress.
Some of the traits, which correlate and make up the concept are anxiety, moodiness,
unhappiness, proneness to worry, in addition psychosomatic symptoms are frequently
reported by high neuroticism subjects.
Administration and Scoring
Each of the traits, extroversion and neuroticism are measured by 24 items and the subject
has to choose from the alternatives 'Yes' or 'No' as the response for an item. The instructions
are printed in the test booklet.
Separate stencils for scoring purposes are provided with the inventory. Scoring is done by
aligning the appropriate sconng key over the completed answer sheet, and counting one pint
for each 'I' mark appearing through the holes in the stencil. A lie scale is also included to
detect attempt to falsify responses. 'There are 8 lie items. If the lie score obtained by a subject
is five or more, the datacollected is considered invalid and hence not included for the study.
Reliability and Validity
Parallel form reliability is obtained by administering the inventory form A and form B.
Reliability is calculated separately for males and females for the two scales. Reliability
coefficients of neuroticism scale are 0.72 for males and 0.75 for females and extroversion
scale are 0.62 for males and 0.61 for females.
Validity coefficients of the inventory are obtained separately for extroversion neuroticism
against certain subscales of Mathew Temperament Scale. The values are 0.30 (E) and 0.68
(N) for males and 0.76 (E) and 0.67 (N) for females.
3.2.6 GENERALISED T SCALE
Generalised T Scale is a temperament scale, developed by Sananda Raj (1993). It consists
of stability, sociability and objectivity as variables of the scale. The salient features, which
make up a rational personality, are stability, sociability and objectivity. These three traits of
-62-
personality are indispensablefora human being to lead a life that is efficacious, fulfilling and
hassle free in his particular social context. Stability, sociability and objectivity together
determine the degree of rationality a person exhibits in his behaviour.
Variables
1.Stability
Stability means how far a person remains relatively unchanged in his attitude, perceptions,
opinions and in all his behaviour. The different aspects measured by the subscale, 'stability'
may be summarised as emotional maturity, evenness of mood, stability in decisions, lackof
fatigue, optimism, alertness, firmness, endurance, not having the feeling of wony,
depression, guilt and anxiety, non fanaticise and un-suspiciousness.
2. Sociability
Sociability is an ability of an individual to adapt his behaviour to the changing social
environment and its demands, so that he exhibits extroverted or gregarious types of
behaviour. Various characteristics measured by the subscale 'sociability' may be
summarised as; socially active, having many friends, enthusiastic, lively, pleasant, happy-ge
lucky, positive response to criticisms, helpful and energetic.
3. Objectivity
Rational behaviour entails an objective interpretation of the realities around us, without giving
way to subjectivity. Objectivity is the scientic temperament in observing and interpreting the
world of events, realistically and reasonably. The variable 'objectivity' as used in the present
scale covers the following characteristic of temperament: realistic, punctual, systematic,
persistent, self-confident, self-controlled, analysing oneself, lack of impulsiveness,
attentiveness and concerned about morality and ethics.
Thus, the scale mainly covers information about the abovementioned three variables, viz.,
stability, sociability and objectivity. The test consists of 36 items, 12 items in each variable.
.There are positive as well as negative items in each variable. Copy of the inventory is
attached as appendix 15.

63- Administration and Scoring
The subject is instructed to select any one of the five responses viz., A, 8, C, D and E given
against each item, representing: strongly agree, agree, undecided, disagree, strongly
disagree respectively. Scoring is done as follows. A score 5,4,3,2 or 1 is given for the
responses A, 8, C, D or E for a positive item. The scoring is reversed for a negative item.
Reliability
The retest reliability of the scale was obtained on 200 subjects (100 males and 100 females)
selected randomly, repeating the test after one month of the first administation. The reliability
coefficients of the subscales were stability 0.89, sociability 0.82 and objectivity 0.91.
Validity
A temperament survey, developed by Mathew, which yields ten aspectsof temperament, was
used as a criterion scale to estimate the validity of the Generalised T Scale. The validity
coefficients for stability: 0.81, sociability: 0.74 and objectivity: 0.75.
3.2.7 SELF ESTEEM INVENTORY
Self-esteem is measured using a standardised test developed by Thomas (1984), which is
known as the self-esteem inventory. The inventory is constructed making use of the self-
reported method. All the items are in the form of self-evaluative andlor descriptive
statements. The items are expected to tap self-evaluation of the subject from awidevariety of
behavioural domains including academic, social, physical and emotional aspects. The
inventory measures only one variable, namely self-esteem.
Self-esteem is believed to be the core concept in the dynamics of a healthy personality. In -
fact the humanistic psychologists maintain that the develapmentof normal healthy personality
is geared to the development and maintenance of high level of selfesteem.
In other words self-esteem is the way one feels about oneself, including the degree to which
one possesses self-respect and self-acceptance. Self-esteem is the sense of personal worth
and competence that persons associate with their self-concepts.

64-
Administration and Scoring
The test material of the self-esteem inventory comprises of the instruction for the subject (20
items) and the response columns are provided. The following instructions are meant for the
subject, "Some statements related tocertain problems that we face in our day-to-day life are
given in the scale. Please indicate how far you agree or disagree with each statement. In the
response column against each statement five choices A, 6, C, D and E are given
representing strongly agree, agree, undecided, disagree and strongly disagree respectively.
Copy of the self esteem inventory is attached as appendix 16
The scoring is done as follows. A score of 5,4,3,2 or 1 is given to the category A, B, C, D or E
for a positive statement and a score of 1,2,3,4 or 5 is given to the category A, B, C, D or E for
a negative statement. The scores are then summed up to obtain the self-esteem score of an
individual. The maximum score is 100 and the minimum, 20.
Reliability and Validity
The split half reliability coefficient calculated is 0.95, after correction using the Spearmen
Brown Prophecy formula. The retest reliability obtained is 0.90. The behavioural esteem
scores (Behaviour rating form developed by Coppersmith) obtained here correlated with self-
esteem inventory and found to be 041.
In the present study 7 standardised inventories and one unstructured personal data schedule
have been used. Altogether 18 variables are studied using these inventories. The variables
are (I) family stress (2) social stress (3) personal stress (4) occupational stress (5) Type A
behaviour pattern (6) introversion I extroversion (7) neuroticism (8) stability (9) miability (10)
objectivity (1 1) self esteem (12) state anxiety (13) state curiosity (14) state anger (15) trait
anxiety (16) trait curiosity (17) trait anger and (18) depression.
3.3 PROCEDURE FOR DATA COLLECTION
The data for the present study were collected from patients in different hospitals in the state
of Kerala. Categorisation of the 8 groups of cardiovascular disease patients was made with

65-
the help of the concerned medical practitioners and from the case sheets provided in the
hospitals. The researcher met each patient individually to collect the required information.
Due to the peculiar nature of the illness, personal visits were possible only after aweekfrom
their date of admission in the hospitals. It took about 30 minutes to complete the set of
inventories, but sufficient time was given to the subjects depending upon the health
conditions of the patient. The inventories were read out to those patients who were either
illiterate or were not able to comprehend the items properly to secure correct and appropriate
information.
3.4 CONSOLIDATION OF DATA
The relevant data obtained from the subjects using the personal data schedule and the 7 set
of inventories were consolidated in a coding sheet, in the following way: each subject was
given an identification number and against that number the data relating to personal
information like age, sex, religion etc and the scores obtained for different variables were
entered in a single line. The data thus consolidated are subjected to analysis.
3.5 STATISTICAL TECHNIQUE USED FOR ANALYSIS
Computer facilities were used for analysing the data. The main statistical techniques used for
analysis were: Multivariate Analysis of Variance (MANOVA), Univariate Analysis ofvariance
(ANOVA), Scheffe Procedure, Discriminant Function Analysis and Chi-square . These
techniques are briefly described below.
3.5.1 Multivariate Analysis of Variance (MANOVA)
M m v a provides an opportunity to test the equality of group dispersions, viz., test of H I.
With the help of the results of the test, it would be possible to test the discriminating power of
the variables, test of H 2 (Cooley and lohnes, 1971). It may be noted here that the first test
provides a picture of the general analysis. This can be canied further (test of H 2), only when
there is group dispersion.
-66-
3.5.2 Univariate Analysis of Variance (ANOVA)
Univariate Anova is an effective way to determine whether the means of more than two
samples are too different to attribute the sampling error. In one way analysis of variance, the
relationship between one independent and one dependent variable is examined.
3.5.3 Scheffe Procedure
A significant F does not point out which of the three mean values differ among themselves. In
such cases, the comparison of the differences between means for any two groups is done
using a rigorous method called Scheffe Procedure (Scheffe, 1957). However if the F test
does not refute the null hypothesis, there is no justification for further analysis, as differences
between pairs of means will not differ significantly, unless there are a large numberofgroups
in which case one or two might by chance equal or approach significance.
If the Anova proves the mean difference to be significant, the analysis is proceeded furtherto
find out which of the means differ significantly using the Scheffe Procedure. Scheffe test is
one of the well known multiple group comparison test.
3.5.4 Discriminant Analysis
In many situations a researcher is faced with the necessity to identify the subgroups in a
given sample or to find out the discriminating characteristics among two or more subgroups.
In a multivariate set up, this amounts to differentially weighting the predictor variables and
arriving at a composite index which will help in placing a particular case in a specific
category. Discriminant analysis is often the best-suited technique to achieve this objective.
For the present purpose, discriminant analysis is used to identify those psychological
variables which are most discriminative among the different subgroups, selected for the
study. It is expected that the results will supplement the univariate andysisdoneforthesame
purpose and will bring out a more realistic picture in the multivariate set up.
3.5.5 Chi-square
The chi-square test is an important test amongst the several tests of significance developed
bv statisticians. As a non-~arametric test. it can be used to determine if cateaorical data
-67-
shows dependency or the two classifcations are independent. At the same time, chi-square
test is not a measure of the degree of relationship or the form of relationship between two
attributes, but is simply a technique of judging the significance of such association or
relationship between two attributes.
3.6 METHOD OF ANALYSIS
The present study is aimed to find out the psychological correlates of cardiovascular
diseases. For this, sets of psychological inventories are used, which measures 18
psychdogical variables. To make the study more fruitful and effective two type of group
comparison has been made. As a first criterion, the total sample (500) has been divided in to
three groups (Three group) viz., cardiovascular patient gmup (400), nowcardiac pabent group
(50) and normal group (50). A second criterion (ten group) was used to get a clear picture
about the different cardiovascular diseases, for this the cardiovascular patients were divided
into eight groups (50 each) based on the diagnosis and was compared with the non-cardiac
and normal group.