Methodological Tools for Evaluation of Strategic Target ...
28
European Research Studies Journal Volume XX, Issue 2B, 2017 pp. 439 - 466 Methodological Tools for Evaluation of Strategic Target Structure of Financial Resources in Corporations with Limited Liability Viktoriya Valeryevna Manuylenko 1 , Lubov Anatolevna Kabardokova 1 , Marina Aleksandrovna Loktionova 1 , Natalia Vladimirovna Sobchenko 2 , Tatyana Andreyevna Sadovskaya 3 Abstract: The study substantiates the need to develop a model for determining a strategic targeted structure of financial resources in limited liability companies (LLCs) based on Monte Carlo extrapolation and stochastic modeling methods, applying the author’s software that is used to establishing strategic indicators of absolute value for the company’s own financial resources and a modified ratio financial independence, which is a distinctive feature of the risk-oriented predictions, determination of the optimal interval boundaries in accordance with the phases of the economic cycle. The figure and tables will serve as a basis for development of methodological tools for stress testing of the financial resource base of the LLC via creation of alternative scenarios at various stages of the business cycle, as well as the improvement of forecasting tools, business planning, risk-based regulation of financial resources in the management system, that will provide in perspective sufficient financial stability for LLCs. Validation of the technique was carried out in the frame of financial management system of the companies: "OPT-TORG", LLC; "Russkaya Mobile Machinery Station", LLC; "Poultry Processing Plant", LLC; "Wines of Prikumye, 2000", LLC. Keywords: financial resources, phases of economic cycle, strategic target structure, modified financial independence ratio, evaluation. JEL Classification: O10, D10 1 North Caucasian Federal University, Stavropol, Russia, 355009, Pooshkina str., 1 2 Stavropol State Agrarian University, Stavropol, Russia, 355017, Zooteckhnichesky lane 12 3 Rostov State Technical University, Rostov-on-Don, Russia, 344000, Gagarin Square,1
Transcript of Methodological Tools for Evaluation of Strategic Target ...
European Research Studies Journal
Volume XX, Issue 2B, 2017
pp. 439 - 466
Methodological Tools for Evaluation of Strategic Target
Structure of Financial Resources in Corporations with
Limited Liability
Viktoriya Valeryevna Manuylenko1, Lubov Anatolevna Kabardokova
1,
Marina Aleksandrovna Loktionova1, Natalia Vladimirovna Sobchenko
2,
Tatyana Andreyevna Sadovskaya 3
Abstract:
The study substantiates the need to develop a model for determining a strategic targeted
structure of financial resources in limited liability companies (LLCs) based on Monte Carlo
extrapolation and stochastic modeling methods, applying the author’s software that is used
to establishing strategic indicators of absolute value for the company’s own financial
resources and a modified ratio financial independence, which is a distinctive feature of the
risk-oriented predictions, determination of the optimal interval boundaries in accordance
with the phases of the economic cycle.
The figure and tables will serve as a basis for development of methodological tools for stress
testing of the financial resource base of the LLC via creation of alternative scenarios at
various stages of the business cycle, as well as the improvement of forecasting tools, business
planning, risk-based regulation of financial resources in the management system, that will
provide in perspective sufficient financial stability for LLCs.
Validation of the technique was carried out in the frame of financial management system of
the companies: "OPT-TORG", LLC; "Russkaya Mobile Machinery Station", LLC; "Poultry
Processing Plant", LLC; "Wines of Prikumye, 2000", LLC.
Keywords: financial resources, phases of economic cycle, strategic target structure, modified
financial independence ratio, evaluation.
JEL Classification: O10, D10
1 North Caucasian Federal University, Stavropol, Russia, 355009, Pooshkina str., 1
2 Stavropol State Agrarian University, Stavropol, Russia, 355017, Zooteckhnichesky lane 12
3 Rostov State Technical University, Rostov-on-Don, Russia, 344000, Gagarin Square,1

Methodological Tools for Evaluation of Strategic Target Structure of Financial Resources in
Corporations with Limited Liability
440
1. Introduction
Corporation as a form of business for economic entities is a powerful driving force
that promotes economic growth. One of the most important elements of the national
corporate system is the Limited Liability Companies, which determines development
of commercial corporative organizations both in the institutional aspect and in the
sphere of their financial resources formation.
Unstable economic environment entails a steady share of borrowed funds in
financing of the commercial business; LLCs have to set up target indicators in the
structure of financial resources. Practice shows that the LLCs do not determine the
target values of the indicators that characterize their financial structure; rather the
companies stochastically form their financial resources not bringing them in
accordance with the phases of the business cycle (Tyapkina, Mongush and Akimova
2014; Ivanova, Mackay, Platonova and Elagina 2017; Frank, Mashevskaya, and
Ermolina, 2016).
However, despite the fact that the problems of forming and evaluating the strategic
target structure of financial resources have a long period of development, there is
ambiguous understanding of the notion "target structure of financial resources" in
the financial literature. That makes it difficult to develop a tool for its evaluation and
as a result, negatively influencing the result of the corporation's activities
(Manuylenko and Mishchenko, 2016; Fetai, 2015).
For instance, Kovalev (2015) characterizes the target capital structure by means of
interrelations of the long-term financial resources, wheras Bocharov (2006)
describes it through the ratio between own and borrowed resources indicating its
different purposes.
I. Ansoff notes that it is not possible to create a full picture of the future "external
environment" only "... applying information systems according to the reports
providing extrapolation" and it is advisable to use several complementary
forecasting methods (Ansoff, 2016). International corporations identify the changes
in the target capital structure applying LoTus forecast model, which uses authentic
forecast indicators that are designed based on the information entered into the
database package of the applied program. In the Russian practice of financial
management, unfortunately, such models are not applied. Some aspects of financial
modeling are generally disclosed in the study of Jackson and Staunton, (2006), they
form the methodological aspect of the problem, thus emphasizing the relevance of
this study.
The purpose of this study is to develop a scientifically approved set of tools for
assessing the strategic target structure of financial resources in corporations and
substantiating the areas for its practical implementation. Achievement of the purpose
required fulfillment of the following tasks: justify development of the model for the

V.V. Manuylenko , L.A. Kabardokova, M.A. Loktionova, N.V. Sobchenko
, T.A. Sadovskaya
441
strategic target structure of the financial resources of LLCs based on extrapolation
methods and stochastic modeling, and to test it in the frames of practical corporative
activities. The theoretical and methodological basis of the study is grounded in the
scientific works of foreign and Russian scientists, specialists, legislative and
regulatory documents of the Government of the Russian Federation, of the North
Caucasus Federal District, and of the Stavropol Territory; as well as periodicals, and
the internal regulatory framework of the regional LLCs for evaluation their financial
resources. Methodological basis of the study: logical, system, situational scientific
approaches to the evaluation of financial resources of LLCs.
Methodological toolkit for assessing strategic target structure of financial resources
in corporations, such as LLCs, was formed and tested with the help of general
scientific methods of analysis, synthesis, system thinking, grouping, analytical,
graphical, comparative, economic-statistical, economic-mathematical, extrapolation,
coefficient analysis, authoring software of general MS EXCEL and special EXCEL-
VBA, etc.; based on the results the main areas of application are indicated.
The working hypothesis of the research is grounded in the need to form a modern
scientifically based toolkit for assessing the strategic target structure of financial
resources in corporations, in the area of developing a model of a strategic target
structure of financial resources LLC, which combines extrapolation and stochastic
modeling methods. Theoretical significance of the research lies in the development
and expansion of conceptual, theoretical and methodological provisions for
evaluating the strategic target structure of financial resources in LLCs that are
focused on the formation and development of modern methodological tools for such
evaluation. Practical significance of the research lays in development and
application of methods, models, practical recommendations that form the
methodological and practical basis for development of modern set of tools for
assessing the strategic target structure of financial resources and development of
specific areas for its exploit.
2. Methodology
2.1. Research of the categorical apparatus to determine a target structure of
financial resources in organizations
Structural approach is laid in most approaches to define the concept of "financial
resources" of a commercial organization.
For instance, Balabanov (2008), Guseva (2008) include borrowed funds in their
interpretation. Lysenko (2006) specifies the sources of financial resources: own
company’s resources and quasi elements, accumulation of resources in the financial
market and attraction of redistributed funds from the financial and banking sector. In
the opinion of Ilyina and Sidorenko (2008), Kolchina and Polyak (2012), Kolchina,
et al. (2015) "financial resources" represent combination of the company’s own

Methodological Tools for Evaluation of Strategic Target Structure of Financial Resources in
Corporations with Limited Liability
442
recourses and external financial inflows (borrowed funds, attracted funds) for
accomplishment of financial obligations, covering current costs linked to expansion
of operational activities.
Kovalev (2015) defines the target capital structure via proportional long-term
financial resources that minimize the average cost for its provision, which ultimately
maximizes the value of the organization, proving the opportunity to mobilize the
sources of the long term financing. Bocharov (2006) characterizes the target
structure of the organization's capital through the ratio between its own and
borrowed resources for asset formation, ensuring a certain profitability of assets and
equity at minimum risk.
Basovsky (2013) views the target structure as the structure that balances the costs
and benefits of financial gearing, i.e. maximizes the value of the organization, and at
the same time recommends determining the factors to be considered in such an
assessment by means of expert assessments. In our opinion, each LLC should
support the target structure of financial resources, maximizing its value taking into
account its strategic landmarks.
2.2. The issues related to formation of the financial resources structures in the
researched corporations (LLCs)
Identification of the target structure of financial resources makes it clear that the
target formula for the profitability of own financial assets can be based on the
following formula:
(1)
Where:
PFR- profitability of financial resources (assets) by net profit
Тi - income tax rate;
BFR- borrowed financial resources;
OFR- own financial resources;
CoD - cost of debt.
It is necessary to take into account that the difference between the expected return on
equity and the cost of borrowed capital should be very significant; since it is taken
for granted that the organization's debt obligations are safer than its own capital.
Investors demand a lower profitability when investing in debt obligations, and
higher one when investing in the authorized capital of the organization. It is so, since
the more of borrowed capital is involved, the more risk is imposed on the equity, but
this is not due to credit risk (the situation persists even in the case of attracting risk-
free borrowings). Although, the "hidden" costs associated with borrowings are not
taken into account. Using the constant coefficient of financial gearing the
V.V. Manuylenko , L.A. Kabardokova, M.A. Loktionova, N.V. Sobchenko
, T.A. Sadovskaya
443
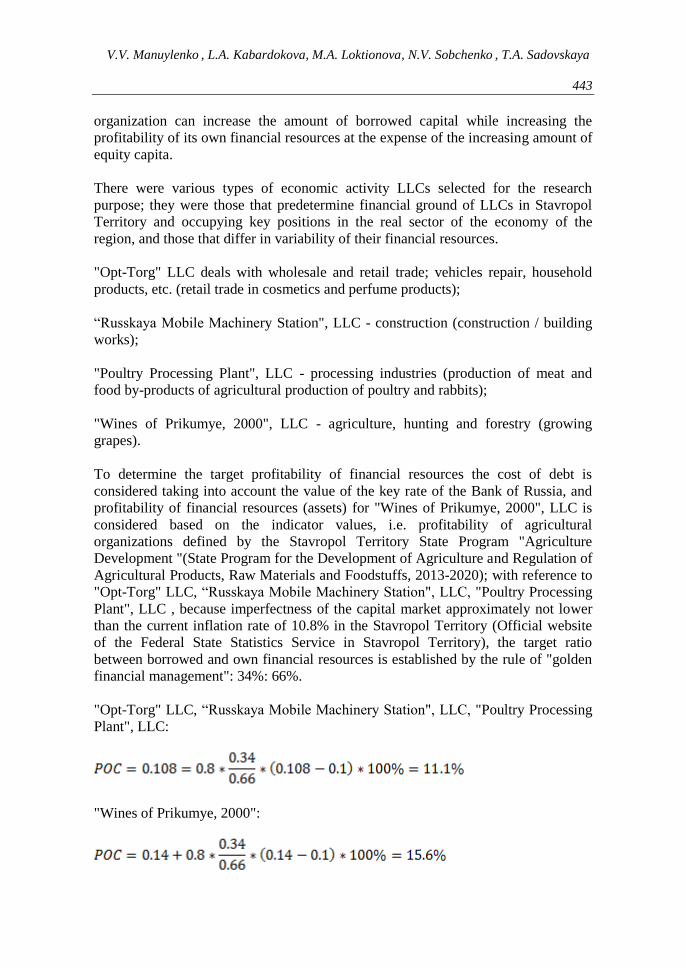
organization can increase the amount of borrowed capital while increasing the
profitability of its own financial resources at the expense of the increasing amount of
equity capita.
There were various types of economic activity LLCs selected for the research
purpose; they were those that predetermine financial ground of LLCs in Stavropol
Territory and occupying key positions in the real sector of the economy of the
region, and those that differ in variability of their financial resources.
"Opt-Torg" LLC deals with wholesale and retail trade; vehicles repair, household
products, etc. (retail trade in cosmetics and perfume products);
“Russkaya Mobile Machinery Station", LLC - construction (construction / building
works);
"Poultry Processing Plant", LLC - processing industries (production of meat and
food by-products of agricultural production of poultry and rabbits);
"Wines of Prikumye, 2000", LLC - agriculture, hunting and forestry (growing
grapes).
To determine the target profitability of financial resources the cost of debt is
considered taking into account the value of the key rate of the Bank of Russia, and
profitability of financial resources (assets) for "Wines of Prikumye, 2000", LLC is
considered based on the indicator values, i.e. profitability of agricultural
organizations defined by the Stavropol Territory State Program "Agriculture
Development "(State Program for the Development of Agriculture and Regulation of
Agricultural Products, Raw Materials and Foodstuffs, 2013-2020); with reference to
"Opt-Torg" LLC, “Russkaya Mobile Machinery Station", LLC, "Poultry Processing
Plant", LLC , because imperfectness of the capital market approximately not lower
than the current inflation rate of 10.8% in the Stavropol Territory (Official website
of the Federal State Statistics Service in Stavropol Territory), the target ratio
between borrowed and own financial resources is established by the rule of "golden
financial management": 34%: 66%.
"Opt-Torg" LLC, “Russkaya Mobile Machinery Station", LLC, "Poultry Processing
Plant", LLC:
"Wines of Prikumye, 2000":

Methodological Tools for Evaluation of Strategic Target Structure of Financial Resources in
Corporations with Limited Liability
444
That means that with the target structure of financial resources, based on the "golden
rule" of financial management a specified level of profitability of the own financial
resources should be provided 11.1%, with actual values as of 01.01.2016 in "Opt-
Torg" LLC - 2, 7%, in “Russkaya Mobile Machinery Station", LLC - 24.9%, in
"Poultry Processing Plant", LLC - 8.8%, in"Wines of Prikumye, 2000" LLC - 15.6%
(in fact as of 01.01.2016, 6.4%).
Most economists associate the identification of the target structure of capital with its
optimization. Practice shows that the target structure of capital is not always optimal
because of the impact of macroeconomic factors.
Provided the dynamism of the external environment, it becomes specifically
beneficial to achieve the optimal dynamic capital structure of LLCs, which implies
the establishment of the future state of the macro environment. That means that the
model of a rational dynamic structure of capital is created on the principle of
"structural adaptation", i.e. the structure of assets and liabilities of LLCs must react
to changes in the external environment.
The model of "external environment" constructed in accordance with individual
forecasts is the starting point for the formation of the dynamic structure of capital.
So, the changes in the target structure of capital are determined by the dynamics of
the factors affecting it.
In international corporations "LoTus" prognostic model for determining changes in
the target structure is used to assess alternative scenarios, namely, variations of:
- input data to determine the impact of financing terms on the key performance
parameters;
- variable coefficients to determine the effect of business risk in the organization at
productive parameters provided individual financial strategies.
The result is determination of the external financing amount, average cost of the
capital charge, profitability of company’s own financial resources, the interest
coverage ratio, etc. Financial manager interprets the results to determine the target
structure of the capital.
In conditions of high leverage for LLC mainly represented with a poor-quality
source of financing - i.e. bank liabilities, short-term and long-term loans - financial
managers need to pay special attention to formation of an optimal financial capital
structure (Table 1). Funding of the assessed LLCs with mainly borrowed funds may
be explained with the fact that their creditors actually become new members. LLCs
can return to financing only at the expense of own capital.

V.V. Manuylenko , L.A. Kabardokova, M.A. Loktionova, N.V. Sobchenko
, T.A. Sadovskaya
445
Table 1: Composition and structure of financial resource sources in the researched
corporations - LLCs (in dynamics)
Y
Y
"OPT-TORG", LLC
Financial resources
total,
including:
Own financial
resources
Authorized
capital
Revaluation of non-
current
assets
Additional capital
(without
revaluation)
Undistribut
ed profit (loss)
Long-term financial
funds:
Ab
solu
te v
alu
e (i
n t
ho
usa
nd
ruble
s)
Str
uct
ure
, %
Ab
solu
te v
alu
e (i
n t
ho
usa
nd
ruble
s)
Str
uct
ure
, %
Ab
solu
te v
alu
e (i
n t
ho
usa
nd
ruble
s)
Str
uct
ure
, %
Ab
solu
te v
alu
e (i
n t
ho
usa
nd
ruble
s)
Str
uct
ure
, %
Ab
solu
te v
alu
e (i
n t
ho
usa
nd
ruble
s)
Str
uct
ure
, %
Ab
solu
te v
alu
e (i
n t
ho
usa
nd
ruble
s)
Str
uct
ure
, %
Ab
solu
te v
alu
e (i
n t
ho
usa
nd
ruble
s)
Str
uct
ure
, %
1 2 3 4 5 6 7 8 9 10 11 12 13 14 1
5
2009
2338640 100 98077 4,2 500 0,02 – – 5449 0,2 92128 4,0 1591007 68,0
2010
2595092 100 104821 4,0 1000 0,04 – – 5449 0,2 98372 3,8 1366552 52,7
2011
2830337 100 95204 3,3 1000 0,04 – – 5449 0,2 88755 3,1 1861731 65,8
2012
3207401 100 134181 4,2 1000 0,03 – – 5449 0,2 127732 4,0 0 0
2013
3088829 100 151978 5,0 1000 0,03 – – 5449 0,2 145529 4,8 1830000 59,2
2014
3013421 100 148876 4,9 1000 0,03 – – 5449 0,2 142427 4,7 1500000 49,8
2015
2862071 100 152933 5,3 1000 0,04 – – 5449 0,2 146484 5,1 1456981 50,9
Long-term
borrowed funds
Other long-
term sources
Short-term
financial resources:
Short-term
borrowed funds
Accounts
payable
Other
short-term sources
Ab
solu
te v
alu
e (i
n
tho
usa
nd r
ub
les)
Str
uct
ure
, %
Ab
solu
te v
alu
e (i
n
tho
usa
nd r
ub
les)
Str
uct
ure
, %
Ab
solu
te v
alu
e (i
n
tho
usa
nd r
ub
les)
Str
uct
ure
, %
Ab
solu
te v
alu
e (i
n
tho
usa
nd r
ub
les)
Str
uct
ure
, %
Ab
solu
te v
alu
e (i
n
tho
usa
nd r
ub
les)
Str
uct
ure
, %
Ab
solu
te v
alu
e (i
n
tho
usa
nd r
ub
les)
Str
uct
ure
, %
2009
1591007 68,0 – – 6
49556
2
7,8 0 0
6
49556
2
7,8 – –

Methodological Tools for Evaluation of Strategic Target Structure of Financial Resources in
Corporations with Limited Liability
446 2
010
1366552 52,7 – – 1
123719
4
3,3 3
52500
1
3,6
7
71219
2
9,7 – –
2011
1861731 65,8 – – 8
73402 3
0,9 0 0
873402
30,9
– –
2012
0 0 – – 3
073220
9
5,8
1
878791
5
8,6
1
194429
3
7,2 – –
2013
1830000 59,2 – – 1
106851 3
5,8 0 0
1106851
35,8
– –
2014
1500000 49,8 – – 1
364545
4
5,3
3
30000
1
1,0
1
034545
3
4,3 – –
2015
1456981 50,9 – – 1
252157
4
3,8
5
79906
2
0,3
6
72251
2
3,5 – –
"Russkaya Mobile Machinery Station", LLC
YY
Financial resources
total, including:
Own financial
resources
Authorized
capital
Revaluation of non-
current assets
Additional capital
(without revaluation)
Undistributed profit
(loss)
Long-term financial
funds:
Ab
solu
te v
alu
e (i
n
tho
usa
nd r
ub
les)
Str
uct
ure
, %
Ab
solu
te v
alu
e (i
n
tho
usa
nd r
ub
les)
Str
uct
ure
, %
Ab
solu
te v
alu
e (i
n
tho
usa
nd r
ub
les)
Str
uct
ure
, %
Ab
solu
te v
alu
e (i
n
tho
usa
nd r
ub
les)
Str
uct
ure
, %
Ab
solu
te v
alu
e (i
n
tho
usa
nd r
ub
les)
Str
uct
ure
, %
Ab
solu
te v
alu
e (i
n
tho
usa
nd r
ub
les)
Str
uct
ure
, %
Ab
solu
te v
alu
e (i
n
tho
usa
nd r
ub
les)
Str
uct
ure
, %
2009
393601 100 5850 1,5 176 0,04 – – – – 5674 1,4 31177 7,9
2010
741006 100 16645 2,2 176 0,02 – – – – 16469 2,2 56960 7,7
2011
809380 100 36649 4,5 176 0,02 – – – – 36473 4,5 125000 15,5
2012
888463 100 59900 6,7 176 0,02 – – – – 59724 6,7 – –
2013
5339018 100 83374 1,6 176 0,003 – – 1153 0,02 82045 1,5 – –
2014
7502669 100 302036 4,0 176 0,002 146307 2,0 – – 155553 2,0 – –
2015
7801809 100 471056 6,0 176 0,002 146307 1,9 – – 324573 4,1 – –
Long-term borrowed
funds
Other long-term
sources
Short-term financial
resources:
Short-term borrowed
funds
Accounts payable
Other short-term
sources

V.V. Manuylenko , L.A. Kabardokova, M.A. Loktionova, N.V. Sobchenko
, T.A. Sadovskaya
447
Ab
solu
te v
alu
e (i
n
tho
usa
nd r
ub
les)
Str
uct
ure
, %
Ab
solu
te v
alu
e (i
n
tho
usa
nd r
ub
les)
Str
uct
ure
, %
Ab
solu
te v
alu
e (i
n
tho
usa
nd r
ub
les)
Str
uct
ure
, %
Ab
solu
te v
alu
e (i
n
tho
usa
nd r
ub
les)
Str
uct
ure
, %
Ab
solu
te v
alu
e (i
n
tho
usa
nd r
ub
les)
Str
uct
ure
, %
Ab
solu
te v
alu
e (i
n
tho
usa
nd r
ub
les)
Str
uct
ure
, %
2009
31177 7,9 – – 356574 90,6 95081 24,2 261493 66,4 – –
2010
56960 7,7 – – 667401 90,1 – – 667401 90,1 – –
2011
125000 15,5 – – 647731 80,0 120000 14,8 363481 44,9 164250 20,3
2012
– – – – 828563 93,3 204752 23,0 461039 51,9 162772 18,4
2013
– – – – 5255644 98,4 484920 9,1 4764297 89,2 6427 0,1
2014
– – – – 7200633 96,0 480250 6,4 6705358 89,4 15025 0,2
2015
– – – – 7330753 94,0 520000 6,7 6785938 87,0 24815 0,3
"Poultry Processing Plant", LLC
Y
Y
Financial
resources
total,
including:
Own
financial
resources
Authorized
capital
Revaluation
of non-
current
assets
Additional
capital
(without
revaluation)
Undistribut
ed profit
(loss)
Long-term
financial
funds:
Ab
solu
te v
alu
e (i
n
tho
usa
nd r
ub
les)
Str
uct
ure
, %
Ab
solu
te v
alu
e (i
n
tho
usa
nd r
ub
les)
Str
uct
ure
, %
Ab
solu
te v
alu
e (i
n
tho
usa
nd r
ub
les)
Str
uct
ure
, %
Ab
solu
te v
alu
e (i
n
tho
usa
nd r
ub
les)
Str
uct
ure
, %
Ab
solu
te v
alu
e (i
n
tho
usa
nd r
ub
les)
Str
uct
ure
, %
Ab
solu
te v
alu
e (i
n
tho
usa
nd r
ub
les)
Str
uct
ure
, %
Ab
solu
te v
alu
e (i
n
tho
usa
nd r
ub
les)
Str
uct
ure
, %
2009
1741514 100 78556 4,5 66273 3,8 – – 11870 0,7 413 0,02 925271 53,1
2010
2804814 100 78643 2,8 66273 2,4 – – 11870 0,4 500 0,02 1926363 68,7
2011
3909811 100 78746 2,0 66273 1,7 – – 11870 0,3 603 0,02 2072253 53,0
2012
4909283 100 88820 1,8 66273 1,4 – – 11870 0,2 10677 0,2 1854253 37,8
2013
4528513 100 101896 2,3 66273 1,5 – – 11870 0,3 23753 0,5 1920969 42,4

Methodological Tools for Evaluation of Strategic Target Structure of Financial Resources in
Corporations with Limited Liability
448 2
014
6354166 100 158492 2,5 66273 1,0 – – 11870 0,2 80349 1,3 1450310 22,8
2015
8228220 100 776451 9,4 531283 6,5 – – 11870 0,1 233298 2,8 1036869 12,6
Long-term borrowed
funds
Other long-term
sources
Short-term financial
resources:
Short-term borrowed
funds
Accounts payable
Other short-term
sources
Ab
solu
te v
alu
e (i
n t
ho
usa
nd
ruble
s)
Str
uct
ure
, %
Ab
solu
te v
alu
e (i
n t
ho
usa
nd
ruble
s)
Str
uct
ure
, %
Ab
solu
te v
alu
e (i
n t
ho
usa
nd
ruble
s)
Str
uct
ure
, %
Ab
solu
te v
alu
e (i
n t
ho
usa
nd
ruble
s)
Str
uct
ure
, %
Ab
solu
te v
alu
e (i
n t
ho
usa
nd
ruble
s)
Str
uct
ure
, %
Ab
solu
te v
alu
e (i
n t
ho
usa
nd
ruble
s)
Str
uct
ure
, %
2009
913553 52,5 11718 0,6 737687 42,4 399019 22,9 338668 19,5 – –
2010
1926363 68,7 – – 799808 28,5 376596 13,4 423212 15,1 – –
2011
2072253 53,0 – – 1758812 45,0 368697 9,4 1390115 35,6 – –
2012
1854253 37,8 – – 2966210 60,4 444000 9,0 2496169 50,9 26041 0,5
2013
1920608 42,4 361 0,01 2505648 55,3 1366618 30,2 1121677 24,7 17353 0,4
2014
1435116 22,6 15194 0,2 4745364 74,7 733972 11,6 3944538 62,1 66854 1,0
2015
988312 12,0 48557 0,6 6414900 78,0 2907723 35,3 3473333 42,2 33844 0,5
"Wines of Prikumye, 2000", LLC
Y
Y
Financial
resources
total, including:
Own
financial
resources
Authorized
capital
Revaluation
of non-
current assets
Additional
capital
(without revaluation)
Undistributed profit
(loss)
Long-term
financial
funds:
Ab
solu
te v
alu
e (i
n
tho
usa
nd r
ub
les)
Str
uct
ure
, %
Ab
solu
te v
alu
e (i
n
tho
usa
nd r
ub
les)
Str
uct
ure
, %
Ab
solu
te v
alu
e (i
n
tho
usa
nd r
ub
les)
Str
uct
ure
, %
Ab
solu
te v
alu
e (i
n
tho
usa
nd r
ub
les)
Ab
solu
te v
alu
e (i
n
tho
usa
nd r
ub
les)
Str
uct
ure
, %
Ab
solu
te v
alu
e (i
n
tho
usa
nd r
ub
les)
Str
uct
ure
, %
Ab
solu
te v
alu
e (i
n
tho
usa
nd r
ub
les)
Str
uct
ure
, %
2009
197425 100 33186 16,8 20000 10,1 – – 31734 16,1 – 18548 – 9,4 74655 37,8
2010
210961 100 33689 16,0 20000 9,5 – – 31734 15,1 – 18045 – 8,6 71736 34,0

V.V. Manuylenko , L.A. Kabardokova, M.A. Loktionova, N.V. Sobchenko
, T.A. Sadovskaya
449
Source: calculated by the authors V. V. Manuylenko, L. A. Kabardakova according to the
financial statements of corporations (Internet site of "Russkaya Mobile Machinery Station",
LLC, Internet site of "Wines of Prikumye, 2000", LLC)
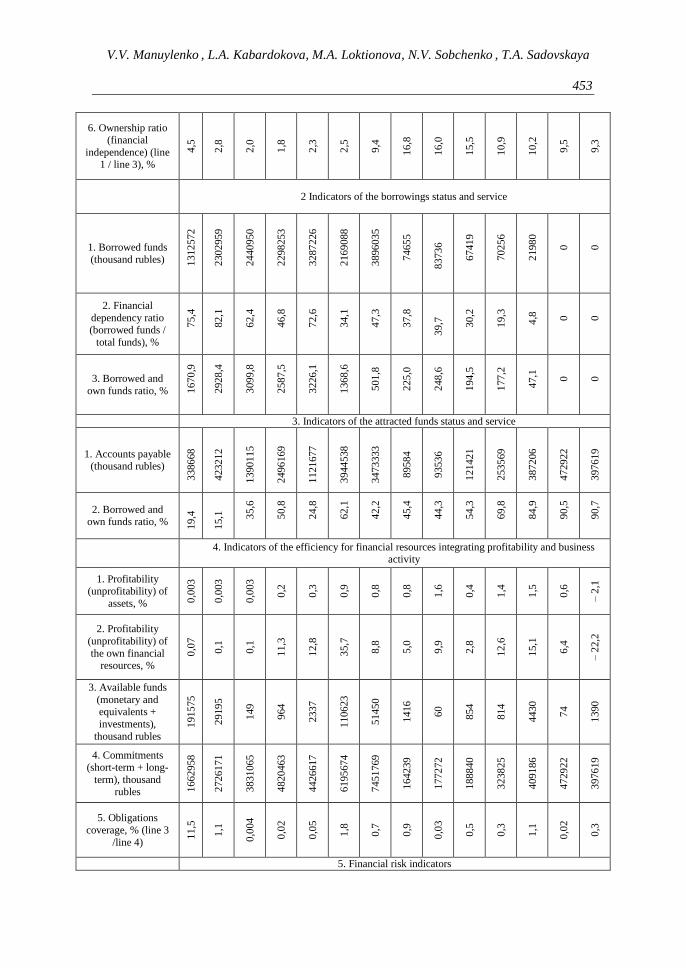
The extend of the indicators’ values that characterize structure of financial resources
in the assessed LLCs on each phase of the business cycle (Table 2) stipulate that
LLCs do not identify target values for neither of: stability of financial resources,
financial independence (dependence), ratio of attracted and own financial resources,
or attracted and cumulative financial resources, profitability of assets (own financial
2011
223499 100 34659 15,5 20000 8,9 31734 14,2 – – – 17075 – 7,6 62419 27,9
2012
363477 100 39652 10,9 20000 5,5 31734 8,7 – – –12082 – 3,3 68256 18,8
2013
455892 100 46706 10,2 20000 4,4 31734 6,9 – – – 5028 – 1,1 21980 4,9
2014
522817 100 49895 9,5 20000 3,8 31734 6,1 – – – 1839 – 0,4 – –
2015
438437 100 40818 9,3 20000 4,6 31734 7,2 – – –10916 – 2,5 – –
Long-term
borrowed funds
Other long-
term sources
Short-term
financial resources:
Short-term
borrowed funds
Accounts
payable
Other
short-term sources
Ab
solu
te v
alu
e (i
n
tho
usa
nd r
ub
les)
Str
uct
ure
, %
Ab
solu
te v
alu
e (i
n
tho
usa
nd r
ub
les)
Str
uct
ure
, %
Ab
solu
te v
alu
e (i
n
tho
usa
nd r
ub
les)
Str
uct
ure
, %
Ab
solu
te v
alu
e (i
n
tho
usa
nd r
ub
les)
Str
uct
ure
, %
Ab
solu
te v
alu
e (i
n
tho
usa
nd r
ub
les)
Str
uct
ure
, %
Ab
solu
te v
alu
e (i
n
tho
usa
nd r
ub
les)
Str
uct
ure
, %
2009
74655 37,8 – – 89584 45,4 – – 89584 45,4 – –
2010
71736 34,0 – – 105536 50,0 12000 5,7 93536 44,3 – –
2011
62419 27,9 – – 126421 56,6 5000 2,3 121421 54,3 – –
2012
68256 18,8 – – 255569 70,3 2000 0,6 253569 69,7 – –
2013
21980 4,9 – – 387206 84,9 – – 387206 84,9 – –
2014
– – – – 472922 90,5 – – 472922 90,5 – –
2015
– – – – 397619 90,7 – – 397619 90,7 – –

Methodological Tools for Evaluation of Strategic Target Structure of Financial Resources in
Corporations with Limited Liability
450
resources), liabilities coverage, mobilization of own financial resources and their
multiplier, that in the end shape financial culture of financial managers. Negative
values and increase of financial gearing effect are noted (Table 3).
Table 2: Special indicators characterizing the state of financial resources structure
in the researched corporations - LLCs in each phase of the business cycle
Indicators
YY
2009
2010
2011
2012
2013
2014
2015
2009
2010
2011
2012
2013
2014
2015
Business cycle phases
Rec
essi
on
Up
turn
Boo
m
Do
wntu
rn
Rec
essi
on
Up
turn
Boo
m
Do
wntu
rn
1 2 3 4 5 6 7 8 9 10 11 12 13 14 15
"OPT-TORG", LLC
"Russkaya Mobile Machinery Station", LLC
1. Indicators for sustainability of financial recourses
1. Own financial
resources (thousand rubles) 9
807
7
1048
21
9520
4
1341
81
1519
78
1488
76
1529
33
5850
1664
5
3664
9
5990
0
8337
4
3020
36
4710
56
2. Long term credits and loans (thousand
rubles)
1591
007
1366
552
1861
731
0
1830
000
1500
000
1456
981
3117
7
5696
0
1250
00
–
–
– –
3. Joint financial resources (thousand
rubles)
2338
640
2595
092
2830
337
3207
401
3088
829
3013
421
2862
071
3936
01
7410
06
8093
80
8884
63
5339
018
7502
669
7801
809
4. Sustainability financial resources
Ratio
(Коэффициент устойчивости
финансовых
ресурсов (current, permanent) (line 1 +
line 2) / line 3, %
72,3
56,7
69,1
4,2
64,2
54,7
56,2
9,4
9,9
20,0
6,7
1,6
4,0
6,0
5. Net income (loss), (thousand
rubles) 5701
6906
9512
1806
2
1837
8
2020
6
4057
1720
1646
8
2000
2
2075
6
2232
1
1555
53
1173
88
6. Ownership ratio
(financial independence) (line
1 / line 3), %
4,2
4,0
3,3
4,2
5,0
4,9
5,3
1,5
2,2
4,5
6,7
1,6
4,0
6,0
2. Indicators of the borrowings status and service

V.V. Manuylenko , L.A. Kabardokova, M.A. Loktionova, N.V. Sobchenko
, T.A. Sadovskaya
451
1. Borrowed funds (thousand rubles)
1591
007
1719
052
1861
731
1878
791
1830
000
1830
000
2036
887
1262
58
5696
0
2450
00
2047
52
4849
20
4802
50
5200
00
2. Financial dependency ratio
(borrowed funds / total funds), %
68,0
66,2
65,8
58,6
59,2
60,7
71,2
32,1
7,7
30,3
23,0
9,1
6,4
6,7
3. Borrowed and own funds ratio, %
1622
,2
1640
,0
1955
,5
1400
,2
1204
,1
1229
,2
1331
,9
2158
,3
342
,2
668
,5
341
,8
581
,6
159
,0
110
,4
3. Indicators of the attracted funds status and service
1. Accounts payable
(thousand rubles)
6495
56
7712
19
8734
02
1194
429
1106
851
1034
545
6722
51
2614
93
6674
01
3634
81
4610
39
4764
297
6705
358
6785
938
2. Borrowed and own funds ratio, % 2
7,8
29,7
30,9
37,2
35,8
34,3
23,5
66,4
90,1
44,9
51,9
89,2
89,4
87,0
4. Indicators of the efficiency for financial resources integrating profitability and business
activity
1. Profitability
(unprofitability) of assets, %
0,2
0,3
0,3
0,6
0,6
0,7
0,1
0,4
2,2
2,5
2,3
0,4
2,1
1,5
2. Profitability
(unprofitability) of
the own financial resources, %
5,8
6,6
10,0
13,5
12,1
13,6
2,7
29,4
98,9
54,6
34,7
26,8
51,5
24,9
3. Available funds (monetary and
equivalents +
investments), thousand rubles
6266
4
4890
8
7386
7
1209
27
7673
4
6833
4
3611
2
2753
43
1536
99
6396
8
2137
40
6788
7
1811
02
1713
95
4. Commitments
(short-term + long-
term), thousand rubles 2
240
563
2490
271
2735
133
3073
220
2936
851
2864
545
2709
138
3877
51
7243
61
7727
31
8285
63
5255
644
7200
633
7330
753

Methodological Tools for Evaluation of Strategic Target Structure of Financial Resources in
Corporations with Limited Liability
452
5. Obligations
coverage, % (line 3 /line 4)
2,8
2,0
2,7
3,9
2,6
2,4
1,3
71,0
21,2
8,3
25,8
1,3
2,5
2,3
5. Financial risk indicators
1. Immobilized
assets, thousand
rubles 1437
757
1546
529
1546
841
1563
851
1633
904
1738
344
1694
340
5449
4
7497
9
1078
26
8888
5
4849
76
3806
37
4947
95
2.Immobilized own
resources (line 1 /
own financial resources), %
1465
,9
1475
,4
1624
,8
1165
,5
1075
,1
1167
,6
1107
,9
931
,5
450
,5
294
,2
148
,4
581
,7
126
,0
105
,0
3. Own financial
resources multiplication, units 2
3,8
45
24,7
58
29,7
29
23,9
04
20,3
24
20,2
42
18,7
15
67,2
82
44,5
18
22,0
85
14,8
32
64,0
37
24,8
40
16,5
62
"Poultry Processing Plant", LLC "Wines of Prikumye, 2000", LLC
1. Indicators for sustainability of financial recourses
1. Own financial
resources (thousand rubles) 7
855
6
7864
3
7874
6
8882
0
1018
96
1584
92
7764
51
3318
6
3368
9
3465
9
3965
2
4670
6
4989
5
4081
8
2. Long term credits
and loans (thousand
rubles) 9135
53
1926
363
2072
253
1854
253
1920
608
1435
116
9883
12
7465
5
7173
6
6241
9
6825
6
2198
0
–
–
3. Joint financial resources (thousand
rubles) 1741
514
2804
814
3909
811
4909
283
4528
513
6354
166
8228
220
1974
25
2109
61
2234
99
3634
77
4558
92
5228
17
4384
37
4. Sustainability
financial resources
Ratio (Коэффициент
устойчивости
финансовых ресурсов (current,
permanent) (line 1 +
line 2) / line 3, %
57,0
71,5
55,0
39,6
44,7
25,1
21,4
54,6
50,0
43,4
29,7
15,1
9,5
9,3
5. Net income
(loss), (thousand rubles)
53
87
103
1007
4
1307
6
5659
6
6858
9
1658
3330
970
4993
7054
3190
– 9
077
V.V. Manuylenko , L.A. Kabardokova, M.A. Loktionova, N.V. Sobchenko
, T.A. Sadovskaya
453
6. Ownership ratio (financial
independence) (line 1 / line 3), %
4,5
2,8
2,0
1,8
2,3
2,5
9,4
16,8
16,0
15,5
10,9
10,2
9,5
9,3
2 Indicators of the borrowings status and service
1. Borrowed funds (thousand rubles) 1
312
572
2302
959
2440
950
2298
253
3287
226
2169
088
3896
035
7465
5
8373
6
6741
9
7025
6
2198
0
0
0
2. Financial
dependency ratio (borrowed funds /
total funds), %
75,4
82,1
62,4
46,8
72,6
34,1
47,3
37,8
39,7
30,2
19,3
4,8
0
0
3. Borrowed and
own funds ratio, % 1670
,9
2928
,4
3099
,8
2587
,5
3226
,1
1368
,6
501
,8
225
,0
248
,6
194
,5
177
,2
47,1
0
0
3. Indicators of the attracted funds status and service
1. Accounts payable (thousand rubles)
3386
68
4232
12
1390
115
2496
169
1121
677
3944
538
3473
333
8958
4
9353
6
1214
21
2535
69
3872
06
4729
22
3976
19
2. Borrowed and own funds ratio, % 1
9,4
15,1
35,6
50,8
24,8
62,1
42,2
45,4
44,3
54,3
69,8
84,9
90,5
90,7
4. Indicators of the efficiency for financial resources integrating profitability and business
activity
1. Profitability (unprofitability) of
assets, % 0,0
03
0,0
03
0,0
03
0,2
0,3
0,9
0,8
0,8
1,6
0,4
1,4
1,5
0,6
– 2
,1
2. Profitability
(unprofitability) of
the own financial resources, %
0,0
7
0,1
0,1
11,3
12,8
35,7
8,8
5,0
9,9
2,8
12,6
15,1
6,4
– 2
2,2
3. Available funds
(monetary and equivalents +
investments),
thousand rubles
1915
75
2919
5
149
964
2337
1106
23
5145
0
1416
60
854
814
4430
74
1390
4. Commitments (short-term + long-
term), thousand rubles 1
662
958
2726
171
3831
065
4820
463
4426
617
6195
674
7451
769
1642
39
1772
72
1888
40
3238
25
4091
86
4729
22
3976
19
5. Obligations
coverage, % (line 3
/line 4)
11,5
1,1
0,0
04
0,0
2
0,0
5
1,8
0,7
0,9
0,0
3
0,5
0,3
1,1
0,0
2
0,3
5. Financial risk indicators

Methodological Tools for Evaluation of Strategic Target Structure of Financial Resources in
Corporations with Limited Liability
454
1. Immobilized assets, thousand
rubles 1016
93
2
1378
08
7
2338
66
5
2298
23
2
2286
43
1
2279
11
4
3455
41
8
1130
74
1170
94
1184
22
1566
22
1783
49
1838
07
1706
00
2.Immobilized own
resources (line 1 /
own financial resources), %
1294
,5
1752
,3
2969
,9
2587
,5
2243
,9
1438
,0
445
,0
340
,7
347
,6
341
,7
395
,0
381
,9
368
,4
418
,0
3. Own financial resources
multiplication, units 22,1
69
35,6
65
49,6
51
55,2
72
44,4
43
40,0
91
10,5
97
5,9
50
6,2
62
6,4
49
9,1
67
9,7
61
10,4
78
10,7
41
Source: compiled by the authors V. V. Manuylenko, L А. Kabardakova
Table 3: Determination of financial gearing effect in the researched corporations –
LLCs
YY
Tax
co
rrec
tor,
unit
s
Ass
ets,
th
ou
sand
ru
ble
s.
Pro
fit
(lo
ss)
pri
or
to t
ax,
tho
usa
nd r
ub
les.
Inte
rest
expen
ses,
th
ou
sand
ruble
s.
Pai
d b
orr
ow
ed f
un
ds,
tho
usa
nd r
ub
les
Eco
no
mic
eff
icie
ncy
of
asse
tsв, un
its
(gro
up 4
+
gro
up 5
) /
gro
up
3
Av
erag
e in
tere
st r
ate
for
pai
d b
orr
ow
ed f
und
s,
unit
s (g
roup
5 /
gro
up
6)
Dif
fere
nti
al, unit
s
(gro
up 7
– g
roup
8)
Co
rrel
atio
n o
f li
abil
itie
s an
d
ow
n f
inan
cial
res
ou
rces
(le
ver
age
of
fin
anci
al g
eari
ng
), u
nit
s
Fin
anci
al g
eari
ng e
ffec
t
(gro
up 2
× g
roup
9 ×
gro
up 1
0),
%
1 2 3 4 5 6 7 8 9 10 11
"OPT-TORG", LLC
2009 0,8 98077 7626 134350 1591007 1,448 0,085 + 1,363 22,845 + 24,911
2010 0,8 104821 7805 124991 1719052 1,267 0,073 +1,194 23,758 + 22,694
2011 0,8 95204 11890 150562 1861731 1,707 0,081 + 1,626 28,730 + 37,372
2012 0,8 134181 22577 173130 1878791 1,459 0,093 + 1,366 22,904 + 25,03
2013 0,8 151978 22973 190697 1830000 1,406 0,104 +1,302 19,325 + 20,129
2014 0,8 148876 25257 200667 1830000 1,518 0,11 +1,408 19,242 + 21,675
2015 0,8 152933 5071 266634 2036887 1,777 0,131 +1 ,646 17,715 + 23,328
"Russkaya Mobile Machinery Station", LLC
2009 0,8 393601 2150 0 126258 0,005 0 + 0,005 66,282 + 26,5
2010 0,8 741006 20585 19266 56960 0,054 0,338 – 0,284 43,518 – 988,7
2011 0,8 809380 25003 23325 245000 0,060 0,095 – 0,035 21,085 – 59,0
2012 0,8 888463 25945 33011 204752 0,066 0,161 – 0,095 13,832 – 105,1
2013 0,8 5339018 28350 36871 484920 0,012 0,076 – 0,064 63,037 – 322,7
2014 0,8 7502669 197513 55697 480250 0,034 0,116 – 0,082 23,840 – 156,4
2015 0,8 7801809 147518 75886 520000 0,029 0,146 – 0,117 15,562 – 145,7
"Poultry Processing Plant", LLC
2009 0,8 1741514 7397 165798 1312572 0,099 0,126 – 0,027 21,169 – 45,7
2010 0,8 2804814 555 187718 2302959 0,067 0,082 – 0,015 34,665 – 41,6
2011 0,8 3909811 2032 196215 2440950 0,051 0,080 – 0,029 48,651 – 112,9
2012 0,8 4909283 11516 293907 2298253 0,062 0,128 – 0,066 54,272 – 286,6
2013 0,8 4528513 10661 321190 3287226 0,073 0,098 – 0,025 43,443 – 86,9
2014 0,8 6354166 104757 353813 2169088 0,072 0,163 – 0,091 39,091 – 284,6
2015 0,8 8228220 92722 436449 3896035 0,064 0,112 – 0,048 9,597 – 36,9
"Wines of Prikumye, 2000", LLC
2009 0,8 197425 2072 6221 74655 0,042 0,083 – 0,041 4,949 – 16,2
2010 0,8 210961 4163 4591 83736 0,041 0,055 – 0,014 5,262 – 5,9
2011 0,8 223499 1212 7726 67419 0,040 0,115 – 0,075 5,449 – 32,7

V.V. Manuylenko , L.A. Kabardokova, M.A. Loktionova, N.V. Sobchenko
, T.A. Sadovskaya
455
2012 0,8 363477 6241 4388 70256 0,029 0,062 – 0,033 8,167 – 21,6
2013 0,8 455892 8818 726 21980 0,021 0,033 – 0,012 8,761 – 8,4
2014 0,8 522817 3987 0 0 0,008 0 + 0,008 9,478 + 6,1
2015 0,8 438437 18462 0 0 0,042 0 + 0,042 9,741 + 32,7
Source: calculated by the authors V. V. Manuylenko, L А. Kabardakova
Thus, in the researched LLCs the following can diminish the guarantees of creditors
to cover debts causing an increase of risk for them and their employees:
- reduction and / or insignificant share of the authorized capital in the balance sheet
(where its minimum set value must meet the requirements of national legislation);
- low values of the ownership coefficient indicating the current stability of financial
resources for creditors.
Negative value and growth of the financial gearing in most LLCs lead own
company’s capital to risk exposure. Financial gearing increases fluctuation rate in
the value of the company's own capital, which in turn becomes more risky, hence,
profitability also increases. The growth of financial gearing increasing the risks
causes an increase of the required profitability rate, which provokes interest among
the participants. In this situation, participants demand increase of compensations due
to taking additional risks which they are forced to put up with. It means that the
participants require compensations for commercial risk, profitability of financial
resources and the premium for bearing financial risks.
It should considered that financial risks not only relate to current financial gearing,
but also include other factors, such as: future inclination of the management to
borrowings, access to funds, liquidity profile, the nature of capital requirements and
flexibility in this matter, potential risks, costly litigation, etc. Increase of debt
amount entails possibility of insufficiency for cash flows to cover interest payments.
It should be also noted that the tax system contributes to a high debt load. All of the
above and the conditions of uncertainty justify the need to develop the model for
strategic target structure of capital in national corporations - LLCs, thus forming the
next stage of our research.
2.3. Characteristics and implementation of the stages for development of
methodological tools that serve to assess the strategic target structure of financial
resources in the corporations under investigation – LLCs
Computerization of the financial resources management in LLCs in Russia is
ensured by the special Excel-VBA software package "Software for determining the
strategic target structure of financial resources in commercial corporate
organizations" (Manuylenko and Kabardakova, 2017) which allows to calculate
modified strategic indicators of financial independence and own financial resources.
Implementation of the Monte Carlo stochastic simulation method in determining the
strategic target structure of financial resources is found expedient due to the fact that
most of the indicators characterizing the evaluation of the structure of the financial

Methodological Tools for Evaluation of Strategic Target Structure of Financial Resources in
Corporations with Limited Liability
456
resources of the LLCs are of the random character. Parameters of the Monte Carlo
method are the following: full coverage of distribution history; complex evaluation
without approximating assumptions; projected volatility and evaluation of threats.
Stages to construct an automated model for strategic target structure of capital for
LLCs (Figure 1).
Stage 1. Development of the procedure of creating a special program complex
Excel-VBA.
The main factor describing the structure of financial resources that is the coefficient
ownership for LLC’s (financial independence) was selected as a random value. The
degree of risk is determined by the volatility of the ownership coefficient, its
deviation below the established range of 0.5 - 0.66 in the form of the corresponding
percent of its normal distribution function.
A list of actions to build an empirical function for the distribution of own financial
resources is in the Figure 1. Prior to Monte-Carlo implementation the system of
financial resources management for LLCs applies the method of extrapolation
(sliding average), financial resources are forecasted for 2016 - 2017 (Figure 2).

V.V. Manuylenko , L.A. Kabardokova, M.A. Loktionova, N.V. Sobchenko
, T.A. Sadovskaya
457
Figure 1. Implementation of Monte Carlo stochastic simulation method to
determining the strategic target structure of the corporation's financial resources
Actions undertaken to construct an empirical distribution function of a random
variable - financial independence ratio; parameters for scenario: 1. Taking into account that national practice of financial management considers the value of the ownership
coefficient as min 50%, whereas according to the "golden rule" of financial management, the share of own financial
resources in total is 66%, random value is generated by a random number sensor within the distribution interval [0,5-0 ,
66]. Functions for the simulated distributions are determined by random numbers.
The effective follow-up period is 7 years, 2009-2015.
2. Based on the distribution function F (s), which is a probability that a random variable is less than or equal
to s with a confidence level of 90% own financial resources are defined, including those projected in 2016-2017.
3. Based on the inverse distribution function Fs-1
(distribution quantile) (according to the established argument
v, the value of s is identified, where the random variable is ≤ s with probability v) own financial resources are
determined, the quantile is 90%, including the projected in 2016- 2017.
4. Calculations were repeated 30,000 times using simulations based on the generation of a set of random
scenarios grounded in assumptions and probable with stated constraints.
5. Creation of a variation series of the value for own financial resources projected for 9 years (forecast 2016-
2017).
Forecasting the amount of financial resources in 2016-2017 based on the extrapolation method (moving
average):
Determination of the projected value of financial resources:
l
basicprojected КУУ (B. 1)
where basic.У – basic level (last level of the initial raw), considered as foundation for extrapolation (starting point);
К – average for growth ratio; 1 – forecasting range (the period of anticipation), the interval for which the
forecast is developed.
Average growth rate / the average of the coefficients in each year:
1m
m
1iiK
К
(B. 2)
where iК – growth rates each year; m – number of observations;
Growth ratio in the current period:
1ppУ
cpУ
iК
(B. 3)
where фтУ . – growth ratio for current period; 1фnУ –growth ratio for the previous period.
Projection error based on the calculation of the mean error:
%100n
1ist
P
prognPist
P
n
1МРЕ
(B. 4)
where n – number of projection intervals; istP – true value of the predicted parameter; prognP – projected parameter
value.

Methodological Tools for Evaluation of Strategic Target Structure of Financial Resources in
Corporations with Limited Liability
458
That means that the special program complex Excel-VBA includes the methods of
extrapolation (sliding average) and Monte Carlo simulation (implementation of the
principles of dynamism and automation for financial resources management in the
management system). The results of 30,000 Monte Carlo experiments allow that an
empirical function distribution for our own financial resources is constructed
(Figures 2, 3, 4, 6). According to the Monte Carlo method, the optimality boundary
for the coefficients characterizing the status of financial resources of LLCs is of the
interval nature, it means that the point by point values of the indicators are set in the
context of the phases of the business cycle and the stage of the life cycle of the
LLCs.
Figure 2: Results of forecasting and stochastic modeling for strategic indicators of
the target structure of financial resources in "Russkaya Mobile Machinery Station",
LLC Developed by the authors V. V. Manuylenko, L А. Kabard
Figure 3: Results of forecasting and stochastic modeling for strategic indicators of
the target structure of financial resources in “Poultry processing plant” LLC
Developed by the authors V. V. Manuylenko, L А. Kabardakova

V.V. Manuylenko , L.A. Kabardokova, M.A. Loktionova, N.V. Sobchenko
, T.A. Sadovskaya
459
Figure 4: Results of forecasting and stochastic modeling for strategic indicators
of the target structure of financial resources in "Wines of Prikumye, 2000", LL.
Developed by the authors V. V. Manuylenko, L А. Kabardakov
Strategic indicators of the target financial structure of capital are targeted to achieve
financial balance that ensures sufficient financial sustainability of the LLCs. At the
same time, the 5th principle of corporate management G 20 / OECD "Information
Disclosure and Transparency" is being implemented with regard to information on
risk factor forecasting, the effectiveness of disclosure is achieved by taking into
account the organizations’ specifics and the corresponding type of economic activity
(G20 / OECD Principles of Corporate Management).

Methodological Tools for Evaluation of Strategic Target Structure of Financial Resources in
Corporations with Limited Liability
460
Figure 5: Sequence of the stages for construction of automated model of strategic
target structure of capital for LLCs (Developed by the authors: V. V. Manuylenko, L
А. Kabardakova)
Stage 2. Comparative valuation of the obtained strategic targeted and actual
indicators of the structure for financial resources, the key of which is ownership
coefficient is targeted at subsequent decisions of financial managers on the best
structure of financial resources, at this point financial managers should be aware of
the wide range of possible performance results with LLCs.
Stage 3. Loading the indicators (for stable financing, concentration of financing by
creditors), which expand the possibilities of stochastic modeling implementation. At
this stage of the implementation of the Monte Carlo method, it is expedient to
determine the indicator of stable financing as a ratio of actual and projected values
of own financial resources, establishing a minimum level of stable financing for a
period of 1 year, and characterizing the sustainability of the LLC in the long-term
period due to the use of a more reliable source of financing. Its values should lean to
the value > = 100%. Given that the sources of financing of LLCs are concentrated
mainly in accounts payable the authors introduce the indicator of the concentration
STAGES TO CONSTRUCT AUTOMATED MODEL FOR STRATEGIC TARGET
STRUCTURE OF CAPITAL
Development of the procedure of creating a special program complex
Excel-VBA Stage 1
Comparative valuation of the obtained strategic targeted and actual
indicators of the structure for financial resources, the key of which is
ownership coefficient
Stage 2
Loading the indicators (for stable financing, concentration of
financing by creditors), which expand the possibilities of stochastic
modeling implementation.
Stage 3
Monitoring and update of variable indicators acquired using
the Monte Carlo method.
Stage 4
Motivated conclusion about the strategic target structure for financial
resources at the current moment and in perspective Stage 5

V.V. Manuylenko , L.A. Kabardokova, M.A. Loktionova, N.V. Sobchenko
, T.A. Sadovskaya
461
of funding as per creditors, which requires special monitoring by the financial
management of LLC, especially with increase of its concentration:
(2)
Financing received from each of significant creditor is determined by summing up
all types of accounts payable from one creditor or group of related creditors or
affiliated creditors. "Significant creditor" is one creditor or a group of related or
affiliated creditors with a total of more than 1% (Identification is suggested by the
finance managers based on the analysis of each creditor’s share in the total value) of
debt of accounts payable. It is important to consider that the list of significant
creditors is constantly changing, especially in unstable periods.
"Opt-Torg" LLC is interested in calculation of the similar indicator for the creditors,
specifically banks on which LLC should have a full set of information, such as: the
situation with credit markets within the region and the whole country, information
on rates for loans with various loan periods, dynamics of their change, the number of
credit defaults, data on the extension of loans. Monitoring of such parameters is
conducted to ensure that LLC is aware of the stability of a particular bank in the
credit market or of its financial difficulties. At the same time, financial managers
should be able to interpret correctly the received information. It should be
emphasized that the use of indicators of financial sources concentration stimulates
diversification of their sources.
Stage 4. Monitoring and update of variable indicators acquired using the Monte
Carlo method.
Stage 5. Motivated conclusion about the strategic target structure for financial
resources at the current moment and in perspective
Ambiguity of the criteria for making managerial decisions based on the results of the
imitative assessment justifies the need to apply a motivated conclusion about the
strategic target structure of financial resources. The Board of Directors bears all
responsibility for forecasting the requirements for financial resources to ensure their
continued growth and accumulation. After the interpretation of the results, the
financial managers set target pillars for strategic indicators of the target structure of
financial resources included in the system of strategic goals for the LLC.
3. Results
3.1. In the analytic part of the study
It is recognized that in the conditions of instability, LLCs do not determine the target
values of the indicators that characterize their financial structure; in most cases
LLCs stochastically form financial resources, ignoring phases of the business cycle;

Methodological Tools for Evaluation of Strategic Target Structure of Financial Resources in
Corporations with Limited Liability
462
stochastic changes in the values of property coefficients, the persistence of
permanent financial resources, financial dependence, ratio of borrowed and its own
financial resources, as well as attracted and cumulative financial resources, the
equity multiplier witness for imbalance between the policies of the formation of the
financial structure of capital and financing of assets (Table 1, 2);
– negative effect of financial gearing in LLCs is a result of low economic
profitability of assets that cannot compensate for the costs of land resources, i.e.,
financial managers do not comply with the basic rule of financial gearing and
increase its leverage not by means of adjusting the differential, but with other means
(Table 3);
– comparison of strategic targets in actual values (Table 4) should prompt
development of strategic financial solutions by financial managers;
In the researched LLCs there is a significant exceeding of the strategic targets over
their actual values, the ownership coefficient slightly exceeds its minimum score,
but its values correspond to a buffer score of 1%. Its strategic value indicates the
"thickness of the pillow" provided by the owners to protect creditors. As a result,
under the conditions of a regular change in the macro-, meso- and micro
environment of LLCs operation the task of maximizing the coefficient of financial
independence becomes dynamic.
It is obvious that the values of the indicator in the researched LLCs stand far from
the established level of > = 100 %.
3.2. In the methodological field of research
A methodological toolkit was developed to determine strategic target structure of
financial resources in LLCs based on the author's software product, aimed to
establish strategic indicators of the absolute value of LLCs’ own financial resources
and a modified coefficient of financial independence;
- introduction of the property index for the modified key target of the development
of the LLC, which can subsequently be incorporated into the business planning
process of the financial resources structure, and other financial indicators used to
monitor financial resources of the LLC;
- application of methodological toolkit to determine strategic target structure of
financial resources in LLC, attracting the author's software product for stress testing
that exploits alternative scenarios for changing the ownership coefficient and own
financial resources in the context of the business cycle phases. As a result, the need
for own financial resources is determined via usage of stress input data;
- the indicators of funding concentration by creditors were introduced as an
instrument for regulating accounts payable, excessive amount of borrowed financial
resources in their total amount, the content of which depending on the composition
of creditors can be constantly refined, as well as the concentration of participants'
shares, broken down by participants, that require special monitoring on behalf of
financial management of LLC, especially when concentration increases.

V.V. Manuylenko , L.A. Kabardokova, M.A. Loktionova, N.V. Sobchenko
, T.A. Sadovskaya
463
Practical value of the toolkit for assessing the strategic target structure of financial
resources LLC:
- determines the desired status of structure of financial resources, taking into account
the phases of the business cycle, based on the provision of the Monte Carlo method,
according to which the values of the coefficients describing the state of financial
resources of the LLC have an interval optimal boundary;
- identifies and evaluates many scenarios of how the company's own capital
develops, provides for further development of a strategy for financial resources
management and selection of appropriate management methods depending on the
phases of the business cycle;
- distinguishes the universal nature of the application, as it is used in financial risk
management, strategic and information management, as well as for creation and
evaluation of scenarios on competitors and partners’ behaviors in the financial
markets.
Developed toolkit for assessing strategic target structure of financial resources of
LLCs was tested in financial resources management system, and the financial
management subsystems of: "OPT-TORG", LLC ; "Russkaya Mobile Machinery
Station", LLC; "Poultry Processing Plant", LLC; "Wines of Prikumye, 2000", LLC.
Distribution of absolute values of own financial resources modeled by years,
thousand rubles
Figure 6: Forecasted results and stochastic modeling of strategic indicators for
target structure of financial resources in "Opt-Torg" LLC (Developed by the
authors: V. V. Manuylenko, L А. Kabardakova)
Table 4: Comparison of actual and strategic target indicators characterizing
financial situation in the researched corporations – LLC YY
Amount of own financial resources Property Ratio (ratio of financial independence),
%
Actual
(thousand
rubles)
Strategic
targeted (thousand
rubles)
.
Ratio of
values for strategic
targeted and
own financial
Actual
Strategic
targeted
Difference
between strategic
targeted and
actual ratios

Methodological Tools for Evaluation of Strategic Target Structure of Financial Resources in
Corporations with Limited Liability
464
resources, %
1 2 3 4 5 6 7
"OPT-TORG", LLC
2009 98077 1205528 1229,2 4,2 51,548 + 47,348
2010 104821 1341968 1280,2 4,0 51,712 + 47,712
2011 95204 1465284 1539,1 3,3 51,771 + 48,471
2012 134181 1662846 1239,3 4,2 51,844 + 47,644
2013 151978 1594513 1049,2 5,0 51,622 + 46,622
2014 148876 1563426 1050,2 4,9 51,882 + 46,982
2015 152933 1483555 970,1 5,3 51,835 + 46,535
2016 progn. 1523595 51,659
2017 progn. 1569498 51,687
"Russkaya Mobile Machinery Station", LLC
2009 5850 203856 3484,7 1,5 51,793 + 50,293
2010 16645 383936 2306,6 2,2 51,813 + 49,613
2011 36649 418142 1141,0 4,5 51,662 + 47,162
2012 59900 460517 768,8 6,7 51,833 + 45,133
2013 83374 2763830 3315,0 1,6 51,767 + 50,167
2014 302036 3891028 1288,3 4,0 51,862 + 47,862
2015 471056 4027966 855,1 6,0 51,629 + 45,629
2016 progn. 4681737 51,809
2017 progn. 5314527 51,742
"Poultry Processing Plant", LLC
2009 78556 897438 1142,4 4,5 51,532 + 47,032
2010 78643 1453788 1848,6 2,8 51,832 + 49,032
2011 78746 2015667 2559,7 2,0 51,554 + 49,554
2012 88820 2542661 2862,7 1,8 51,793 + 49,993
2013 101896 2347399 2303,7 2,3 51,836 + 49,536
2014 158492 3287634 2074,3 2,5 51,740 + 49,24
2015 776451 4254283 547,9 9,4 51,704 + 42,304
2016 progn. 4824100 51,820
2017 progn. 5367890 51,662
"Wines of Prikumye, 2000"
2009 33186 102152 307,8 16,8 51,742 + 34,942
2010 33689 109011 323,6 16,0 51,673 + 35,673
2011 34659 115287 332,6 15,5 51,583 + 36,083
2012 39652 187238 472,2 10,9 51,513 + 40,613
2013 46706 235089 503,3 10,2 51,567 + 41,367
2014 49895 269716 540,6 9,5 51,589 + 42,089
2015 40818 225895 553,4 9,3 51,523 + 42,223
2016 progn. 246760 51,558
2017 progn. 267297 51,525
Source: provided by the authors V. V. Manuylenko, L А. Kabardakova – introduction of
stable financing indicator for LLCs (Table 5);
Table 5: Values of stable financing indicator for researched corporations – LLCs
YY
"OP
T-T
OR
G",
LL
C
"Ru
ssk
aya
Mob
ile
Mac
hin
ery
Sta
tion
", L
LC
"Po
ult
ry P
roce
ssin
g P
lan
t",
LL
C
"Win
es o
f P
riku
my
e, 2
000
"
2009 8,1 2,9 8,8 32,5

V.V. Manuylenko , L.A. Kabardokova, M.A. Loktionova, N.V. Sobchenko
, T.A. Sadovskaya
465
2010 7,8 4,3 5,4 30,9
2011 6,5 8,8 3,9 30,1
2012 8,1 13,0 3,5 21,2
2013 9,5 3,0 4,3 19,9
2014 9,5 7,8 4,8 18,5
2015 10,3 11,7 18,3 18,1
Source: provided by the authors: V. V. Manuylenko, L А. Kabardakova
Conclusions
Forecasted model for assessing strategic target structure of financial resources of the
LLCs was developed. It is aimed at determining both: modified ownership
coefficient and values of companies’ own financial resources. It takes into account
the requirements of the "golden rule" of financial management” and formalizes
description of uncertainty with Monte Carlo method designating final indicators
both: forecasted (projected) and modified.
The completed research, particularly the results of the assessment, will further
become the basis for development of management solutions to select alternative
methodological toolkit for management of the financial resources in LLCs. It will
serve the following:
- formation of a modern methodological toolkit for assessing financial resources in
conditions of uncertainty;
- formation of modern methodological toolkit for assessing financial potential in
conditions of uncertainty;
- formation of a modern methodological toolkit for assessing financial resource base
in conditions of uncertainty;
- establishment of strategic indicators that characterize financial structure of capital
in perspective as well as formation of possible scenarios for increasing financial and
resource potential of LLCs;
- development of financial strategies that take into account the risk-oriented nature
of corporations;
- development of new insurance approaches to cover financial risks associated with
the formation of financial resources of LLCs in the insurance market Rusetskaja, E.
A., Rusetskiy, M. G., Rybina, G. K., Chuvilova, O. N. (2016);
- implementation of other approaches to assessment of financial resources, taking
into account the specifics and environment of the functioning of corporations.
References
Ansoff, I. 2016. World economy and world markets. Retrieved 14.02.2017
http://www.ereport.ru.
Balabanov, I.T. 2008. Financial management: textbook. Moscow: Finance and Statistics, pp.
224.
Basovsky, L.E. 2013. Financial management: textbook. Moscow: SRC Infra-M, pp. 240.
Bocharov, V.V. 2006. Modern financial management. St. Petersburg: Peter, pp. 464.

Methodological Tools for Evaluation of Strategic Target Structure of Financial Resources in
Corporations with Limited Liability
466
Guseva, E.G. 2008. Production management in the enterprise: practical training manual.
Moscow: MGUESI, pp. 114.
Fetai, B. 2015. Financial Integration and Financial Development: Does Financial Integration
Metter? European Research Studies Journal, 18(2), 97-106.
Frank, E.V., Mashevskaya, O.V. and Ermolina, L.V. 2016. Innovational Mechanism of
Implementation of Cluster Initiatives in Business. European Research Studies
Journal, 19(1), 179 -188.
Ivanova, E.A., Mackay, M.M., Platonova, T.K., and Elagina, N.V. 2017. Theoretical Basis
for Composition of Economic Strategy for Industry Development. European
Research Studies Journal, 20(1), 246-256.
Ilyina, I.V. and Sidorenko, O.V. 2008. Conception and classification of production process
resources. Economic analysis: theory and practice, 18 (123), 36 - 42.
Jackson, M. and Staunton, M. 2006. Excel Financial modeling: in-depth training; translated
into Russian. Moscow: Williams Publishing House, pp. 352.
Kovalev, V.V. 2015. Financial management of enterprises: practical training manual.
Moscow: Prospekt, pp. 257.
Kolchina, N.V. and Polyak G.V. 2012. Finance of organizations (enterprises): textbook for
universities; under edition of Professor. Moscow: Unity-Dana, pp. 383.
Kolchina, N.V., Portugalova O.V. and Makeeva, E.Yu. 2015. Financial management: a
textbook for university students of economics and management. Moscow: Unity-
Dana, pp. 467.
Lysenko, I.A. 2006. Finances of enterprise: property, funds, taxes. Moscow: IIS Prize, pp.
155.
Manuylenko, V.V. and Mishchenko А.А. 2016. Evaluation of Financial and Innovative
Potential of the Commercial Organization based on the Definition of Financial
Innovation Sustainability. Journal of Internet Banking and Commerce, 21(S3), 2 – 23.
Manuylenko, V.V. and Kabardakova L.A. 2017. Software for determining strategic target
structure of financial resources in commercial corporate organizations (computer
software): Author’s License (RF). No. 2017613287.
On the State Program for Development of Agriculture and Regulation of Agricultural
Markets, Markets for Raw Materials and Food 2013-2020: Regulation of the
Russian Federation Government as of July 14, 2012 No. 717. www.consultant.ru.
Official site of "Russkaya Mobile Machinery Station", LLC. Internet site. Retrieved
14.02.2017 http://pmk.soap.web-n-roll.ru.
Official site of "Wines of Prikumye, 2000", LLC. Internet site. Retrieved 14.02.2017
http://vinaprikum.ru.
Official site of the Federal State Statistics Service for the Stavropol Territory. Retrieved
14.02.2017 http://stavstat.gks.ru.
Principles of corporate governance G20 / OECD. Retrieved 14.02.2017 www. Oecd.org
Rusetskaja, E.A., Rusetskiy, M.G., Rybina, G.K. and Chuvilova, O.N. 2016). Insurance
fraud: Factors, identification problems, counteraction. The Socia l Sc iences ,
11(5) , 579–584.
Tyapkina, M.F., Mongush, Yu.D. and Akimova, I.O. 2014. Study of indicators for country’s
cyclical economic development. Russian Entrepreneurship Journal, 24 (270), 4 - 14.