METHODOLOGICAL APPROACH TO STRATEGIC …METHODOLOGICAL APPROACH TO STRATEGIC PERFORMANCE...
22
METHODOLOGICAL APPROACH TO STRATEGIC PERFORMANCE OPTIMIZATION Marko Hell * Stjepan Vidačić ** Željko Garača *** Received: 14. 07. 2009 Preliminary communication Accepted: 15. 10. 2009 UDC 65.012.4 This paper 1 presents a matrix approach to the measuring and optimization of organizational strategic performance. The proposed model is based on the matrix presentation of strategic performance, which follows the theoretical notions of the balanced scorecard (BSC) and strategy map methodologies, initially developed by Kaplan and Norton. Development of a quantitative record of strategic objectives provides an arena for the application of linear programming (LP), which is a mathematical technique for the optimization of linear objective functions. It is believed that the development and mathematical validation of such an algorithm opens new venues for future research in the quantitative approach to strategic management, as well as provides opportunities for the development of decision- making tools related to the optimization of strategic performance. 1. INTRODUCTION There are two groups of authors who disagree in the interpretation of at least one aspect of the strategy (Weihrich & Koontz, 1998). One group of * Marko Hell, PhD, Faculty of Economics, University of Split, Matice hrvatske 31, 21000 Split, Croatia; Phone: +38521430716; Fax: +38521430701; e-mail: [email protected] ** Stjepan Vidačić, PhD, Faculty of organization and informatics, Pavlinska 2, 42000 Varaždin, Croatia; Phone: +38542390800; Fax:+385213413; e-mail:[email protected] *** Željko Garača, PhD, Faculty of Economics, University of Split, Matice hrvatske 31, 21000 Split, Croatia; Phone: +38521430654; Fax: +38521430701; e-mail: [email protected] 1 First version of this paper is presented at the 23 rd European Conference on Operational Research. Its abstract has been published as: Hell, M.; Vidačić, S.; Garača, Ž. (2009): Matrix Approach to Enterprise Performance Optimization, Book of abstracts of 23rd European Conference on Operational Research, Bonn, July 5 – 8, p. 136. Authors would like to express their gratitude to the participants of the conference for useful suggestions. 21
Transcript of METHODOLOGICAL APPROACH TO STRATEGIC …METHODOLOGICAL APPROACH TO STRATEGIC PERFORMANCE...
METHODOLOGICAL APPROACH TO STRATEGIC PERFORMANCE OPTIMIZATION
Marko Hell*
Stjepan Vidačić** Željko Garača***
Received: 14. 07. 2009 Preliminary communication Accepted: 15. 10. 2009 UDC 65.012.4
This paper1 presents a matrix approach to the measuring and optimization of organizational strategic performance. The proposed model is based on the matrix presentation of strategic performance, which follows the theoretical notions of the balanced scorecard (BSC) and strategy map methodologies, initially developed by Kaplan and Norton. Development of a quantitative record of strategic objectives provides an arena for the application of linear programming (LP), which is a mathematical technique for the optimization of linear objective functions. It is believed that the development and mathematical validation of such an algorithm opens new venues for future research in the quantitative approach to strategic management, as well as provides opportunities for the development of decision-making tools related to the optimization of strategic performance.
1. INTRODUCTION There are two groups of authors who disagree in the interpretation of at
least one aspect of the strategy (Weihrich & Koontz, 1998). One group of
* Marko Hell, PhD, Faculty of Economics, University of Split, Matice hrvatske 31, 21000 Split,
Croatia; Phone: +38521430716; Fax: +38521430701; e-mail: [email protected] ** Stjepan Vidačić, PhD, Faculty of organization and informatics, Pavlinska 2, 42000 Varaždin,
Croatia; Phone: +38542390800; Fax:+385213413; e-mail:[email protected] *** Željko Garača, PhD, Faculty of Economics, University of Split, Matice hrvatske 31, 21000
Split, Croatia; Phone: +38521430654; Fax: +38521430701; e-mail: [email protected] 1 First version of this paper is presented at the 23rd European Conference on Operational
Research. Its abstract has been published as: Hell, M.; Vidačić, S.; Garača, Ž. (2009): Matrix Approach to Enterprise Performance Optimization, Book of abstracts of 23rd European Conference on Operational Research, Bonn, July 5 – 8, p. 136. Authors would like to express their gratitude to the participants of the conference for useful suggestions.
21
Management, Vol. 14, 2009, 2, pp. 21-42 M. Hell, S. Vidačić, Ž. Garača: Approach to strategic performance optimization
22
authors sees the concept of strategy as the endpoints (purpose, mission, goals) and means of achieving them (policies and plans). The other group puts more emphasis on the means of achieving the endpoints than on the endpoints themselves.
The importance of some methods and techniques which are used in the
process of strategic planning is explained by Stacey (1997), who uses the term traditional wisdom to imply the whole range of recommendations and explanations for a successful implementation of strategic management suggested by most managers and consultants.
Balance on the behaviour patterns is characterised by predictability,
regularity, consistency and harmony. An organisation in the condition of stable balance follows a predictable route which hides no surprises (Stacey, 1997). In that sense, one of the important prerequisites for success is the adaptation of an organisation to its environment. Namely, unless an organisation gains understanding of its future environment, it will not be able to plan its own position. Gaining proper understanding of the future state of the environment enables the forecasting of strategic alternatives, as well as the goals and actions necessary for their implementation. Possible alternatives become the strategic options of an organisation, out of which the strategy is selected by using the criteria of acceptability, feasibility, and adequacy.
Strategic management evolved from strategic planning, whereas the latter
focuses on developing and implementation plans (Berman, 2006). The most relevant factor in the system of values within an organisation is a clear and concise mission of the organisation. Such a mission represents the main orientation of an organisation. As such, the mission is a means of communication within an organisation and its environment.
According to the already defined mission, it is necessary to define the
future course of development of the organisation, i.e. the vision of the organization. Implementation of the vision is formalized through development strategies of the organisation. "Strategy is the determination of the basic long-term goals and objectives of an enterprise, and the adoption of course of action and the allocation of resources necessary for carrying out goals" (Chandler; 1962). In this paper, the term strategy will refer to decision-making on the allocation and use of overall resources of the organisation (Brumec, 1997). In this context, the strategic planning represents the process of adjusting the organisation's resources with the factors from the environment (ibid). Based on
Management, Vol. 14, 2009, 2, pp. 21-42 M. Hell, S. Vidačić, Ž. Garača: Approach to strategic performance optimization
the required process of adjusting the organisation's resources with the factors from the environment, necessary activities are defined.
Implementation of the strategic plan is based on the accomplishment of the
planned activities. Each activity contributes to the accomplishment of a certain strategic objective of the organisation. By carrying out the activities, the organisation should, within a period of time in the future, accomplish the transformation from the current performance (As is) to the future performance (To be). The strategic plan has to answer on four questions which can be shown by the formula (1.1), which reflects the essence of classical strategic formulation (Chandler, 1962):
Strategic plan= f (what, who, how, when) (1.1) It can be said that a strategic plan is a formal representation of a strategy,
which is traditionally defined in terms of future actions necessary for accomplishing the strategic goals. Such a plan needs to answer the following four questions:
• What has to be achieved? By answering this question, a series of necessary activities required for attaining the set goal are described. Expediency of each of the activities has to be explained.
• Who is responsible? The answer to this question defines the human resources and their responsibilities in conducting the planned activities.
• How can we achieve it? The existent and new resources required for accomplishing the desired goal.
• When do we want to achieve it? A broad timetable for conducting the activities, i.e. the time set for their realisation.
It is exactly this action driven formulation of strategic planning that creates prerequisites for a continuous control and management of strategy achievement, which should contribute to the higher quality of the development of organisation. The dynamic environment, in which the organisation operates, changes during the planned activities or when they are postponed. Therefore, the ability to continuously adjust the strategic plan with new conditions represents the prerequisite for the successful accomplishment of strategic objectives. Accomplishment of strategic objectives can be measured by an organization's performance. For many managers, performance is not only about doing the right thing; it is also about doing the practical thing (Berman, 2006). Performance management provides monitoring of the effects of unexpected changes or unaccomplished strategic goals.
23

Management, Vol. 14, 2009, 2, pp. 21-42 M. Hell, S. Vidačić, Ž. Garača: Approach to strategic performance optimization
24
Balanced Scorecard methodology (BSC) is a popular approach to the balanced view on the organisation's performance. It was originally developed by Kaplan and Norton (1996) in order to enable organisations to define their development strategies, as well as to observe the success of the strategies' implementation (Lee, 2000). Development of the BSC is based on the empirical experience of the large number of organisations in order to avoid disadvantages of measuring effectiveness only by financial indicators.
The BSC suggests the so-called "balanced score system" which observes
the overall success of the organisation through four different perspectives (Niven, 2002): financial, customer, internal business processes and learning/growth. Financial success is measured by traditional indicators, such as: profit, gross margin, net income, increase of sales and so on. Performance achieved in the customer relations perspective is determined by analysing the actions which are supposed to be undertaken in order to keep the current and attract the future customers. After analysing the results of the conducted surveys, customer loyalty and satisfaction are measured by different indicators, such as the ratio between the lost and attracted customers. Performance in the context of internal business processes represents the effectiveness of the overall organisation of activities. It is assessed by transaction costs, stockouts, customer database availability, labour utilization rates and so on. Objectives which are supposed to be achieved in this segment of measuring have to be complied with the enhancement of efficiency of the business processes within an organisation. Learning, growth and development enable the intelligent adjustment of the organisation to the changing environment and, in that way, ensure future success. This perspective is usually measured by the number of production, technological and business innovations, new products and services, etc.
It is the BSC that helps to determine the procedures for "turning the vision
and strategy into real steps" (Bernroider, 2002). The requirement to take into consideration the external environment and the future trends of its development is self-imposing. However, the critics of BSC (Henk, Oorschot, 2002) indicate the lack of orientation toward competition. This means that more emphasis is placed on measuring the strategic effectiveness than on the importance of strategic decisions (Lee & Andrew, 2000). Further criticism of BSC refers to the modelling of cause-and-effect relations. Oversimplification of the one-way causality is indicated as a drawback (Henk & Oorschot, 2002). In the real world, one-way causality is a rare phenomenon. Its simplification is related to time delays and feedback effects, which are not included into the model. Although BSC does distinguish between the cause and consequence

Management, Vol. 14, 2009, 2, pp. 21-42 M. Hell, S. Vidačić, Ž. Garača: Approach to strategic performance optimization
terminologically, it does not fully consider the time distance between the two (ibid).
In this paper, a novel approach is used to enhance the BSC methodology in
planning the optimal targets of performance, in order to maximise the organizational effectiveness.
2. QUANTITATIVE APPROACH TO STRATEGIC
PERFORMANCE Measuring effectiveness means determining the effects achieved by
undertaking the activity which aims at a certain objective. The measurement system, as a support to the strategic decision-making, is not static. It is necessary to design it according to the strategic objectives of the organisation. That is why, due to the frequency, measuring is done periodically or continuously.
The purpose of this paper is to introduce a quantitative methodology for the
assessment, evaluation and optimization of an organization's strategic performance, based on the mathematical representation of the four performance dimensions, suggested by the BSC model. In addition, the subsequent concept of a strategy map, developed by Kaplan and Norton (1996), is used to describe both the influence of the individual performance dimension to the overall organizational performance, as well as the influence of the interdependencies/interactions (cause-consequence links) among the performance dimensions themselves to the overall performance. Although the original strategy map model is a very appropriate way to illustrate strategy and the dynamics of its implementation, it is believed that the formulation and validation of a relevant quantitative model of the strategic performance and the processes/interactions, leading to its development, could be an interesting contribution to the field.
Using the matrix algebra in the effectiveness calculation enables the
simplicity, speed and transparency of the performance calculation, which could have a useful practical application in the course of the strategic management process, based on the proposed quantitative model of strategic performance. Exactly these features form the basis of the success of each strategic management system. However, implementation of the matrix algebra requires a high level of formalisation. In Figure 1, the procedure of formalising the strategic performance assessment/intervention system, starting from the "top
25

Management, Vol. 14, 2009, 2, pp. 21-42 M. Hell, S. Vidačić, Ž. Garača: Approach to strategic performance optimization
26
level", i.e. the quantitatively expressed vision in the strictly formalised record of matrix and vectors, is graphically represented.
2.1. Quantitative modelling of strategic performance A qualitatively described vision (shown by the bubble on the top of the
figure) is transformed into descriptively and quantitatively determined set objectives2(SO). For every set objective, it is necessary to determine derived objectives (DO) which will enable its accomplishment. The procedure of deriving the DO requires forming judgments and strategies. The group of activities is derived from the strategy and can be seen as the expansion of a descriptive part of the DO3. SO and DO contain descriptive and numerical semantic elements.
Figure 1. Procedure for quantitative modelling of strategic performance
The structure of strategy depends on the cause-consequence structure of the objectives. Namely, it is logical to expect that there are influences among certain activities in the real system. It means that undertaking one activity can have an influence on the effect of the other activity. Since every activity is 2 Set strategic goals are derived from the vision which is why they are named set strategic goals. 3 This results from the fact that every activity is undertaken with the particular goal (1:1). Unlike
activities, more strategies can be accomplished through one activity (m:1).

Management, Vol. 14, 2009, 2, pp. 21-42 M. Hell, S. Vidačić, Ž. Garača: Approach to strategic performance optimization
undertaken with a precisely set objective, it can be concluded that the structure of objectives is the same as the structure of activities. A chain of interconnected objectives (interactions among the individual performance dimensions/measures) in the context of this paper is called the causes-consequences chain (CCC).
Thus, the next step is taken in order to establish direct relationships among
all strategic objectives. The possibility of processing a large number of objectives demands a systematic approach to determine relationships among strategic objectives which is achievable by using a table. In order to achieve transparency, the symbols for objectives are copied in the title column of the table. Afterwards, following the same order of the title column, symbols are copied in the title row of the same table. Now, the table can be filled. Depending on the existence of a direct relationship among objectives, the elements in the table can be assigned the values of 1 or 0. If there is a direct influence from the objective in the row to the objective in the column, the value 1 is entered. If not, the value 0 is entered. Each cell in the table is supposed to be filled in this way.
If title rows and columns are exchanged with the index of the table
element, the filled table can be seen as a matrix of the objectives’ influence. This matrix is named the matrix of objectives' structure (MOS). In this way, formal prerequisites for using the matrix algebra to measure the organisation’s effectiveness are met. MOS is the matrix presentation of all CCCs between the objectives’, i.e. it represents the strategy in a matrix form.
Level of the objective’s accomplishment is expressed by its own
performance. This means that if there is a cause-consequence link on the semantical level of analysing the objectives, it is supposed that a link exists among performances as well. The CCCs of performances are determined according to the CCC of objectives. In order to be able to measure the effectiveness of an organisation as a whole, it is necessary to take into consideration all cause-consequence links which exist among performances. The coefficient of the influence a "causal" performance has on the "consequence" performance has to be taken into consideration as well. The coefficient of influence indicates a ponder by which the value of one performance influences the value of the other. It can gain the value from the segment [0,1]. One can presume, without reducing generalisation, that the values of the coefficient equal 0 for the performance among which, according to the CCC, there is no influence.
27
Management, Vol. 14, 2009, 2, pp. 21-42 M. Hell, S. Vidačić, Ž. Garača: Approach to strategic performance optimization
28
Defining the CCC depends on the effects whose accomplishment is measured at the end of the planned strategic period. Due to the strategic management, the measured values are compared with a target value generated by the model of strategic effectiveness.
This provides a structural explanation of the basic postulates of measuring
the effects between objectives. In the next step, the formal mathematical method, used to calculate the organizational effectiveness, will be presented. In the context of measuring effectiveness, the structure of performance may observe by the objectives’ structure. The matrix of the objectives’ structure is shown by the expression (2.2).
According to the previous procedure (Figure 1.1.), the set objectives l are
determined and the derived objectives k are derived. SOs and DOs gained through such a procedure represent elements of the final set of all strategic objectives of the organisation, which can be presented by the following expression (2.1)
C~ = {C1, C2,..., Cn} , n=k+l (2.1)
In the following step, direct influence among objectives can be presented in the strict mathematical form of a square matrix:
⎥⎥⎥⎥
⎦
⎤
⎢⎢⎢⎢
⎣
⎡
=
0
00
321
22321
11312
L
MMMM
L
L
nnn
n
n
ccc
cccccc
MOS . (2.2)
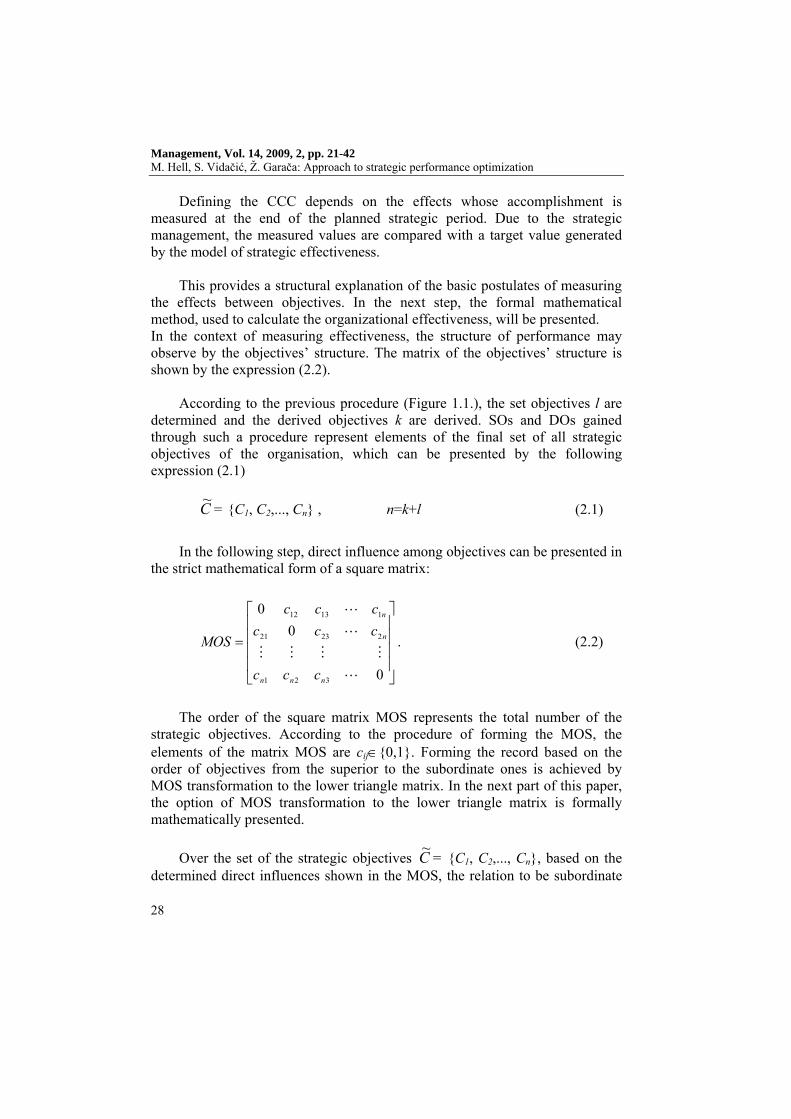
The order of the square matrix MOS represents the total number of the
strategic objectives. According to the procedure of forming the MOS, the elements of the matrix MOS are cij∈{0,1}. Forming the record based on the order of objectives from the superior to the subordinate ones is achieved by MOS transformation to the lower triangle matrix. In the next part of this paper, the option of MOS transformation to the lower triangle matrix is formally mathematically presented.
Over the set of the strategic objectives C = {C1, C2,..., Cn}, based on the
determined direct influences shown in the MOS, the relation to be subordinate
~

Management, Vol. 14, 2009, 2, pp. 21-42 M. Hell, S. Vidačić, Ž. Garača: Approach to strategic performance optimization
(BS) is determined. Furthermore, the objectives X, Y, Z ∈C~ are randomly chosen fromC~ . Based on the BSC concept, it is to be concluded that, if the element X is a subordinate to the objective Y, Y is then not a subordinate to the element X, i.e.
X BS Y ⇒ Y BS X. (2.3)
Therefore, it can be concluded that the relation BS is asymmetric. For the relation BS defined in such a way, it is possible to determine a property of transitiveness, as well, i.e.
Z BS X and X BS Y ⇒ Z BS Y. (2.4)
The asymmetric (2.3) and transitive (2.4) relation is called the partial order relation. Therefore, the defined relation BS is the partial order relation.
Another important type of relation in the set C~ is a relation of the total
order. The total order relation "<" is the partial order relation in which every two elements X and Y are comparable, i.e.
X<Y or Y<X (2.5)
An important mathematical theorem says that every partial order relation can be expanded to the total order relation. Therefore, the relation BS can be expanded to the total order relation "<". Without reducing the generalisation, it can be assumed that
C1< C2<...< Cn. (2.6)
In order to prove that in this order of objectives Ci, the matrix MOS is a lower triangular matrix, the opposite is assumed, i.e. it is assumed that cij>0, for some j>i. This would result in the fact that the part Ci is subordinate to the part Cj, that is: Ci BS Cj, but then Ci < Cj as well which contradicts Cj< Ci (as a result from (2.6).
This proves the possibility of MOS transformation to the lower triangle
matrix. By transforming it to the lower triangle matrix, transparency of direct objectives has been achieved. In this way, the expression (2.2) is formulated. It efines the net structure of influences among the objectives. By analysing the columns in the matrix MOS, it is quite easy to identify direct relations between
29

Management, Vol. 14, 2009, 2, pp. 21-42 M. Hell, S. Vidačić, Ž. Garača: Approach to strategic performance optimization
30
superior objectives presented in the column and its subordinate objective presented in the row. The value of the element, which is located on the intersection of the observed row and column, identifies the (non)existence of direct influence between objectives which are presented in the row and the column. The objective of each CCC, which is at the beginning, is not influenced by the accomplishment of any other objective. That is why the elements of the column of the initial objectives equal null.
Consequently, the elements of the row of the last objective in each CCC
equal null because they cannot influence any other objective. In this way, by analysing the MOS, it is easy to determine which of the objectives positioned lower can cause the consequent change of the accomplishment level of their superior objectives and which would those superior objectives be. If the initial and target objectives of all CCC are left out from the MOS, the submatrix is gained, which is, by undergoing the same procedure, given the initial and target objectives of the “shortened” CCC. The determined objectives belong to the first lower i.e. higher level of the CCC structure.
2.1. Performance measures structure matrix
As it has already been said, the level of the accomplishment of an objective is measured by organizational performance. Thus, each aspect of organizational performance needs to be adequately measured. All measures are included in the strategic map of performance measures, which follows the structure and logic of the initial strategic map, proposed by Kaplan and Norton (1996). The strategic map of measures is the structural equivalent to the strategic map of objectives. According to the BSC, the logical basis for its construction is drawn from the hypothesis that the level of accomplishment of each objective is measured during a particular period of time and that the measured values are compared, in order to determine whether the activities that have been carried out have made the expected effect.
While defining objectives and their measures and while determining “AS
IS" and "TO BE" values, the range of the change of a measure is set. The defined range of the measure enables the calculation of the relative change of the measure. The relative change of the measure of the objective Cj during the observed period of the strategic cycles is calculated according to the expression (2.7):
( ) ( )( ) ( )0
0
jj
jjjR mCTmC
mCtmCCm
−
−= ; j=1,...,n; t∈[0,T], (2.7)

Management, Vol. 14, 2009, 2, pp. 21-42 M. Hell, S. Vidačić, Ž. Garača: Approach to strategic performance optimization
where: n … number of the objectives, mRCj … relative measure of the objective Cj, mCj(0) … initial value of the measure of the objective Cj, mCj(t) … current value of the measure of the objective Cj at the end of the observed period, mCj(T) … expected value of the measure of the objective Cj at the end of the strategic cycles with the time T. The relative change calculated in this way can occur in the segment [0,1].
Since every activity is carried out with a certain objective, measures are
derived from the objectives and activities required for their implementation. Accomplishment of a particular objective is measured by measure. According to the importance of the measure, its measure unit has been defined. Some measures can be quantified without dimension as, for instance, the proportion of two values of the same kind. This enables the quantification of the initial, current and expected level of the accomplishment of a certain objective. By determining the initial and expected level of the accomplishment of a particular objective, the range of values, which a measure can have, is defined. In order to avoid the problem of different measure units (for different objectives), while calculating the efficiency of the organisation, the relative values are used. Based on these relative values, the absolute values are calculated in accordance with the expression (2.7).
In order to calculate the effect of the accomplishment of certain objectives
on the accomplishment of other objectives, the coefficients of influence have been derived. The coefficients of influence indicate the weight with which the value of one measure influences the value of the other. The value of change of a measure of a consequent objective equals the sum of the product of change of a measure of causal objectives and their coefficients of influence.
The initial coefficients of influence can be derived from the MOS so that
the MOS is the norm according to the columns based on the expression (2.8).
31
Management, Vol. 14, 2009, 2, pp. 21-42 M. Hell, S. Vidačić, Ž. Garača: Approach to strategic performance optimization
32
⎪⎪
⎩
⎪⎪
⎨
⎧
=
≠
=
∑
∑∑
=
=
=
00
0
1
1
1n
iij
n
iijn
iij
ij
ij
cza
czac
c
k (2.8).
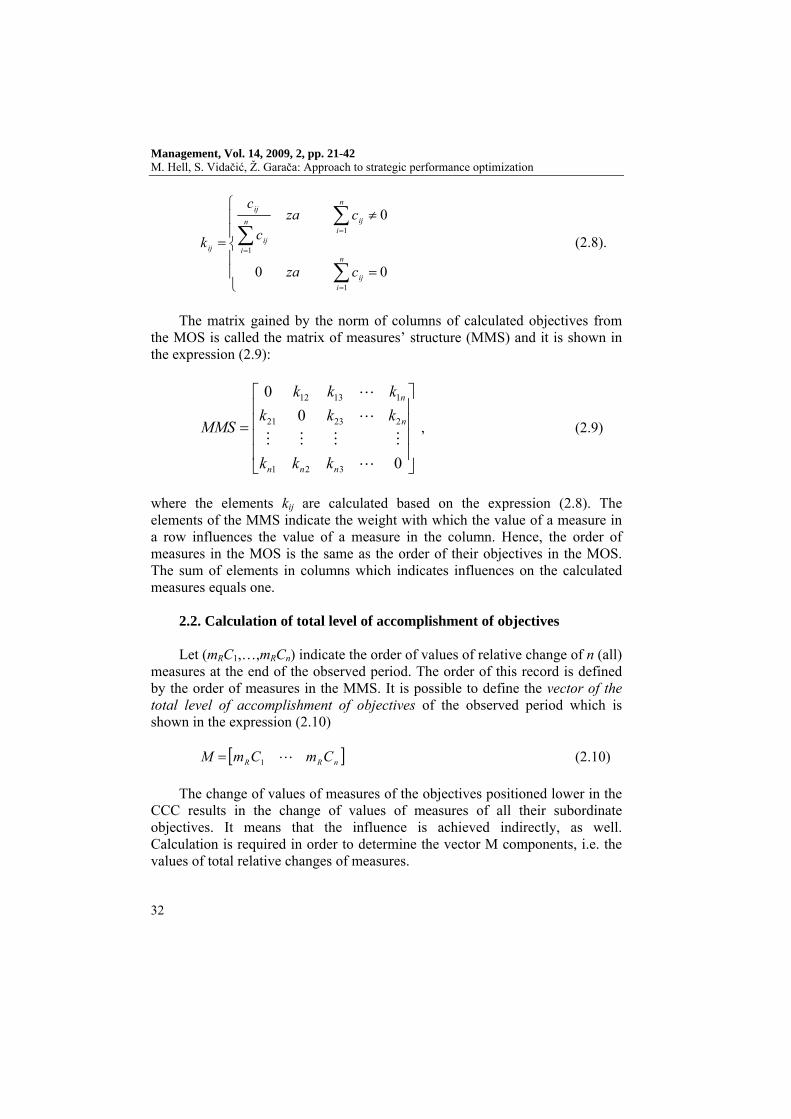
The matrix gained by the norm of columns of calculated objectives from
the MOS is called the matrix of measures’ structure (MMS) and it is shown in the expression (2.9):
⎥⎥⎥⎥
⎦
⎤
⎢⎢⎢⎢
⎣
⎡
=
0
00
321
22321
11312
L
MMMM
L
L
nnn
n
n
kkk
kkkkkk
MMS , (2.9)
where the elements kij are calculated based on the expression (2.8). The elements of the MMS indicate the weight with which the value of a measure in a row influences the value of a measure in the column. Hence, the order of measures in the MOS is the same as the order of their objectives in the MOS. The sum of elements in columns which indicates influences on the calculated measures equals one.
2.2. Calculation of total level of accomplishment of objectives Let (mRC1,…,mRCn) indicate the order of values of relative change of n (all)
measures at the end of the observed period. The order of this record is defined by the order of measures in the MMS. It is possible to define the vector of the total level of accomplishment of objectives of the observed period which is shown in the expression (2.10)
[ nRR CmCmM L1= ] (2.10)
The change of values of measures of the objectives positioned lower in the
CCC results in the change of values of measures of all their subordinate objectives. It means that the influence is achieved indirectly, as well. Calculation is required in order to determine the vector M components, i.e. the values of total relative changes of measures.

Management, Vol. 14, 2009, 2, pp. 21-42 M. Hell, S. Vidačić, Ž. Garača: Approach to strategic performance optimization
Calculation of total values of measures can be divided into m–1 steps, where m stands for the number of the longest CCC. Partial values of every step Mi are the consequence of direct influences. In order to deal with the lack of direct influence between two objectives in the MMS, values of the coefficient of influence equal null.
In accordance with the BSC concept, values of measures at the beginning
of the CCC are not calculated. They are “taken” from the system and entered into the model. That is why they are called registered measures. Vector M0 indicates the vector of diagnosed values of measures without calculation. Values of the calculated measures in vector M0 equal null.
It is possible to calculate the partial values of measures Mi+1 as a sum of the
product of accomplished partial values of causal measures (component of vector Mi) and their coefficients of influences (elements MMS), i.e. for all objectives, by using the matrix calculation (2.11):
Mi ⋅ MMS =Mi+1, (2.11)
i.e.
[ ] [ 111
321
22321
11312
1
0
00
++=
⎥⎥⎥⎥
⎦
⎤
⎢⎢⎢⎢
⎣
⎡
⋅ inR
iR
nnn
n
n
inR
iR CmCm
kkk
kkkkkk
CmCm L
L
MMMM
L
L
L ]. (2.12)
The total value of the accomplishment of objectives, expressed by the
vector M, equals the sum of partial values of measures Mi, of all steps i.e. for an indefinite number of objectives:
M = M0 + M1 +⋅⋅⋅+ Mm–1+⋅⋅⋅. (2.13)
If (2.11) is included in (2.13), the expression (2.14) is formulated as follows:
M = M0 + M0 ⋅ MSM +⋅⋅⋅+ M0 ⋅ MMSm–1+⋅⋅⋅. (2.14)
The elements of i-th power of the MMS indicate the intensity of the i-th indirect influence by which the values of the registered measures influence the values of the calculated measures. By multiplying M0 with the i-th power of the MMS, one gets the values of measures as a consequence of the i indirect
33

Management, Vol. 14, 2009, 2, pp. 21-42 M. Hell, S. Vidačić, Ž. Garača: Approach to strategic performance optimization
34
influence. It is possible to calculate the total relative change of measures based on M0 and determined direct influences, instead of calculating the sum of partial values of measures.
Extracting of the vector M0 in the expression (2.14), the expression
(2.15) is formulated as follows:
M = M0 ⋅(I+ MMS +⋅⋅⋅+ MMSm–1+⋅⋅⋅). (2.15)
According to the sum of the infinite order4:
M=M0⋅(I – MMS)-1. (2.16)
The expression which is multiplied by the vector M0 in the formula (2.16):
MSI=(I – MMS)-1, (2.17)
is called the matrix of the sum of influence (MSI) and is used for calculating vectors of the total level of accomplishment of objectives based on the accomplished values of registered measures in accordance with the expression (2.18):
M=M0⋅MSI. (2.18)
This defines the procedure of calculating the level of accomplishment of objectives through which the effectiveness of an organisation is observed. 3. OPTIMIZATION OF AN ORGANISATION’S EFFECTIVENESS
BY USING LINEAR PROGRAMMING
The classical BSC concept, in the phase of planning the effects, includes the implementation of determined activities. However, in the real system,
4 converges and has the sum
, if all n2 order converges∑ , where indicates the element in i row and
j column of the matrix (r times). As already indicated, the elements of m power of the matrix MMS indicate the intensity of the m indirect influence with which the values of registrated measures have an influence on the values of the calculated measures. Hence, each of the n2 elements of the matrix aims at null if m→∞, i.e. matrix MMSm converges towards null matrix.
LL ++++++ mMMSMMSMMSMMSI 32
( ) 1−− MMSI∞
=1r
rijk k
MMSMMSMMS r ⋅⋅⋅= L
rij
MMS

Management, Vol. 14, 2009, 2, pp. 21-42 M. Hell, S. Vidačić, Ž. Garača: Approach to strategic performance optimization
implementing the activities can depend on various limitations. That is why it is necessary to adjust an expected level of accomplishment of objectives to the potential limitations. The concept of the strategic management shown in the paper emphasised two types of limitations.
3.1. Limitations due to available resources
The classical type of limitation to accomplish the expected level of
accomplishment of objectives is the availability of resources for implementing activities by which these objectives can be achieved. That is why it is necessary to establish required strategic resources for its implementation. One type of resource can be used in more than one activity. In order to include all necessary resources, their illustrations have been formalised by using the matrix of resources.
The nature of each activity indicates the required resources for its
implementation. By determining the accompanied DOs, the measures and the range of changes have been clearly defined, which should be accomplished by the implementation of the planned activities. This means that all necessary resources can be generated from the activities and DOs. The index of elements in the matrix of resources is defined by the row DO from the MOS and by the column of the required resources. Their values indicate the required allocation of resources for the 100% level of accomplishment of DOs, which require the implementation of the observed activity. After all the required resources for implementation of the observed activity have been determined, the next activity is considered i.e. the new line in the matrix of activities and DOs.
k-th DO is determined and the activities for their accomplishment as well
as l-th SO. Furthermore, M is the vector of the total level of accomplishment of objectives and it is defined by the expression (2.18). MR is the symbol for the matrix of resources type n×r. The elements of the first k lines define the required quantity of the j resources, j=1,...,r, in the i activity, i=1,...,k. represent the required resources for the accomplishment of SOs. Since SOs are achieved only by accomplishing DOs, the elements of the last l row of its matrix equals null.
The last line from the matrix of resources which indicates the available
quantity of resources is represented by the vector R. It is then possible to define the limitation caused by available resources by the matrix inequality
M⋅MR≤R, (3.1)
35

Management, Vol. 14, 2009, 2, pp. 21-42 M. Hell, S. Vidačić, Ž. Garača: Approach to strategic performance optimization
36
]
i.e.
. (3.2) [ ] [ rkrkkk
r
r
nRR RRrrrr
rrrrrrrr
CmCm L
L
MMMM
L
L
MMMM
L
L
L 1321
2231221
1131211
1
0000
0000≤
⎥⎥⎥⎥⎥⎥⎥⎥⎥
⎦
⎤
⎢⎢⎢⎢⎢⎢⎢⎢⎢
⎣
⎡
⋅
After multiplying the matrices, a system of inequations is gained, defined
by the expression (3.3)
⎪⎪⎪
⎩
⎪⎪⎪
⎨
⎧
≤⋅++⋅
≤⋅⋅
≤⋅++⋅
rkRkrRr
kRkR
kRkR
RCmrCmr
RCmrCmr
RCmrCmr
11
22112
11111
MMM
L
. (3.3)
Each inequation in expression (3.3) indicates limitation caused by the
availability of a particular resource. This defines and mathematically formalises the set of limitations over the total level of accomplishment of DO, based on the availability of resources.
3.1. Limitations caused by structure of measures The next type of limitation is caused by the strategy structure. It is a
consequence of influences that occur between values of measures. The level of accomplishment of the objectives positioned lower is a prerequisite for the accomplishment of the effect of activities, which are carried out as a purpose of their superior objectives. Coefficients of the influence of measures have been derived and defined by the expressions (2.8) and (2.9). The vector of the total level of accomplishment of n objectives is defined by the expression (2.18).
Let the n be the order of the MMS, in which there are i columns whose
values equal null.This means that there is n−i of calculated measures. This

Management, Vol. 14, 2009, 2, pp. 21-42 M. Hell, S. Vidačić, Ž. Garača: Approach to strategic performance optimization
results in the existence of n−i limitations, which can be defined by the system of inequations (3.4):
⎪⎪⎩
⎪⎪⎨
⎧
≥⋅+⋅−
≥⋅+⋅+⋅−≥⋅+⋅+⋅+⋅−
−
−
−
01
0101
2
222
112211
nRninR
nRninRiR
nRninRiRR
CmkCm
CmkCmkCmCmkCmkCmkCm
L
MMM
LL
LL
. (3.4)
The system of inequations (3.4) includes n−i inequations, with each of
them indicating one limitation to the calculated measure. The number of unknowns equals the total number of measures n. Coefficients kij for i≠j have been taken from the MOS.
The calculation performed by using the relative measures in the given
concept imposes both a prerequisite of inequality and maximum value of a measure for all strategic objectives, i.e.
0 ≤ mRCi ≤1, ∀ i=1,...,n. (3.5)
In this way, all the limitations have been included into the procedure for determining the optimal strategy.
3.2. Optimisation of the total level of accomplishment of objectives The basic feature of the approach to development of the presented model is
that an organisation should be observed as a holistic system. It means that the accomplishment of strategic objectives should not be observed partially, but in the context of accomplishment of set strategic objectives. Such an approach indicates that the maximum accomplishment of all DOs is not always optimal. Determining the optimal level of accomplishment of strategic objectives represents a problem which can be solved by using linear programming.
The problem of linear programming can generally be the problem of the
maximum or the problem of the minimum. The nature of the analysed problem belongs to the problem of the maximum of the linear programming. Namely, taking into consideration limitations caused by available resources and determined structure of objectives, it is necessary to find the optimal level of accomplishment of derived strategic objectives, in order to maximise the level of accomplishment of set strategic objectives.
37

Management, Vol. 14, 2009, 2, pp. 21-42 M. Hell, S. Vidačić, Ž. Garača: Approach to strategic performance optimization
38
l-th SO is determined. A function which requires a set maximum i.e. the function of an objective is defined by the expression (3.6)
⎟⎟⎠
⎞⎜⎜⎝
⎛⋅∑
=
l
jjRSSGm
lMax
1
1. (3.6)
In this way, the following elements have been determined: • functions of an objective, defined by the expression (3.6), • limitations caused by availability of resources, defined by the
expression (3.3), • limitations caused by the structure of objectives, defined by the
expression (3.4), • prerequisite of non-negativity and maximum value of measures,
defined by the expression (3.5), The observed problem includes all required elements for implementation of
the linear programming in order to define the optimal strategy. The obtained result indicates the required levels of accomplishment of all DOs, which then imply the maximum level of accomplishment of SOs. By multiplying the optimised values of measures with MR, it is possible to calculate the total resources used, according to the particular activity.
It is necessary to emphasise that the concept starts from the hypothesised
influences among the objectives. Based on the measurements performed, a different relation among objectives can occur. It can also change the structure of strategy and, at the same time, the limitations caused by it. In this case, it is necessary to re-examine the limitations and repeat the procedure of optimisation.
3.3. Assessment of satisfaction with the level of accomplishment of
objectives While defining the strategic objectives, the management determines the
initial “AS IS” level and predicts the expected values of the future “TO BE” level of accomplishment of objectives. Implementation of matrix algebra in the calculation organisational effectiveness implies using the relative values of measures. Changing the relative values of measures into the absolute ones and vice versa is made simply by using the formula (2.7). In this way, it is possible to express relative values through absolute values which, besides its value,
Management, Vol. 14, 2009, 2, pp. 21-42 M. Hell, S. Vidačić, Ž. Garača: Approach to strategic performance optimization
include the measure units as well. Further analysis of the results, due to the consistent illustration, is based on the relative values of measures.
As it has already been said that the relative values of measures need to
belong to the segment [0,1]. If a measure has values which do not belong to this segment, it is necessary to analyse what is the cause of such an event. Satisfaction with the level of accomplishment of objectives is estimated based on the achieved values of measures. Accordingly, management makes decisions related to future activities.
While using this model for conducting the activities of strategic
management, the achieved values of registered measures are being defined. They are being defined during the strategic cycles. Values of calculated measures are calculated based on the previously described matrix model. Assessment of satisfaction with the level of accomplishment of objectives can be simply measured: by using the concepts of unsatisfactory performance (red), satisfactory performance (yellow) and planned (expected) performance (green). In order to be able to classify the value of a measure in one of the above mentioned areas, it is necessary to determine four limit values. Hence, limit values are the values within which achieved and calculated values of measures are expected to occur.
Relative values of all measures, at the beginning of the strategic cycles,
equal null. This means that the relative value of a measure, which equals null, indicates that change has not been achieved. Therefore, a lower limit (D) of unsatisfactory performance for each measure, expressed through relative value, equals null. Relative value of the measure that equals 1 indicates that change has been fully achieved. Therefore, the upper limit (G) is the best expected value of a measure and for each measure, expressed through the relative value, it amounts 1.
The previously described procedure of the optimisation of expected values
of measures is adapted to limitations from the real system. Hence, it is logical that the lower limit of expected satisfaction is influenced by real possibilities of the accomplishment of objectives. This would mean that each level of the accomplishment of objectives that exceeds real possibilities represents an expected condition.
According to the classical BSC concept, the limit between the
unsatisfactory and satisfactory performance is intuitively determined by management, while referring to the predicted satisfaction of the owner. In this
39
Management, Vol. 14, 2009, 2, pp. 21-42 M. Hell, S. Vidačić, Ž. Garača: Approach to strategic performance optimization
40
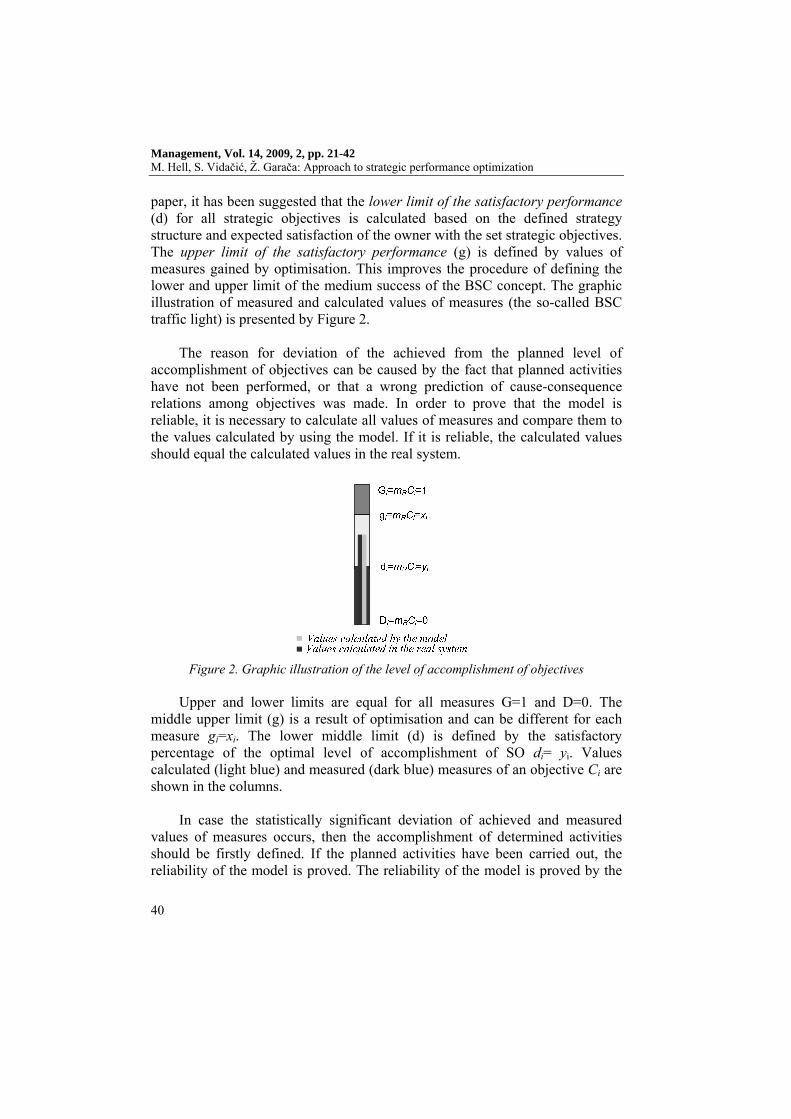
paper, it has been suggested that the lower limit of the satisfactory performance (d) for all strategic objectives is calculated based on the defined strategy structure and expected satisfaction of the owner with the set strategic objectives. The upper limit of the satisfactory performance (g) is defined by values of measures gained by optimisation. This improves the procedure of defining the lower and upper limit of the medium success of the BSC concept. The graphic illustration of measured and calculated values of measures (the so-called BSC traffic light) is presented by Figure 2.
The reason for deviation of the achieved from the planned level of
accomplishment of objectives can be caused by the fact that planned activities have not been performed, or that a wrong prediction of cause-consequence relations among objectives was made. In order to prove that the model is reliable, it is necessary to calculate all values of measures and compare them to the values calculated by using the model. If it is reliable, the calculated values should equal the calculated values in the real system.
Figure 2. Graphic illustration of the level of accomplishment of objectives
Upper and lower limits are equal for all measures G=1 and D=0. The
middle upper limit (g) is a result of optimisation and can be different for each measure gi=xi. The lower middle limit (d) is defined by the satisfactory percentage of the optimal level of accomplishment of SO di= yi. Values calculated (light blue) and measured (dark blue) measures of an objective Ci are shown in the columns.
In case the statistically significant deviation of achieved and measured
values of measures occurs, then the accomplishment of determined activities should be firstly defined. If the planned activities have been carried out, the reliability of the model is proved. The reliability of the model is proved by the

Management, Vol. 14, 2009, 2, pp. 21-42 M. Hell, S. Vidačić, Ž. Garača: Approach to strategic performance optimization
fact that the cause-consequence relations among objectives are predicted by using the model. If the model is reliable, then the measures of lower positioned objectives in the CCC will result in the expected change of measures of their superior objectives in the CCC. If consequence measures do not achieve the expected values according to influences of values of lower positioned measures and the model operates in accordance with the expected trends, it can then be concluded that the model is reliable. In this case, it is necessary to re-examine the set relations among objectives.
4. CONCLUSION The paper proposes the application of a mathematical model, based on the
matrix calculation, which uses the already "classical" approaches to strategic performance - the BSC and strategy maps, developed by Kaplan and Norton. It is hoped that the proposed model will facilitate optimisation of organizational strategic performance, which could be of special interest in the development of relevant software packages and other forms of managerial decision-making support. The original algorithm shown in the paper and based on the matrix calculation by using the IT, enhances the solving of the economic problem of optimisation of the enterprise effectiveness due to the maximisation of accomplishment of the set strategic objectives, which is derived from the quantitatively formulated vision of an organization.
REFERENCES 1. Akkrmans H.; van Oorschot, K. (2002): Developing a Balanced Scorecard
with System Dynamics; http://www.minase.nl/pdf/balanced.pdf (retrieved on 19. June 2009)
2. Bernroider, E. (2002): Factors in SWOT Analysis Applied to Micro, Small to Medium and Large Software Enterprises: An Austrian Study, European Management Journal, Vol. 20, No. 5, pp. 562-573
3. Berman, E. M. (2006): Performance And Productivity In Public And Non-profit Organizations, M. E. Sharpe, England
4. Brumec, J. (1998): Strategic Planning of IS, Journal of Information and Organisational Science, Vol. 23, No. 2, pp. 11-26
5. Brumec, J.; Vrček, N. (2002): Strategic Planning of Information Systems (SPIS) - A Survey of Methodology, Journal of Computing and Information Technology, Vol. 10, No. 3, September, pp. 225-231
6. Chandler, A. D. (1962): Strategy and Structure, MIT Press, Boston 7. Kaplan, R. S.; Norton, D. P. (1996): The Balanced Scorecard: Translating
Strategy into Action, Harvard Business School Press, Boston
41
Management, Vol. 14, 2009, 2, pp. 21-42 M. Hell, S. Vidačić, Ž. Garača: Approach to strategic performance optimization
42
8. Lee, S. F.; Andrew S. O. K. (2000): Building Balanced Scorecard with SWOT Analysis and implementing "Sun Tzu's Art of Business Management Strategies" on QFD Methodology, Managerial Auditing Journal, Vol. 15, No. 1/2, pp. 68-76
9. Niven P. R.(2002): Balanced Scorecard Step by Step, Wiley, New York 10. Stacey, D. R. (1997): Strateški menadžment i organizacijska dinamika,
MATE, Zagreb 11. Weihrich, H.; Koontz, H. (1998): Menadžment, MATE, Zagreb
PRISTUP OPTIMIZACIJI STATEŠKIH PERFORMANSI
Sažetak
U ovom se radu prezentira matrični pristup mjerenju i optimizaciji strateških performansi organizacije. Predloženi se model temelji na matričnom predstavljanju strateških performansi, koje slijedi teoretske koncepte Kaplanovih i Nortonovih modela balanced scorecard (BSC) i strateških mapa. Razvoj kvantitativnog predstavljanja strateških ciljeva otvara prostor za primjenu linearnog programiranja (LP) – matematičke tehnike za optimizaciju linearnih funkcija cilja. Vjeruje se da bi razvoj i matematička validacija ovakvog algoritma mogla otvoriti novo područje za kvantitativna istraživanja u strateškom menadžmentu, kao i za razvoj alata za potporu odlučivanju u području optimizacije strateških performansi.