METHOD TO INCORPORATE PORT STEADY FLOW DATA … · METHOD TO INCORPORATE PORT STEADY FLOW DATA INTO...
20
METHOD TO INCORPORATE PORT STEADY FLOW DATA INTO ENGINE PERFORMANCE MODELS Gerry Clark General Motors Global Propulsion Systems
-
Upload
hoangkhanh -
Category
Documents
-
view
218 -
download
0
Transcript of METHOD TO INCORPORATE PORT STEADY FLOW DATA … · METHOD TO INCORPORATE PORT STEADY FLOW DATA INTO...

METHOD TO INCORPORATE PORT STEADY FLOW DATA INTO ENGINE PERFORMANCE MODELS
Gerry Clark
General Motors Global Propulsion Systems

OBJECTIVES
• Method to represent port flow data from CFD or Flow Bench in GT POWER models.
• Method to comprehend exhaust port flow recovery and steady flow test hardware effects
• Method to treat 0-D cylinder model in port steady flow models
• Notes on area schedule representation.
• Notes on 4V port modeling.
Gerry Clark 2017

WHY PORT FLOW MODELING? (WHY SHOULD WE CARE)
Engines need air to make power. They cannot mix flow coefficients with fuel, they need air mass flow.
Verify inputs describing port, valve and L/D relationship to define mass flow correctly.
Account for 0D/1D/3D/real-world relationships:
Flow coefficients are 0-D representations of a system.
GT POWER Cylinders are 0-D, GT POWER flow elements (ports) are 1D
CFD/Flow Bench, Engine ports, and cylinders are full 3D and have aerodynamic characteristics beyond the valve discharge.
Gerry Clark 2017

G e r r y C l a r k 2 0 1 7
P1
Port
Bore Adaptor
P2
Bellmouth
Flow Bench Layout What discharge
coefficients describe:
P1 P2
A
+
Cd
Aeff
+
Cd=1
Zone of
interest

PORT FLOW MODELING – SET-UP
Build steady flow model to verify port flow
Represent port area schedule.
Subtract valve stem area
Check if port-manifold face is perpendicular to flow Use appropriate flow area, if different from ‘face opening’
Make sure volume, length and area schedule is represented. (Cross check with CAD or fluid ‘cc’ of port)
Set up reference arrays based on desired value.
GM uses L/D and Cdca based on valve head diameter
Do not include Bore Adaptor in model
Gerry Clark 2017

WHY NO BORE ADAPTOR IN FLOW BENCH MODEL?
GT POWER Engine cylinder is 0-D, not really a flow element
GT POWER Engine model’s port to cylinder interface is into the cylinder 0-D ‘low energy state’ with Zero flow recovery
Potentially different than the bench with bore adaptor.
Port flow sub model needs to represent where port+valve sub system is used (connected to engine model cylinder)
Surrogate for a 0-D cylinder in the steady flow model is a large diameter pipe. 1000 mm dia.
Gerry Clark 2017

PORT FLOW MODELING (INTAKE)
Intake port flow data typically includes entrance bellmouth (machined, clay etc). Insert bench coefficients into steady model
and check flow match. If flow is more than 1% off, check model for
errors: Reference array Cd area reference in model and supplied
data Valve size in model and in supplied data
Tune coefficients to match flow if desired (typically not required).
Load port and valve object models into engine model.
Gerry Clark 2017
P1
Port
Bore Adaptor
P2
Bellmouth
Flow Bench LayoutZone of
interest

PORT FLOW MODELING (EXHAUST)
Represent port area schedule.
Do not include Bore Adaptor in steady model
If used in testing, represent extension pipe for steady flow simulations, remove when inserting port into engine model.
Gerry Clark 2017
Extension pipe mimics
the effect of exhaust
manifold/header on port

PORT FLOW MODELING(EXHAUST)
Intake ports flow: pipe>orifice>large diameter/low energy
Orifice losses ‘dominate’
Bench derived coefficients are quite close.
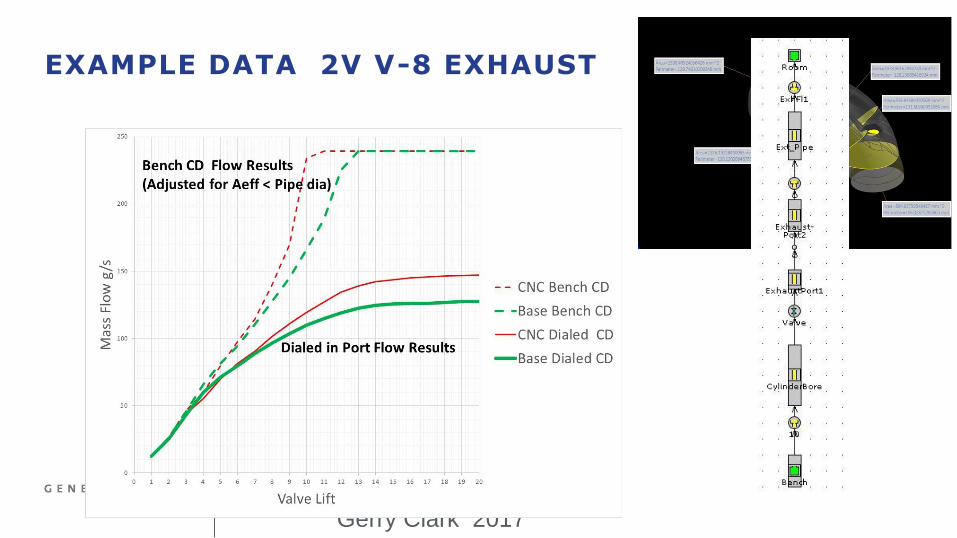
Exhaust ports flow: low energy>orifice>pipe>extension pipe
Subsequent pipes in models provide pressure/flow recovery.
Bench coefficients lump everything at the valve. Valve coefficients need reduction to allow recovery effects from port and extension pipe.
Gerry Clark 2017
Discharge Coefficient Only GT POWER Flowbench• Adjust coefficients to
achieve flow match
• Load port and valve object
models into engine model
with adjusted coefficients
and without extension
pipe.

EXAMPLE DATA 2V V-8 EXHAUST
Gerry Clark 2017

EXAMPLE DATA 2V V-8 EXHAUST
Gerry Clark 2017

EXAMPLE DATA 2V V-8 EXHAUST
Gerry Clark 2017
EXAMPLE DATA 2V V-8 EXHAUST
Gerry Clark 2017

EXAMPLE DATA 2V V-8 EXHAUST
Gerry Clark 2017

ENGINE RESULTS • Effect of port flow change
was small.
• Effect of improper flow
coefficients cannot be
ignored.
~3%
<0.5%

PORT REPRESENTATIONS: CROSS SECTIONAL AREA
Simple one-pipe port, length and dia
Port to Represent Area Schedule
Q: I’m lumping the flow losses at the valve, why do I
care about cross sectional area?
A: If exhaust port minimum cross section area is
represented, the ENGINE model can indicate choked
flow during cycle simulation.

EXTRA CREDIT: TRY THIS ON YOUR FLOW BENCH OR 3D CFD FLOW SIMULATION
• Set up a simple orifice flow test.
• Record Data
• Add a length of straight pipe slightly larger than the orifice (use your flow extension pipe).
• Compare Results
Gerry Clark 2017
Orifice flow test Orifice with pipe
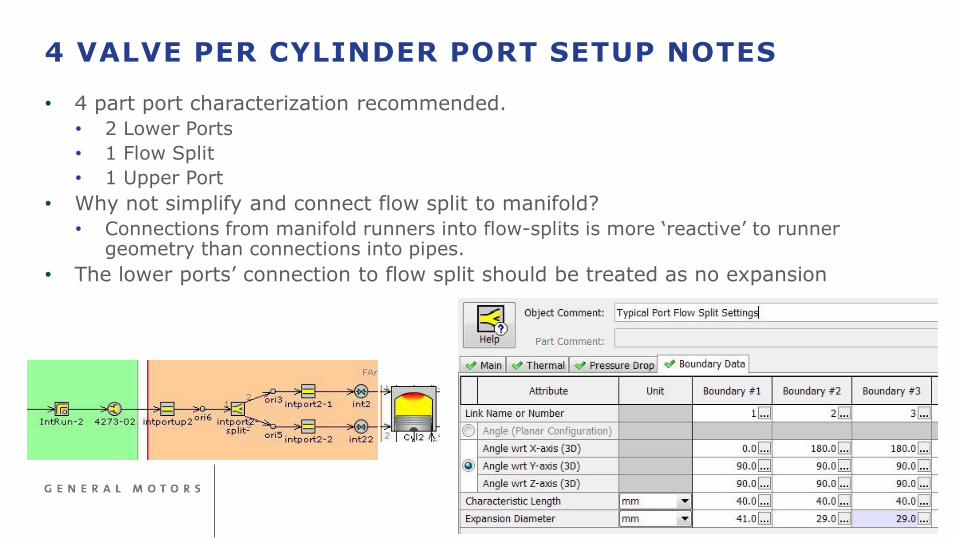
4 VALVE PER CYLINDER PORT SETUP NOTES
• 4 part port characterization recommended.
• 2 Lower Ports
• 1 Flow Split
• 1 Upper Port
• Why not simplify and connect flow split to manifold?
• Connections from manifold runners into flow-splits is more ‘reactive’ to runner geometry than connections into pipes.
• The lower ports’ connection to flow split should be treated as no expansion

REVIEW OBJECTIVES
• Method to represent port flow data from CFD or Flow Bench in GT POWER models.
• Method to comprehend exhaust port flow recovery and steady flow test hardware effects
• Method to treat 0-D cylinder model in port steady flow models
• Notes on area schedule representation.
• Notes on 4V port modeling.
Gerry Clark 2017

QUESTIONS?