METHOD DEVELOPMENT FOR THE DETERMINATION · PDF file2.2 Electrospray Ionization Nebulizer...
39
METHOD DEVELOPMENT FOR THE DETERMINATION OF SULPHONAMIDE RESIDUES IN CHICKEN BY LIQUID CHROMATOGRAPHY ION TRAP TANDEM MASS SPECTROMETRY by SIDEK BIN AHMAD Thesis submitted in fulfillment of the requirements for the degree of Master of Science June 2006
Transcript of METHOD DEVELOPMENT FOR THE DETERMINATION · PDF file2.2 Electrospray Ionization Nebulizer...
METHOD DEVELOPMENT FOR THE DETERMINATION OF
SULPHONAMIDE RESIDUES IN CHICKEN BY LIQUID
CHROMATOGRAPHY ION TRAP TANDEM MASS SPECTROMETRY
by
SIDEK BIN AHMAD
Thesis submitted in fulfillment of the
requirements for the degree
of Master of Science
June 2006

ii
DECLARATION
I declare that the work presented in this thesis is an original work except for every
part and portion that I had quoted.
1 ST. NOVEMBER 2003 SIDEK BIN AHMAD
PDOM 0005

iii
ACKNOWLEDGEMENT
Alhamdulillah I am grateful to Almighty Allah for His grace and bless to
enable me to complete this course of study.
My special thanks to my supervisor, Professor Aishah Latiff for her
supervision, guidance, advice, and resourceful information and understanding
throughout these studies.
I extend my thanks to Dr Michael Harvey for his assistance during the course
of study. My sincere gratitude is also extended to the staff of Doping Control Center
especially to Cik Hayati, Puan Hajjah Normaliza, Encik Hajjaj, Encik Azman and
Puan Fazeha for the invaluable help, to all doping staff and students your support is
greatly appreciated.
I would also like to thank to Public Service Department for the scholarship
and to Doping Control Center and Institute of Graduate Studies for providing
infrastructure for my study.
I would also like to express my greatest appreciation to the Department of
Chemistry, Ministry of Science, Technology and Innovation for the given
opportunities especially to my former Director General Datuk Chang Eng Thuan and
my former state Director, Mr. Qua Sai Chuan and also to the staff of Department of
Chemistry, Johor State Laboratory.

iv
To my late father and late mother I dedicated this work to them, and also to
my children Muhammad Aliff and Nur Eileen and wife for their patience.
v
TABLE OF CONTENTS
DECLARATION ii
ACKNOWLEDGEMENTS iii
TABLE OF CONTENT v
LIST OF TABLE viii
LIST OF FIGURE x
LIST OF SYMBOL xi
ABSTRAK xii
ABSTRACT xiv
CHAPTER 1 : INTRODUCTION 1
CHAPTER 2 : LITERATURE REVIEW 6
2.1 The Chemistry of Studied Sulphonamides Investigated in this Study 6
2.2 Residue Analysis of Sulphonamide 8
2.3 Electrospray Ionization Ion Trap Tandem Mass Spectrometer 16
2.4 Performance Characteristic of Test Method Validation 20
2.5 Measurement of Uncertainty 26
2.6 Research Objective 27
CHAPTER 3 : MATERIAL AND EXPERIMENTAL 28
3.1 Material 28
3.1.1 Chemicals and Reagent 28
3.1.2 Standards and Internal Standard 28
3.1.3 Laboratory Equipment 29
3.1.4 Analytical Equipment 30
3.1.5 Preparation of Reference Standards and Reagents 30
3.1.6 Preparation of Sample for Validation Study 32

vi
3.2 Experimental 34
3.2.1 Tuning and Calibrating of Mass Spectrometer 34
3.2.2 Mass Spectrometer and HPLC Conditions 34
3.2.3 Full Scan Mass Spectrometry Experiment 35
3.2.4 Full Scan Tandem Mass Spectrometry Experiment 35
3.2.5 Extraction and Cleanup Procedure 35
3.2.6 Optimization of Extraction 37
3.2.7 Validation of Test Method 38
3.2.7.1 Determination of Specificity 38
3.2.7.2 Determination of LOD and LOQ 38
3.2.7.3 Determination of Linearity 39
3.2.7.4 Determination of Precision, Accuracy and
Robustness of Test Method 39
3.2.7.5 Determination of Extraction Recovery 40
3.2.8 Measurement of Uncertainty 40
3.2.9 Determination of Blind Sample 40
CHAPTER 4 : RESULT AND DISCUSSION 41
4.1 Optimization of Liquid Chromatography Tandem
Mass Spectrometry 41
4.2 Result of Optimization of Extraction 55
4.3 Result of Method Validation 63
4.4 Calculation of Measurement of Uncertainty 76
4.5 Result of Blind Sample Analysis 87
CHAPTER 5 : CONCLUSION 90
BIBLIOGRAPHY 93
vii
APPENDICES
Appendix 1 : Preparation of Blind Sample
Appendix 2 : Full Scan MS/MS of Sulphonamides at Collision Energy 20%
Appendix 3 : Full Scan MS/MS of Sulphonamides at Collision Energy 25%
Appendix 4 : Full Scan MS/MS of Sulphonamides at Collision Energy 30%
Appendix 5 : Full Scan MS/MS of Sulphonamides at Collision Energy 35%
Appendix 6 : Strata X User’s Guide
Appendix 7 : WADA Technical Document

viii
LIST OF TABLE No Title Page
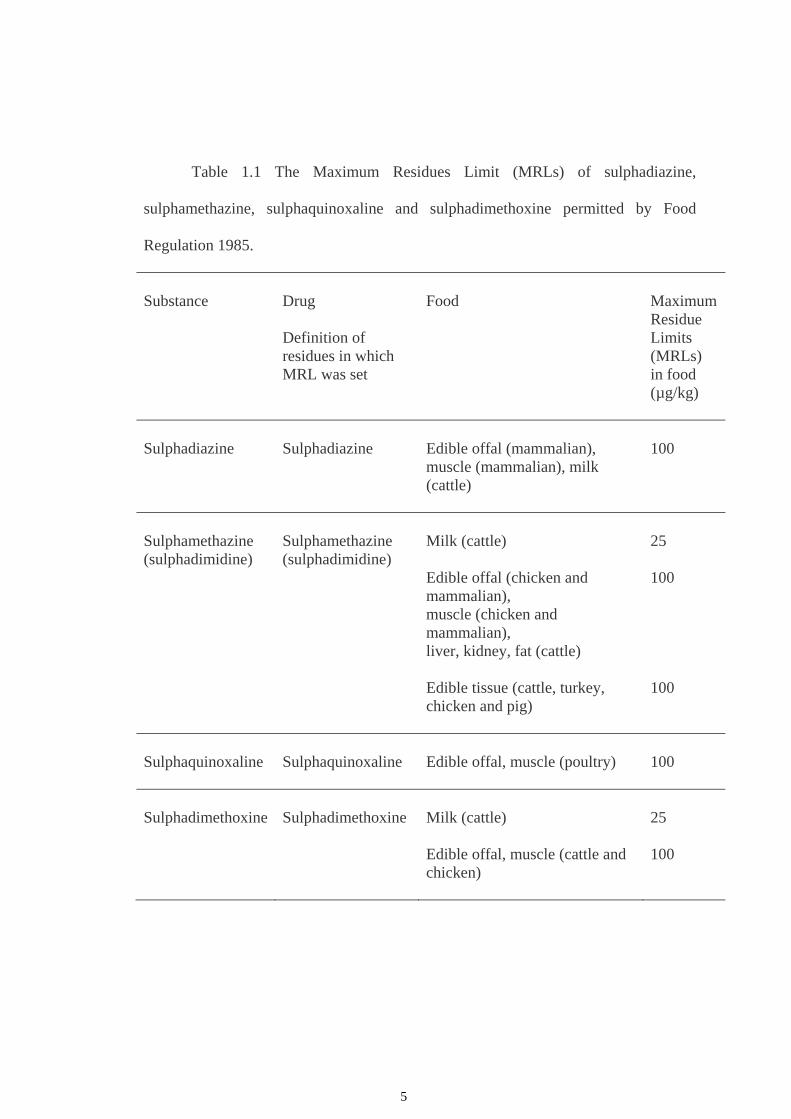
1.1 The Maximum Residues Limit (MRLs) of sulphadiazine,
sulphamethazine, sulphaquinoxaline and sulphadimethoxine permitted by
Food Regulation 1985.
5
2.1 Criteria for acceptance of the validation of analytical methods for
determination of veterinary drug
25
3.1 Specific UV absorbance of sulphonamides 29
3.2 Preparation of working standard mixture solution 31
3.3 Preparation of spiked sample for validation study 33
4.1 Ion trap MS-MS product ions of sulphonamides 53
4.2 Recovery of sulphonamides 57
4.3 Effect of solid phase extraction cartridge on recovery 58
4.4 Effect of acetonitrile and ethyl acetate on recovery 59
4.5 Comparison of peak height count and peak height ratio of chromatogram
by using acetonitrile and ethyl acetate
60
4.6 Effect of solid phase extraction cartridge size on recovery 61
4.7 t-test results 62
4.8 Limit of detection and limit of quantitation for determination of
sulphonamides in chicken
66
4.9 Relatives Ions Intensities to Ensure Appropriate Identification of
Diagnostic Ions at Limit of Detection Level
68
4.10 The accuracy of calibration points for sulphadiazine, sulphamethazine,
sulphaquinoxaline and sulphadimethoxine
71
4.11 Within day repeatability and accuracy result 72
4.12 Between day repeatability and accuracy result 73
4.13 Result of precision and accuracy for robustness study of test method 74
4.14 Result of recovery study 75
4.15 Recovery and repeatability of 100 ppb spiked sample 76
4.16 Calibration result of sulphadiazine, sulphamethazine, sulphaquinoxaline
and sulphadimethoxine
79
4.17 Value and uncertainty associated to the linear least square fitting 80

ix
LIST OF TABLE No Title Page 4.18 Value and uncertainties for determination of expanded uncertainty 85
4.19 Expanded uncertainty of sulphonamide residues at 100 ppb 86
4.20 Result of quality control sample and it acceptable range 88
4.21 Result of blind sample analysis 89
x
LIST OF FIGURE
No Title Page
2.1 Structure of sulphonamides investigated in this study 7
2.2 Electrospray Ionization Nebulizer Probe 19
2.3 Electrospray Ionization Ion Source Interface 19
4.1 Selected ions full scan MS-MS chromatogram of 5 sulphonamides 43
4.2 Full scan mass spectrometry of 5 sulphonamide 45
4.3 Possible fragment structure derived from the fragmentation of [M+H]+ ion
of sulphonamides
47
4.4 Full scan MS-MS spectrum of sulphadiazine 48
4.5 Full scan MS-MS spectrum of sulphamethazine 49
4.6 Full scan MS-MS spectrum of sulphachloropyridazine 50
4.7 Full scan MS-MS spectrum of sulfaquinoxalne 51
4.8 Full scan MS-MS spectrum of sulfadimethoxine 52
4.9 Selected ions full scan MS-MS chromatogram of spiked sample 64
4.10 Selected ions full scan MS-MS chromatogram of blank sample 65
4.11 Calibration curve of sulphadiazine 69
4.12 Calibration curve of sulphamethazine 69
4.13 Calibration curve of sulphaquinoxaline 70
4.14 Calibration curve of sulphadimethoxine 70
4.15 Cause and effect diagram for determination of sulphonamide residues in
chicken
77

xi
LIST OF SYMBOL Å = Angstrom
cm = centimeter
g = gram
kg = kilogram
kV = kilovolt
M = molar
mm = milliliter
m/z = mass per charge ratio
pKa = acid dissociation constant
ppb = parts per billion
ppm = parts per million
rpm = ressolutions per minute
µg = microgram
µl = microliter
V = volt

xii
PEMBANGUNAN KAEDAH BAGI PENENTUAN BAKI SULFONAMIDA
PADA AYAM MENGGUNAKAN KROMATOGRAFI CECAIR SPEKTROMETER JISIM TANDEM
PERANGKAP ION
ABSTRAK
Satu kaedah yang mudah, sensitif dan dipercayai untuk penentuan sisa lima
sulfonamida (sulfadiazina, sulfametazina, selfakuinozalina dan sulfadimetoksina) di
dalam ayam telah dibangunkan menggunakan gabungan Kromatografi Cecair
Berprestasi Tinggi (HPLC) dan Spektrometri Jisim Tandem Perangkap Ion.
Pengekstrakan sampel melibatkan pengekstrakan menggunakan asetonitril, proses
nyah lemak menggunakan heksana dan diikuti penulinan ekstrak menggunakan
penjerap polimer ‘Strata X Solid Phase Extraction cartridge’ selepas mencairkan
semula menggunakan 0.2 M asid fosforik. Ekstrak dialirkan daripada penjerap
polimer menggunakan metanol dan dikeringkan di dalam rendaman air yang dialirkan
gas nitrogen berterusan. Baki dicairkan semula menggunakan campuran larutan 0.1 %
asid asetik dan asetonitril (1:1). Kromatografi Cecair Pengionan Penyemburanelektro
Perangkap Ion Spektrometer Jisim Tandem digunakan untuk pengesahan dan
pengiraan baki sulfonamida. Suatu turus HPLC yang berdimeter sempit, Genesis C18
(120 Å, 3 µm, 5 sm x 2.1 mm) dan campuran larutan 0.1 % asetik asid di dalam air
ultratulin dan asetonitril (65:35) pada kadar aliran 60 µl/min telah digunakan untuk
memisahkan sulfonamida tersebut. Validasi kaedah analisis untuk mengesan baki
sulfonamida telah dibuat dan pengiraan nilai ketidakpastian pengukuran telah
dilakukan untuk memenuhi keperluan sistem kualiti ISO/IEC 17025. Semasa proses
validasi spesifisiti, kelinearan, had pengesanan (LOD), had kuantitatif (LOQ),
ketepatan dan kecekapan kaedah analisa ditentukan. Dari spektrum jisim, beberapa
xiii
ion baru yang boleh digunakan untuk pengesahan dan kuantitasi iaitu pada m/z 174
untuk sulfadiazina, sulfametazina dan sulfakuinozalina, pada m/z 204 untuk
sulfametazina dan m/z 226 untuk sulfakuinozalina telah terhasil. Plot graf
penentukuran yang dihasilkan adalah lurus pada kepekatan di antara 20 hingga 40 ppb
(ng/g) bagi sulfadiazina, sulfakuinozalina dan sulfadimetoksina manakala 10 hingga
40 ppb (ng/g) untuk sulfametazina dengan pekali regrasi untuk setiap julat lengkuk
penentukuran adalah 0.999. Kadar had pengesanan (LOD) untuk sulfametazina adalah
2 ppb (ng/g) sementara 5 ppb (ng/g) untuk sulfadiazina, sulfakuinozalina dan
sulfadimetoksina. Had pengiraan kuantatif (LOQ) pula adalah 10 ppb (ng/g) untuk
sulfametazina dan 20 ppb (ng/g) untuk sulfadiazina, sulfakuinozalina dan
sulfadimetoksina. Peratusan ekstrak yang diperolehi semula ke atas sampel yang
diperkaya dengan piawai pada paras LOQ adalah 51, 54, 68 dan 83 % sementara
pekali variasinya adalah 5, 13, 9 dan 7 % masing-masing bagi sulfadiazina,
sulfametazina, sulfakuinozalina dan sulfadimetoksina. Manakala nilai ketidakpastian
masing-masing pada kepekatan 100 ppb bagi sulfadiazine, sulfametazina,
sulfakuinozalina dan selfadimetoksina ialah 6, 9, 10 dan 4 ppb. Oleh itu daripada nilai
ciri-ciri keupayaan yang diperolehi menunjukkan kaedah yang dibangunkan adalah
boleh dipercayai untuk digunakan di dalam analisa rutin.

xiv
METHOD DEVELOPMENT FOR THE DETERMINATION OF
SULPHONAMIDE RESIDUES IN CHICKEN BY LIQUID CHROMATOGRAPHY ION TRAP TANDEM MASS SPECTROMETRY
ABSTRACT
A simple, sensitive and reliable method for the determination of five sulphonamide
residues (sulphadiazine, sulphamethazine, sulphaquinoxaline and sulphadimethoxine)
in chicken was developed using a combination of high performance liquid
chromatography (HPLC) with ion trap tandem mass spectrometry. Sample extraction
involvd extraction with acetonitrile, removal of fat with n-hexane followed by
purification of the extract with Strata X polymeric sorbent Solid Phase Eextraction
cartridge after reconstitution with 0.2 M phosphoric acid. The extract was eluted with
methanol and evaporated to dryness in a water bath under constant flow of nitrogen
gas. The residue was again reconstituted with a solution mixture of 0.1 % acetic acid
in ultra pure water and acetonitrile (1:1). A liquid chromatograph with an electrospray
ionization interface to the ion trap tandem mass spectrometrer (LC-MS-MS) was used
for simultaneous confirmation and quantitation of the sulphonamide residues. A
narrow bore HPLC column, Genesis C18 120 (Å, 3 μm, 5 cm x 2.1 mm) and a
solution of 0.1 % acetic acid in ultra pure water and acetonitrile (65:35) with a flow
rate 60 µl/min was used to separate the sulphonamides. The analytical procedure for
the detection of sulphonamide residues was validated and the measurement of
uncertainty was determined for the compliance of the ISO/IEC 17025 quality system
requirement. During validation, specificity, linearity, limit of detection (LOD), limit
of quantitation (LOQ), precision and accuracy of the method was determined. New
product ions that could be used for confirmation and quantitation at m/z 174 for
sulphadiazine, sulphamethazine and sulphaquinoxaline, at m/z 204 for
xv
sulphamethazine and m/z 226 for sulphaquinoxaline were observed. A linear plot was
obtained for a concentration range between 20 ppb and 400 ppb for sulphadiazine,
sulphaquinoxaline and sulphadimethoxine and 10 ppb to 400 ppb for sulphamethazin,
respectively, where the regression coefficient for each calibration range obtained was
0.999. The limit of detection (LOD) was 2 ppb for sulphamethazine and 5 ppb for
sulphadiazine, sulphaquinoxaline and sulphadimethoxine, respectively. The limit of
quantification (LOQ) was 10ppb for sulphamethazine and 20 ppb for sulphadiazine,
sulphaquinoxaline and sulphadimethoxine, respectively. The extraction recovery for
spiked samples at the LOQ level was 51, 54, 68 and 83 % with coefficient of variation
of 5, 13, 9, and 7 % for sulphadiazine, sulphamethazine, sulphaquinoxaline and
sulphadimethoxine, respectively and the expanded uncertainty values at concentration
of 100 ppb for sulphadiazine, sulphamethazine, sulphaquinoxaline and
sulphadimethoxine were 6, 9, 10 and 4 ppb, respectively. Therefore from the
performance characteristic obtained the developed method could be reliably used for
routine analytical work.
1
CHAPTER 1
INTRODUCTION
The issue of drug residues in food-producing animals is a common global
problem faced by the local health authority. It was reported that shrimp, chicken and
chicken egg that were exported to Europe contained chloramphenicol (The New
Straits Time, 2002), where this antibiotic was banned to be used in food producing
animals.
Drugs especially antibacterials are frequently being used in agricultural
practice at subtherapeutically level to maintain health and to promote weight gain, to
decrease the amount of feed needed and to prevent disease and in higher dosage
forms, for treatment of individual animals for specific disease conditions (Borner,
1997). Such usage may lead to problem of residues in foods which could threaten
human health and cause allergic and toxic reactions. Furthermore, antibiotics used as
growth promoters may encourage the development of antibiotic-resistance bacteria
(Borner, 1997).
Realizing the potential hazard of the antibiotics used in animal production,
public health officials and scientists need to examine and make appropriate responses
on the usage of antibiotics. In England, due to the major salmonella epidemic in
calves a committee known as Swann Committee was formed. Following the report by
this committee antimicrobials used for animal production in England was regulated
differently according to their category of use (Gustafson, 1991). Antimicrobials that
were used for the promotion of growth continued to be used under the discretion of
2
the meat producer but for the treatment of diseases it could only be used under the
supervision of the veterinarian. Both types of the antimicrobials should be licensed by
The Ministry of Agriculture, Food and Fisheries. In the United States, also following
the report by the Swann Committee, the United States Food and Drugs Administration
and other agencies as well as interested group appointed a series of committees and
task force to study the implication of antibiotic usage in animal feed (Gustafson,
1991).
Since the usage of antibiotics in poultry and livestock industries are
unavoidable, it has become the responsibility of regulatory authorities to set
maximum residue limits to ensure drug residues in food producing animals are safe to
human. In the United States, the approval of the veterinary drug products used in
food-producing animals is delegated to the United States Food and Drug
Administration (USFDA), Center for Veterinary Medicine, Department of Health and
Human Services. The regulatory authority responsible for determining compliance of
Maximum Residues Limit (MRLs) is U. S. Department of Agriculture, Food Safety
and Inspection Service (Oka et. al., 1995).
In Malaysia the regulatory authority responsible for determining compliance
of maximum drug residues in food producing animals is the Division of Food Quality
Control, Department of Public Health, Ministry of Health (Food Act 1983 &
Regulations, 2000). The amount of drug residues in foods had been regulated by
Regulation 40 of The Food Regulations (Food Act 1983 & Regulations, 2000). The
Maximum Residue Limit (MRLs) of the veterinary drugs including sulphonamides
had been set in Table 1 of Schedule 15A of the same regulation.

3
Sulphonamides are first major class of antibacterial compounds to be
discovered and used extensively in food producing animals (Oka et al., 1995). It had
been widely used for the treatment of diseased animals and the promotion of growth
(Corcica, 2002). As a result of the continuous and high dose usage, the possibility of
these residues remaining in food producing animals will increase. Due to the weak
acid nature of sulfonamides they tend to bind to the basic side of the amino acid, as a
result these drugs may remain in the host system for longer period than expected. In
Malaysia the maximum permitted sulphonamide residues level was first gazetted in
1998 (Food Regulation 1985 (Amendment), 1998) and the maximum amount residue
level was set in the same schedule of the Food Regulation as above. The maximum
permitted amount is summarized in Table 1.1. Based on this table, the maximum
permitted level for suphadiazine, sulphamethazine, sulphaquinoxaline and
sulphadimethoxine was 100µg/kg in edible offal, tissue and muscle of poultry and
livestock and 25µg/kg in milk. The residue was defined as its parent compound found
in the above matrices.
Determination of sulphonamide residues in food for the enforcement of the
Food Regulation is still new. The Ministry of Health has appointed a number of
laboratories such as Department of Chemistry, Doping Control Centre, Public Health
Laboratory and Veterinary Public Health Laboratory (His Majesty’s Government
Gazette, 21st. November 2002) as authorized laboratories for the determination of drug
residues in foods. Before any analytical method can be used in routine analysis it has
to be validated. Method validation is a process of establishing the performance
characteristics and limitation of the analytical test method. There are two levels of
analytical method validation, first is ‘full method validation’ where the performance

4
characteristics are determined by inter-laboratory performance study also known as
collaborative study. The second level is called ‘single laboratory method validation’
where full method validation is not practical or necessary (Thompson et al., 2002).
There are several guidelines that can be adopted for the establishment of
performance characteristics of analytical test method such as the guidelines by
URACHEM Guide – The Fitness for Purpose of Analytical Method : A Laboratory
Guide To Method Validation and Related Topics, Thompson and coworkers (2002)
and others. The general requirements for the individual performance characteristics
for a method validation are discussed below in section 2.4.
Therefore due to the fact that sulphonamides was widely used in food
producing animals (Oka et. al., 1995) and their potential carcinogenic character
(Niessen et. al. 1998), it is necessary to ensure that all foods sold in the market
contain a safe level of sulphonamides. In addition, to fullfill the demand of law
enforcement, the need to provide high sample throughput, relaible, robust and
affordable analytical methodology, compared to previously developed method is very
important. These requirements can only be met after the methodology has been
properly investigated.
5
Table 1.1 The Maximum Residues Limit (MRLs) of sulphadiazine,
sulphamethazine, sulphaquinoxaline and sulphadimethoxine permitted by Food
Regulation 1985.
Substance
Drug Definition of residues in which MRL was set
Food
Maximum Residue Limits (MRLs) in food (µg/kg)
Sulphadiazine
Sulphadiazine
Edible offal (mammalian), muscle (mammalian), milk (cattle)
100
Sulphamethazine (sulphadimidine)
Sulphamethazine (sulphadimidine)
Milk (cattle) Edible offal (chicken and mammalian), muscle (chicken and mammalian), liver, kidney, fat (cattle) Edible tissue (cattle, turkey, chicken and pig)
25 100 100
Sulphaquinoxaline
Sulphaquinoxaline
Edible offal, muscle (poultry)
100
Sulphadimethoxine
Sulphadimethoxine
Milk (cattle) Edible offal, muscle (cattle and chicken)
25 100

6
CHAPTER 2
LITERATURE REVIEW
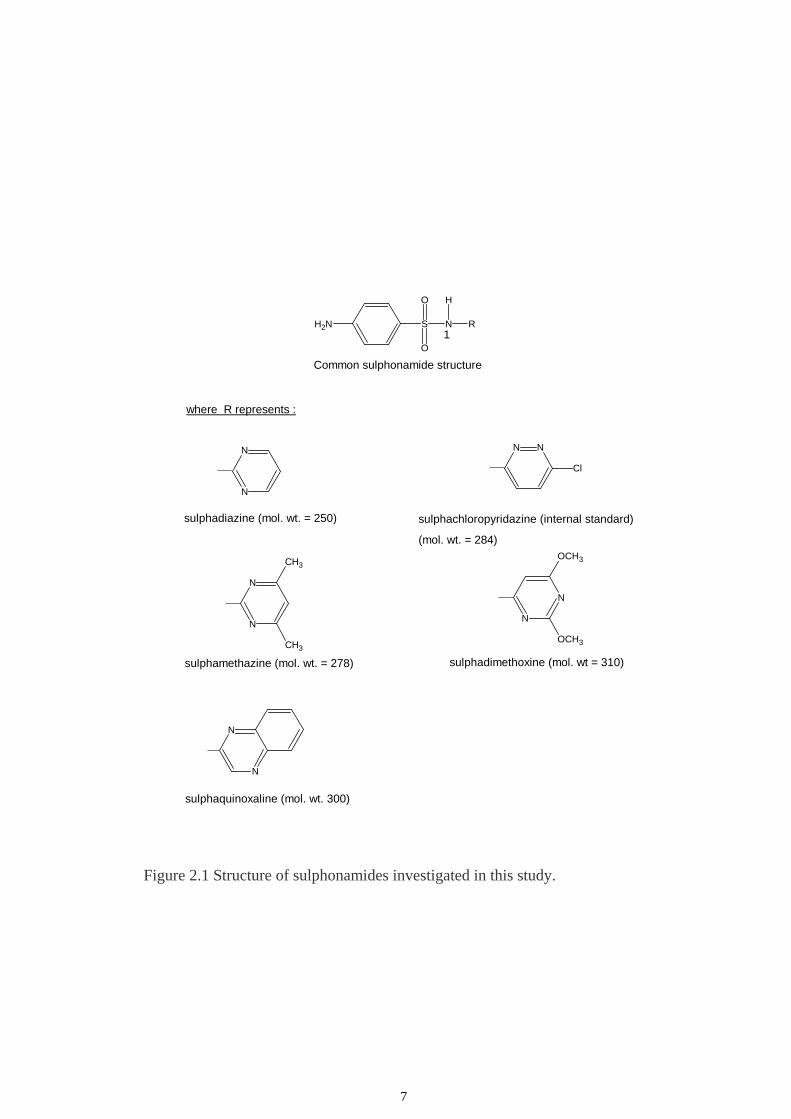
2.1 The chemistry of sulphonamides investigated in this study.
Sulphadiazine, sulphamethazine, sulphaquinoxaline and sulphadimethoxine
belong to the class of sulphonamides that have amphotheric behavior because of the
inductive properties of SO2 group and poorly soluble in water, diethyl ether and
chloroform but readily soluble in polar organic solvents such as acetone (Guggisberg
et al., 1992). It is not regarded as true antibiotics but instead as a synthetic chemical
originally derived from the dyestuff industry. The term antibiotic is for agents derived
from living organisms, or synthetic or semi-synthetic analogues of such compounds.
Sulphonamides interfere with bacteria growth by affecting the production of
dihydrofolic acid, which is essential for the growth of bacteria. The pKa values of
sulphadiazine, sulphamethazine, sulphaquinoxaline and sulphadimethoxine are 6.4,
7.4, 5.5 and 6.2, respectively (Agrawal, 1992). Sulphonamides are aromatic amines
substituted at the N-1 position. The structure of R for sulphadiazine, sulphamethazine,
sulphachloropyridazine, sulphaquinoxaline and sulphadimethoxine are illustrated as in
Figure 2.1 and their molecular weights are 250, 278, 284, 300 and 310, respectively.
7
S N R
O
O
H
NH21
sulphadiazine (mol. wt. = 250) sulphachloropyridazine (internal standard)
(mol. wt. = 284)
sulphamethazine (mol. wt. = 278) sulphadimethoxine (mol. wt = 310)
sulphaquinoxaline (mol. wt. 300)
NN
Cl
N
N
N
N
OCH3
OCH3
N
N
CH3
CH3
N
N
where R represents :
Common sulphonamide structure
Figure 2.1 Structure of sulphonamides investigated in this study.
8
2.2 Residue analysis of sulphonamides
A general approach for the detection of sulphonamide residues in the foods of
animal origin such as meat, milk and eggs involves extraction, purification of sample
extract and detection steps. Initially sulphonamides will be extracted with organic
solvents such as acetonitrile, chloroform, methylene chloride, acetone, or ethyl acetate
and following which the biological extract needs to be further purified; solid phase
extraction cartridge (SPE) was widely used for this process. Automated extraction
such as by pressurized liquid extraction was also used (Jacobsen et. al., 2004).
Various SPE cartridges are used for cleaning-up such as normal phase, reverse phase
and ion exchange cartridges. Besides the use of prepacked cartridge, self packed
cartridge was also used (Hirsch et. al., 1998). Some author also used two catrridges
for the clean-up (strong anion exchanger and polymeric hydrophilic-lipophilic
cartridges) of the extract (Jacobsen et. al., 2004). Other than the application of SPE
cartridge, liquid-liquid extraction, Matrix Solid Phase Dispersion (MSDP) (Long et
al., 1990) and lyophilization (Hirsch et. al., 1998) was also used to concentrate the
extract. Due to the excess usage of organic solvent where the storage of waste solvent
will become problematic as well as higher productivity with SPE application, liquid-
liquid extraction has become the least preferred technique.
After the cleaning-up, various chromatographic detection techniques were
applied such as thin layer chromatography, gas chromatography, liquid
chromatography and coupled technique such as liquid chromatography-mass
spectrometry. Beside this, non-chromatographic detection technique such as enzyme
9
immunoassay was also used. The above diversification in the detection of
sulphonamides will be presented below.
Horii and coworkers (1990) developed a method for the determination of three
suphonamides in animal tissue and egg by liquid chromatography. Ten grams of
sample was extracted with acetonitrile. The pH of the concentrated extract was
changed to 1-2 with 1% trichloroacetic acid before loading into Bond-Elute C18, a
reversed phase SPE cartridge. The sulphonamides were eluted from the SPE cartridge
with 0.1 % triethylamine in acetonitrile. After evaporation of the elute, the residue
was redissolved with 10 mM potassium dihydrogenphosphate solution. The analyte
was analyzed by HPLC using Nucleosil 100 C18 column (5 µm, 250 x 4. 6mm) and
10 mM potassium dihydrogen phosphate-acetonitrile (78:22) as mobile phase and was
detected by UV detector at 268 nm. The limit of detection was 0.01 ppm for
sulphamethazine (SMZ) and sulphamonomethoxine (SMX) and 0.02 ppm for
sulphadimethoxine (SDX). The limit of quantification was 0.02 ppm for SMZ and
SMX and 0.04 ppm for SDX.
Furasawa and Mukai (1994) developed a method for the determination of
sulphamonomethoxine, sulphadimethoxine and their N4 – acetyl metabolite in beef,
pork, chicken and eggs. Ten grams of sample was homogenized with 90 %
acetonitrile and hexane. The acetonitrile layer was applied to an alumina column.
Sulphonamides and their N4 - acetyl metabolite were eluted with 90 % acetonitrile
solution. The elute was evaporated to dryness and the residue was dissolved in
acetonitrile in 0.05 M phosphate buffer (pH 5.0). The analyte was analyzed by HPLC
using LiChrosorb RP-18 column (7 µm, 250 x 4 mm I.D.) and acetonitrile-0.05 M

10
phosphate buffer (pH 5.0) (25:75) as mobile phase and was detected with UV detector
at 270 nm. The detection limit for all compounds by this method was 0.01 ppm.
Roybal and coworkers (2003) developed a method for the determination of six
sulphonamides in shrimp. Two gram of sample was extracted with ethyl acetate and
the clean-up of sample was done using size-exclusion chromatography column,
Sephadex LH-20. Liquid chromatography with UV detector was used for detection of
sulphonamides. Phenyl column (5 µm, 150 mm x 4.6 mm) and gradient elution of
mobile phase containing methanol, acetic acid and 5 mM sodium hexanesulfonic acid
was used for separation of sulphonamides. Recovery of sulphonamides for spiked
samples at concentrations of 100 ppb, 50 ppb and 25 ppb was between 70 to 100 %.
Long and coworkers (1990) developed a method for extraction of
sulphadimethoxine in catfish muscle tissue by matrix solid phase dispersion
technique. Sulphamethoxazole was used as the internal standard. A sample was
blended with octadecylsily derivatized silica packing material. A column made from
the C18/sample was first washed with hexane and the analyte was eluted with
dichloromethane and was evaporated to dryness. The residue was dissolved with the
mobile phase and then centrifuged. The clear solution was filtered through 0.45 µm
filter and was injected into the HPLC. A 10 µm, 30 cm x 4 mm reversed phase HPLC
column was used with 0.017 M aqueous H3PO4-acetonitrile (65 + 35, v/v) as mobile
phase. The sulphonamides were detected at 270 nm by PDA detector. The recovery of
spiked samples obtained was 101 ± 4.2 % and inter assay and intra assay variability
was 10.7 ± 8.2 % and 2.2 %, respectively

11
In the application of liquid chromatography-mass spectrometry, various
ionization techniques and types of mass spectrometer were used. Kristiansen and
coworkers (1994) made a comparison between flow injection thermospray tandem
mass spectrometry (FI/TSI/MS/MS) while liquid chromatography thermospray
tandem mass spectrometry (LC/TSI/MS/MS) for the determination of sulphonamide
residues in meat. Five sulfonamides were analyzed and sulfapyridine was used as the
internal standard. Ten grams of sample was extracted with ethyl acetate after
adjusting the sample pH to 5.5 – 6 with 0.1 M HCl. After evaporation of the extract,
the residue was dissolved with a solvent mixture of 0.05 M ammonium
acetate/methanol (80:20), with no additional clean-up procedure. For these studies, a
Finnigan TSQ 700 triple stage quadrupole instrument equipped with thermospray
ionization was used for quantitation and confirmation of sulphonamides in the sample.
For the LC/TSI-MS/MS analysis the sulphonamides were separated on a Chrompack
Microsphere C18 column (3 µm, 100 x 4.6 mm) by using solvent mixture of 0.05 M
ammonium acetate-methanol (77:23). The detection limit (LOD) for LC/TSI-MS/MS
in meat was 2 ppb for sulphadiazine, sulphamethazine and sulfanilamide and 10 ppb
for sulphathiazole and sulphadimethoxine. The LOD for FI/TSI-MS/MS was 2 ppb
for sulphamethazine and sulphadimethoxine and 10 and 40 ppb for sulphathiazole and
sulphanilamide, respectively.
The method for the determination of sulphadiazine residues in salmon muscle
by HPLC and confirmation with atmospheric pressure chemical ionization mass
spectrometer (LC-APCI/MS) was developed by Gehring and coworkers (1996). Two
different SPE cartridges were used, first with strong cation cartridge and second with
reversed phase cartridge. Ten grams of sample was extracted with acetonitrile after

12
homogenization of the sample with a solution mixture of acetonitrile and 2 % acetic
acid (10:90). The extract was then partitioned with methylene chloride and the
concentrated extract was loaded to Bond Elute propylsulfonic acid. For HPLC
determination, sulphadiazine was eluted with a solution of 10 % acetonitrile in 0.2 M
H3PO4. For the confirmation, sulphadiazine was first eluted with 0.2 M H3PO4 from
the Bond Elute propylsulfonic acid SPE cartridge. The eluted solution was loaded to
Waters Sep-Pak Vac 6 cc, 1.0 g, trifunctional C18 SPE cartridge and the
sulphadiazine was eluted with methanol. For HPLC determination, the Inertsil ODS-2
(5 µm, 150 x 4.6 mm) column was used with acetonitrile-2 % acetic acid (10:90) as
the mobile phase. Fluorescence detector with excitation and emission wavelength at
400 and 495 nm, respectively was used. Sulphadiazine was derivatised with
fluorescamine solution using post column reaction system before being detected by
the fluorescence detector. The limit of detection for this method was 0.2 ppb and limit
of quantification was 1.0 ppb. For confirmation, a single quadrupole mass
spectrometer equipped with atmospheric pressure chemical ionization interface was
used. Positive ions were acquired in full scan or selected ion monitoring modes. The
presence of 10 ng sulphadiazine per gram of sample was confirmed by LC/APCI/MS
with the presence of sulphadiazine specific ions (m/z 252,158 and 96) and
sulphonamide class specific ions (m/z 156, 108 and 92).
Ito and coworkers (2000) developed a simple, rapid and reliable method for
the determination of ten sulphonamides in animal liver and kidney. Five grams of
sample was extracted with ethyl acetate and was evaporated to dryness. The residue
was then dissolved with 50 % ethyl acetate-hexane and was then applied to the Bond
Elute PSA cartridge. In order to get optimum recovery the ten sulphonamides were

13
eluted with a solution mixture of 20 % acetonitrile-0.05 M ammonium formate. The
sulphonamides were analyzed by HPLC using L-column ODS column (5 μm, 250 x
4.6 mm) and methanol-acetonitrile-0.05 M formic acid (10:15:75) as mobile phase
and detected using UV detector at 277 nm. The detection limit for ten sulphonamides
was 0.03 μg/g. For confirmation, the mass spectrometer used was Quatro 11
(Micromass, Altrincham, UK) equipped with electrospray ion source and the
instrument was operated in the positive mode with a daughter ion scan. The presence
of sulphadimidine (SDD) in the swine kidney and sulphamonomethoxine (SMX) in
the bovine kidney was confirmed with the present of m/z 279, 186, 156 and 92 ions
for SDD and m/z 281, 188, 156 and 92 ions for SMX, respectively.
Heller and coworkers (2002) developed a method for the determination of 16
sulphonamides in eggs. Ion Trap LC-MS-MS was used for confirmation and
quantitation was done with liquid chromatography and UV detector. Five gram
sample was extracted with acetonitrile and 3 ml water was added. After evaporation
of acetonitrile, the solution was loaded into C18 cartridge. The analyte was eluted
with acetonitrile and 1 ml water was added. The solution was concentrated to about
0.5 ml and was made to a final volume of 1 ml with water. Gradient elution was used
with a combination of (A) 0.1 % formic acid-methanol (90:10); (B) methanol and (C)
acetonitrile. The column used was Symmetry C8 (25 x 4.6 cm) and the UV detector
was set at 287 nm. The recovery of 50 ppb, 100 ppb and 200 ppb of fortified sample
was between 50 to 100 %. The author reported that the quantitation results with the
LC-MS-MS were not satisfactory in terms of linearity, recovery and standard
deviation.
14
The use of electrospray ionization LC-MS-MS for the confirmation and
quantitation of 10 sulphonamides in honey was developed by Verzegnassi and
coworkers (2002). Sulphonamides in honey were hydrolyzed to liberate sugar-bound
sulphonamides followed by liquid-liquid extraction. Analysis was carried out with an
‘Alliance’ 2690 HPLC system coupled to the Quattro LC-MS-MS. Gradient elution
was used with combination of solvent (A) 0.3 % formic acid and 5 % acetonitrile in
water and (B) 0.3 % formic acid in acetonitrile at the flow rate 0.2 ml/min. The
column used for separation was Nucleosil C18 HD (50 x 2 mm). The recovery of
spiked sample at 50 ppb is between 44 to 73 %.
Renew and coworker (2004) developed a method for the detection of
sulphonamides, fluoroquinolone and trimethoprim in waste water using tandem SPE
cartridges and electrospray LC-MS. In this tandem SPE cartridge, anion exchange
cartridge was stacked on the top of a hydrophilic-lipophilic balance cartridge.
Sulphamerazine was used as an internal standard for the quantitation of
sulphamethazine and sulphamethoxazole. A gradient mobile phase was used and a
combination of solvent A contained 1 mM ammonium acetate, 0.007 % (v/v) acetic
acid and 10 % acetonitrile and mobile phase B was 100 % acetonitrile. The flow rate
was 0.25 ml/min and the column used was 2.1 x 150 mm Zorbax SB-C18. The
detection limit for deionized water, final and secondary effluent ranged from 2 to 7
ng/L, 20 to 50 ng/L and 30 to 90 ng/L, respectively. The recovery for 1 ppb spiked
sample was between 37 to 129 %.
Beside the purification of the extract with SPE cartridge and detection by
HPLC and mass spectrometry as described above, a different method for the detection
15
of sulphonamides was done. Neidert and coworkers (1986) developed a rapid
quantitative determination of sulphathiazole by thin layer chromatography (TLC) and
densitometer in honey. Five gram of honey was extracted with dichloromethane and
later was evaporated to dryness. The residue obtained was dissolved with acetonitrile
and this solution was applied to the TLC plate. The TLC plate was then sprayed with
fluorescamine solution. The plate was read by densitometer at excitation and emission
wavelength 400 and 510 nm, respectively. In this quantitation method,
sulphaquinoxaline was used as the internal standard. The recovery of this method was
more than 98 % and the detection limit was 0.02 mg/kg.
Besides the above chromatographic methods for determination of
sulphonamides, Sheth and coworker (1990) developed enzyme immunoassay method
for the screening of sulphathiazole in honey. The detection limit for this method was
0.3 ppm and an estimated quantitation of sulphathiazole was also done. Capillary zone
electrophoresis was also used for the determination of sulphonamides (Ackermans et.
al., 1992). Sixteen sulphonamides were determined by the authors. The detection limit
by this method was between 2 to 9 ppm.
From the above discussion only one method was reported by Ion Trap MS-MS
technique for the determination of sulphonamide residues by liquid chromatography
mass spectrometer, but the author claimed that the quantitation results obtained was
unsatisfactory (Heller et. al.,2002). The other authors as mentioned above used single
quadrupole or triple stage quadrupole MS-MS. Therefore it is the objective of this
study to improve the quantitation results by Ion Trap MS-MS since this technique can
offer cheaper alternative for confirmatory analysis. To do this, the method needs to be
16
evaluated through validation process. From the validation study results, the reliability
of the method can be determined.
2.3 Electrospray Ionization Ion Trap Tandem Mass Spectrometer
Thermospray, Fast-Atom Bombardment, Atmospheric Pressure Chemical
Ionization, Electospray Ionization and Matrix-Assisted Laser Desorption Ionization
are ionization techniques for coupling of liquid chromatography with mass
spectrometer (Watson, 1985). Electrospray ionization is one of the most important
ionization techniques. Electrospray ionization can ionized small and big molecules at
atmospheric pressure and probably one of the most gentle ionization techniques for
the mass spectrometers (Bruins, 1998).
The nebulization of the effluent from the liquid chromatography in the
electrospray ionization was achieved with the disruption of liquid stream by the high
electric field at the spray needle into the small droplet. A potential between 3-5 kV
was applied to the spray needle. With this potential and a high velocity of hot nitrogen
gas flow, there will be a formation of a fine spray of highly charged aerosol of sample
ions at the tip of the capillary (Niessen, 1998). The ions will be transmitted from the
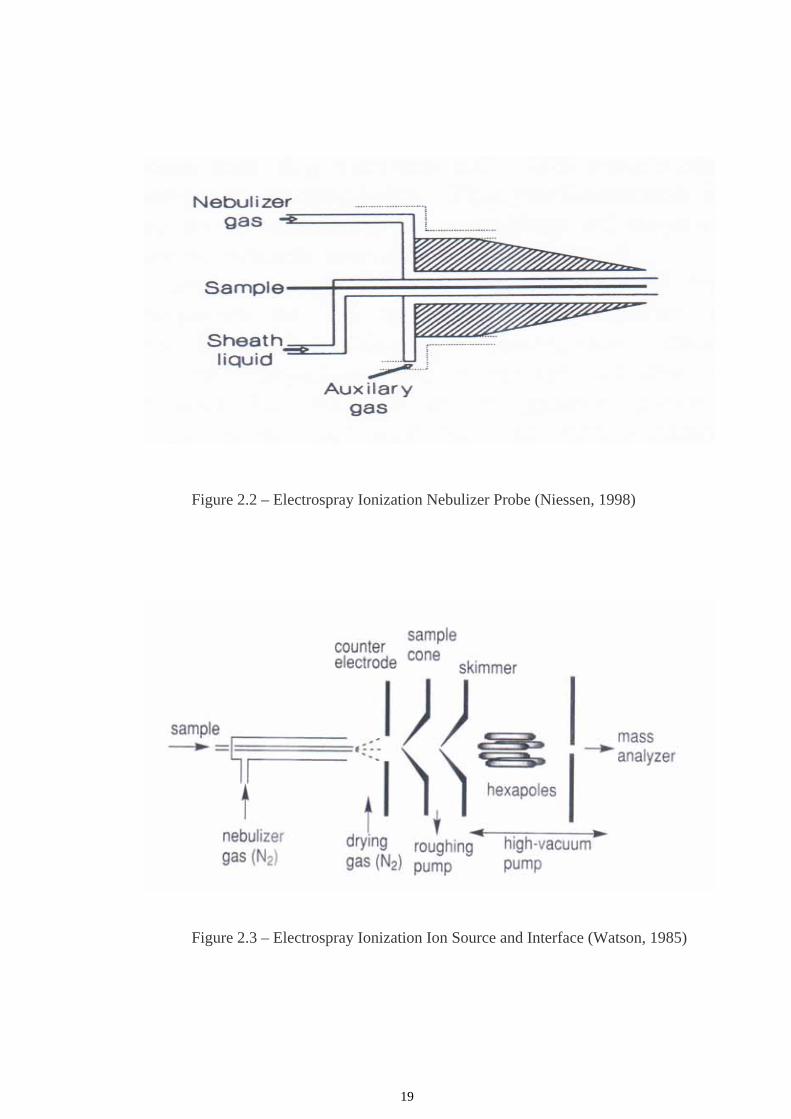
atmospheric pressure region to the high vacuum region of the mass analyzer via a low
pressure transport region which consists of two or more successive pumps, i.e. rough
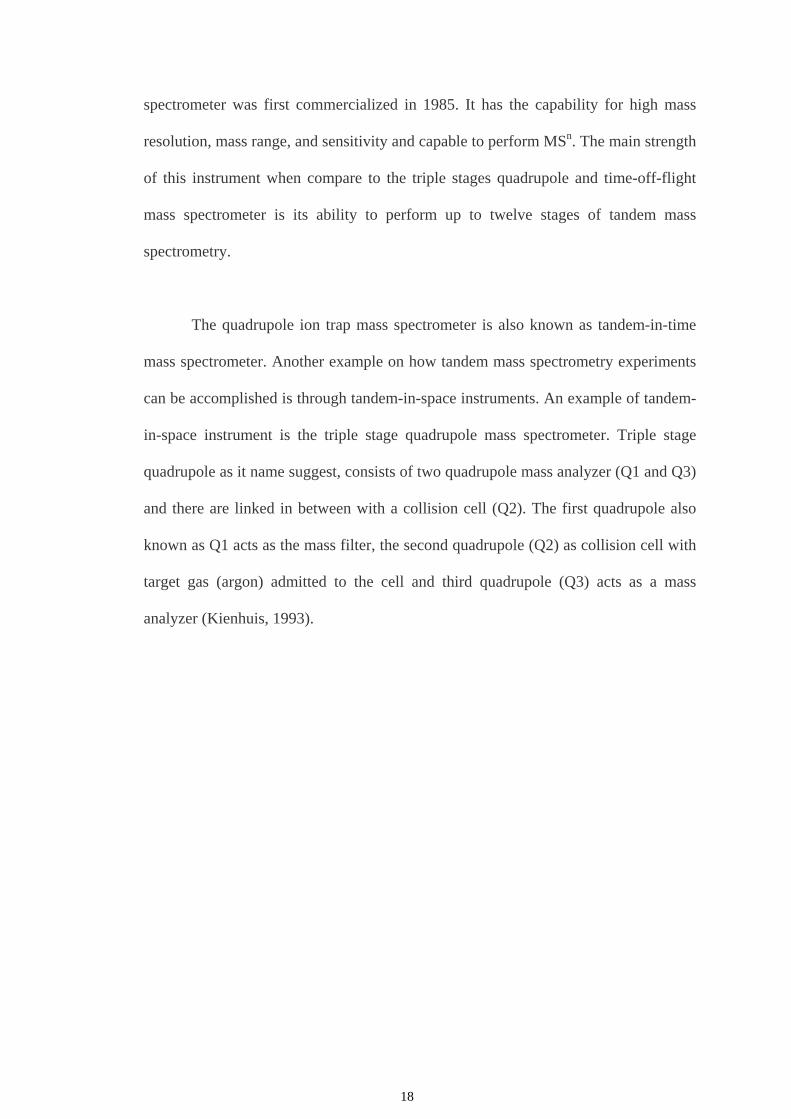
pump and high vacuum pump (Watson, 1985). Schematic diagram of nebulizer probe
for electrospry ionization is given in Figure 2.2. The sensitivity of the electrospray
ionization depends on the transmission efficiency of the ions to the mass analyzer. As
to improve transmission efficiency, earlier designs used ion lenses, followed by
17
multipoles (quadrupoles, hexapoles or octapoles) and the latest design used a stack of
ring electrodes (Watson, 1985). A typical schematic diagram of electrospray
ionization source and interface is shown in Figure 2.3.
The structure and theory behind the ion trap mass analyzer was elobrated in
detail by March (1997) and was quoted as follow. Ion trap mass analyzer consist of
four electrodes, two end-cap electrodes and another two are ring electrodes. These
four electrodes having hyperboloidal geometry shape. The ring electrode is positioned
symmetrically between two end-cap electrodes. The two end-cap electrodes can be
distinguished by the number of the hole at the center of each electrode. Electrons
and/or ions that were transported to the mass analyzer will be gated by the end-cap
electrode that has one hole and will be ejected out from the end-cap electrode that has
several holes, into electron multiplier. The quadrupole ion trap is a device which
functions both as an ion storage in which gaseous ions can be confined for a period of
time and as a mass spectrometer. The confinement of gaseous ions permits the study
of gas phase ion chemistry and the elucidation of ion structures by the use of repeated
stages of mass selection also known as tandem mass spectrometry (MS-MS). Tandem
mass spectrometry is a process of carrying out one mass-selective operation after
another. The objective of this operation is to isolate an ion species known as the
parent ion and the second operation is to determine the mass to charge ratio of
fragment ions due to the collision induced dissociation (CID).
The unique feature of ion trap mass analyzer was discussed by Karen and John
(1997). The quadrupole ion trap is a mass analyzer with a size of a tennis ball. It was
first invented by Wolfgang Paul in 1953 and the quadrupole ion trap mass
18
spectrometer was first commercialized in 1985. It has the capability for high mass
resolution, mass range, and sensitivity and capable to perform MSn. The main strength
of this instrument when compare to the triple stages quadrupole and time-off-flight
mass spectrometer is its ability to perform up to twelve stages of tandem mass
spectrometry.
The quadrupole ion trap mass spectrometer is also known as tandem-in-time
mass spectrometer. Another example on how tandem mass spectrometry experiments
can be accomplished is through tandem-in-space instruments. An example of tandem-
in-space instrument is the triple stage quadrupole mass spectrometer. Triple stage
quadrupole as it name suggest, consists of two quadrupole mass analyzer (Q1 and Q3)
and there are linked in between with a collision cell (Q2). The first quadrupole also
known as Q1 acts as the mass filter, the second quadrupole (Q2) as collision cell with
target gas (argon) admitted to the cell and third quadrupole (Q3) acts as a mass
analyzer (Kienhuis, 1993).
19
Figure 2.2 – Electrospray Ionization Nebulizer Probe (Niessen, 1998)
Figure 2.3 – Electrospray Ionization Ion Source and Interface (Watson, 1985)

20
2.4 Performance characteristics of test method validation
2.4.1 Specificity
Specificity was defined EURACHEM Guide (1998) as ‘The ability of the
method to determine accurately and specifically the analyte of interest in the presence
of other components in a sample matrix under the stated condition of test’. The
specificity of the method can be achieved in two ways; first through suitable
extraction methods and second through suitable detection techniques.
Microbial growth inhibition assay was the first method for the detection of
antimicrobial residue in foods, but this method have major disadvantages such as not
specific, limited detection level, only for qualitative assay and may cause false
positive results (Mitchell et al., 1998) and this reflects the lack of specificity by this
method. Gas chromatography and liquid chromatography are the chosen techniques in
term of specificity. Even though gas chromatography can provide better sensitivity,
this technique requires the sulphonamides to be derivatized before it can be injected
into the gas chromatograph (Guggisberg et. al., 1992). Nevertheless, the high
performance liquid chromatography (HPLC) was normally preferable technique to
avoide problem related to the derivatization with gas chromatography. Detection of
sulphonamides in food by HPLC was reviewed by Agrawal (1992). The specificity by
this technique was obtained through the used of column and mobile phase for the
separation and detection at specific wavelength by UV detector. However, HPLC is
not regarded as being sufficiently specific for use as a confirmatory technique in the
European Union (Kennedy, 1998). In a more recent study, detection of sulphonamides

21
by HPLC coupled with mass spectrometry has became more popular. This detector is
much more specific and provide unambiguous confirmation of the residues by
providing the ‘finger print’ of the investigated compound (Kennedy et. al., 1998). The
same reason was used for the selection of this technique in the research study.
2.4.2 Limit of Detection (LOD) and Limit of Quantitation (LOQ)
The LOD of a method of analysis is the lowest concentration of analyte in the
sample that can be detected and confirmed, but not necessarily quantified and the
LOQ of a method of analysis is the lowest concentration of the analyte that can be
quantified in a sample with an acceptable degree of certainty (EURACHEM Guide,
1998). For the instrumental method a signal to noise ratio of 3:1 is generally
acceptable to establish the LOD and 10:1 for the determination of LOQ (ICH
Guideline, 1996).
The values of LOD and LOQ are among one of the more important
performance characteristics to be determined in method validation as discussed in
section 2.2. Thus, logically the sensitivity of the method analysis can be observed
from the value of limit of detection (LOD) and limit of quantitation (LOQ). A method
with better sensitivity will have lower value of LOD and LOQ. For the determination
of drug residues in food, the developed method must have the capability to detect
residue below the maximum tolerance limit. For drugs with zero tolerance limits, the
most sensitive method for detection of the residue is needed.
22
For the analysis of drug residue such as chloramphenicol where the tolerance
limit was set at zero by the Food Regulation 1985, the detection method with highest
sensitivity is needed. For example the LOD for analysis of chloramphenicol in various
matrices by gas chromatography and liquid chromatography with UV detector was
between 0.1-50 ppb and 0.1-500 ppb, respectively (Oka et al., 1995), but in 2002 the
United States Food And Drug Administration developed a method for the detection of
chloramphenicol in shrimp where the value of LOD and LOQ was 0.08 ppb and 0.3
ppb, respectively by using tandem mass spectrometer (US FDA Laboratory
Information Bulletin). Therefore it is necessary to have a method with suitable
sensitivity to detect the drug residues to suit with the regulatory requirements.
2.4.3 Linearity study
The linearity of analytical procedure is its ability to obtain test results that are
directly, or by means of well-defined mathematical transformation, proportional to the
concentration of the analyte in the sample within the given range. Data from
calibration line will provide estimation of the degree of linearity. The slope of the
regression line and its variance provide mathematical measure of linearity and the
intercept is a measure of the potential method bias (Nata Technical Note No. 17,
1998).
23
2.4.4 Range
The range of analytical method is the interval between the upper and the lower
levels (including this level) that have been demonstrated to be determined with
precision, accuracy and linearity (Nata Technical Note No. 17, 1998).
2.4.5 Accuracy and Precision
The accuracy of analytical method is the closeness of agreement between the
test result and reference value. Accuracy is often normally studied as two component:
‘trueness’ and ‘precision’. The trueness of the method is an expression of how close
the mean of a set of results produced by the method, to the true value (EURACHEM
Guide, 1998).
Precision refers to the variability between repeated tests and can be measured
by the coefficient of variation of the recoveries. Precision normally refers to the three
conditions (EURACHEM Guide, 1998);
2.4.5.1 Repeatability
Repeatability refers to close agreement between the results of successive
measurement of the same measurand carried out in the same condition of
measurement. Repeatability is to assess the variability of test results following
execution of the method by one person in one laboratory.

24
2.4.5.2 Intermediate Precision
Intermediate precision expresses within laboratory variation. The extents to
which intermediate precision should be established, depends on the circumstances
under which the procedure are intended to be used. The effect of the random events
on the precision of the analytical procedure should be established. Typical variation to
be studied includes days, analysts, equipment, etc. It is not considered necessary to
study these effects individually. This process is to verify the capability the laboratory
to produce the same results once the method development is over.
2.4.5.3 Reproducibility
Reproducibility is assessed by means of an inter-laboratory trial.
Reproducibility should be considered in case of standardization of an analytical
procedure.
As a guideline for the acceptance criteria of the validation of analytical
method, a guideline by the Australian Pesticides and Veterinary Medicine Authority
(Residue Guideline No. 26, 2003) was followed. The value of coefficient of variation
(CV) was accepted if the value has not exceeded the value set in Table 2.1.
![PERHUBUNGAN MEDIA DAN PENGURUSAN ACARA BERNAMAmrembm.bernama.com/[MALAY]BROCHURE.pdf · Peranan BERNAMA sebagai sumber berita yang terkini dan boleh dipercayai amat dikenali dikalangan](https://static.fdocuments.net/doc/165x107/5d4af53d88c993b91f8b9451/perhubungan-media-dan-pengurusan-acara-malaybrochurepdf-peranan-bernama-sebagai.jpg)