Method Development and validation for related...
44
Page 168 of 305 CHAPTER 4 Method Development and validation for related substances of Omeprazole in API and formulations by UPLC. Introduction Omeprazole Formula : C 17 H 19 N 3 O 3 S CAS Number : 73590-58-6 Molecular Weight : 345.42 Synonyms : 1H-Benzimidazole,5-methoxy-2-[[(4-methoxy- 3,5-dimethyl- 2- pyridinyl)methyl]sulfinyl]; 5-Methoxy-2-(((4- methoxy- 3,5- dimethyl- 2- pyridyl)methyl)sulfinyl)benzimidazole; 2- (((3,5- Dimethyl-4- methoxy-2-pyridyl)methyl)sulfinyl)-5- methoxy- 1H-benzimidazole Melting point : 156 °C Omeprazole having chemical nomenclature of (RS)-5-methoxy-2-((4-methoxy-3,5- dimethylpyridin-2-yl) methylsulfinyl)-1H-benzo[d]imidazole belongs to a of class molecule called as proton pump inhibitors. Omeprazole was first approved in Sweden in 1988 for treatment of duodenal ulcer. It was approved in Canada and in the United States in 1989, for treatment of duodenal ulcer, gastric ulcers, reflux esophagitis, and Zollinger-Ellison syndrome 1 .The mechanism of action is by means of suppression of hydrochloric acid secretion by specific inhibition of the H+/K+-ATPase in the gastric parietal cell thereby reduces the acidity.
Transcript of Method Development and validation for related...

Page 168 of 305
CHAPTER 4
Method Development and validation for related substances
of Omeprazole in API and formulations by UPLC.
Introduction
Omeprazole
Formula : C17H19N3O3S
CAS Number : 73590-58-6
Molecular Weight : 345.42
Synonyms : 1H-Benzimidazole,5-methoxy-2-[[(4-methoxy- 3,5-dimethyl-
2- pyridinyl)methyl]sulfinyl]; 5-Methoxy-2-(((4-
methoxy- 3,5- dimethyl- 2-
pyridyl)methyl)sulfinyl)benzimidazole; 2- (((3,5-
Dimethyl-4- methoxy-2-pyridyl)methyl)sulfinyl)-5-
methoxy- 1H-benzimidazole
Melting point : 156 °C
Omeprazole having chemical nomenclature of (RS)-5-methoxy-2-((4-methoxy-3,5-
dimethylpyridin-2-yl) methylsulfinyl)-1H-benzo[d]imidazole belongs to a of class
molecule called as proton pump inhibitors. Omeprazole was first approved in Sweden
in 1988 for treatment of duodenal ulcer. It was approved in Canada and in the United
States in 1989, for treatment of duodenal ulcer, gastric ulcers, reflux esophagitis, and
Zollinger-Ellison syndrome1 .The mechanism of action is by means of suppression of
hydrochloric acid secretion by specific inhibition of the H+/K+-ATPase in the gastric
parietal cell thereby reduces the acidity.

Page 169 of 305
Omeprazole is one of the most widely prescribed drugs internationally even if many
advanced drugs in the same category are available thus large number of batches are
manufactured perennially in a lot of pharmaceutical companies.
So far very few methods have been reported for its determination of Assay by
Chemical methods2,3
. Some methods are also available in the literature for
determinations of Omeprazole by HPLC4-11
. The approximate runtime of the
pharmacopeial methods12-14
ranges from 40-70 min. The time taken for the analysis
significantly delays the batch to be released into the market. Hence there is a need for
the development of fast and reliable method for its routine analysis
So far, to the best of our knowledge, no validated, stability indicating related
substances method by UPLC has been reported for Omeprazole. Hence this method
was developed to quantitatively estimate Omeprazole and five of its impurities
namely Impurity A, B, C, D and E by UPLC .Moreover, this method can be
considered as first choice for analysis of Omeprazole related substances owing to its
extremely short run time providing separation of 5 impurities without compromising
on the selectivity of the method. The resolution between the closest peaks in the
method is 2.1 with a clear base to base separation.
The proposed method has been validated as per the International Conference on
Harmonization (ICH) guidelines15
and United State Pharmacopoeia (USP). The
parameters considered for method validation are specificity, precision, linearity, limit
of detection, limit of quantification, forced degradation, and ruggedness.
Active pharmaceutical ingredient standards and samples were procured as gift
samples from Interlabs India pvt ltd, Hyderabad, India. Omez capsules manufactured
by Dr. Reddy‘s Laboratories Limited, Hyderabad, India were procured commercially
to use them as dosage form for the analysis purpose. The HPLC grade Acetonitrile
and methanol and GR grade ortho phosphoric acid were purchased from HPLC Grade
- E. Merck (India) Ltd., Mumbai, analytical grade Sodium dihydrogen phosphate was
obtained from Spectrochem Pvt. Ltd., Mumbai (India),water was obtained from
Millipore Milli.Q Plus water purification system, Bedford, MA, USA.
Analytical grade hydrochloric acid, glacial acetic acid, sodium hydroxide pellets and
30% (v/v) hydrogen peroxide solution were obtained from Ranbaxy Fine Chemicals,
New Delhi (India).

Page 170 of 305
Omeprazole Structure confirmation:
1. Thermal Analysis
2.56 mg of the sample was weighed into an aluminum crucible of 25µL and placed
into a DSC. The thermogram was recorded from 20ºC to 250ºC which is carried out
under nitrogen atmosphere at 50mL/min, at 10ºC /min. The thermogram exhibited
sharp endotherm at 160.3 ºC with an onset of 158.6 ºC followed by decomposition as
depicted below
Figure 4.1- DSC Thermogram for Omeprazole
2. UV Study:
The Ultraviolet spectrum was recorded from 200 nm to 400 nm, with API
concentration of 0.0015% in methanol. The spectrum showed two λmax at 207 and
301 nm. As seen below.

Page 171 of 305
Figure 4.2- UV spectrum for Omeprazole
3. FTIR Study
The FTIR of spectrum of Omeprazole was recorded by preparation of pellet with
KBr. The assignments are given in table No 4.1.
Table 4.1- FTIR assignment table for Omeprazole
Wave Number (cm-1)
Assignment Vibration Mode
3242 -N-H Stretching
3059, 3006 Aromatic C-H Stretching
2985, 2904, 2802 Aliphatic C-H Stretching
1627, 1587, 1568 -C=C Stretching
1461, 1408, Aliphatic C-H Stretching
1204, 1016 Aryl alkyl ether C-O-C Stretching
1076 -S=O Stretching
822, 810 Aromatic C-H Stretching

Page 172 of 305
Figure 4.3-FTIR spectrum for Omeprazole
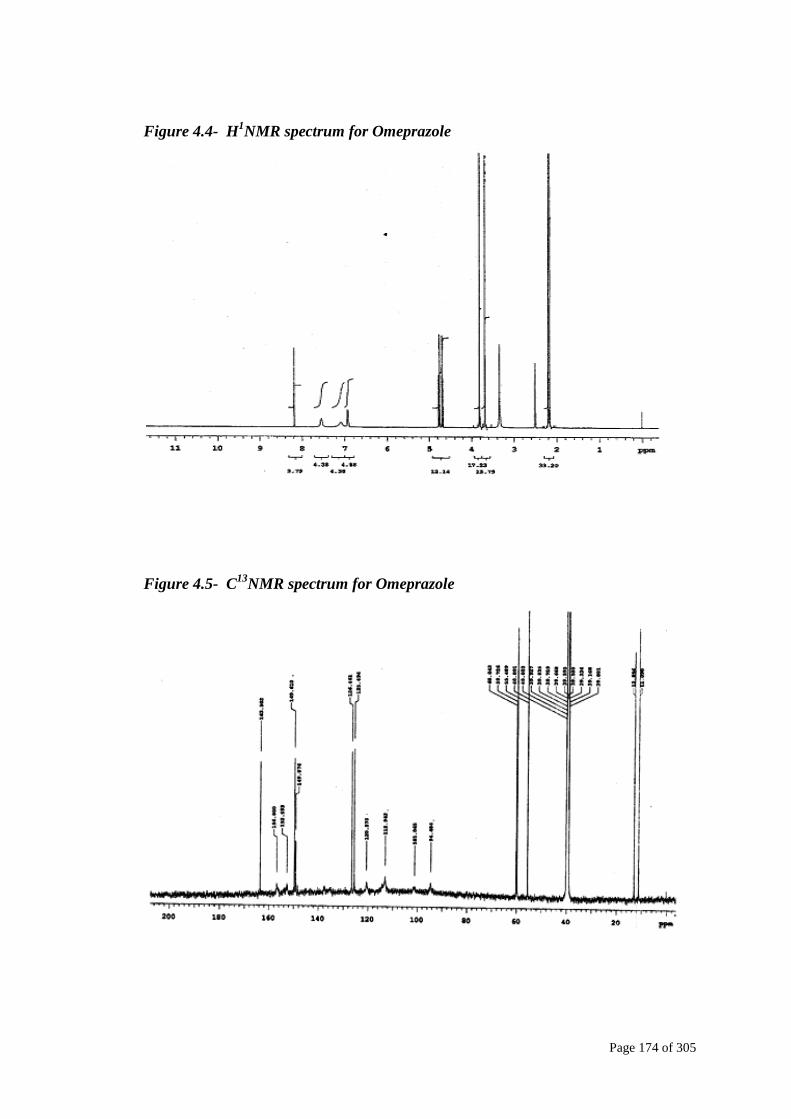
4. NMR Study
The 1H and
13C NMR spectra of Omeprazole were recorded in DMSO d6 at 400
MHz and 100 MHz respectively. The chemical shift values are reported on δ scale in
ppm with respect to TMS (0.00ppm) and DMSO d6 (39.5ppm) as internal standard.
Page 173 of 305
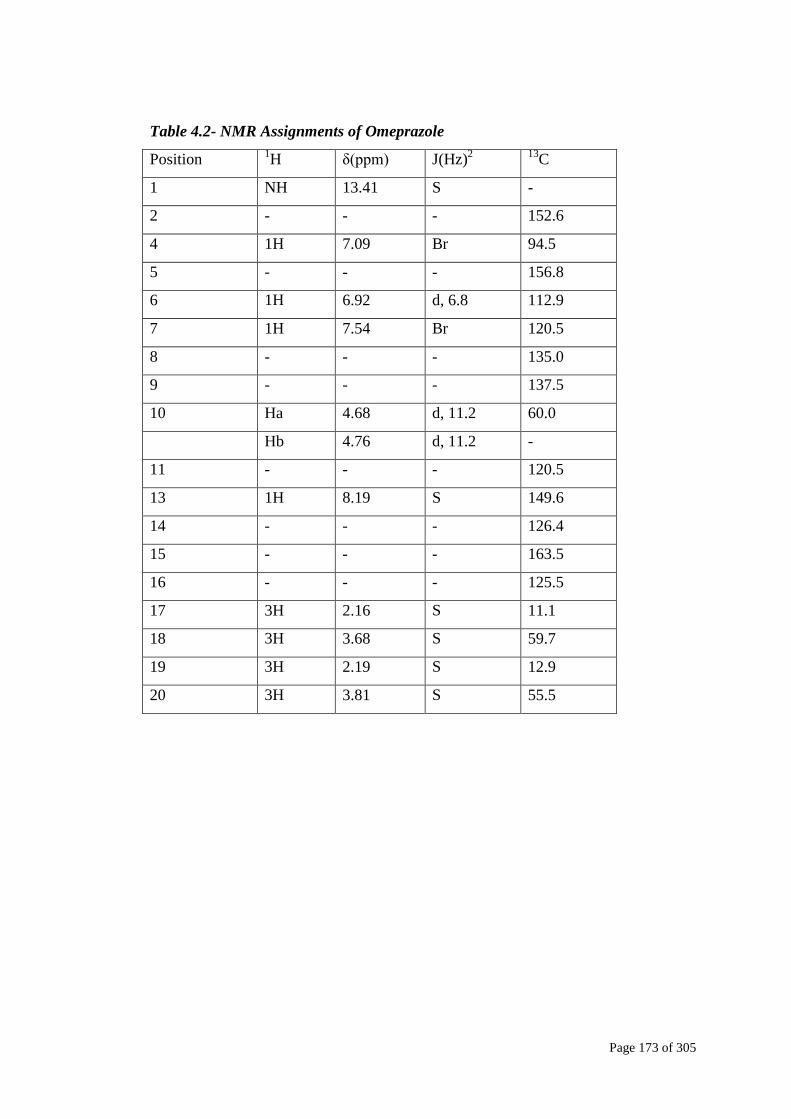
Table 4.2- NMR Assignments of Omeprazole
Position 1H δ(ppm) J(Hz)
2 13C
1 NH 13.41 S -
2 - - - 152.6
4 1H 7.09 Br 94.5
5 - - - 156.8
6 1H 6.92 d, 6.8 112.9
7 1H 7.54 Br 120.5
8 - - - 135.0
9 - - - 137.5
10 Ha 4.68 d, 11.2 60.0
Hb 4.76 d, 11.2 -
11 - - - 120.5
13 1H 8.19 S 149.6
14 - - - 126.4
15 - - - 163.5
16 - - - 125.5
17 3H 2.16 S 11.1
18 3H 3.68 S 59.7
19 3H 2.19 S 12.9
20 3H 3.81 S 55.5
Page 174 of 305
Figure 4.4- H1NMR spectrum for Omeprazole
Figure 4.5- C13
NMR spectrum for Omeprazole

Page 175 of 305
5. Mass Spectral study
The mass spectrum of Omeprazole was recorded on 4000-Q trap LCMSMS system.
The sample is introduced into the system through HPLC by bypassing the column.
The ESI +ve ionization spectrum of Omeprazole displayed a protonated molecular ion
at m/z= 346 which corresponds to the molecular formula C17H17N3O3S. The
fragmentation pattern was observed with product ion scan. The possible
fragmentation pattern is shown below (Figure 4.6).
Figure 4.6 Fragmentation pattern for Omeprazole

Page 176 of 305
Figure 4.7 Mass spectrum for Omeprazole

Page 177 of 305
Impurities in Omeprazole:
A. Following are the potential impurities in the manufacturing process of
Omeprazole:
1. Impurity –A:
Chemical Name : 5-Methoxy-1H- benzimidazole-2-thiol
Structure :
3. Impurity B
Omeprazole Sulphone Impurity
Chemical name :5-Methoxy-2-[[(4-methoxy-3,5-dimethylpyridin-2-yl)
methyl]sulphonyl]-1H-benzimidazole
Structure:
Page 178 of 305
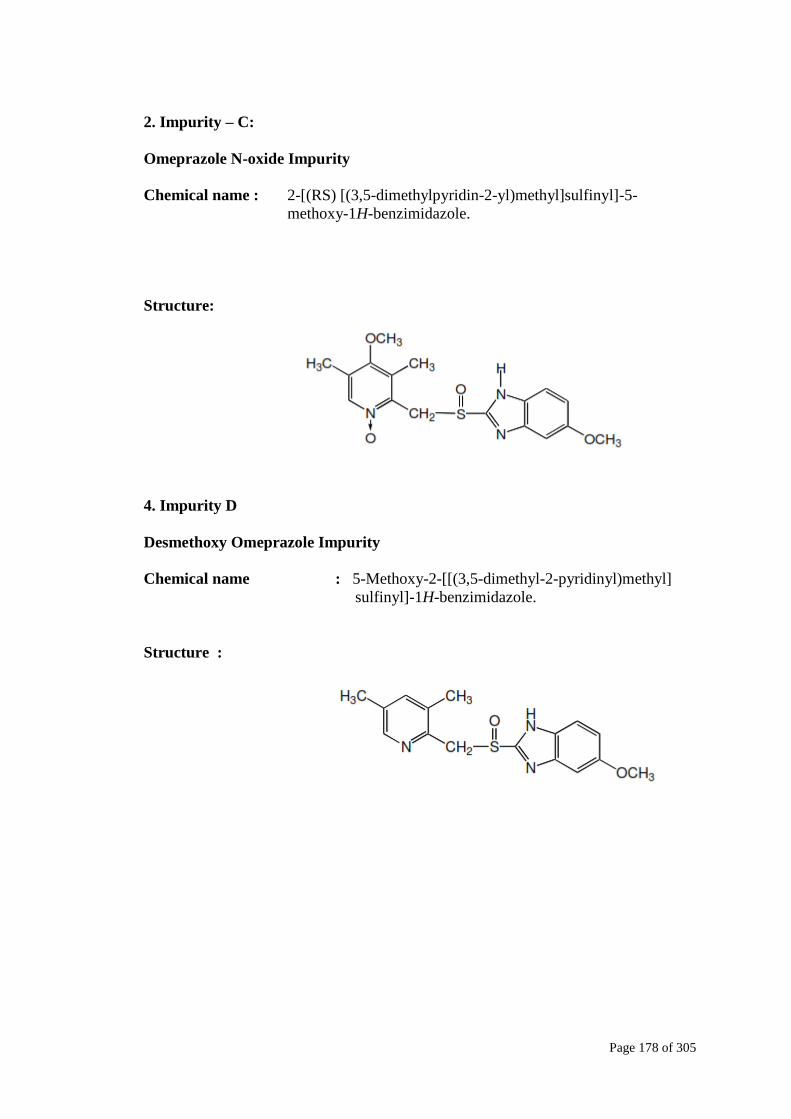
2. Impurity – C:
Omeprazole N-oxide Impurity
Chemical name : 2-[(RS) [(3,5-dimethylpyridin-2-yl)methyl]sulfinyl]-5-
methoxy-1H-benzimidazole.
Structure:
4. Impurity D
Desmethoxy Omeprazole Impurity
Chemical name : 5-Methoxy-2-[[(3,5-dimethyl-2-pyridinyl)methyl]
sulfinyl]-1H-benzimidazole.
Structure :
Page 179 of 305
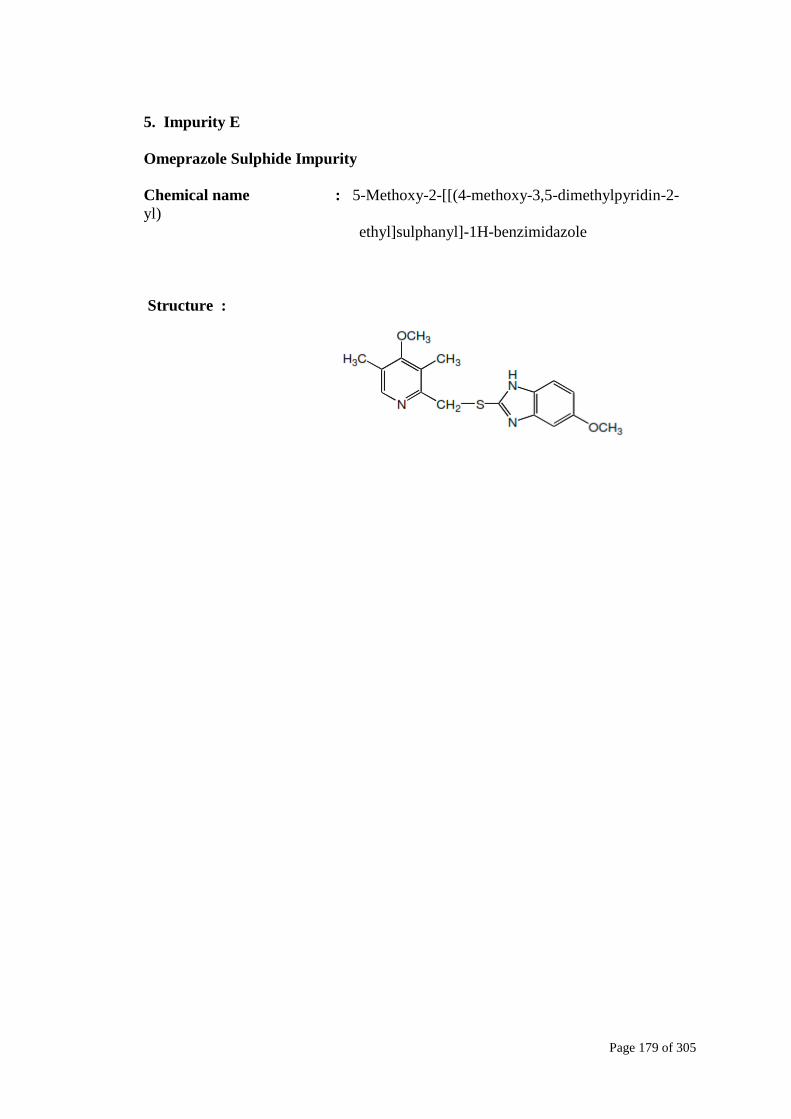
5. Impurity E
Omeprazole Sulphide Impurity
Chemical name : 5-Methoxy-2-[[(4-methoxy-3,5-dimethylpyridin-2-
yl)
ethyl]sulphanyl]-1H-benzimidazole
Structure :
Page 180 of 305
Method Development by UPLC
Objective:
To develop an analytical method for determination of related substances in a drug
product i.e. capsules containing Omeprazole By UPLC with the shortest possible run
time. The method should be capable of
Scope:
This method can be used for routine analysis in Quality control laboratories. This
method can also be applicable in Stability studies for determination of related
substance and also degradation products in API and capsules containing Omeprazole.
Chemicals and reagents:
All the solvents used i.e. Acetonitrile, Methanol, Water were of HPLC grade.
Selection of Mobile phase:
Omeprazole is known to degrade in acidic pH. That is the reason why the
formulations are enteric coated to be released in intestine where the pH is
comparatively basic. Due to this reason, the mobile phases particularly the aqueous
buffers need to be in basic side. The choice of buffers was made based on this reason.
The trials were initiated with borax, where the splitting in peaks was observed;
Ammonium acetate also had the same issue. However disodium hydrogen phosphate
showed improvement in peak shapes. The peak shapes and the separations could not
be achieved to the best of requirement, thus sodium dihydrogen orthophosphate was
selected with ph adjusted towards basic side. Mobile phase modifier, Triethylamine
was added in order to improve the peak shapes. The organic phase was also selected
to achieve better peak shapes and separations. Pure Acetonitrile did not separate all
the peaks. Hence a mixture of Acetonitrile and methanol was selected.
Page 181 of 305
Selection of Column:
The selection of the column was comparatively a short process. The first column used
was Kinetex 1.7µ XB-C-18 100A 50 x 2.1 mm. By using this column, all the
impurities did not elute within the run time and merging of peaks was observed, thus a
second column i.e. HSS T3, 100*2.1mm, 1.8µm was selected where the separations
improved significantly because of the better aqueous mobile phase compatibility.
Selection of Diluent:
On the basis of solubility of all the impurities as well as Omeprazole, the diluent was
selected to be 75:25% v/v :: Buffer : Acetonitrile .
Selection of wavelength:
Based on the UV spectra of Omeprazole and all the impurities, 280nm was selected
as the wavelength for this method.
Selection of column Oven temperature:
The aim of the experiment was to elute all the peaks as early as possible and to
achieve base to base separation for all the peaks thus the column oven temperature
was also increased to activate the column performance and achieve the separation.
Experiment 1:
Buffer: Disodium hydrogen phosphate buffer Ph 7.50
Mobile phase A: Buffer
Mobile phase B: Acetonitrile
Diluent: 0.01 M Borax: Acetonitrile (3:1)

Page 182 of 305
Chromatographic conditions:
Flow rate 0.3 ml/min
Wavelength 280 nm
Sample temperature NA
Column temperature 25°C
Injection volume 5 µl
Column : Waters BEH C18, 100X2.1 mm, 1.7µm
Figure 4.8- Chromatogram for experiment No 1
Gradient table
Time % A % B
0.01 80 20
5.00 80 20

Page 183 of 305
Observation:
Splitting of peak was observed for Omeprazole which may be due to diluent
incompatibility
Way forward:
As Omeprazole degrades even in weakly acidic media the scope of diluent selection is
very restricted, selection of buffer with higher pH in the range (7.0 to 8.0) should
help.
Experiment 2:
Buffer: Disodium hydrogen phosphate buffer Ph 7.50
Mobile phase A: Buffer
Mobile phase B: Acetonitrile
Diluent: Buffer: Acetonitrile (75:25)
Chromatographic conditions:
Flow rate 0.3 ml/min
Wavelength 280 nm
Sample temperature NA
Column temperature 25°C
Injection volume 5 µl
Column : Waters BEH C18, 100X2.1 mm, 1.7µm
Gradient table
Time % A % B
0.01 80 20
5.00 80 20
Page 184 of 305
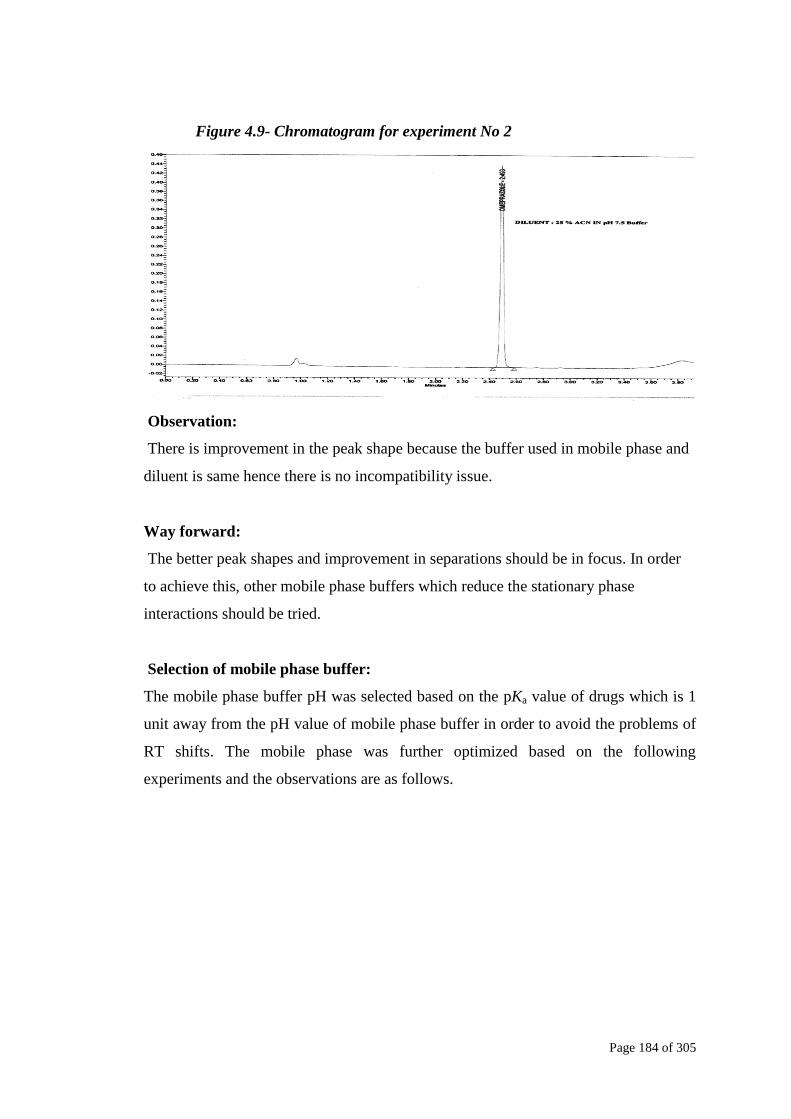
Figure 4.9- Chromatogram for experiment No 2
Observation:
There is improvement in the peak shape because the buffer used in mobile phase and
diluent is same hence there is no incompatibility issue.
Way forward:
The better peak shapes and improvement in separations should be in focus. In order
to achieve this, other mobile phase buffers which reduce the stationary phase
interactions should be tried.
Selection of mobile phase buffer:
The mobile phase buffer pH was selected based on the pKa value of drugs which is 1
unit away from the pH value of mobile phase buffer in order to avoid the problems of
RT shifts. The mobile phase was further optimized based on the following
experiments and the observations are as follows.

Page 185 of 305
Experiment 3:
Buffer: Ammonium Acetate buffer pH 6.0
Mobile phase A : Buffer
Mobile phase B: Acetonitrile
Diluent: Buffer: Acetonitrile (75:25)
Chromatographic conditions:
Flow rate 0.3 ml/min
Wavelength 280 nm
Sample temperature NA
Column temperature 25°C
Injection volume 5 µl
Column Waters BEH C18, 100X2.1 mm, 1.7µm
Gradient table
Time % A % B
0.01 80 20
0.50 80 20
1.50 50 50
2.50 40 60
2.7 80 20
3.0 80 20

Page 186 of 305
Figure 4.10- Chromatogram for experiment No 3
Observation:
Peak shapes are distorted when ammonium acetate buffer is used in mobile phase.
Way forward:
Switching to more suitable buffer with higher pH should help improve the peak
shapes. The second issue of solution stability with Omeprazole can also be addressed
by this change.
Experiment 4:
Buffer: Disodium Hydrogen Phosphate Buffer pH 7.5
Mobile phase A: Buffer
Mobile phase B: Acetonitrile
Diluent: Buffer: Acetonitrile (75:25)

Page 187 of 305
Chromatographic conditions:
Flow rate 0.3 ml/min
Wavelength 280 nm
Sample temperature NA
Column temperature 50°C
Column : HSS T3, 100 x 2.1mm, 1.8µm
Figure 4.11- Chromatogram for experiment No 4
Gradient table
Time % A % B
0.01 75 25
0.50 70 30
1.50 65 35
2.00 55 45
2.30 10 90
2.60 10 90
2.70 75 25
3.00 75 25

Page 188 of 305
Observation:
Peak shape and resolution between peaks was found to be satisfactory, however
the peaks sharpness still needs to be improved.
Result:
Switching to phosphate buffer with higher pH helped in achieving good peak
shape and better resolution between the API and its related impurities.
Way forward:
The wavelength of detection is 280 nm as this is the λmax of Omeprazole. The
response of the impurities needs to be improved for better detection.
Optimization of injection volume:
Injection volume need to be optimized keeping in mind the peak shapes, resolution
and response of related substances at the same time care should be taken to avoid
column overloading.
Experiment 5:
Buffer: Disodium Hydrogen Phosphate Buffer pH 7.5
Mobile phase A: Buffer
Mobile phase B: Acetonitrile
Diluent: Buffer: Acetonitrile (75:25)
Chromatographic conditions:
Flow rate 0.3 ml/min
Wavelength 280 nm
Sample temperature NA
Column temperature 50°C
Injection volume 6µl
Column : HSS T3, 100 x 2.1mm, 1.8µm

Page 189 of 305
Figure 4.12- Chromatogram for experiment No 5
Observation:
There is low response in impurity peaks. This may not be suitable as at low
concentrations, the peak areas cannot be quantified with precision and accuracy.
Way forward:
Further higher injection volumes where impurities can be quantified with
precision and accuracy without impacting column performance should help.
Gradient table
Time % A % B
0.01 75 25
0.50 70 30
1.50 65 35
2.00 55 45
2.30 10 90
2.60 10 90
2.70 75 25
3.00 75 25

Page 190 of 305
Experiment 6:
Buffer: Disodium Hydrogen Phosphate Buffer pH 7.5
Mobile phase A: Buffer
Mobile phase B: Acetonitrile
Diluent: Buffer: Acetonitrile (75:25)
Chromatographic conditions:
Flow rate 0.3mL/min
Wavelength 280 nm
Sample temperature NA
Injection volume 8µl
Column temperature 30, 40,50°C
Column : HSS T3, 100 x 2.1mm, 1.8µm
Gradient table
Time % A % B
0.01 75 25
0.50 70 30
1.50 65 35
2.00 55 45
2.30 10 90
2.60 10 90
2.70 75 25
3.00 75 25
Page 191 of 305
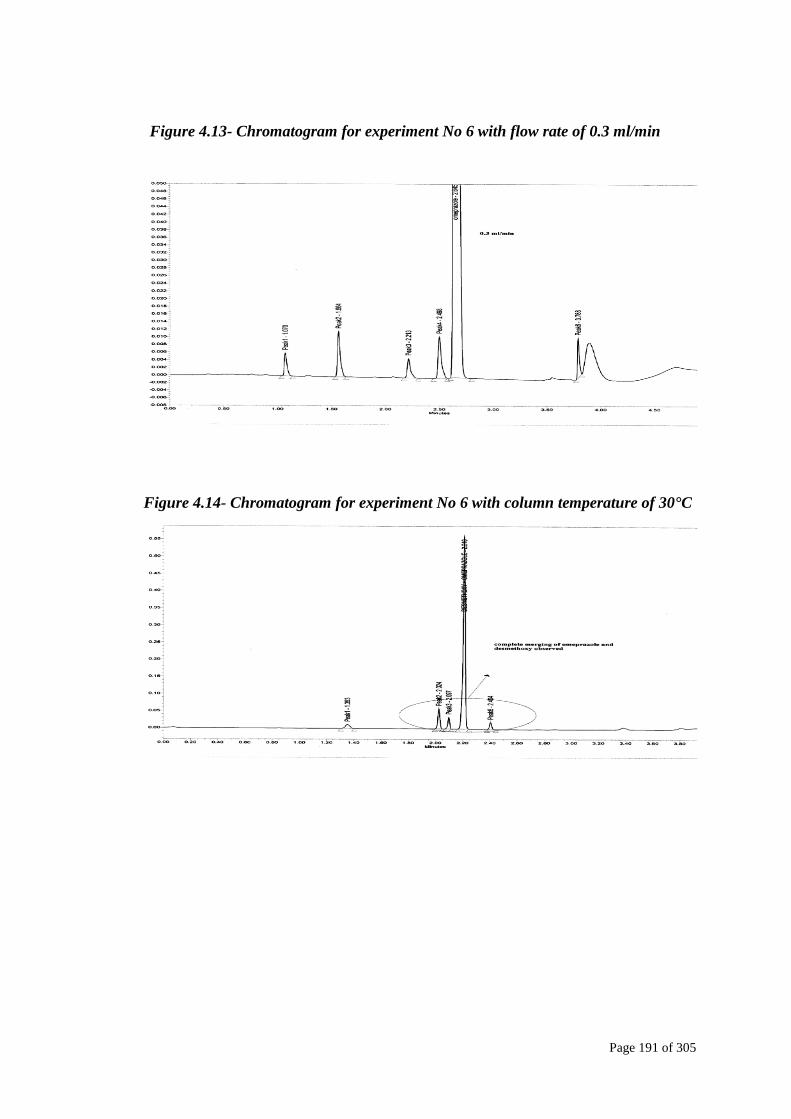
Figure 4.13- Chromatogram for experiment No 6 with flow rate of 0.3 ml/min
Figure 4.14- Chromatogram for experiment No 6 with column temperature of 30°C

Page 192 of 305
Figure 4.15- Chromatogram for experiment No 6 with column temperature of 40°C
Figure 4.16- Chromatogram for experiment No 6 with column temperature of 50°C
Observation:
Acceptable response observed from impurities which the peaks can quantified
with precision and accuracy.
Way forward:
In both the cases i.e. 0.3mL/min as well as 0.6mL/min, the peak shapes and
resolutions were found to be good thus flow rate of 0.6ml/min can be finalized.
Optimization of flow rate:

Page 193 of 305
Mobile phase flow rate has been optimized keeping in mind the resolution, peak
shape and system pressure as 0.6mL/min as the
Optimization of Column Oven Temperature:
Temperature has been optimized with optimal resolution, peak shape and system
pressure.
Experiment 7
Buffer: Disodium Hydrogen Phosphate Buffer pH 7.5
Mobile phase A: Buffer
Mobile phase B: Acetonitrile
Diluent: Buffer: Acetonitrile (75:25)
Chromatographic conditions:
Flow rate 0.6 ml/min
Wavelength 280 nm
Sample temperature NA
Injection volume 8µl
Column temperature 50°C
Column : Zorbax SB C8 4.6x50 mm, 1.8µ

Page 194 of 305
Figure 4.17- Chromatogram for experiment No 7
Observation:
As seen from Figure 4.17, reduction of resolution between few peaks is observed.
Way forward:
The experimentation with C8 column to bring the nonpolar impurities closer has
resulted in reduced resolution between few peaks.
Gradient table
Time % A % B
0.01 75 25
0.50 70 30
1.50 65 35
2.00 55 45
2.30 10 90
2.60 10 90
2.70 75 25
3.00 75 25

Page 195 of 305
Experiment 8
Buffer: Disodium Hydrogen Phosphate Buffer pH 7.5
Mobile phase A: Buffer
Mobile phase B: Acetonitrile
Diluent: Buffer: Acetonitrile (75:25)
Chromatographic conditions:
Flow rate 0.6 ml/min
Wavelength 280 nm
Sample temperature NA
Injection volume 8µl
Column temperature 50°C
Column : Kinetex 1.7µ XB-C-18 100A 50 x 2.1 mm
Gradient table
Time % A % B
0.01 75 25
0.50 70 30
1.50 65 35
2.00 55 45
2.30 10 90
2.60 10 90
2.70 75 25
3.00 75 25

Page 196 of 305
Figure 4.18- Chromatogram for experiment No 8
Observation:
Further reduction resolution between few peaks was observed which may be due to
change in non polarity and dimensions of the stationary phase
Way forward:
The experiments with respect to stationary phase e.g. Kinetex 1.7µ XB-C-18 100A 50
x 2.1 mm used in experiment No 8 did not improve the method performance. The use
of ―HSS T3, 100 x 2.1mm, 1.8µm‖ has produced the best resolutions so far owing to
its capability to separate the polar and nonpolar compounds because of the T3
bonding.

Page 197 of 305
Optimized chromatographic conditions
Buffer preparation:
Weigh and transfer 1.40 gms of sodium dihydrogen phosphate in 1000 ml of water ,
add 1ml of triethylamine, adjust pH to 7.5 with dilute ortho phosphoric acid, filter
through 0.22µm membrane filter.
Mobile phase A : Buffer
Mobile phase B : Mixed Acetonitrile and Methanol in the ratio 900 : 100 and sonicate
for 5 mins.
Chromatographic conditions:
Column : HSS T3 100 x 2.1 mm, 1.8 µ
Column temperature : 50˚C
Wavelength : 280 nm
Flow rate : 0.6 ml/m
Sample comp temperature : NA
Injection volume : 8 µl
Gradient Program
Time % A % B
0.0 75 25
0.50 70 30
1.50 65 35
2.00 55 45
2.30 10 90
2.60 10 90
Table 4.3- Relative retention time table for all the impurities with respect to
Omeprazole
IMP name RRT
BENZIMIDAZOLE 0.42
DES METHOXY 0.93
NOXIDE 0.57
SULFONE 0.82
SULFIDE 1.34
OMEPRAZOLE 1.00

Page 198 of 305
Analytical method validation
Analytical method validation is a process that demonstrates the suitability of the
proposed procedures for the intended purpose. More specifically, it is a matter of
establishing documented evidence providing a high degree of assurance with respect
to the consistency of the method and results. It evaluates the product against defined
specifications. The validation parameters viz., specificity, accuracy, precision,
linearity, limit of detection, limit of quantitation, robustness, system suitability have
to be evaluated as per the ICH guidelines for all analytical methods developed by
HPLC.
Validation Characteristics
The following validation characteristics were verified as per the ICH guidelines.
System suitability
Specificity
Linearity
Accuracy
Precision
LOD & LOQ
System suitability
This is an integral part of development of a chromatographic method to verify
that the resolution and reproducibility of the system are adequate enough for the
analysis to be performed. It is based on the concept that the equipment, electronics,
analytical operations and samples constituting an integral system could be evaluated
as a whole. Parameters such as plate number (N), asymmetry or tailing factors (As),
relative retention time (RRT), resolution (Rs) and reproducibility (% R.S.D), retention
time were determined. These parameters were determined during the analysis of a
"sample" containing the main components and related substances. System suitability
terms were determined and compared with the recommended limits (1≥As ≤2 and
Rs>1.5).

Page 199 of 305
Specificity
Specificity is the ability of the method to measure the analyte response in
presence of its process related impurities. The specificity of the developed HPLC
method was performed by injecting blank solution and standard solution spiked with
process-related impurities separately The chromatogram of drug with impurities was
compared with the blank chromatogram, to verify the blank interference. No peak was
observed at the retention time of Omeprazole and its impurities. Hence the method is
specific for the determination of Omeprazole and its combination product.
Precision of Test method
System precision of the method was evaluated by injecting the standard solution six
times and percent relative standard deviation (% R.S.D) for area of none of the peaks
was more than 0.5%. This proves the system precision of the test method. The
precision of the method for the determination of impurities related to Omeprazole
peaks was studied for repeatability at 100 % level. Repeatability was demonstrated by
analyzing the standard solution spiked with impurities for six times. The % R.S.D for
peak area of each impurity was calculated. Repeatability for Omeprazole and its
impurities were found to be optimum Thus proves that this method is precise. The
results are given in Table No 4.4.
Table 4.4- Precision results for Omeprazole and its impurities
S.No. RRF AVG SD %RSD
Benimidazole 0.72 0.188 0.0007 0.36
n-oxide 1.41 0.232 0.0006 0.25
Sulfone 0.85 0.205 0.0005 0.25
desmethoxy 1.18 0.258 0.0014 0.55
Sulfide 0.78 0.239 0.0012 0.50
TOTAL IMP NA 1.122 0.0023 0.21

Page 200 of 305
Figure 4.19- Chromatogram obtained with optimized chromatographic conditions
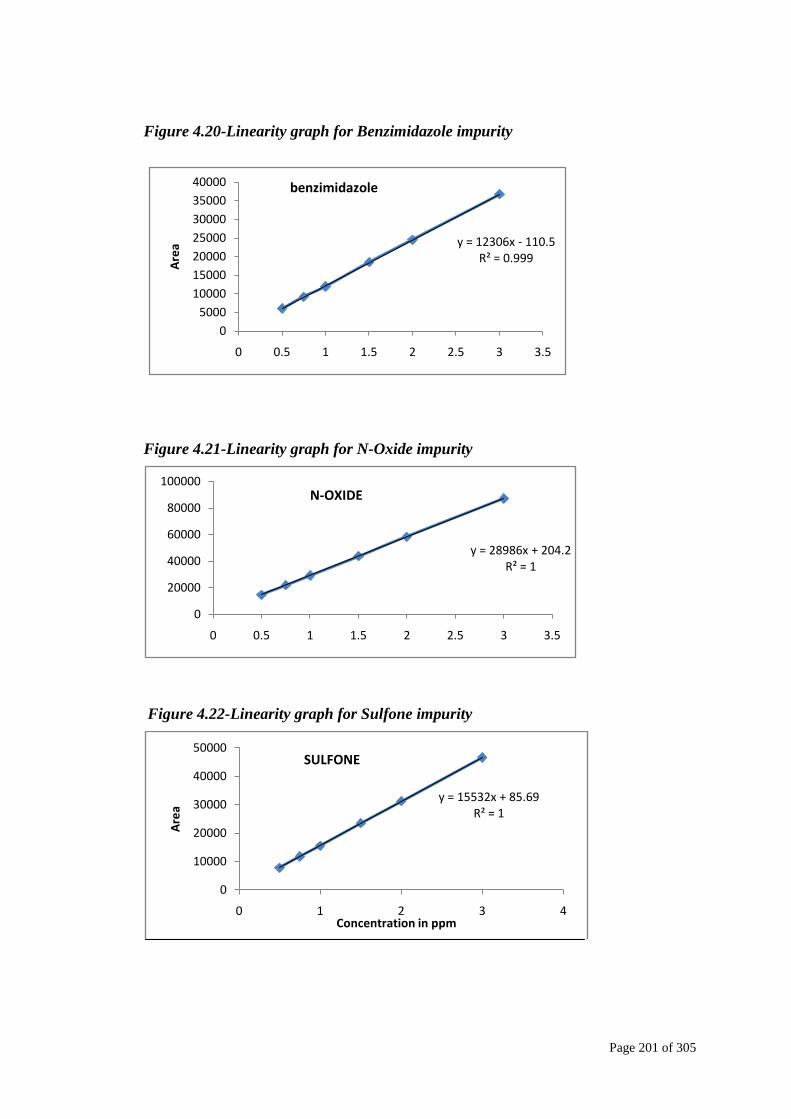
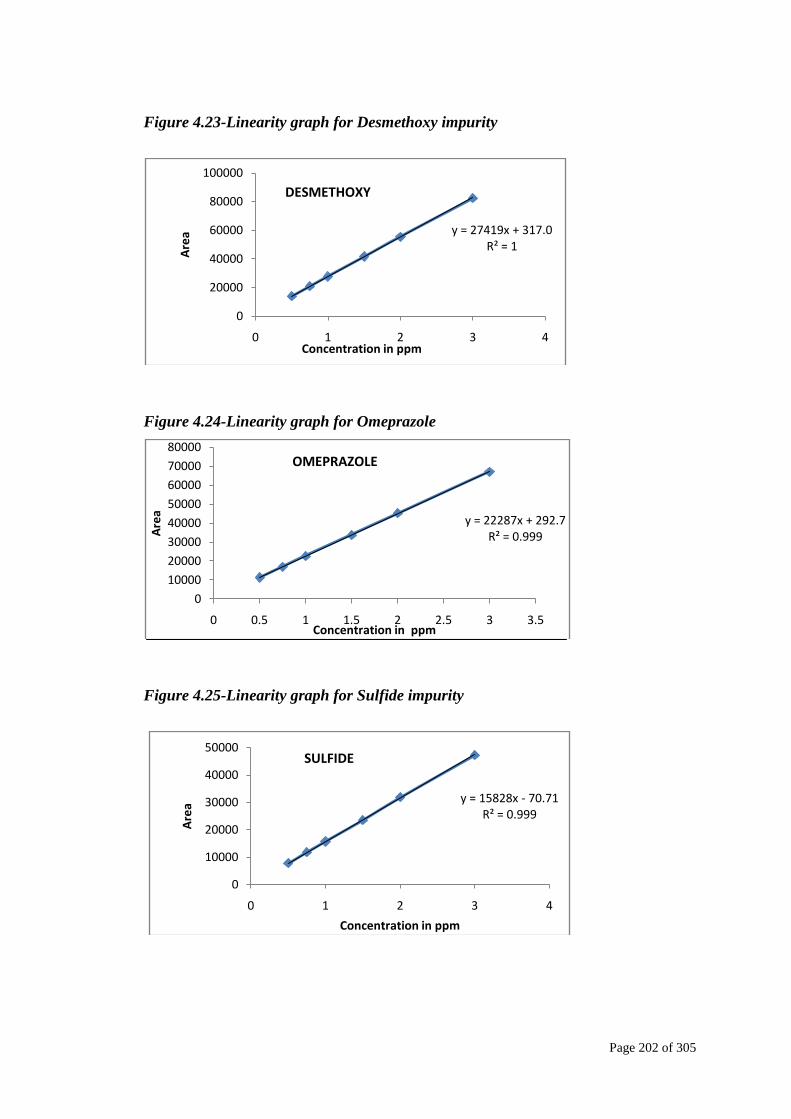
Linearity
Standard solutions at different concentration levels ranging from 50% of the spec
level to 300% of the specification limit were prepared and analyzed. In order to
demonstrate the linearity of detector response for Omeprazole and its impurities, the
linearity plot was drawn taking the concentration on X-axis and the mean peak area
on Y-axis. The data were subjected to statistical analysis using a linear-regression
model. The regression equations and correlation coefficients (r2) are given in Tables
below.
Page 201 of 305
Figure 4.20-Linearity graph for Benzimidazole impurity
Figure 4.21-Linearity graph for N-Oxide impurity
Figure 4.22-Linearity graph for Sulfone impurity
y = 12306x - 110.5R² = 0.999
0
5000
10000
15000
20000
25000
30000
35000
40000
0 0.5 1 1.5 2 2.5 3 3.5
Are
abenzimidazole
y = 28986x + 204.2R² = 1
0
20000
40000
60000
80000
100000
0 0.5 1 1.5 2 2.5 3 3.5
N-OXIDE
y = 15532x + 85.69R² = 1
0
10000
20000
30000
40000
50000
0 1 2 3 4
Are
a
Concentration in ppm
SULFONE
Page 202 of 305
Figure 4.23-Linearity graph for Desmethoxy impurity
Figure 4.24-Linearity graph for Omeprazole
Figure 4.25-Linearity graph for Sulfide impurity
y = 27419x + 317.0R² = 1
0
20000
40000
60000
80000
100000
0 1 2 3 4
Are
a
Concentration in ppm
DESMETHOXY
y = 22287x + 292.7R² = 0.999
0
10000
20000
30000
40000
50000
60000
70000
80000
0 0.5 1 1.5 2 2.5 3 3.5
Are
a
Concentration in ppm
OMEPRAZOLE
y = 15828x - 70.71R² = 0.999
0
10000
20000
30000
40000
50000
0 1 2 3 4
Are
a
Concentration in ppm
SULFIDE

Page 203 of 305
Accuracy of test method
Accuracy of the test method was determined by analyzing Omeprazole substance
spiked with impurities at five different concentration levels of 50 %, 75%, 100
%,150%, 200% and 300 % of each at the specified limit. The mean recoveries of all
the impurities were calculated individually and are represented in the table 4.5 for
Omeprazole and all the impurities.
Table 4.5- Accuracy results of Omeprazole and its impurities
IMP name ACCURACY
50 % 75 % 100 % 150 % 200 % 300 %
BENZIMIDAZOLE 101.17 98.26 99.86 98.67 98.02 98.20
DES METHOXY 103.31 98.74 102.32 98.38 98.28 97.57
NOXIDE 101.48 97.67 101.44 97.43 97.37 96.85
SULFONE 102.68 99.41 102.18 98.91 98.65 98.23
SULFIDE 102.40 98.32 102.47 98.34 99/.81 98.70
OMEPRAZOLE 99.01 101.30 98.32 97.74 98.32 99.03
Limit of detection (LOD) and limit of quantitation (LOQ)
Limit of detection or LOD is the lowest level at which the impurity or API peak can
be observed or in other words can be distinguished from that of the system noise.
Limit of quantitation or LOQ is the lowest level at which the impurity or API can be
quantitatively estimated with an acceptable accuracy. This estimation was performed
by means of the slope method. The calculation was carried by means of the following
formula.
SLOD 3.3
Where = standard deviation of intercept
S = slope of the calibration curve
SLOQ 10
Where = standard deviation of intercept
S = slope of the calibration curve

Page 204 of 305
The high level of sensitivity of the method can be observed by means of low levels of
the LOD and LOQ values.
Figure 4.26-LOQ Chromatogram for Omeprazole and its impurities
Table 4.6-LOQ precision for Omeprazole and its impurities
IMP name Avg %of imp % Stdev %RSD
BENZIMIDAZOLE 0.03 0.00 0.088
DES METHOXY 0.01 0.00 1.15
NOXIDE 0.01 0.00 1.68
SULFONE 0.02 0.00 1.19
SULFIDE 0.02 0.00 1.50
OMEPRAZOLE 0.02 0.00 0.89

Page 205 of 305
Table 4.7-LOQ Accuracy for Omeprazole and its impurities
S.No. RRT LOQ Accuracy
Benimidazole 0.42 95.02
n-oxide 0.57 94.90
sulfone 0.82 94.68
Desmethoxy 0.93 104.91
Omeprazole 1.00 99.89
Sulfide 1.34 94.68
Page 206 of 305
FORCED DEGRADATION STUDY
The forced degradation of a drug product is performed as a part of method
development or method validation in order to check the degradation product peaks
that are appearing in the chromatogram when the drug product is exposed to extreme
conditions. This is essentially to test the capability of the test method to check if the
method is able to separate any peak thus formed in any of the degradation conditions.
Stability testing of an active substance or finished product provide evidence on how
the quality of a drug substance or drug product varies with time influenced by a
variety of environmental conditions like temperature, humidity and light etc,.
Knowledge from stability studies enables understanding of the long-term effects of
the environment on the drugs. Stability testing provides information about
degradation mechanisms, potential degradation products, possible degradation path
ways of drug as well as interaction between the drug and the excepients in drug
product.
Forced degradation study was carried out by treating the sample under the
following conditions
Acid degradation
Capsule samples containing approx 50 mg of Omeprazole was weighed and
transferred into 100 ml volumetric flask and 5 ml of 1N HCl was added to it. The
solution was warmed on a water bath at 80 °C for 2 hr and then neutralized with 5 ml
of 1N NaOH. The neutralized solution was made up to the volume with diluent.
Alkali degradation
Capsule samples containing approx 50 mg of Omeprazole was weighed and
transferred into 100 ml volumetric flask and 5 ml of 1N NaOH was added to it. The
solution was warmed on a water bath at 80 °C for 2 hr and then neutralized with 5 ml
of 1N HCl. The neutralized solution was made up to the volume with diluent.
Oxidative degradation
Capsule samples containing approx 50 mg of Omeprazole was weighed and
transferred into 100 ml volumetric flask and 5 ml of 1 % Hydrogen peroxide solution
was added to it. The solution was warmed on water bath at 80 °C for 1 hr. Then the
above mixture was kept aside for few minutes, and the volume was made up with
diluent.

Page 207 of 305
The above stressed samples were analyzed as per the test procedure using Photodiode
Array detector. The results are summarized in table No 4.7
Table 4.8-Forced degradation results including the %degradation
Spl condition Degradation
conditions
%
Degradation
Mass
Balance
Acid
degradation spl 1 N HCl for 5 min 3.326 99.71
Base
degradation spl
1N NaoH heat fo
30min 60°C 0.249 99.02
Peroxide
degradation spl 3% H2O2 30 min 60°C 68.31 102.99
Thermal
degradation spl 105°C 12 Hrs 1.952 100.80
Uv light
exposed spl
Exposed 254 nm for
1.2 Mn lux hrs 1.849 99.80
Sunlight
exposed spl
Exposed to direct
sunlight for 55 Hrs 0.378 100.55
Table 4.9 Forced degradation results with peak purity plot values
Spl Condition Purity angle Purity threshold Purity Flag
Spl as such 0.818 1.005 No
Thermal spl 0.813 1.434 No
Acid spl 0.567 2.397 No
Base spl 0.462 1.037 No
Peroxide spl 0.205 1.904 No
Uv spl 0.466 1..186 No
Visible spl 0.404 1.054 No

Page 208 of 305
Figure 4.27-Purity plot for Omeprazole
Figure 4.28-Chromatogram of acid degradation sample

Page 209 of 305
Figure 4.29-Chromatogram of base degradation sample
Figure 4.30-Chromatogram of peroxide degradation sample

Page 210 of 305
Figure 4.31-Chromatogram of Thermal degradation sample
Conclusion:
A method for determination of Omeprazole and its related substances has been
successfully developed by UPLC. This method is having lot of advantages owing to
its extremely short run time. This method has also been validated as per ICH
guidelines. The method has demonstrated the stability indicating capability as it has
complied the acceptance criteria of separating all the unknown degradation products
arising from various stress studies, namely acid, base and peroxide.
The method is found to be specific, precise, linear and accurate in the range of its
intended application. This method is suitable for use in routine analysis in any quality
control laboratory and if applied will prove to be extremely beneficial for the
organization and the end user i.e. the patient.

Page 211 of 305
References:
1. D Israel, M.; E Hassall.; Journal of Pediatric Gastroenterology & Nutrition, 27 - 5 -
pp 568-579 (November 1998)
2.S Pinzauti.; P Gratteri.; S Furlanetto.; P Mura.; E Dreassi.; R. Phan-Tan-Luu,
Journal of Pharmaceutical and Biomedical Analysis, 14, 8–10, pp 881–889 (June
1996)
3.. A. Radi, Journal of Pharmaceutical and Biomedical Analysis, 31,5, pp1007-1012
(2003)
4. H K. Trivedi1.; M C. Patel.; International Journal of ChemTech Research, 2, 3, pp
1355-1367, ( 2010)
5. M Mathew, V. Das Gupta and R E. Bailey, Drug Development and Industrial
Pharmacy, 21, 8 , pp 965-971 (1995)
6. W-K Kang, D-S Kim, K-I Kwon, Archives of Pharmacal Research, 22, 1, pp 86-88
(1999).
7. G W Sluggett.; J D Stong.; J H Adams.; Z Zhao, Journal of Pharmaceutical and
Biomedical Analysis‘ 25, 3–4, , pp 357–361 (June 2001)
8. P K F Yeung.; R Little.; YQ Jiang.; S J Buckley.; P.T Pollak.;H Kapoor.; S.J.O
Veldhuyzen van Zantenb, Journal of Pharmaceutical and Biomedical Analysis
17, 8, pp 1393–1398(1998)
9. L Sivasubramanian.; V Anilkumar, Indian J Pharm Sci, 69,5, pp 674-676 (2007)
10. P. V Rao.; Ch. K. Sanjeeva Reddy.; M. Ravi Kumar.; & Dantu Durga Raoa.;
Journal of Liquid Chromatography & Related Technologies, 35,16 (2012)
11. N L Rezk.; K C Brown, A D M Kashub, Journal of Chromatography B
844, 2, 5, pp 314–321(December 2006)
12. The British Pharmacopoeia, Her Majesty‘s Stationery Office, London, (2000).
13. The Indian Pharmacopoeia, Government of India Ministry of Health and
Family Welfare, the Controller of Publications, Delhi, (1996).
14. United States Pharmacopoeia and National Formulary
15. ICH, Q2(R1): Analytical Validation-Methodology November (1996).