Method Comparison between the VERSANT HCV RNA 1.0 Assay ...
1
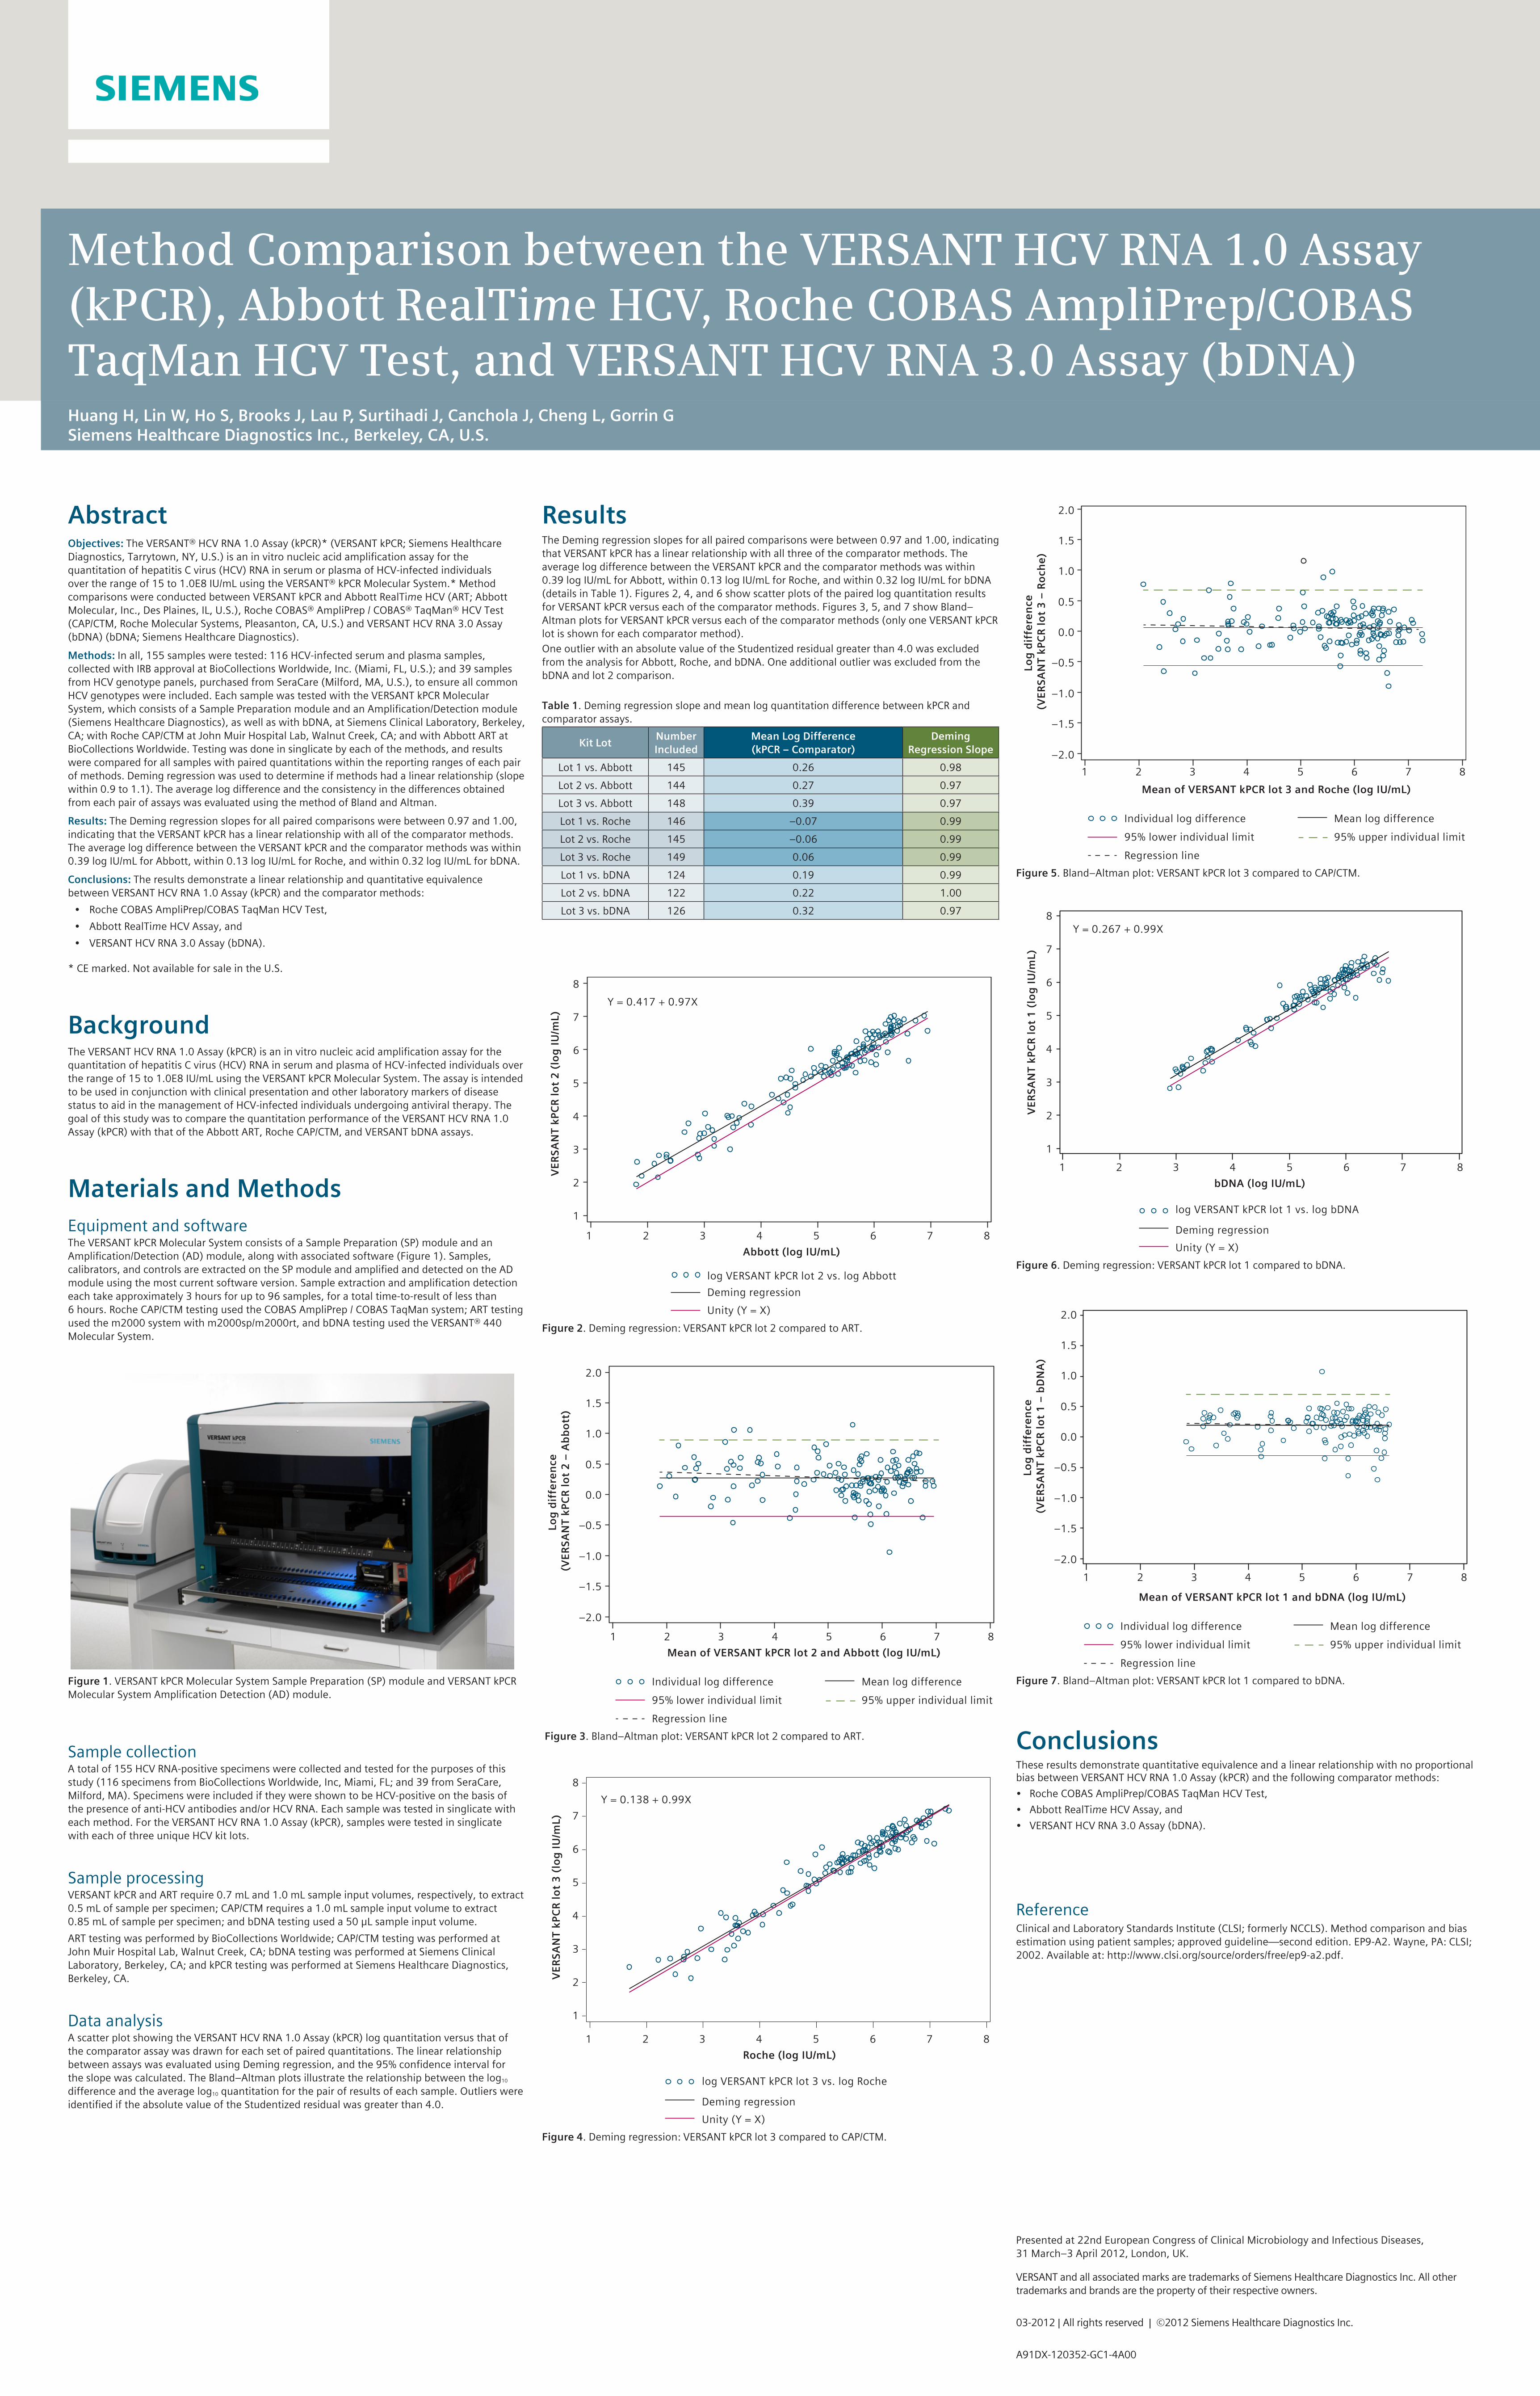
Method Comparison between the VERSANT HCV RNA 1.0 Assay (kPCR), Abbott RealTime HCV, Roche COBAS AmpliPrep/COBAS TaqMan HCV Test, and VERSANT HCV RNA 3.0 Assay (bDNA) Huang H, Lin W, Ho S, Brooks J, Lau P, Surtihadi J, Canchola J, Cheng L, Gorrin G Siemens Healthcare Diagnostics Inc., Berkeley, CA, U.S. Abstract Objectives: The VERSANT® HCV RNA 1.0 Assay (kPCR)* (VERSANT kPCR; Siemens Healthcare Diagnostics, Tarrytown, NY, U.S.) is an in vitro nucleic acid amplification assay for the quantitation of hepatitis C virus (HCV) RNA in serum or plasma of HCV-infected individuals over the range of 15 to 1.0E8 IU/mL using the VERSANT® kPCR Molecular System.* Method comparisons were conducted between VERSANT kPCR and Abbott RealTime HCV (ART; Abbott Molecular, Inc., Des Plaines, IL, U.S.), Roche COBAS® AmpliPrep / COBAS® TaqMan® HCV Test (CAP/CTM, Roche Molecular Systems, Pleasanton, CA, U.S.) and VERSANT HCV RNA 3.0 Assay (bDNA) (bDNA; Siemens Healthcare Diagnostics). Methods: In all, 155 samples were tested: 116 HCV-infected serum and plasma samples, collected with IRB approval at BioCollections Worldwide, Inc. (Miami, FL, U.S.); and 39 samples from HCV genotype panels, purchased from SeraCare (Milford, MA, U.S.), to ensure all common HCV genotypes were included. Each sample was tested with the VERSANT kPCR Molecular System, which consists of a Sample Preparation module and an Amplification/Detection module (Siemens Healthcare Diagnostics), as well as with bDNA, at Siemens Clinical Laboratory, Berkeley, CA; with Roche CAP/CTM at John Muir Hospital Lab, Walnut Creek, CA; and with Abbott ART at BioCollections Worldwide. Testing was done in singlicate by each of the methods, and results were compared for all samples with paired quantitations within the reporting ranges of each pair of methods. Deming regression was used to determine if methods had a linear relationship (slope within 0.9 to 1.1). The average log difference and the consistency in the differences obtained from each pair of assays was evaluated using the method of Bland and Altman. Results: The Deming regression slopes for all paired comparisons were between 0.97 and 1.00, indicating that the VERSANT kPCR has a linear relationship with all of the comparator methods. The average log difference between the VERSANT kPCR and the comparator methods was within 0.39 log IU/mL for Abbott, within 0.13 log IU/mL for Roche, and within 0.32 log IU/mL for bDNA. Conclusions: The results demonstrate a linear relationship and quantitative equivalence between VERSANT HCV RNA 1.0 Assay (kPCR) and the comparator methods: • Roche COBAS AmpliPrep/COBAS TaqMan HCV Test, • Abbott RealTime HCV Assay, and • VERSANT HCV RNA 3.0 Assay (bDNA). * CE marked. Not available for sale in the U.S. Background The VERSANT HCV RNA 1.0 Assay (kPCR) is an in vitro nucleic acid amplification assay for the quantitation of hepatitis C virus (HCV) RNA in serum and plasma of HCV-infected individuals over the range of 15 to 1.0E8 IU/mL using the VERSANT kPCR Molecular System. The assay is intended to be used in conjunction with clinical presentation and other laboratory markers of disease status to aid in the management of HCV-infected individuals undergoing antiviral therapy. The goal of this study was to compare the quantitation performance of the VERSANT HCV RNA 1.0 Assay (kPCR) with that of the Abbott ART, Roche CAP/CTM, and VERSANT bDNA assays. Materials and Methods Equipment and software The VERSANT kPCR Molecular System consists of a Sample Preparation (SP) module and an Amplification/Detection (AD) module, along with associated software (Figure 1). Samples, calibrators, and controls are extracted on the SP module and amplified and detected on the AD module using the most current software version. Sample extraction and amplification detection each take approximately 3 hours for up to 96 samples, for a total time-to-result of less than 6 hours. Roche CAP/CTM testing used the COBAS AmpliPrep / COBAS TaqMan system; ART testing used the m2000 system with m2000sp/m2000rt, and bDNA testing used the VERSANT® 440 Molecular System. Figure 1. VERSANT kPCR Molecular System Sample Preparation (SP) module and VERSANT kPCR Molecular System Amplification Detection (AD) module. Sample collection A total of 155 HCV RNA-positive specimens were collected and tested for the purposes of this study (116 specimens from BioCollections Worldwide, Inc, Miami, FL; and 39 from SeraCare, Milford, MA). Specimens were included if they were shown to be HCV-positive on the basis of the presence of anti-HCV antibodies and/or HCV RNA. Each sample was tested in singlicate with each method. For the VERSANT HCV RNA 1.0 Assay (kPCR), samples were tested in singlicate with each of three unique HCV kit lots. Sample processing VERSANT kPCR and ART require 0.7 mL and 1.0 mL sample input volumes, respectively, to extract 0.5 mL of sample per specimen; CAP/CTM requires a 1.0 mL sample input volume to extract 0.85 mL of sample per specimen; and bDNA testing used a 50 μL sample input volume. ART testing was performed by BioCollections Worldwide; CAP/CTM testing was performed at John Muir Hospital Lab, Walnut Creek, CA; bDNA testing was performed at Siemens Clinical Laboratory, Berkeley, CA; and kPCR testing was performed at Siemens Healthcare Diagnostics, Berkeley, CA. Data analysis A scatter plot showing the VERSANT HCV RNA 1.0 Assay (kPCR) log quantitation versus that of the comparator assay was drawn for each set of paired quantitations. The linear relationship between assays was evaluated using Deming regression, and the 95% confidence interval for the slope was calculated. The Bland–Altman plots illustrate the relationship between the log 10 difference and the average log 10 quantitation for the pair of results of each sample. Outliers were identified if the absolute value of the Studentized residual was greater than 4.0. Results The Deming regression slopes for all paired comparisons were between 0.97 and 1.00, indicating that VERSANT kPCR has a linear relationship with all three of the comparator methods. The average log difference between the VERSANT kPCR and the comparator methods was within 0.39 log IU/mL for Abbott, within 0.13 log IU/mL for Roche, and within 0.32 log IU/mL for bDNA (details in Table 1). Figures 2, 4, and 6 show scatter plots of the paired log quantitation results for VERSANT kPCR versus each of the comparator methods. Figures 3, 5, and 7 show Bland– Altman plots for VERSANT kPCR versus each of the comparator methods (only one VERSANT kPCR lot is shown for each comparator method). One outlier with an absolute value of the Studentized residual greater than 4.0 was excluded from the analysis for Abbott, Roche, and bDNA. One additional outlier was excluded from the bDNA and lot 2 comparison. Table 1. Deming regression slope and mean log quantitation difference between kPCR and comparator assays. Kit Lot Number Included Mean Log Difference (kPCR – Comparator) Deming Regression Slope Lot 1 vs. Abbott 145 0.26 0.98 Lot 2 vs. Abbott 144 0.27 0.97 Lot 3 vs. Abbott 148 0.39 0.97 Lot 1 vs. Roche 146 –0.07 0.99 Lot 2 vs. Roche 145 –0.06 0.99 Lot 3 vs. Roche 149 0.06 0.99 Lot 1 vs. bDNA 124 0.19 0.99 Lot 2 vs. bDNA 122 0.22 1.00 Lot 3 vs. bDNA 126 0.32 0.97 Y = 0.417 + 0.97X VERSANT kPCR lot 2 (log IU/mL) 8 7 6 5 4 3 2 1 Abbott (log IU/mL) 1 2 3 4 5 6 7 8 log VERSANT kPCR lot 2 vs. log Abbott Deming regression Unity (Y = X) Figure 2. Deming regression: VERSANT kPCR lot 2 compared to ART. Log difference (VERSANT kPCR lot 2 – Abbott) –2.0 –1.5 –1.0 –0.5 0.0 0.5 1.0 1.5 2.0 Mean of VERSANT kPCR lot 2 and Abbott (log IU/mL) 1 2 3 4 5 6 7 8 Individual log difference Mean log difference 95% lower individual limit 95% upper individual limit Regression line Figure 3. Bland–Altman plot: VERSANT kPCR lot 2 compared to ART. Y = 0.138 + 0.99X VERSANT kPCR lot 3 (log IU/mL) 8 7 6 5 4 3 2 1 Roche (log IU/mL) 1 2 3 4 5 6 7 8 log VERSANT kPCR lot 3 vs. log Roche Deming regression Unity (Y = X) Figure 4. Deming regression: VERSANT kPCR lot 3 compared to CAP/CTM. Log difference (VERSANT kPCR lot 3 – Roche) –2.0 –1.5 –1.0 –0.5 0.0 0.5 1.0 1.5 2.0 1 2 3 4 5 6 7 8 Mean of VERSANT kPCR lot 3 and Roche (log IU/mL) Individual log difference Mean log difference 95% lower individual limit 95% upper individual limit Regression line Figure 5. Bland–Altman plot: VERSANT kPCR lot 3 compared to CAP/CTM. Y = 0.267 + 0.99X VERSANT kPCR lot 1 (log IU/mL) 8 7 6 5 4 3 2 1 bDNA (log IU/mL) 1 2 3 4 5 6 7 8 log VERSANT kPCR lot 1 vs. log bDNA Deming regression Unity (Y = X) Figure 6. Deming regression: VERSANT kPCR lot 1 compared to bDNA. Log difference (VERSANT kPCR lot 1 – bDNA) –2.0 –1.5 –1.0 –0.5 0.0 0.5 1.0 1.5 2.0 1 2 3 4 5 6 7 8 Mean of VERSANT kPCR lot 1 and bDNA (log IU/mL) Individual log difference Mean log difference 95% lower individual limit 95% upper individual limit Regression line Figure 7. Bland–Altman plot: VERSANT kPCR lot 1 compared to bDNA. Conclusions These results demonstrate quantitative equivalence and a linear relationship with no proportional bias between VERSANT HCV RNA 1.0 Assay (kPCR) and the following comparator methods: • Roche COBAS AmpliPrep/COBAS TaqMan HCV Test, • Abbott RealTime HCV Assay, and • VERSANT HCV RNA 3.0 Assay (bDNA). Reference Clinical and Laboratory Standards Institute (CLSI; formerly NCCLS). Method comparison and bias estimation using patient samples; approved guideline—second edition. EP9-A2. Wayne, PA: CLSI; 2002. Available at: http://www.clsi.org/source/orders/free/ep9-a2.pdf. Presented at 22nd European Congress of Clinical Microbiology and Infectious Diseases, 31 March–3 April 2012, London, UK. VERSANT and all associated marks are trademarks of Siemens Healthcare Diagnostics Inc. All other trademarks and brands are the property of their respective owners. 03-2012 | All rights reserved | ©2012 Siemens Healthcare Diagnostics Inc. A91DX-120352-GC1-4A00
Transcript of Method Comparison between the VERSANT HCV RNA 1.0 Assay ...
Method Comparison between the VERSANT HCV RNA 1.0 Assay (kPCR), Abbott RealTime HCV, Roche COBAS AmpliPrep/COBAS TaqMan HCV Test, and VERSANT HCV RNA 3.0 Assay (bDNA)Huang H, Lin W, Ho S, Brooks J, Lau P, Surtihadi J, Canchola J, Cheng L, Gorrin GSiemens Healthcare Diagnostics Inc., Berkeley, CA, U.S.
AbstractObjectives: The VERSANT® HCV RNA 1.0 Assay (kPCR)* (VERSANT kPCR; Siemens Healthcare Diagnostics, Tarrytown, NY, U.S.) is an in vitro nucleic acid amplification assay for the quantitation of hepatitis C virus (HCV) RNA in serum or plasma of HCV-infected individuals over the range of 15 to 1.0E8 IU/mL using the VERSANT® kPCR Molecular System.* Method comparisons were conducted between VERSANT kPCR and Abbott RealTime HCV (ART; Abbott Molecular, Inc., Des Plaines, IL, U.S.), Roche COBAS® AmpliPrep / COBAS® TaqMan® HCV Test (CAP/CTM, Roche Molecular Systems, Pleasanton, CA, U.S.) and VERSANT HCV RNA 3.0 Assay (bDNA) (bDNA; Siemens Healthcare Diagnostics).Methods: In all, 155 samples were tested: 116 HCV-infected serum and plasma samples, collected with IRB approval at BioCollections Worldwide, Inc. (Miami, FL, U.S.); and 39 samples from HCV genotype panels, purchased from SeraCare (Milford, MA, U.S.), to ensure all common HCV genotypes were included. Each sample was tested with the VERSANT kPCR Molecular System, which consists of a Sample Preparation module and an Amplification/Detection module (Siemens Healthcare Diagnostics), as well as with bDNA, at Siemens Clinical Laboratory, Berkeley, CA; with Roche CAP/CTM at John Muir Hospital Lab, Walnut Creek, CA; and with Abbott ART at BioCollections Worldwide. Testing was done in singlicate by each of the methods, and results were compared for all samples with paired quantitations within the reporting ranges of each pair of methods. Deming regression was used to determine if methods had a linear relationship (slope within 0.9 to 1.1). The average log difference and the consistency in the differences obtained from each pair of assays was evaluated using the method of Bland and Altman.Results: The Deming regression slopes for all paired comparisons were between 0.97 and 1.00, indicating that the VERSANT kPCR has a linear relationship with all of the comparator methods. The average log difference between the VERSANT kPCR and the comparator methods was within 0.39 log IU/mL for Abbott, within 0.13 log IU/mL for Roche, and within 0.32 log IU/mL for bDNA. Conclusions: The results demonstrate a linear relationship and quantitative equivalence between VERSANT HCV RNA 1.0 Assay (kPCR) and the comparator methods:
• Roche COBAS AmpliPrep/COBAS TaqMan HCV Test, • Abbott RealTime HCV Assay, and • VERSANT HCV RNA 3.0 Assay (bDNA).
* CE marked. Not available for sale in the U.S.
BackgroundThe VERSANT HCV RNA 1.0 Assay (kPCR) is an in vitro nucleic acid amplification assay for the quantitation of hepatitis C virus (HCV) RNA in serum and plasma of HCV-infected individuals over the range of 15 to 1.0E8 IU/mL using the VERSANT kPCR Molecular System. The assay is intended to be used in conjunction with clinical presentation and other laboratory markers of disease status to aid in the management of HCV-infected individuals undergoing antiviral therapy. The goal of this study was to compare the quantitation performance of the VERSANT HCV RNA 1.0 Assay (kPCR) with that of the Abbott ART, Roche CAP/CTM, and VERSANT bDNA assays.
Materials and MethodsEquipment and softwareThe VERSANT kPCR Molecular System consists of a Sample Preparation (SP) module and an Amplification/Detection (AD) module, along with associated software (Figure 1). Samples, calibrators, and controls are extracted on the SP module and amplified and detected on the AD module using the most current software version. Sample extraction and amplification detection each take approximately 3 hours for up to 96 samples, for a total time-to-result of less than 6 hours. Roche CAP/CTM testing used the COBAS AmpliPrep / COBAS TaqMan system; ART testing used the m2000 system with m2000sp/m2000rt, and bDNA testing used the VERSANT® 440 Molecular System.
Figure 1. VERSANT kPCR Molecular System Sample Preparation (SP) module and VERSANT kPCR Molecular System Amplification Detection (AD) module.
Sample collectionA total of 155 HCV RNA-positive specimens were collected and tested for the purposes of this study (116 specimens from BioCollections Worldwide, Inc, Miami, FL; and 39 from SeraCare, Milford, MA). Specimens were included if they were shown to be HCV-positive on the basis of the presence of anti-HCV antibodies and/or HCV RNA. Each sample was tested in singlicate with each method. For the VERSANT HCV RNA 1.0 Assay (kPCR), samples were tested in singlicate with each of three unique HCV kit lots.
Sample processingVERSANT kPCR and ART require 0.7 mL and 1.0 mL sample input volumes, respectively, to extract 0.5 mL of sample per specimen; CAP/CTM requires a 1.0 mL sample input volume to extract 0.85 mL of sample per specimen; and bDNA testing used a 50 μL sample input volume.ART testing was performed by BioCollections Worldwide; CAP/CTM testing was performed at John Muir Hospital Lab, Walnut Creek, CA; bDNA testing was performed at Siemens Clinical Laboratory, Berkeley, CA; and kPCR testing was performed at Siemens Healthcare Diagnostics, Berkeley, CA.
Data analysisA scatter plot showing the VERSANT HCV RNA 1.0 Assay (kPCR) log quantitation versus that of the comparator assay was drawn for each set of paired quantitations. The linear relationship between assays was evaluated using Deming regression, and the 95% confidence interval for the slope was calculated. The Bland–Altman plots illustrate the relationship between the log10 difference and the average log10 quantitation for the pair of results of each sample. Outliers were identified if the absolute value of the Studentized residual was greater than 4.0.
Results The Deming regression slopes for all paired comparisons were between 0.97 and 1.00, indicating that VERSANT kPCR has a linear relationship with all three of the comparator methods. The average log difference between the VERSANT kPCR and the comparator methods was within 0.39 log IU/mL for Abbott, within 0.13 log IU/mL for Roche, and within 0.32 log IU/mL for bDNA (details in Table 1). Figures 2, 4, and 6 show scatter plots of the paired log quantitation results for VERSANT kPCR versus each of the comparator methods. Figures 3, 5, and 7 show Bland–Altman plots for VERSANT kPCR versus each of the comparator methods (only one VERSANT kPCR lot is shown for each comparator method). One outlier with an absolute value of the Studentized residual greater than 4.0 was excluded from the analysis for Abbott, Roche, and bDNA. One additional outlier was excluded from the bDNA and lot 2 comparison. Table 1. Deming regression slope and mean log quantitation difference between kPCR and comparator assays.
Kit Lot Number Included
Mean Log Difference (kPCR – Comparator)
Deming Regression Slope
Lot 1 vs. Abbott 145 0.26 0.98Lot 2 vs. Abbott 144 0.27 0.97Lot 3 vs. Abbott 148 0.39 0.97Lot 1 vs. Roche 146 –0.07 0.99Lot 2 vs. Roche 145 –0.06 0.99Lot 3 vs. Roche 149 0.06 0.99Lot 1 vs. bDNA 124 0.19 0.99Lot 2 vs. bDNA 122 0.22 1.00Lot 3 vs. bDNA 126 0.32 0.97
Y = 0.417 + 0.97X
VE
RS
AN
T kP
CR
lo
t 2
(lo
g I
U/m
L)
8
7
6
5
4
3
2
1
Abbott (log IU/mL)
1 2 3 4 5 6 7 8
log VERSANT kPCR lot 2 vs. log Abbott
Deming regression
Unity (Y = X)
Figure 2. Deming regression: VERSANT kPCR lot 2 compared to ART.
Log
dif
fere
nce
(V
ER
SA
NT
kPC
R l
ot
2 –
Ab
bo
tt)
–2.0
–1.5
–1.0
–0.5
0.0
0.5
1.0
1.5
2.0
Mean of VERSANT kPCR lot 2 and Abbott (log IU/mL)
1 2 3 4 5 6 7 8
Individual log difference Mean log difference
95% lower individual limit 95% upper individual limit
Regression line
Figure 3. Bland–Altman plot: VERSANT kPCR lot 2 compared to ART.
Y = 0.138 + 0.99X
VE
RS
AN
T kP
CR
lo
t 3
(lo
g I
U/m
L)
8
7
6
5
4
3
2
1
Roche (log IU/mL)
1 2 3 4 5 6 7 8
log VERSANT kPCR lot 3 vs. log Roche
Deming regression
Unity (Y = X)
Figure 4. Deming regression: VERSANT kPCR lot 3 compared to CAP/CTM.
Log
dif
fere
nce
(V
ER
SA
NT
kPC
R l
ot
3 –
Ro
che
)
–2.0
–1.5
–1.0
–0.5
0.0
0.5
1.0
1.5
2.0
1 2 3 4 5 6 7 8
Mean of VERSANT kPCR lot 3 and Roche (log IU/mL)
Individual log difference Mean log difference
95% lower individual limit 95% upper individual limit
Regression line
Figure 5. Bland–Altman plot: VERSANT kPCR lot 3 compared to CAP/CTM.
Y = 0.267 + 0.99X
VE
RS
AN
T kP
CR
lo
t 1
(lo
g I
U/m
L)
8
7
6
5
4
3
2
1
bDNA (log IU/mL)
1 2 3 4 5 6 7 8
log VERSANT kPCR lot 1 vs. log bDNA
Deming regression
Unity (Y = X)
Figure 6. Deming regression: VERSANT kPCR lot 1 compared to bDNA.
Log
dif
fere
nce
(V
ER
SA
NT
kPC
R l
ot
1 –
bD
NA
)
–2.0
–1.5
–1.0
–0.5
0.0
0.5
1.0
1.5
2.0
1 2 3 4 5 6 7 8
Mean of VERSANT kPCR lot 1 and bDNA (log IU/mL)
Individual log difference Mean log difference
95% lower individual limit 95% upper individual limit
Regression line
Figure 7. Bland–Altman plot: VERSANT kPCR lot 1 compared to bDNA.
Conclusions These results demonstrate quantitative equivalence and a linear relationship with no proportional bias between VERSANT HCV RNA 1.0 Assay (kPCR) and the following comparator methods: • Roche COBAS AmpliPrep/COBAS TaqMan HCV Test, • Abbott RealTime HCV Assay, and • VERSANT HCV RNA 3.0 Assay (bDNA).
ReferenceClinical and Laboratory Standards Institute (CLSI; formerly NCCLS). Method comparison and bias estimation using patient samples; approved guideline—second edition. EP9-A2. Wayne, PA: CLSI; 2002. Available at: http://www.clsi.org/source/orders/free/ep9-a2.pdf.
Presented at 22nd European Congress of Clinical Microbiology and Infectious Diseases, 31 March–3 April 2012, London, UK.
VERSANT and all associated marks are trademarks of Siemens Healthcare Diagnostics Inc. All other trademarks and brands are the property of their respective owners.
03-2012 | All rights reserved | ©2012 Siemens Healthcare Diagnostics Inc.
A91DX-120352-GC1-4A00