Methanol Presentation
29
Process Simulation and Integration of Methanol Production 3rd Year Chemical Engineering Research Project By: Aaron McClean
description
Methanol processdesign of Methanol plant
Transcript of Methanol Presentation

Process Simulation and Integration of Methanol
Production
3rd Year Chemical Engineering Research Project
By: Aaron McClean

Introduction
Welcome to this Presentation on the Simulation and Integration of a Methanol Production Process

The Project in Brief
The Project Involves the Simulation of a conventional methanol process using Aspen simulation software. Using stream data obtained from the simulation and Process Integration techniques, a maximum energy recovery system is then designed

Three Project Objectives
• Development of a Methanol Production Process
• Simulation of the Methanol Production Process using Aspen Plus
• Carryout Process Integration on the Methanol Process to gain a Maximum Energy Recovery system

Development of a Methanol Production Process
• Research into various routes for the production of methanol
• Process selection
• Producing a Flow Diagram of the Process
• Collecting information on the physical properties and characteristics of the Process

Process Flow Diagram
This diagram shows the main sections in Methanol Production
Combustion
Natural Gas
Synthesis Gas
Reaction
Crude Methanol
Distillation
Oxygen
Steam
Methanol

Process Sections
• Partial Combustion of Natural Gas to produce Synthesis Gas
• Conversion of Synthesis Gas to Methanol
• Purification of Crude Methanol by Distillation

Partial Combustion of Natural Gas to produce Synthesis Gas
• Natural Gas composed of 80% Methane, 15% Ethane and 5% Propane• Partial Combustion Reaction
• Water Shift reaction
Natural Gas + H2O CO + 3H2
CO + H2O CO2 + H2
Natural Gas + O2 CO + H2

Conversion of Synthesis Gas to Methanol
• Methanol Conversion Reactions
CO + 2H2 CH3OH
2CO + 4H2 CH3OCH3 + H2O
CO2 + H2 CO + H2O

Process Diagram

Simulation of the Methanol Production Process using Aspen
Plus
• Aspen Plus is a Computer Simulation Package for Chemical Processes
• It is Primarily used as a labour and time saving tool
• It is still only a tool, and does not replace the knowledge required by the Process Engineer

Aspen Plus User Interface
Aspen Plus User Interface

Methanol Process Simulation

Process Integration
• What is Process Integration?
• What does Process Integration involve?
• Why carry out Process Integration?

What is Process Integration• Process Integration is the optimisation of a
Chemical Process to produce a Maximum energy recovery system
Cool
Cool
Heat
Heat
R eactor
FEED
FEEDREC YCLE
PRODUCT
BYPRODU CT

What does Process Integration involve?
• Pinch Technology
• What is a Pinch Analysis?
• What is required for the analysis?
• How is an analysis performed?

What is a Pinch Analysis?• Linking streams that need heating to those that need cooling
REACTOR
PRODUCT
COOLING
REAC. OUT
COOLING
FEED
HEATING
RECYCLE
HEATING
220 °
210 °
210 °
50 °
270 °
60 °
160 °
160 °
2500
3200
3520
1980
130 °
Cool
Cool
Heat
Heat

What is a Pinch Analysis?
• What is meant by the Pinch
REACTOR
FEEDSTEAM
STEAMRECYCLE
PRODUCT
DistillationColumn
DISTVAP
CW
REAC.OUT
880
19801220
1620
2640
160°
160°
130°
220°
220°
210°
210° 270°
149°
178°
50°
60°
160°180°
Above PinchBelow Pinch

What is meant by the Pinch
• The Composite Curve
Q Hm in
Q Cm in
T
H
Pinch(Cold)
P inch(Hot)

The Composite Curve
No Name Tsupply
Ttarget H
1
2
Product
Reac. Out
220
270
60
160
3520
1980
No Name Tsupply
Ttarget H
3
4
Feed
Recycle
50
160
210
210
3200
2500
160°
60°
220°
270°
Product
3520 1980
Reac. Out
T
H
CP = 22CP =
18 210°
160°
50° 3200 2500
Feed
Recycle
CP = 50
CP = 20
T
H

The Composite Curve
200 °
250 °
150 °
50 °
0°
100 °
Qcmin= 800
Hot Composite
Curve
Cold Composite
Curve
Tmin= 20
°
Hot Utility Target QHMIN = 1000
Cold Utility Target QCMIN = 800
QHMIN = 1000

Creating a heat exchanger network
210° 160° 50°
220° 180° 60°80°
210° 190° 177.6°
235.6°
160°
270° 180° 160°
Product
Feed
RecycleH
C
C
880
440
360
22001000
6201000
Q = 1000Hmin Q = 800Cmin
Reac. Out

Driving force plot
T
Tcold composite
Driving Force Plot
Representation of driving forcesfor vertical heat transfer
a b Tmin

Driving Force plot used to check the use of exchangersT
TC
CP
1
2
0.5
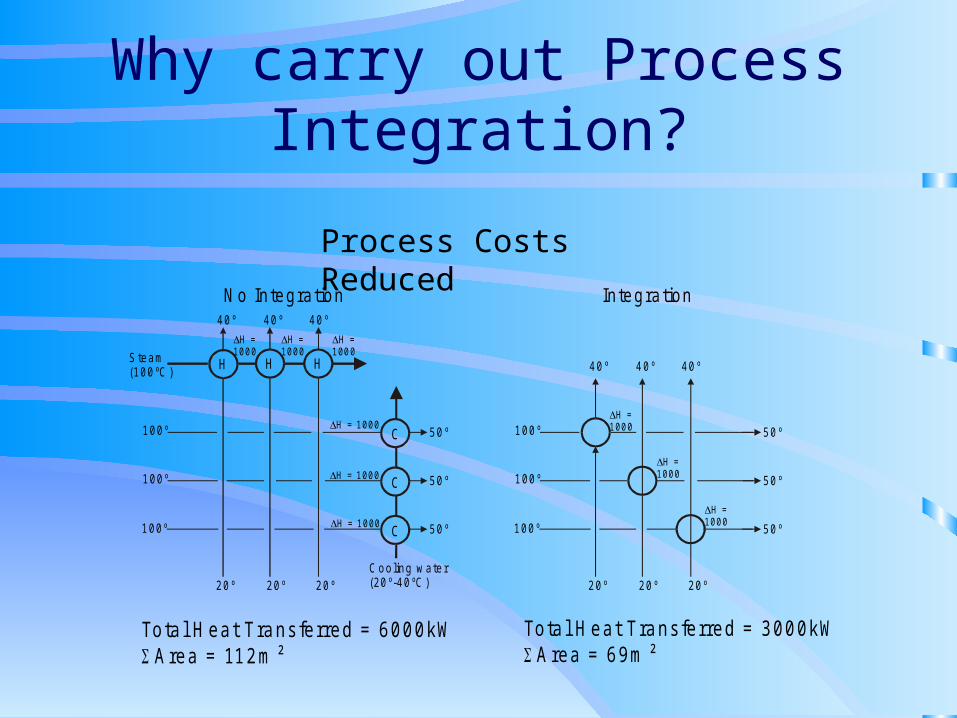
Why carry out Process Integration?
H H H
C
C
C
H = 1000
H = 1000
H = 1000
H = 1000
H = 1000
H = 1000
Steam(100ºC )
Cooling water(20º-40ºC)
40º 40º 40º
50º100º
100º
100º
50º
50º
20º20º20º
H = 1000
H = 1000
H = 1000
40º 40º 40º
50º100º
100º
100º
50º
50º
20º20º20º
Tota l H eat Transferred = 6000kWrea = 112m ² A
T o t a l H e a t T r a n s f e r r e d = 3 0 0 0 k Wr e a = 6 9 m ² A
N o In teg ra tion In teg ra tion
Process Costs Reduced

Process Integration on Methanol Process

Summary•Aspen Plus is a great tool for the development of chemical processes or carrying out analysis on existing processes
•Process Integration gives a reduction in the amount of Energy required in the process
•Pinch Technology can be used to reduce the number of Heat Exchangers required

Thank You for your time and patience
• Please feel free to ask questions or give feed back on this presentation