Methane Emission to the Atmosphere Bazhin N.M. Institute of Chemical Kinetics and Combustion...
25
Methane Emission to the Atmosphere Bazhin N.M. Institute of Chemical Kinetics and Combustion Novosibirsk RUSSIA
-
Upload
esmeralda-nipps -
Category
Documents
-
view
238 -
download
7
Transcript of Methane Emission to the Atmosphere Bazhin N.M. Institute of Chemical Kinetics and Combustion...

Methane Emission to the Atmosphere
Bazhin N.M.
Institute of Chemical Kinetics and Combustion
Novosibirsk RUSSIA

Methane in Atmosphere – Concentration 1.8 ppm Content in Atmosphere 5000 Tg (1 Tg = 1012 g = 1 mln of tons)
Flux 500 Tg /year

-20 0 20 40 60 80 100 120 140
0.3
0.4
0.5
0.6
0.7M
etha
ne c
once
ntra
tion,
ppm
Time BC, 103 years
Methane concentration dependence on time
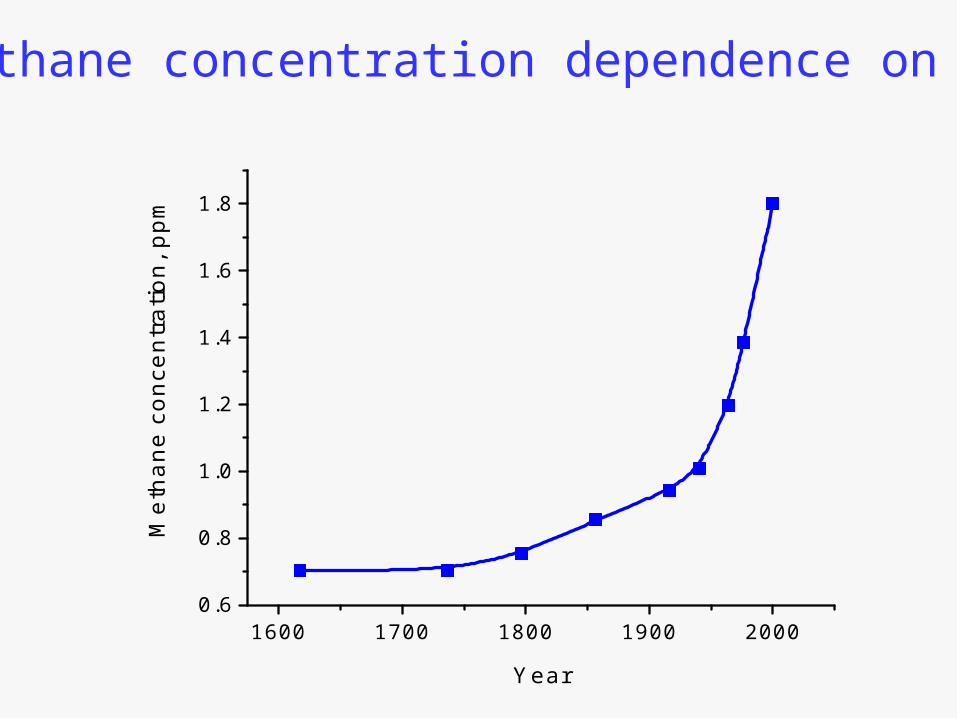
1600 1700 1800 1900 20000.6
0.8
1.0
1.2
1.4
1.6
1.8
Met
hane
con
cent
ratio
n, p
pm
Year
Methane concentration dependence on time

Methane concentration and world population
0 1 2 3 4 5 6 70.6
0.8
1.0
1.2
1.4
1.6
1.8
20001850M
etha
ne c
once
ntra
tion,
ppm
Population, 109 persons
Year1600
LandfillsLakes
Gas
Mines
Biomass burning
TermitsRice fields
Cattle
OceansMethanehydrates
Swamps
15%
2%1%
21%1%8%
8%
7%
10%
7% 20%
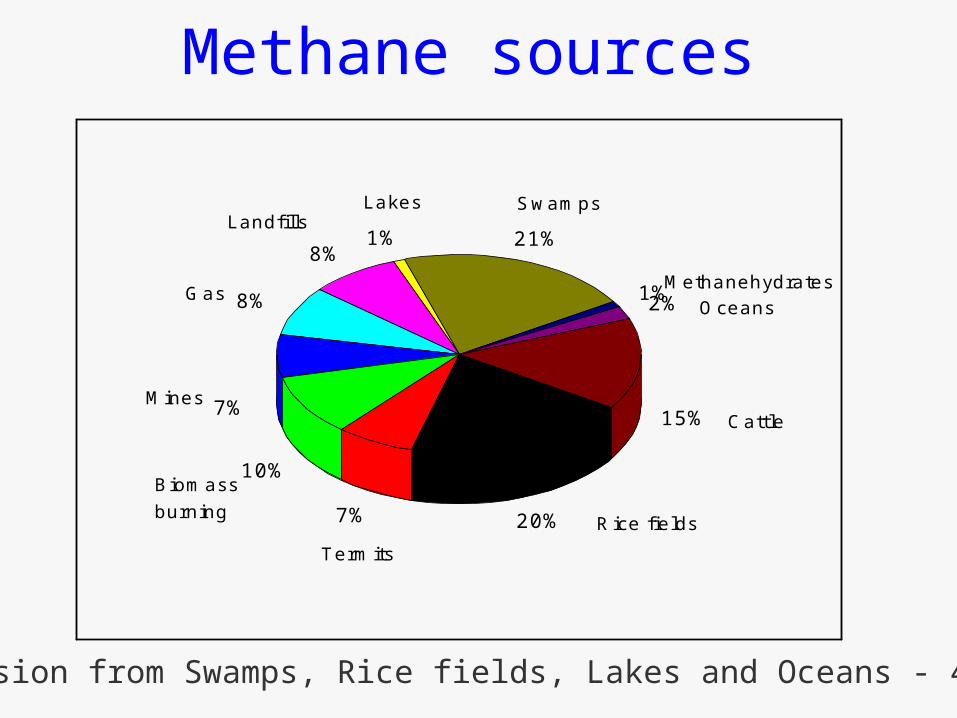
Methane sources
Emission from Swamps, Rice fields, Lakes and Oceans - 44%

Square of the Swamps: 5.5·1012 m2 - all world, 1.3·1012m2 – Russia, 0.7·1012m2 – West Siberia

Active layer
0.0 0.2 0.4 0.6 0.8 1.0
PlantAtmosphere
b
[N 2]
[CH4 ]h
Water column
Region II
Region I
Active layer
Active layer
0
Dep
th,
Z
Methane, nitrogen concentration, arb. units
ww DDKK 2,

- 1 0
- 2 0
D e p t h , m m
R o t h f u s s F . , C o n r a d R . , 1 9 9 8L i m n o l . O c e a n o g r . 4 3 , 1 5 1 1 - 1 5 1 8
- 1 0
- 2 0
D e p t h , m m
R o t h f u s s F . , C o n r a d R . , 1 9 9 8L i m n o l . O c e a n o g r . 4 3 , 1 5 1 1 - 1 5 1 8
-10
-20
D epth , m m
R othfuss F.,C onrad R ., 1998L im nol. O ceanogr. 43 , 1511-1518
Bubbles formation in rice field model

0 400 800 1200-60
-40
-20
0
20
Summer Winter
Chanton J.P., Martens C.S., Kelley C.A., 1989. Limnol. Oceanogr. 34, 807-819, fig 3
Dep
th, c
m
Methane concentration, M
Methane concentrations

0.0 0.2 0.4 0.6 0.8 1.0
10012
101
/)1(
/)(
WPKr
WhCC
)//1(
/)()(
000 zbzzP
KzCzPi
iii
i
)2/( 12 Dhh
Atmosphere
h
Region II
Region I
Active layer
Active layer
0
Dep
th,
Z
b Water

Upper border of bubbles position
Dimensionless unit of depth
10011 /WPDKl
lhh ~
100112 /)1(2 WPDKXh N

-1.6 -1.2 -0.8 -0.4 0.0-0.4
-0.2
0.0
0.2
0.4
0.6
0.8
lnh
/ cm
ln(1-XN2)
lnh = 0.74 + 0.6 ln(1-XN2)
Artificial atmospheres: nitrogen - oxygen
Kuzmin et all, Limnology and Oceanology

1011114 /)()(~
0)(~~
CH WzWzWzWC
01~
1 C If W1(z) = W10 then
Transport in region I
Border conditions
10~1
~rC
z
)
~(
~~1~~1 hCC
hz
N2 0~
2 C
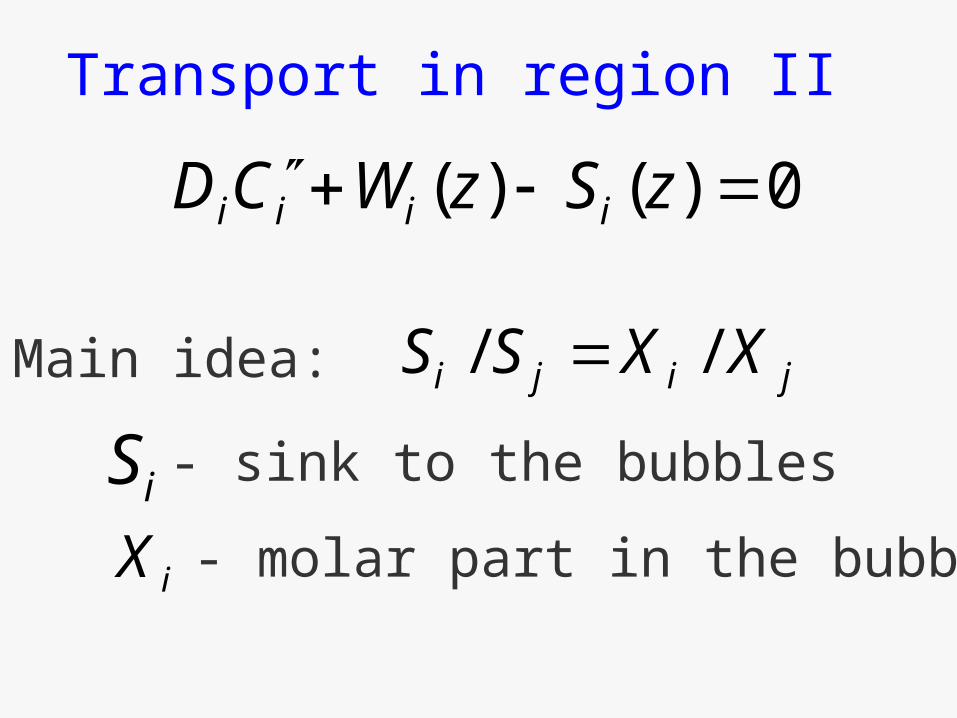
Transport in region II
jiji XXSS // Main idea:
0)()( zSzWCD iiii
- sink to the bubblesiS
iX - molar part in the bubbles
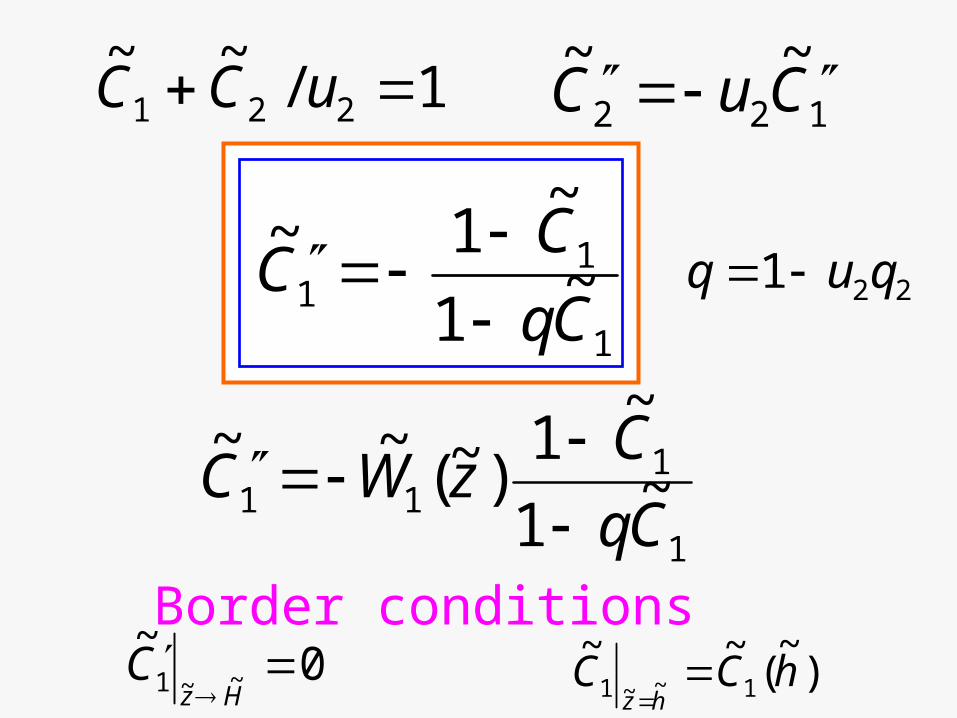
1/~~
221 uCC 122
~~CuC
221 quq
1
11 ~
1
~1~
Cq
CC
1
111 ~
1
~1
)~(~~
Cq
CzWC
0~
~~1 Hz
C )~
(~~
1~~1 hCChz
Border conditions

0 5 10 15 20 25 30 35 40 45
0
20
40
60
80
100
Y = 116*exp(-x/17)
T.J.Popp et all, Biogeochemistry,fig. 5, v.51, p.259-281 (2000)
CH
4 pro
duct
ion,
g
/g(p
eat)
d-1
Depth, cm
Exponential approximation to W(z) W1(z) = W10exp(-νz)

0 2 4 6 8 10 12 14
0.0
0.2
0.4
0.6
0.8
G.W.Kipphut, C.Martens, Geochimica et Cosmochimica Acta,1982, 46, p.2049-2060
40 cm
N2
CH4
Nu = 1.15
h = 0.932
CH
4, N
2 co
ncen
trat
ion,
arb
. un.
Depth, arb. un.
CH4 and N2 concentrations on depth,
W1(z) = W10exp(-νz)

1,5 2,0 2,5 3,0 3,5 4,040
50
60
70
80
- theory
- theory
- experiment
F.Rothfuss, R.ConradLimnol. Oceanogr. 43(7), 1998, 1511-1518
Me
tha
ne
co
nce
ntr
atio
n in
th
e b
ub
blts
, %
Depth, cm
Bubbles composition on depth

0.3 0.4 0.5 0.6 0.7 0.8 0.9 1.0
0
2
4
6
8
10M
eth
ane
bubb
le f
lux,
arb
.un.
Methane molar ratio in bubbles X1B
Points from Chanton et allLimnol.Oceanog.,34,p.807,1989
BJ1
~BJ1
~on X1B

Active layer
0.0 0.2 0.4 0.6 0.8 1.0
PlantAtmosphere
b
[N 2]
[CH4 ]h
Water column
Region II
Region I
Active layer
Active layer
0
Dep
th,
Z
Methane, nitrogen concentration, arb. units
ww DDKK 2,

M e t h a n e p l a n t s i n k s
)]0()()[()( 11 CzCzfzQ 1R
N i t r o g e n p l a n t s o u r c e
)]()0()[()( 22 zCCzfzQ 2R
D i f f e r e n t i a l e q u a t i o n
0])~(~
[~
1~
112''
1 rzCC
1012 /
~DPfK
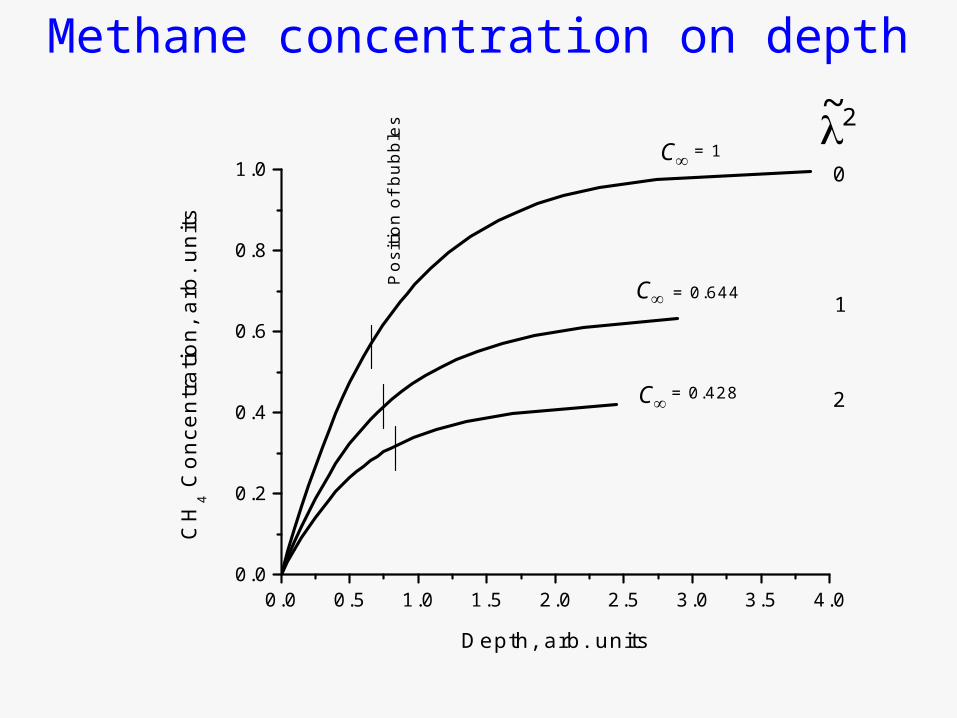
0.0 0.5 1.0 1.5 2.0 2.5 3.0 3.5 4.00.0
0.2
0.4
0.6
0.8
1.0
C
C
= 0.428
= 0.644
= 1C
Po
sitio
n o
f b
ub
ble
s2
1
0C
H4 C
on
cen
tra
tion
, a
rb.
un
its
Depth, arb. units
Methane concentration on depth
2~

0 10 20 30 40 50 60
0.0
0.1
0.2
0.3
0.4
0.5
0.6
2~
Roots, = 4.5
Wilson J.O. et all, 1989Biogeochemistry , Vol. 8, pp. 55-712Bubbles - 22.5 % CH
4, theory - 28 % CH
4
Met
hane
con
cent
rati
on, a
rb.u
n.
Depth, cm
Methane concentration on depth

C O N C L U S I O N W E H A V E T O K N O W I N D E P E N D E N C E O N Z :
[ C H 4 ] , [ N 2 ] , [ C O 2 ] , [ A r ] ,
B u b b l e s C o m p o s i t i o n , V o l u m e o f B u b b l e s
iW pH,,Porosity,, TDK
ii
W E H A V E T O K N O W T H E D I F F U S I O N , B U B B L E S A N D P L A N T S F L U X E S F O R A L L C O M P O N E N T S