Meteorological Influences on Arizona Precipitation Mark Sinclair Meteorology Dept. Embry-Riddle...
37
Meteorological Influences Meteorological Influences on Arizona Precipitation on Arizona Precipitation Mark Sinclair Meteorology Dept. Embry-Riddle Aeronautical University
-
Upload
gregory-fields -
Category
Documents
-
view
224 -
download
1
Transcript of Meteorological Influences on Arizona Precipitation Mark Sinclair Meteorology Dept. Embry-Riddle...
Meteorological Influences Meteorological Influences on Arizona Precipitationon Arizona Precipitation
Mark Sinclair
Meteorology Dept.Embry-Riddle Aeronautical
University
Talk outlineTalk outline How precipitation occurs Winter storms The summer monsoon El Niño/La Niña Global warming Precipitation trends

What causes What causes precipitation?precipitation?
We need– An abundance of low-level moisture– A lifting mechanism
Caused by a combination of atmospheric dynamics and local terrain effects
In winter (October-May), most precipitation is from winter storms
Summer precipitation comes from the southwest Monsoon (July-Sept)
Summer monsoon
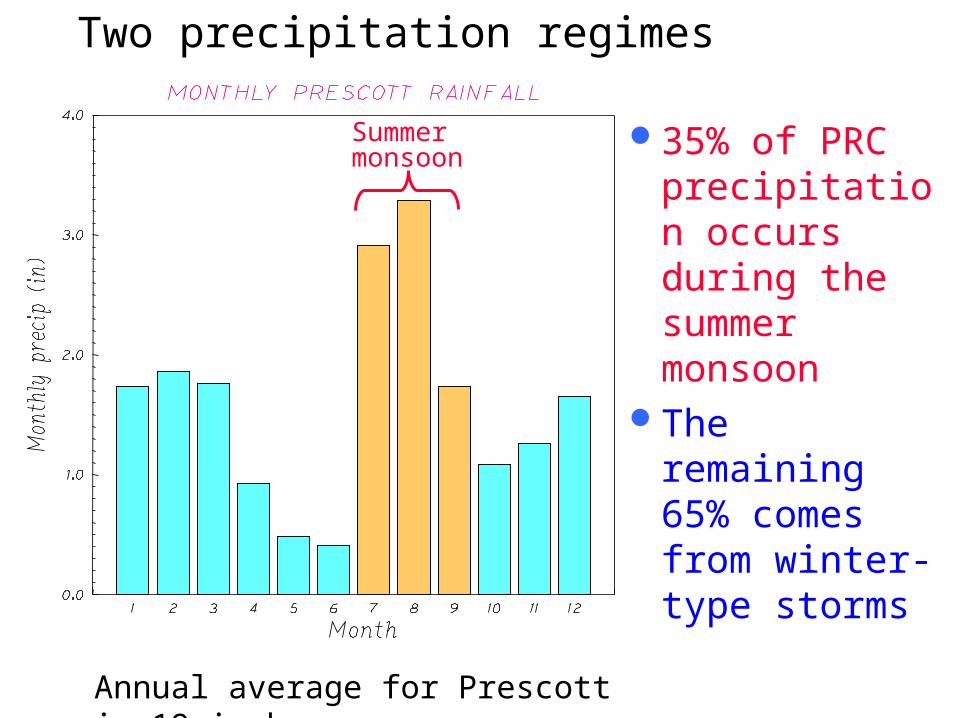
35% of PRC precipitation occurs during the summer monsoon
The remaining 65% comes from winter-type storms
Annual average for Prescott is 19 inches
Two precipitation regimes
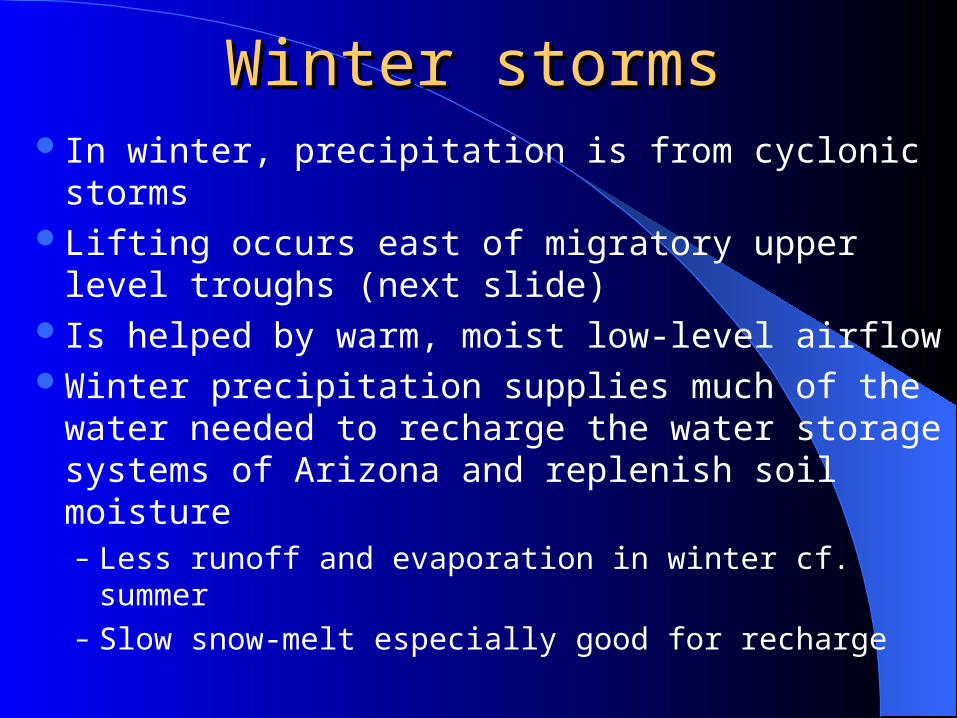
Winter stormsWinter stormsIn winter, precipitation is from cyclonic stormsLifting occurs east of migratory upper level
troughs (next slide)Is helped by warm, moist low-level airflowWinter precipitation supplies much of the water
needed to recharge the water storage systems of Arizona and replenish soil moisture– Less runoff and evaporation in winter cf. summer– Slow snow-melt especially good for recharge
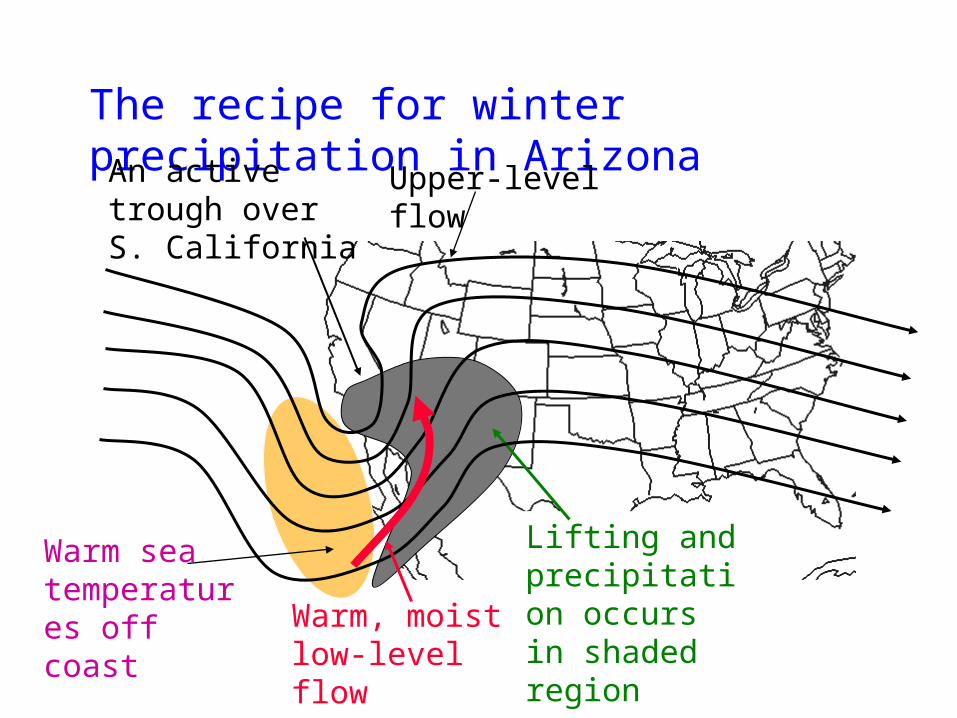
The recipe for winter precipitation in Arizona
Lifting and precipitation occurs in shaded region
Upper-level flow
Warm, moist low-level flow
Warm sea temperatures off coast
An active trough over S. California
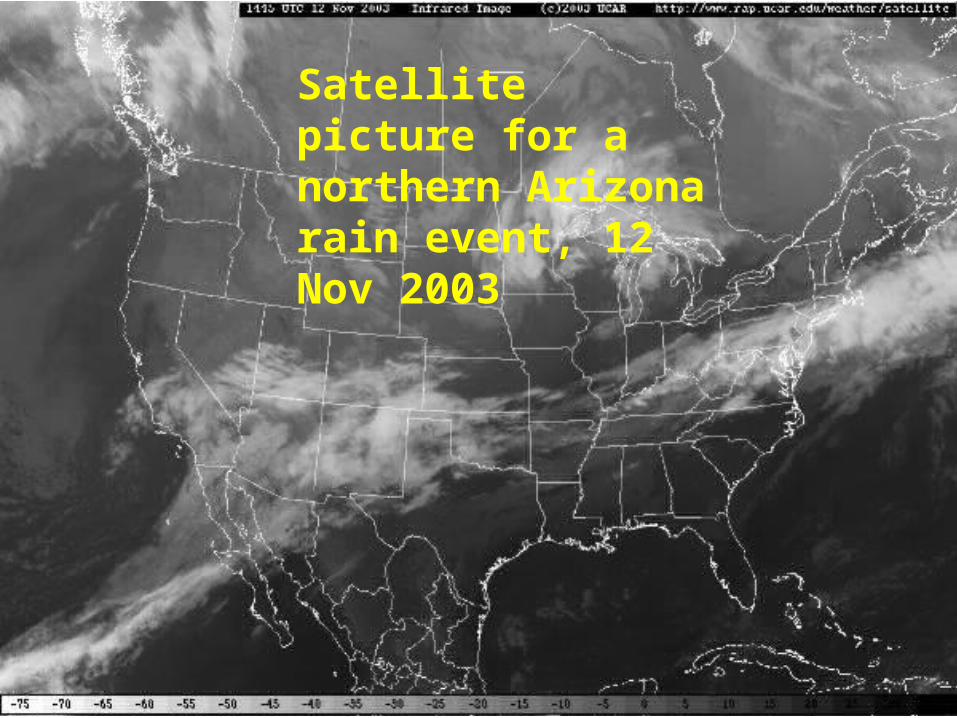
Satellite picture for a northern Arizona rain event, 12 Nov 2003
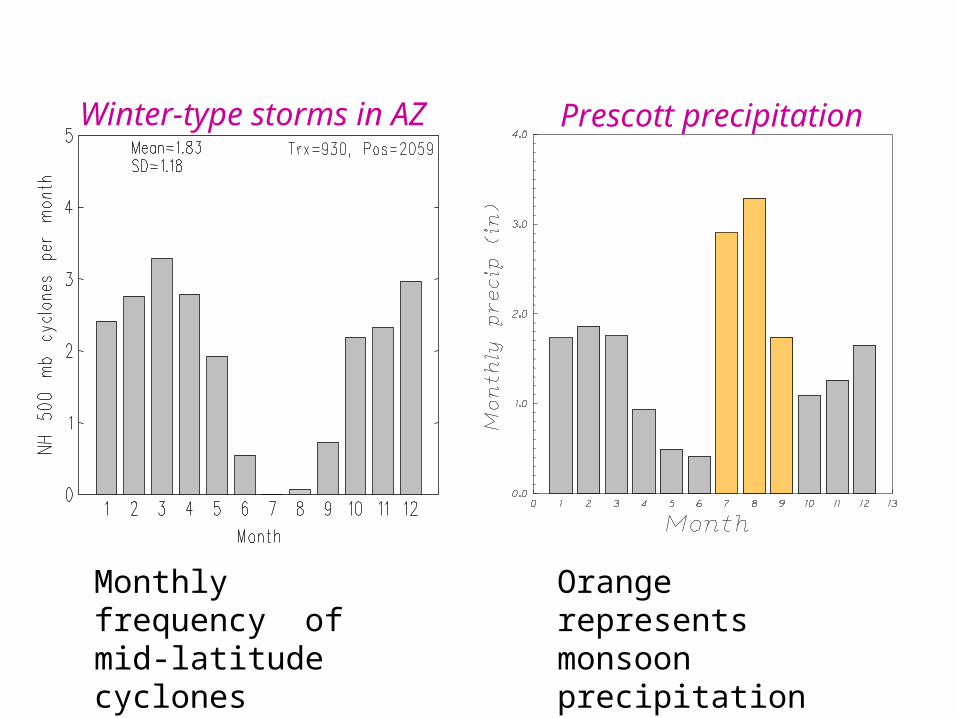
Winter-type storms in AZ
Prescott precipitation
Orange represents monsoon precipitation
Monthly frequency of mid-latitude cyclones
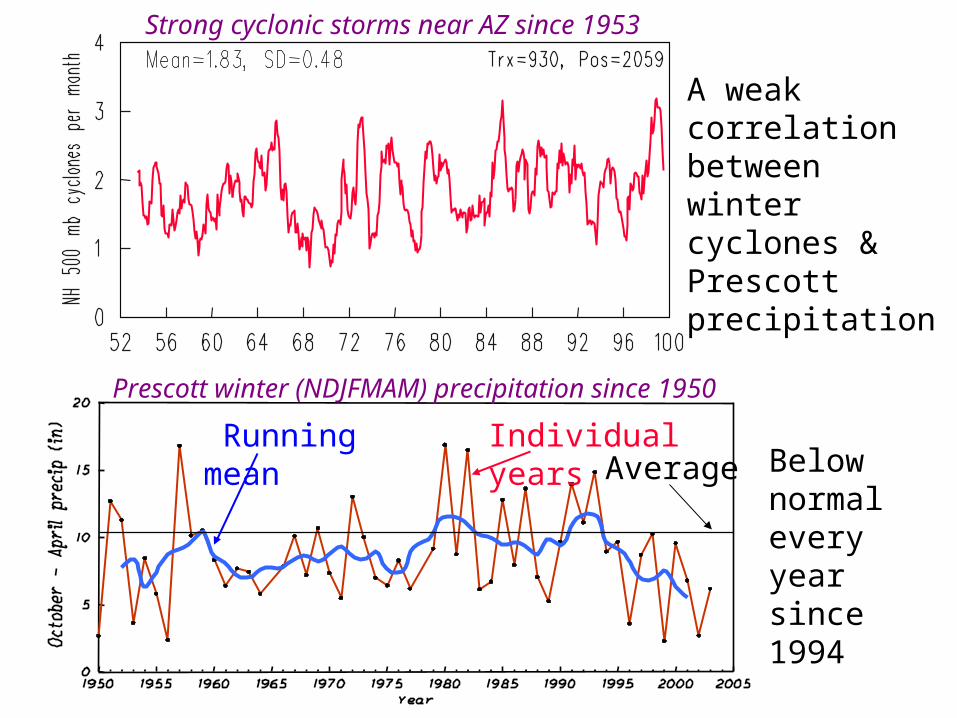
Prescott winter (NDJFMAM) precipitation since 1950
Strong cyclonic storms near AZ since 1953
Individual years Running meanBelow normal every year since 1994
A weak correlation between winter cyclones & Prescott precipitation
Average

Trends?Trends?Note that, although cyclonic storms have
been increasing slightly, Prescott winter precipitation has decreased in recent rears
A cyclonic storm does not guarantee a major precipitation event
Wind direction relative to terrain is importantSea temperatures off California also
importantArizona has warmed in the last 100 years,
resulting in less precipitation falling as snow

Prescott winter (NDJFMAM) precipitation (in)
Trend is -0.47 in per decade
100-year trend
A clear decrease in winter precipitation at Prescott
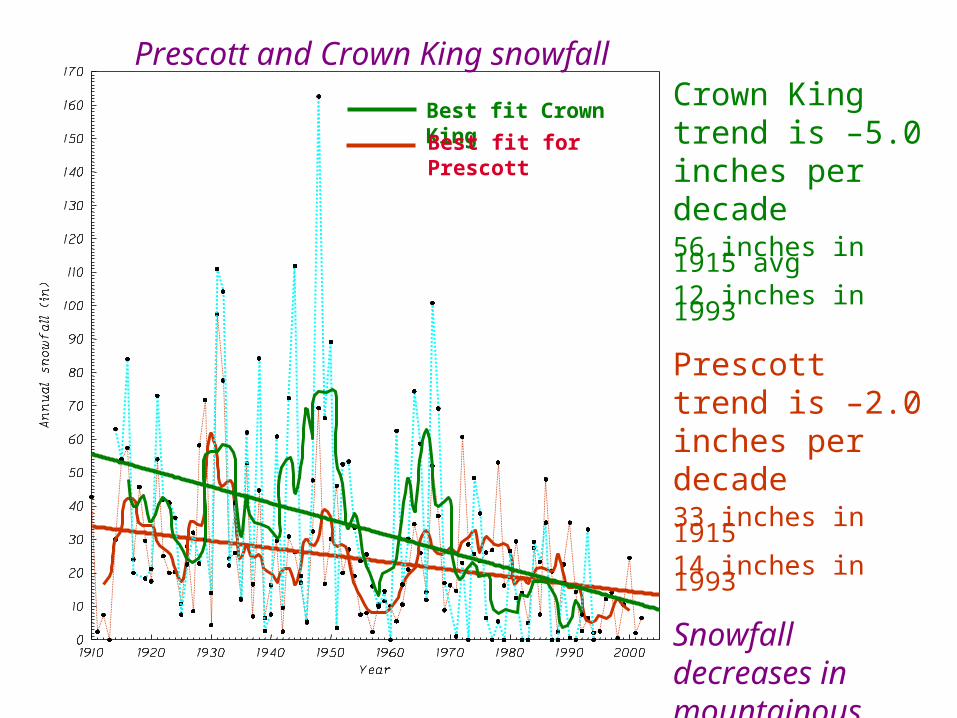
Best fit Crown KingBest fit for Prescott
Crown King trend is –5.0 inches per decade56 inches in 1915 avg12 inches in 1993
Prescott trend is –2.0 inches per decade33 inches in 191514 inches in 1993
Snowfall decreases in mountainous regions due to a warming trend (next slide)
Prescott and Crown King snowfall
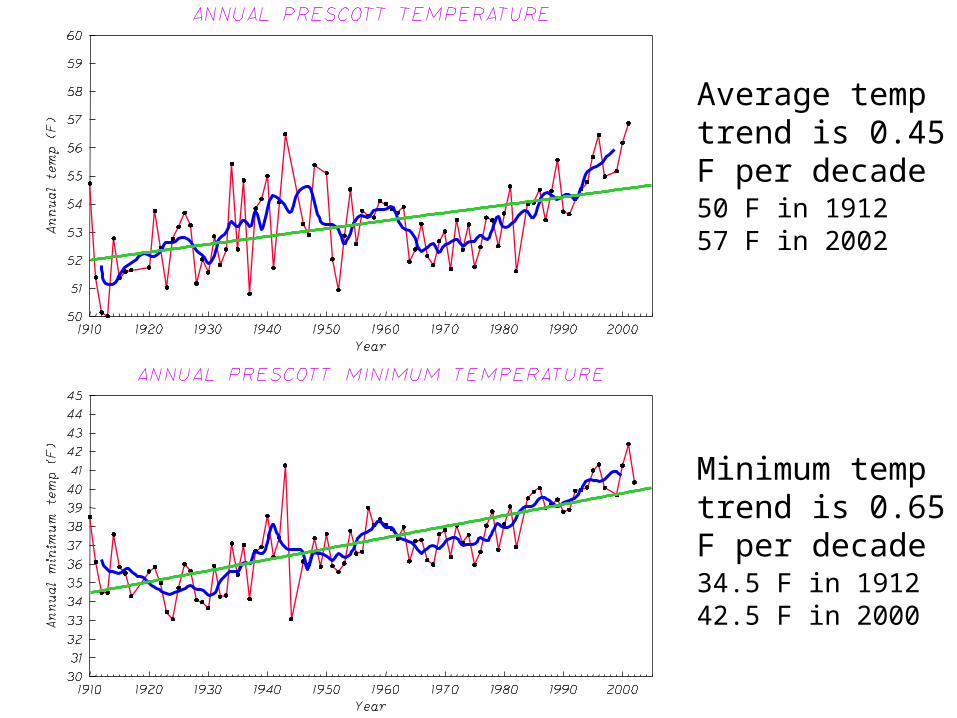
Average temp trend is 0.45 F per decade50 F in 191257 F in 2002
Minimum temp trend is 0.65 F per decade34.5 F in 191242.5 F in 2000

Orographic enhancementOrographic enhancement
In mountainous regions, precipitation is enhanced on the upwind side of mountains, with a rain shadow on the leeward side
This is why Crown King gets 29 inches and Prescott Airport gets only 13 inches of precip
Precipitation amounts increase with– Increasing wind speed– Increasing relative humidity of upwind flow– Increasing dew point of upwind flow

How mountains affect precipitationHow mountains affect precipitation – Precipitation max on upwind side – Precipitation max on upwind side
– Rain shadow on downwind side – Rain shadow on downwind side
Mountain
Airflow
Rain shadow

How precipitation is enhanced on the How precipitation is enhanced on the upwind side of mountains – the upwind side of mountains – the
“seeder-feeder” effect“seeder-feeder” effect
Mountain
Ice falling from higher overcast is enhanced as it falls though dense orographic cloud over mountain – natural cloud seeding
Seeder cloud
Feeder cloud Airflow
The summer MonsoonThe summer Monsoon
During July, August and half of September, precipitation comes from thunderstorms associated with the summer monsoon
Convection occurs in moist southerly flowBecause of its high intensity/short duration, most
summer rainfall runs off quickly and/or evaporates – Less replenishment of soil moisture and recharging of
aquifers than winter precip
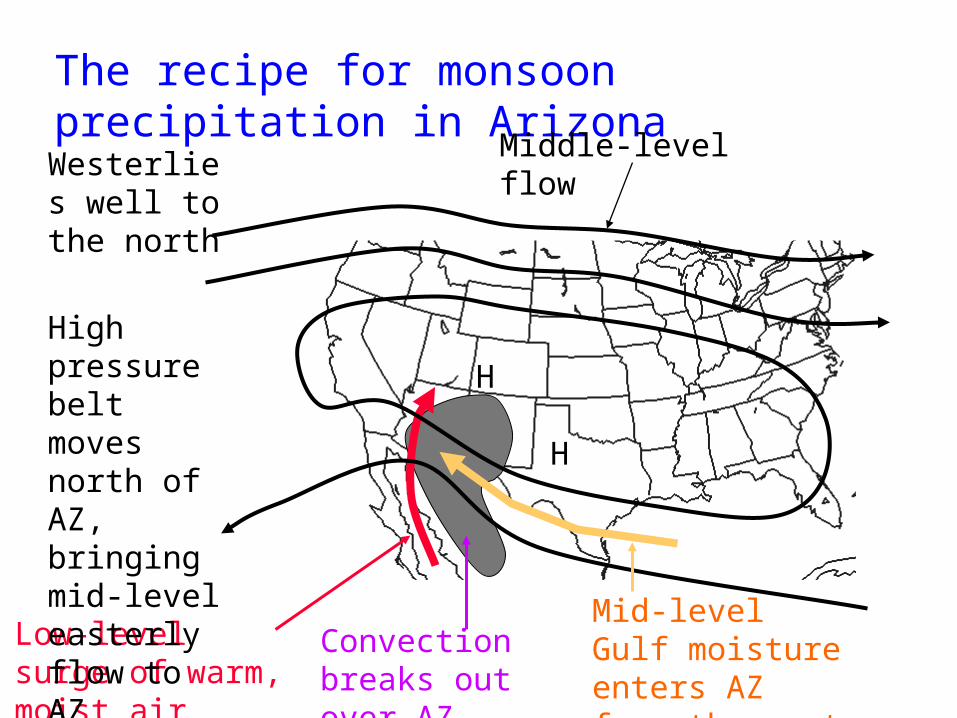
The recipe for monsoon precipitation in Arizona
Middle-level flow
Low-level surge of warm, moist air
H
Mid-level Gulf moisture enters AZ from the east
Westerlies well to the north
High pressure belt moves north of AZ, bringing mid-level easterly flow to AZ
H
Convection breaks out over AZ
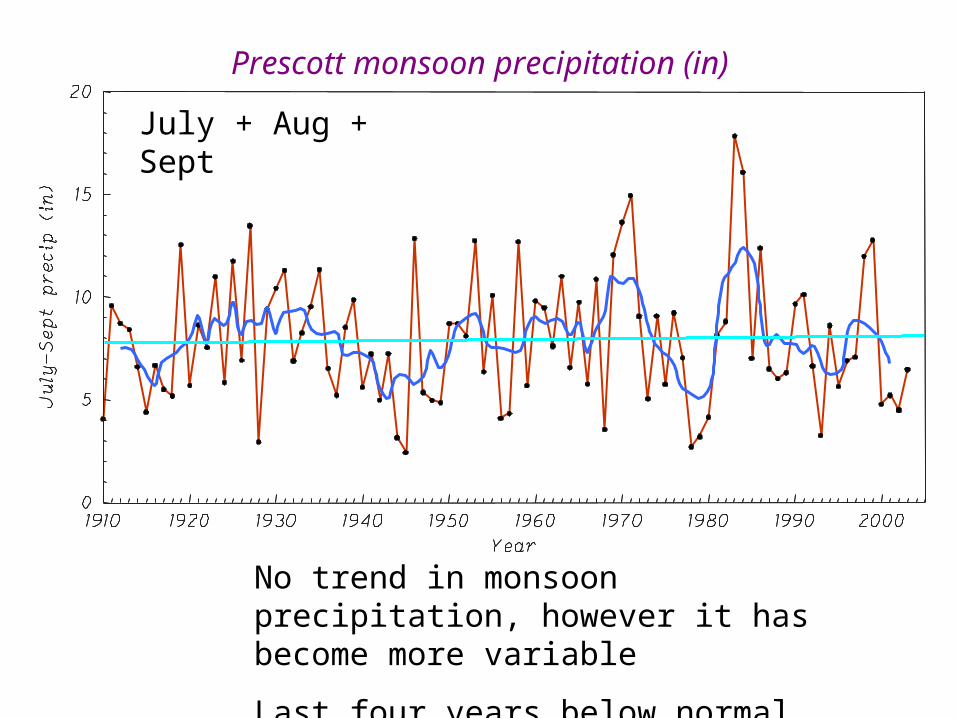
Prescott monsoon precipitation (in)
No trend in monsoon precipitation, however it has become more variable
Last four years below normal
July + Aug + Sept
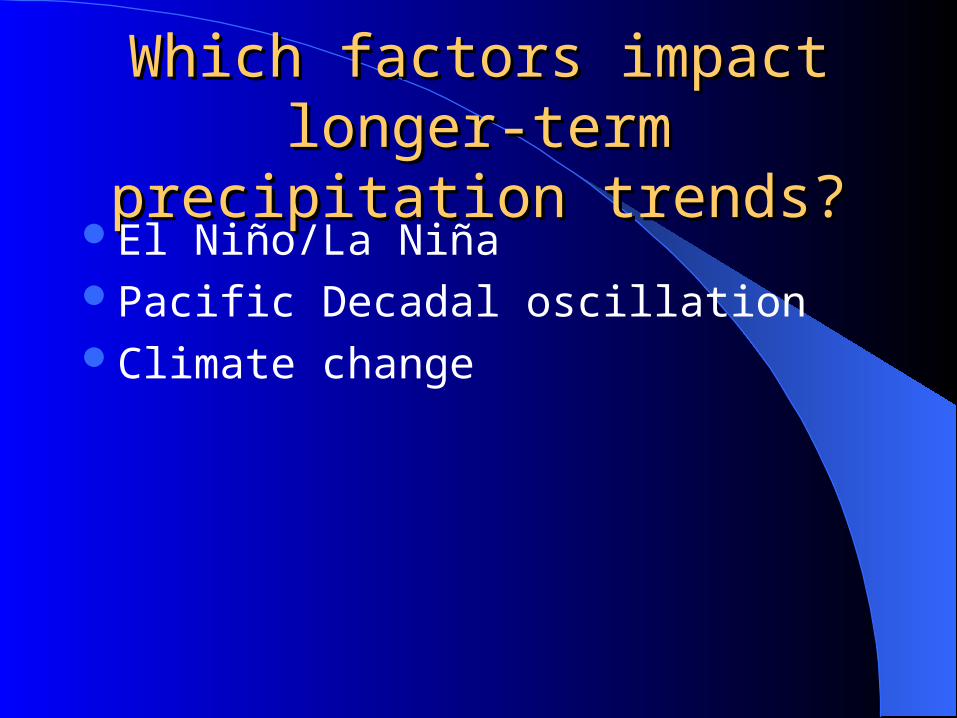
Which factors impact longer-Which factors impact longer-term precipitation trends?term precipitation trends?
El Niño/La NiñaPacific Decadal oscillationClimate change

El Niño SST anomalies
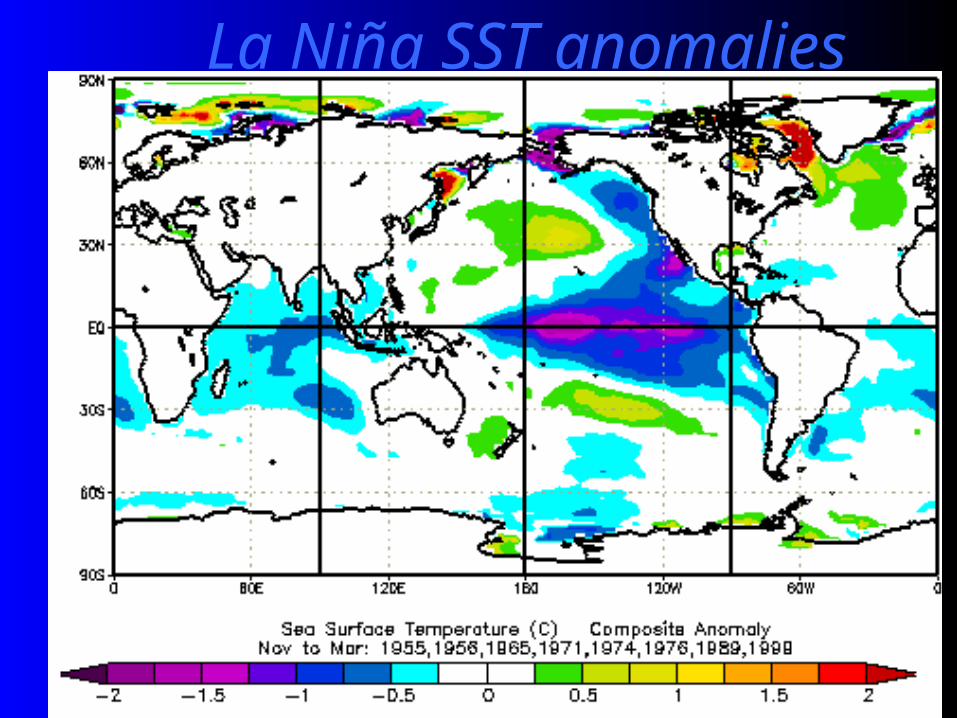
La Niña SST anomalies
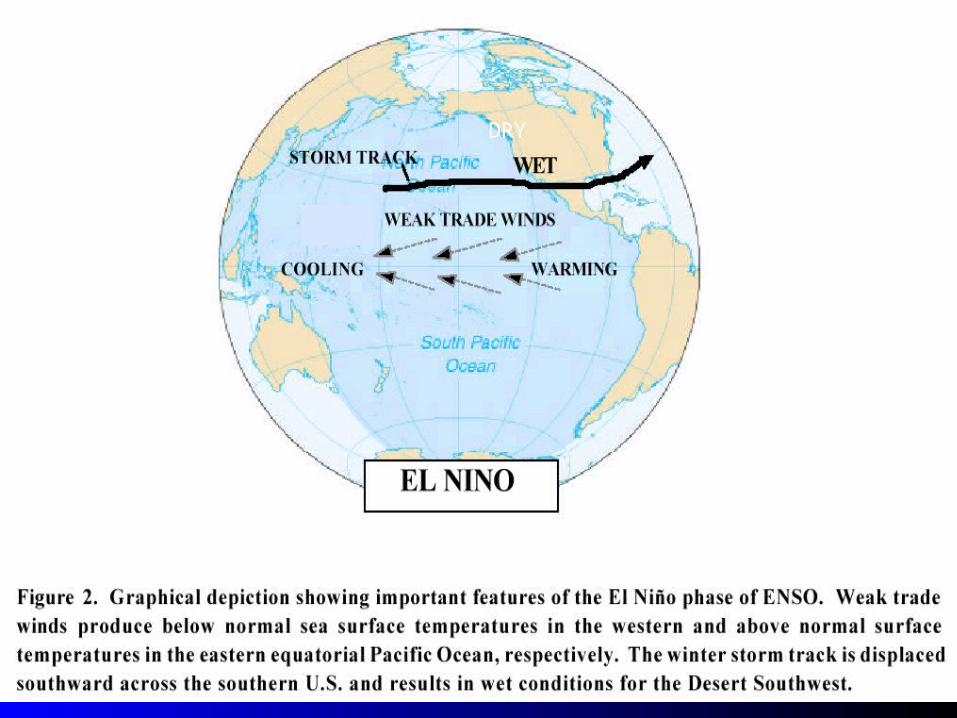
DRY
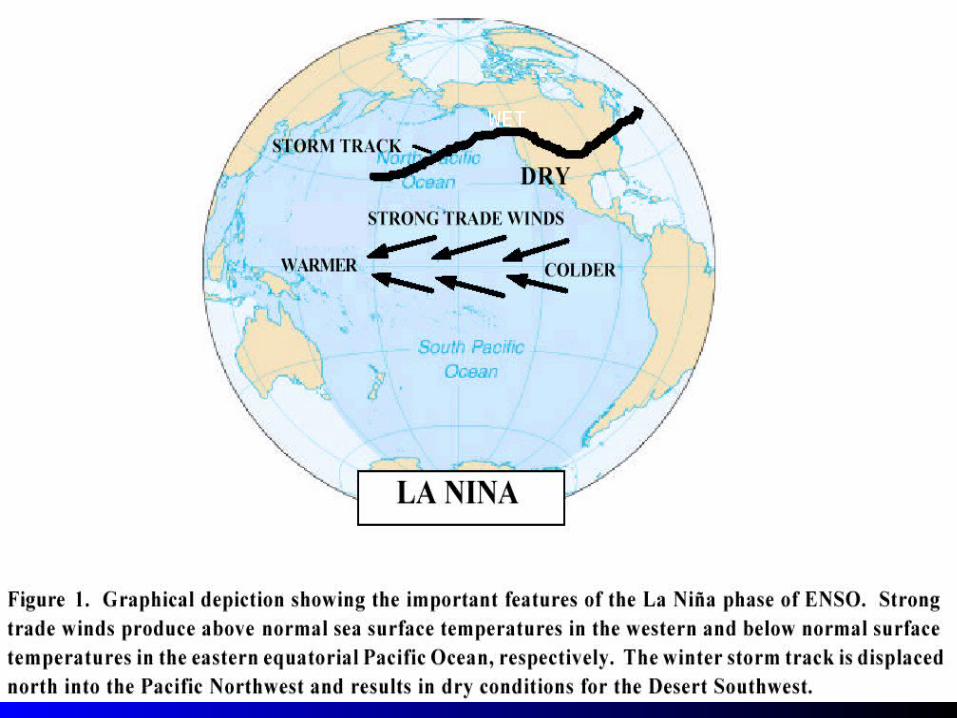
WET
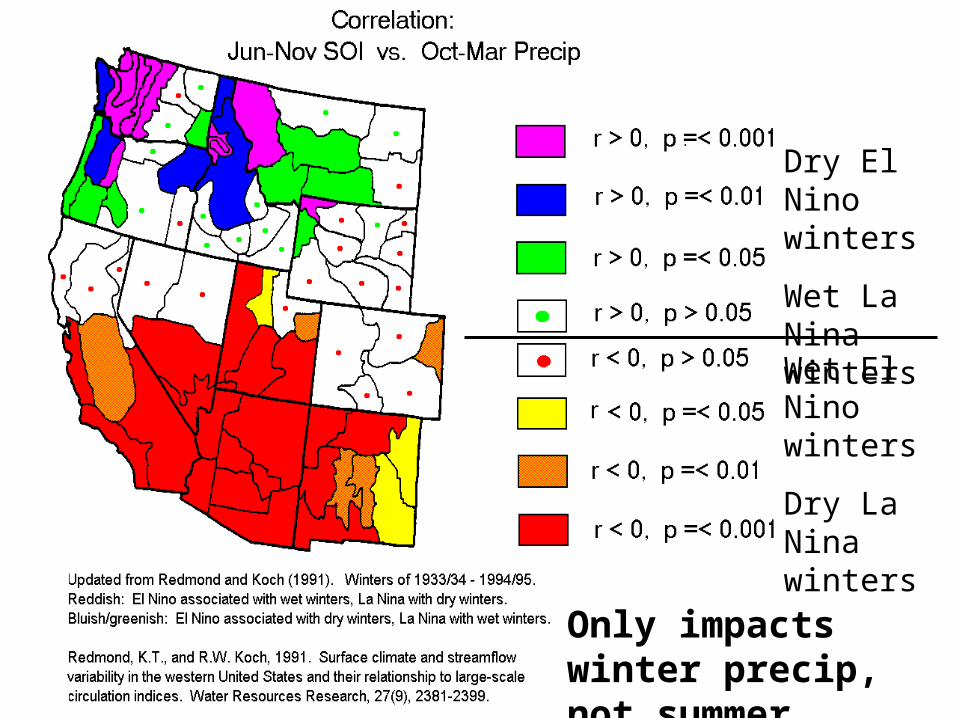
Wet El Nino winters
Dry La Nina winters
Dry El Nino winters
Wet La Nina winters
Only impacts winter precip, not summer

• • •

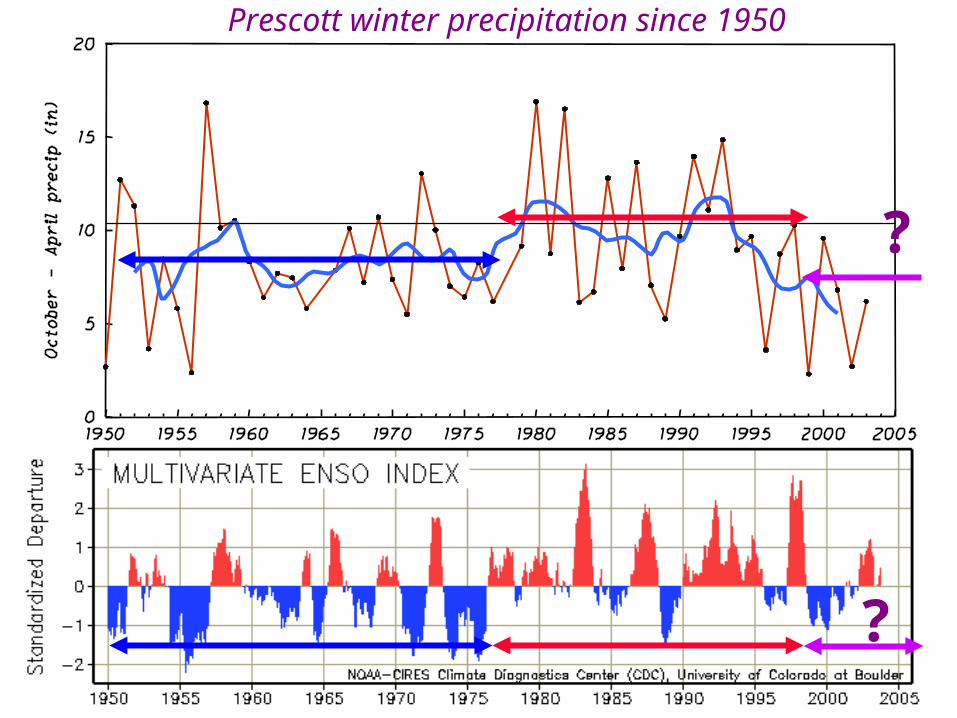
Note that between 1950 and 1976, there were strong La Niña’s and weak El Niño’s
Blue = La Niña Red = El Niño
Between 1976 and 1998, there were strong El Niño’s and weak La Niña’s
Many scientists believe that we are shifting back to a prolonged period of strong La Niña’s and weak El Niño’s, like 1950 to 1976. This slower trend is related to the Pacific Decadal Oscillation
?
?
Prescott winter precipitation since 1950
?

Climate changeClimate changeOur climate is, and has always been, changingMost year-to-year variability is naturalGlobal warming is one recent component Hypothesized to be caused by increases in CO2
that result from fossil fuel burning and deforestation (“greenhouse effect”)
Winners and losers– Costs include rising sea levels, changes in climate
patterns – Benefits include longer growing season, more CO2
for crop growth, increased drought and pest resilience
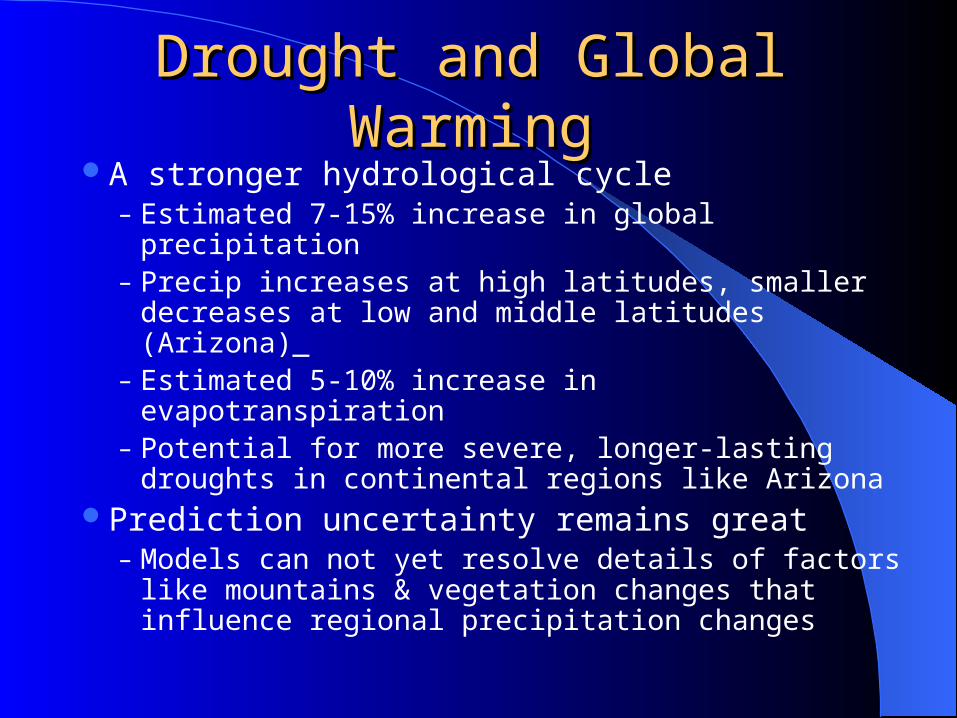
Drought and Global WarmingDrought and Global WarmingA stronger hydrological cycle
– Estimated 7-15% increase in global precipitation– Precip increases at high latitudes, smaller
decreases at low and middle latitudes (Arizona)_– Estimated 5-10% increase in evapotranspiration– Potential for more severe, longer-lasting droughts
in continental regions like ArizonaPrediction uncertainty remains great
– Models can not yet resolve details of factors like mountains & vegetation changes that influence regional precipitation changes
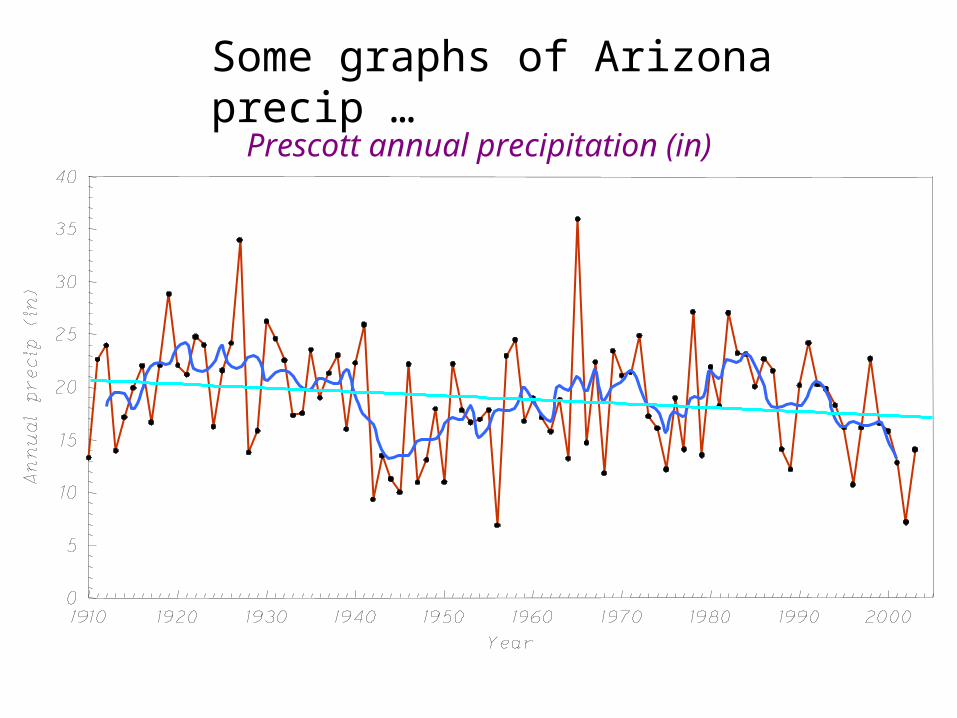
Prescott annual precipitation (in)
Some graphs of Arizona precip …
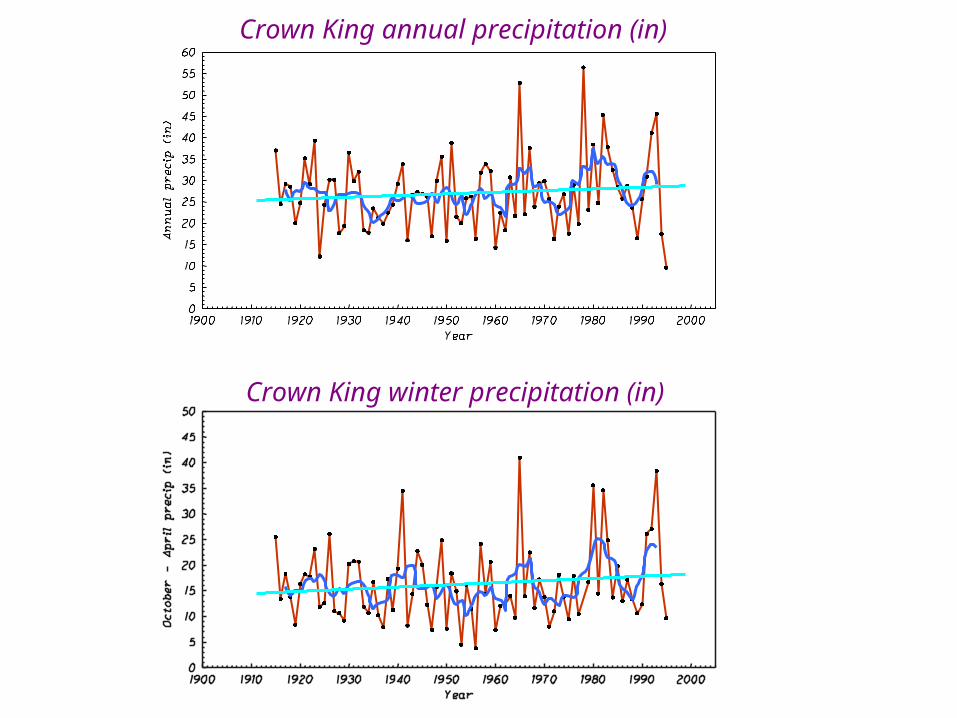
Crown King annual precipitation (in)
Crown King winter precipitation (in)
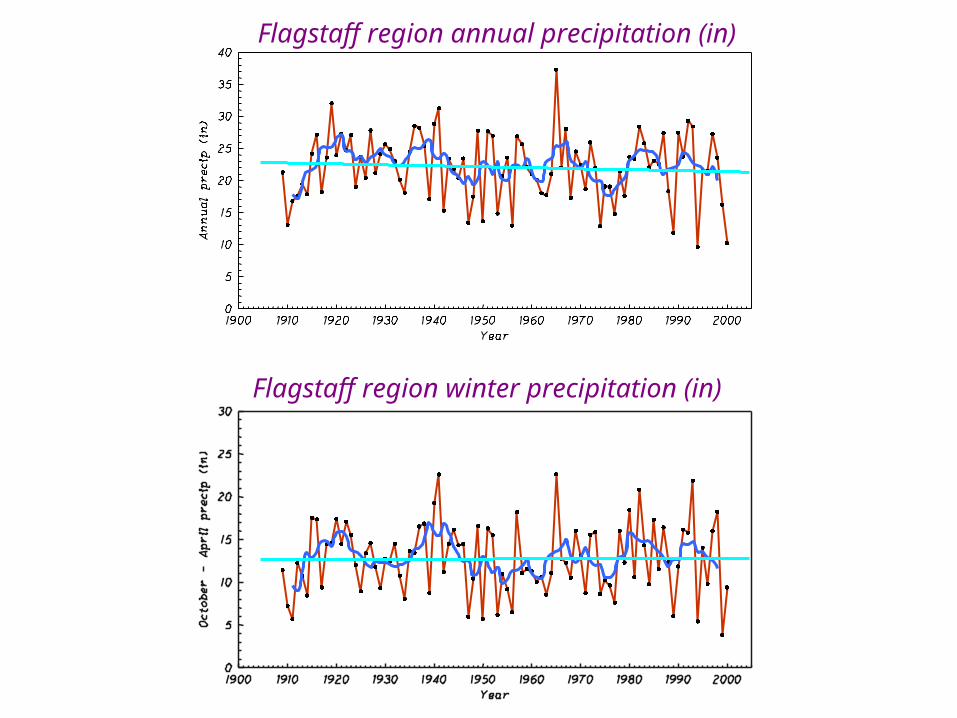
Flagstaff region annual precipitation (in)
Flagstaff region winter precipitation (in)
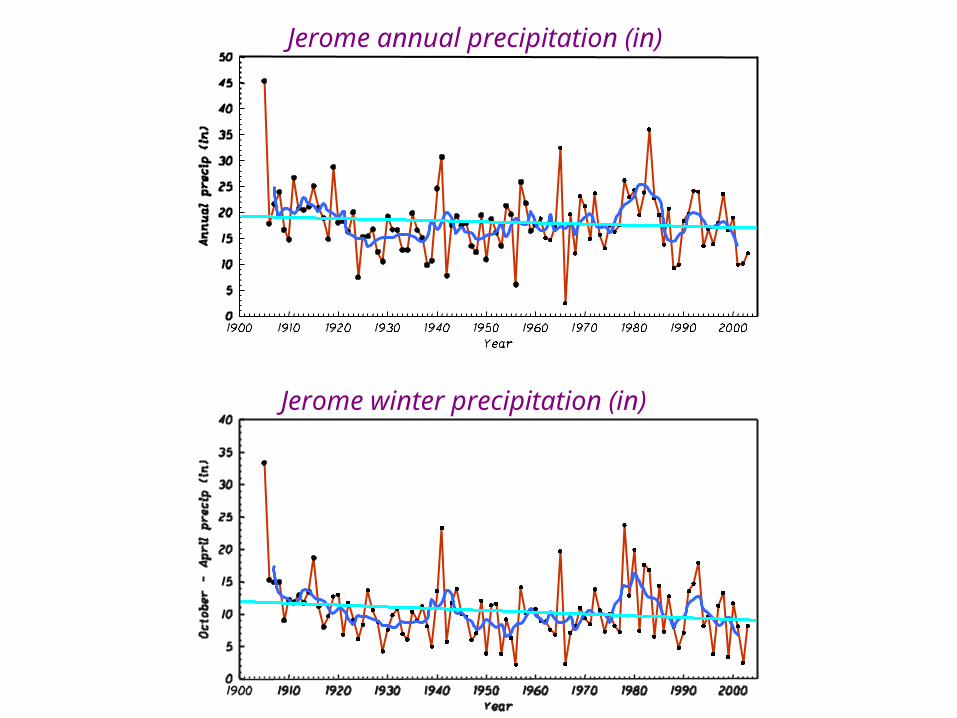
Jerome annual precipitation (in)
Jerome winter precipitation (in)
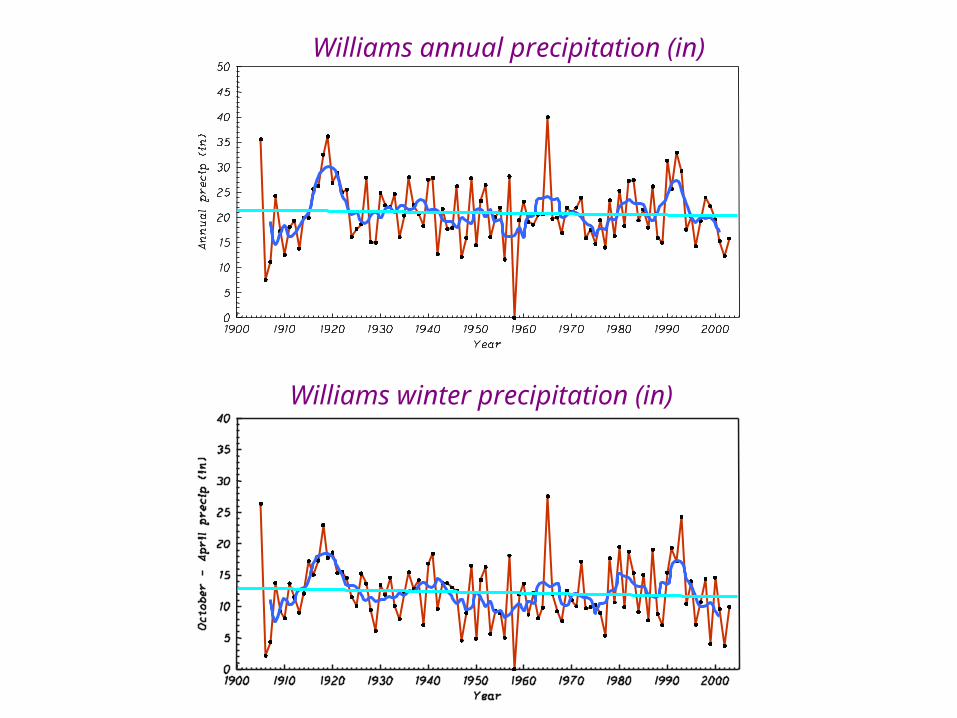
Williams annual precipitation (in)
Williams winter precipitation (in)

Seligman annual precipitation (in)
Seligman winter precipitation (in)

ConclusionsConclusionsTwo precipitation regimes – winter precip from
cyclonic storms & summer monsoon convectionPrescott area winter precip seems to be
decreasing slightly, but much local variabilitySnowfall decreasing because of a warming trendMore precip during El Nino, less during La
Nina, with more La Nina’s on the way