METEOROLOGICAL AND HYDROLOGICAL SERVICE OF …klima.hr/razno/publikacije/climate_change.pdf ·...
47
METEOROLOGICAL AND HYDROLOGICAL SERVICE OF CROATIA RESERCH AND DEVELOPMENT DIVISION CLIMATOLOGICAL RESEARCH AND APPLIED CLIMATOLOGY DEPARTMENT AGROMETEOROLOGICAL DEPARTMENT Fifth National Communication of the Republic of Croatia under the United Nation Framework Convention on the Climate Change (UNFCCC) Selected chapters: Observed climate changes in Croatia Climate change scenario Impact of climate variations and changes on plants and wildfire danger Zagreb, November 2009.
Transcript of METEOROLOGICAL AND HYDROLOGICAL SERVICE OF …klima.hr/razno/publikacije/climate_change.pdf ·...
METEOROLOGICAL AND HYDROLOGICAL SERVICE OF CROATIA RESERCH AND DEVELOPMENT DIVISION
CLIMATOLOGICAL RESEARCH AND APPLIED CLIMATOLOGY DEPARTMENT AGROMETEOROLOGICAL DEPARTMENT
Fifth National Communication of the Republic of Croatia under the United Nation Framework Convention on the Climate Change
(UNFCCC)
Selected chapters:
Observed climate changes in Croatia Climate change scenario
Impact of climate variations and changes on plants and wildfire danger
Zagreb, November 2009.

1
Content
Page
1. Observed. climate changes in Croatia 2
1.1. Air temperature 2
1.2. Precipitation 9
1.3. Dry spells 14
2. Climate change scenario 18
2.1. Introduction 18
2.2. Upper level fields 21
2.3. Surface fields 22
2.4. Conclusions 27
3. Impact of climate variations and changes on plants and wildfire danger 37
3.1. Impact of climate variations and changes on plants 37
3.2. Impact of climate changes on wildfire danger 43
Authors: Čedo Branković (chapter 2)
Ksenija Cindrić (chapter 1)
Marjana Gajić-Čapka (chapter 1)
Ivan Güttler (chapter 2)
Mirta Patarčić (chapter 2)
Lidija Srnec (chapter 2)
Višnja Vučetić (chapter 3)
Ksenija Zaninović (chapter 1)

2
1. Observed Climate Changes
Detection of climate variations and changes in air temperature and precipitation over the
area of Croatia since the beginning of the 20th century has been performed according to the
long-term meteorological measurements that started during the 19th century at meteorological
stations in different climate regions: Osijek (continental climate), Zagreb-Grič (continental climate
under a mild maritime influence), Gospić (continental climate of highland Croatia under a strong
maritime influence), Crikvenica (maritime climate of eastern coast of the northern Adriatic) and
Hvar (maritime climate of the Dalmatian area).
Decadal trends during the 20th century as well as those till 2008 were compared in order
to determine the differences that appeared due to the changes in temperature and precipitation
regimes at the beginning of the 21st century.
1.1. Air temperature
Increase of mean annual air temperature, which in the 20th century was between +0.02°C
per 10 years in Gospić up to +0.07°C per 10 years in Zagreb, continued and amplified by the
beginning of the 21st century (Table 1-1 and 1-2). In such way, decadal trends were proceeding
until 2004 within the range from 0.04°C up to 0.08°C, and by 2008 between 0.05°C and 0.10°C.
Prevailing positive trend has become particularly expressed within the last 50 years, even more
within the last 25 years (Figure 1-1, Table 1-1). Trends of mean annual air temperature within
the 108-year period are statistically significant at all stations except for Osijek, while within the
last 50, i.e. 25 years at all observed stations. The positive temperature trends in the continental
part of Croatia is mostly due to winter trends (+0.06 °C/10 years in Osijek, +0.13 °C/10 years in
Zagreb and Gospić), while on the Adriatic to summer trends (+0.13 °C/10 years in Crikvenica
and +0.07 °C/10 years in Hvar). The greatest trends were recorded in Zagreb; however, it
should take into account that such increase is partially a result of the urban heat island.
Consequence of the faster atmosphere warming up during the last period of time is a result that
out of ten warmest years since the beginning of the 20th century 7 of them were recorded in
Zagreb, 6 in Gospić and Crikvenica, 5 in Hvar and 4 in Osijek (Table 1-3).
3
-2.5-2.0
-1.5-1.0-0.50.0
0.51.01.5
2.02.5
1900 1910 1920 1930 1940 1950 1960 1970 1980 1990 2000 2010Years
Anom
alie
s (°
C)
OSIJEK
-2.5-2.0
-1.5-1.0-0.50.0
0.51.01.5
2.02.5
1900 1910 1920 1930 1940 1950 1960 1970 1980 1990 2000 2010Years
Anom
alie
s (°
C)
ZAGREB-GRIČ
-2.5-2.0
-1.5-1.0-0.50.0
0.51.01.5
2.02.5
1900 1910 1920 1930 1940 1950 1960 1970 1980 1990 2000 2010Years
Anom
alie
s (°
C)
GOSPIĆ
-2.5-2.0
-1.5-1.0-0.50.0
0.51.01.5
2.02.5
1900 1910 1920 1930 1940 1950 1960 1970 1980 1990 2000 2010Years
Anom
alie
s (°
C)
CRIKVENICA
-2.5-2.0
-1.5-1.0-0.50.0
0.51.01.5
2.02.5
1900 1910 1920 1930 1940 1950 1960 1970 1980 1990 2000 2010Years
Anom
alie
s (°
C)
HVAR
1 9
0 0
1 9
1 0
1 9
2 0
1 9
3 0
1 9
4 0
1 9
5 0
1 9
6 0
1 9
7 0
1 9
8 0
1 9
9 0
2 0
0 0
2 0
1 0
1901-20081909-20081934-20081959-20081984-2008
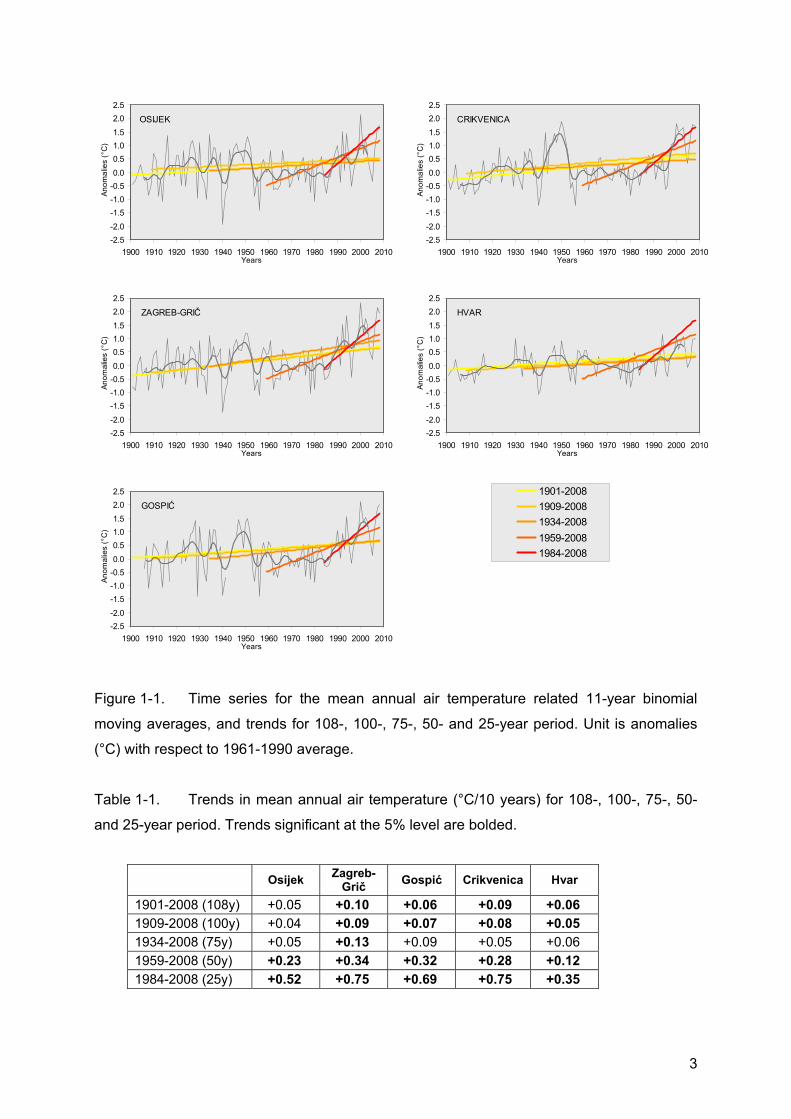
Figure 1-1. Time series for the mean annual air temperature related 11-year binomial
moving averages, and trends for 108-, 100-, 75-, 50- and 25-year period. Unit is anomalies
(°C) with respect to 1961-1990 average.
Table 1-1. Trends in mean annual air temperature (°C/10 years) for 108-, 100-, 75-, 50-
and 25-year period. Trends significant at the 5% level are bolded.
Osijek Zagreb-Grič Gospić Crikvenica Hvar
1901-2008 (108y) +0.05 +0.10 +0.06 +0.09 +0.06 1909-2008 (100y) +0.04 +0.09 +0.07 +0.08 +0.05 1934-2008 (75y) +0.05 +0.13 +0.09 +0.05 +0.06 1959-2008 (50y) +0.23 +0.34 +0.32 +0.28 +0.12 1984-2008 (25y) +0.52 +0.75 +0.69 +0.75 +0.35

4
Table 1-2. Trends in mean annual and seasonal air temperature .(°C/10 years) Trends
significant at the 5% level are bolded.
Osijek Zagreb-Grič Gospić Crikvenica Hvar
Mean air temperature trend 1901-2000 (°C / 10 godina)
Winter +0.04 +0.09 +0.10 +0.06 +0.04 Spring +0.02 +0.07 +0.00 -0.01 +0.02 Summer +0.03 +0.05 -0.03 +0.07 +0.03 Autumn +0.03 +0.05 +0.00 +0.07 +0.05 Year +0.03 +0.07 +0.02 +0.05 +0.04
Mean air temperature trend 1901-2004 (°C / 10 godina)
Winter +0.04 +0.10 +0.11 +0.07 +0.04 Spring +0.04 +0.09 +0.03 +0.02 +0.04 Summer +0.05 +0.08 +0.02 +0.11 +0.06 Autumn +0.03 +0.06 +0.02 +0.08 +0.06 Year +0.04 +0.08 +0.04 +0.07 +0.05
Mean air temperature trend 1901-2008 (°C / 10 godina)
Winter +0.06 +0.13 +0.13 +0.08 +0.04 Spring +0.05 +0.11 +0.05 +0.04 +0.05 Summer +0.06 +0.09 +0.04 +0.13 +0.07 Autumn +0.03 +0.07 +0.03 +0.09 +0.05 Year +0.05 +0.10 +0.06 +0.09 +0.06
Table 1-3. The ten warmest years. Years from the period 1991-2008 are bolded
Osijek Zagreb-Grič Gospić Crikvenica Hvar year °C year °C year °C year °C year °C 2000 12.9 2000 13.8 2000 10.5 1950 16.0 1945 19.2 2008 12.5 2007 13.6 2008 10.4 2000 15.9 1994 17.5 2007 12.4 2008 13.4 2007 10.3 2007 15.9 2003 17.4 1992 12.3 1994 13.3 1994 9.9 2008 15.8 2000 17.4 1994 12.2 2002 13.2 2002 9.9 2003 15.8 1930 17.3 1934 12.2 1992 13.0 1951 9.9 1951 15.7 2008 17.3 1916 12.1 2003 12.9 1947 9.9 1949 15.7 2007 17.3 1951 12.1 2006 12.7 1928 9.8 2002 15.7 1950 17.3 2002 12.1 2001 12.7 2003 9.8 1943 15.6 2002 17.3 1927 11.9 1950 12.7 2001 9.7 2001 15.6 1947 17.1
5
Assuming that the warming observed in mean air temperatures is a result of changes
in frequencies of temperature extremes. Analysis of changes in number of days, in which the
air temperature exceeds some specific values, does not provide any comparison of observed
characteristics in different climate conditions. Namely, frequency of cold (tmin<0°C) or warm
days (tmaks≥25°C) significantly differs between continental climate (Osijek) and maritime
climate of Adriatic islands (Hvar). Therefore, The Expert Team on Climate Change Detection
Monitoring and Indices of the World Meteorological Organization - Commission for
Climatology (WMO-CCl) and Research Programme on Climate Variability and Predictability
(CLIVAR) suggested a number of indices of meteorological parameters. Suggested indices
are related to days in which the air temperature exceeds the threshold specified by the
probability of appearance, i.e. in specific return period. Six indices have been used for the
analysis of temperature extremes, four of them with thresholds specified by percentiles and
two of them by fixed thresholds. Three warm temperature indices are warm days and warm
nights with maximum and minimum air temperature above the 90th percentile of the daily
temperature distribution in the 1961-1990 baseline period, as well as summer days with
maximum air temperature higher than 25°C. Three cold temperature indices are cold days
and cold nights with maximum and minimum air temperatures below the 10th percentile, as
well as frost days with minimum air temperature lower than 0°C.
Within the whole analyzed period, a majority of warm temperature indices has a
positive trend, while a majority of cold temperature indices has a negative trend (exceptions
are warm nights Tn10% in Hvar, and summer days in Gospić and frost days in Osijek) (Table
1-4). Comparison with trends from earlier periods 1901-2000 and 1901-2004 indicates that
almost all trends by 2008 has been amplified, some of them have become statistically
significant, while changes in trends of warm temperature indices are greater than changes in
trends of cold indices. Trends are much more expressed at the Adriatic, than in the inland,
except in Zagreb, where they are probably a result of urban heat island impact.

6
Table 1-4. Trends in indices of temperature extremes (FD, Tn10%, Tx10%, SU, Tn90% and
Tx90%) (number of days) according to the reference period 1961-1990, and mean values of
number of frost (FD) and summer (SU) days. Trends significant at the 5% level are bolded.
Osijek Zagreb Grič Gospić Crikvenica Hvar
Trend 1901-2000 (days / 10 years) FD +1.1 -0.9 +0.1 -0.7 0.0
Tn10% -0.3 -0.3 -0.3 -0.3 +0.9 Tx10% -1.1 -1.4 -0.5 -1.9 -5.4
SU -0.2 0.0 -1.2 +1.0 +2.6 Tn90% -0.5 +2.7 +0.6 +0.7 -0.8 Tx90% -0.3 +0.5 -0.1 +1.4 +3.3
Trend 1901-2004 (days / 10 years) FD +1.0 -0.9 +0.1 -0.8 -0.1
Tn10% -0.4 -2.7 -0.6 -2.9 +0.5 Tx10% -1.2 -1.7 -0.4 -2.0 -5.2
SU 0.0 +0.1 -0.6 +0.1 +2.6 Tn90% +0.1 +3.2 +1.3 +1.7 +0.4 Tx90% 0.0 +1.2 +1.1 +1.6 +3.8
Trend 1901-2008 (days / 10 years) FD +0.9 -0.1 -0.1 -0.8 -0.1
Tn10% -0.6 -2.7 -0.8 -2.9 +0.2 Tx10% -1.2 -1.7 -0.8 -1.9 -5.1
SU 0.0 +0.3 -0.4 +1.1 +2.6 Tn90% +0.6 +3.5 +1.9 +2.2 +1.0 Tx90% +0.4 +1.8 +1.5 +1.8 +4.1
Mean number of days in period 1961-1990. FD 88 60 120 18 5 SU 90 61 47 84 110

7
Years
Tn10
% (d
ays)
1900 1910 1920 1930 1940 1950 1960 1970 1980 1990 2000 20100
20
40
60
80
100
120 Trend = -0.6 days/10years OSIJEK
Years
Tn10
% (d
ays)
1900 1910 1920 1930 1940 1950 1960 1970 1980 1990 2000 20100
20
40
60
80
100
120 Trend = -2.7 days/10years *ZAGREB - GRIČ
Years
Tn10
% (d
ays)
1900 1910 1920 1930 1940 1950 1960 1970 1980 1990 2000 20100
20
40
60
80
100
120 Trend = -0.8 days/10years *GOSPIĆ
Years
Tn10
% (d
ays)
1900 1910 1920 1930 1940 1950 1960 1970 1980 1990 2000 20100
20
40
60
80
100
120 Trend = -2.9 days/10years *CRIKVENICA
Years
Tn10
% (d
ays)
1900 1910 1920 1930 1940 1950 1960 1970 1980 1990 2000 20100
20
40
60
80
100
120 Trend = 0.2 days/10yearsHVAR
Years
Tx10
% (d
ays)
1900 1910 1920 1930 1940 1950 1960 1970 1980 1990 2000 20100
20
40
60
80
100
120 Trend = -1.2 days/10god *OSIJEK
YearsTx
10%
(day
s)1900 1910 1920 1930 1940 1950 1960 1970 1980 1990 2000 20100
20
40
60
80
100
120 Trend = -1.7 days/10years ZAGREB - GRIČ
Years
Tx10
% (d
ays)
1900 1910 1920 1930 1940 1950 1960 1970 1980 1990 2000 20100
20
40
60
80
100
120 Trend = -0.8 days/10years GOSPIĆ
Years
Tx10
% (d
ays)
1900 1910 1920 1930 1940 1950 1960 1970 1980 1990 2000 20100
20
40
60
80
100
120 Trend = -1.9 days/10years *CRIKVENICA
Years
Tx10
% (d
ays)
1900 1910 1920 1930 1940 1950 1960 1970 1980 1990 2000 20100
20
40
60
80
100
120 Trend = -5.1 days/10years *HVAR
Figure 1-2. Time series for the number of days with minimum (Tn10% - left) and maximum (Tx10% - right) air temperatures below the 10th percentile, related binomial moving averages and trends (* - trends significant at the 5% level). Period: 1901-2008

8
Years
Tn90
% (d
ays)
1900 1910 1920 1930 1940 1950 1960 1970 1980 1990 2000 20100
20
40
60
80
100
120 Trend = +0.6 days/10years *OSIJEK
Years
Tn90
% (d
ays)
1900 1910 1920 1930 1940 1950 1960 1970 1980 1990 2000 20100
20
40
60
80
100
120 Trend = +3.5 days/10years *ZAGREB - GRIČ
Years
Tn90
% (d
ays)
1900 1910 1920 1930 1940 1950 1960 1970 1980 1990 2000 20100
20
40
60
80
100
120 Trend = +1.9 days/10years *GOSPIĆ
Years
Tn90
% (d
ays)
1900 1910 1920 1930 1940 1950 1960 1970 1980 1990 2000 20100
20
40
60
80
100
120 Trend = +2.2 days/10years *CRIKVENICA
Years
Tn90
% (d
ays)
1900 1910 1920 1930 1940 1950 1960 1970 1980 1990 2000 20100
20
40
60
80
100
120 Trend = +1.0 days/10years HVAR
Years
Tx90
% (d
ays)
1900 1910 1920 1930 1940 1950 1960 1970 1980 1990 2000 20100
20
40
60
80
100
120 Trend = +0.4 days/10years OSIJEK
YearsTx
90%
(day
s)1900 1910 1920 1930 1940 1950 1960 1970 1980 1990 2000 20100
20
40
60
80
100
120 Trend = +1.8 days/10years ZAGREB - GRIČ
Years
Tx90
% (d
ays)
1900 1910 1920 1930 1940 1950 1960 1970 1980 1990 2000 20100
20
40
60
80
100
120 Trend = +1.5 days/10years GOSPIĆ
Years
Tx90
% (d
ays)
1900 1910 1920 1930 1940 1950 1960 1970 1980 1990 2000 20100
20
40
60
80
100
120 Trend = +1.8 days/10years *CRIKVENICA
Years
Tx90
% (d
ays)
1900 1910 1920 1930 1940 1950 1960 1970 1980 1990 2000 20100
20
40
60
80
100
120 Trend = +4.1 days/10years *HVAR
Figure 1-3. Time series for the number of days with minimum (Tn90% - left) and maximum
(Tx90% - right) air temperatures above the 90th percentile, and related binomial moving
averages and trends (* - trends significant at the 5% level). Period: 1901-2008.
9
1.2. Precipitation
During the 20th century annual amounts of precipitation showed a downward trend in all parts of Croatia, thus joining the trend of drying across the Mediterranean (Figure 1-4 and Table 1-5). It is more expressed over the Adriatic (Crikvenica: -1.8% in 10 years, statistically significant and Hvar: -1.2% in 10 years), than in the inland (mountainous hinterlan– Gospić: -0.8% in 10 years, eastern Slavonija, Osijek: -1.3% in 10 years, north-western Croatia, Zagreb-Grič: -0.3% in 10 years). These are the results of the seasonal precipitation trends which differ among regions. In the area of northern Adriatic (Crikvenica) decrease in all seasonal precipitation amounts has been observed, mostly expressed during summer (-2.7% in 10 years), then in spring (-2.2% in 10 years) and winter (-1.8% in 10 years). On Dalmatian islands (Hvar) decrease in annual precipitation amounts is a result of decline in winter (-2.9% in 10 years) and spring (-2.0% in 10 years) precipitation amounts. In the mountainous hinterland (Gospić on the Lika plateau) a decrease in winter (-2.7% in 10 years) and spring (-2.0% in 10 years) precipitation amounts is mostly expressed. The decline in annual amounts of precipitation over the area north of the Sava River results from decrease in spring (Osijek: -4.1% in 10 years and Zagreb-Grič: -1.1% in 10 years) and autumn (Osijek: -3.0% in 10 years and Zagreb-Grič: -1.4% in 10 years) precipitation amounts.
Decadal trends in annual and seasonal precipitation amounts have not been significantly changed according to data series prolonged by 2008 (Table 1-5). Less changes are present with Osijek, where attenuation of negative spring precipitation trend was observed, but still remaining statistically significant, as well as weakening of negative autumn precipitation trend and strengthening of positive summer trend. Negative spring precipitation trend weakened in the area of Hvar.
Precipitation amounts have large interannual variability, both on annual and seasonal scales. Therefore, in order to find out position of 10 driest years in the observed 108-year period, it can be seen that they do not occur grouped in some period. During the last 18 years, i.e. since the beginning of 1990’s, there was only one out of three driest years. 2003 is one of 10 driest years at all locations. Beside this year, there was 2000 in Osijek, 2007 and 1994 in Gospić and 1992 in Hvar. (Table 1-6).
Variability of annual precipitation amounts in the period 1901-2008, expressed by time series of coefficients of variability, calculated for 30-year periods with one year shift, indicates a decrease in Zagreb, Gospić and Crikvenica (Figure 1-4 right). Such a decrease was present in Osijek by the end of the 20th century as well, but the changes since the beginning of the 21st century contribute to an increase of variability. In Hvar there was an increase of variability in a period from the middle of the 20th century.
Change in precipitation regime patterns, which can result in precipitation decrease in Croatia, can be also indicated by tendency in frequency and intensity of precipitation extremes defined by number of days in which the precipitation amount Rd exceeds defined thresholds (dry

10
days, wet days and very wet days), i.e. part of annual precipitation amount occurring during very rainy days, annual maximum 5-day and 1-day precipitation amounts. Dry days are defined as days in which Rd<1.0 mm, wet days have Rd ≥ 75th percentile and very wet days Rd ≥ 95th percentile of daily amounts, determined by the sample of all precipitation days (Rd≥1.0 mm) within standard reference period 1961-1990.
In the period 1901-2008 there was statistically significant increase of annual number of dry days (Rd<1.0 mm) in the whole area of Croatia, mostly negative trend of wet days (Rd≥R75%), significant in Osijek and Crikvenica, while in the number of very wet days (Rd≥R95%) there was no change (Table 1-7). Fraction of annual total precipitation due to very wet days (R95%T) is almost unaltered. Absolute annual 1-day and 5-day maxima indicate large interannual variability, with weak positive trend only on Dalmatian islands, while in the inland and Littoral there is a decrease of precipitation amounts during heavy precipitation events, statistically significant for 5-day maxima in Osijek (-1.0mm/10years) and 1-day maxima in Gospić (-1.4mm/10years). As seen from above, in the area of drying such as Croatia there is no signal of major secular changes in extremes related to the high amounts of precipitation and frequency of wet and very wet days over the larger part of Croatia. The reduction in the annual amounts of precipitation can be attributed to changes in the frequency of low-intensity rain days and significant increase in incidence of dry days all over Croatia. Table 1-5 Trends in. annual and seasonal precipitation amounts. Trends significant at the 5%
level are bolded.
Osijek Zagreb-Grič Gospić # Crikvenica Hvar Precipitation amount trend 1901-2000 (% / 10 years)
Winter +0.6 -0.3 -2.7 -1.8 -2.9 Spring -4.1 -1.1 -2.0 -2.2 -2.0 Summer +0.7 +1.2 +0.9 -2.7 +2.8 Autumn -3.0 -1.4 +0.1 -0.9 -0.4 Year -1.3 -0.3 -0.8 -1.8 -1.2
Precipitation amount trend 1901-2004 (% / 10 years) Winter +0.2 -0.4 -2.6 -1.9 -2.4 Spring -3.6 -0.9 -2.0 -2.1 -2.0 Summer +0.8 +0.9 -0.1 -3.4 +2.9 Autumn -1.8 -1.0 +0.6 -0.7 -1.0 Year -1.0 -0.3 -0.8 -1.8 -1.3
Precipitation amount trend 1901-2008 (% / 10 years) Winter -0.0 -0.4 -2.9 -1.6 -2.9 Spring -3.2 -0.9 -1.8 -1.9 -1.3 Summer +1.3 +1.1 +0.1 -2.9 +2.9 Autumn -2.0 -1.3 -0.2 -1.1 -0.5 Year -0.8 -0.3 -1.0 -1.7 -1.0
# since 1924.
11
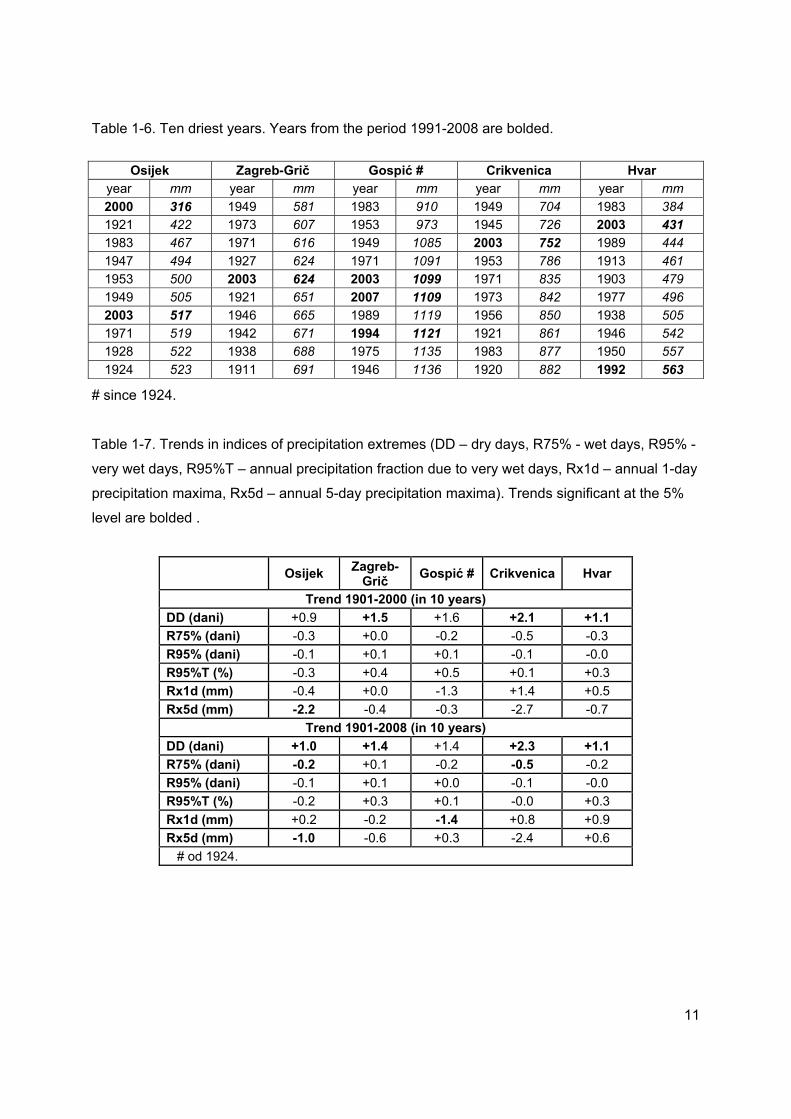
Table 1-6. Ten driest years. Years from the period 1991-2008 are bolded.
Osijek Zagreb-Grič Gospić # Crikvenica Hvar year mm year mm year mm year mm year mm 2000 316 1949 581 1983 910 1949 704 1983 384 1921 422 1973 607 1953 973 1945 726 2003 431 1983 467 1971 616 1949 1085 2003 752 1989 444 1947 494 1927 624 1971 1091 1953 786 1913 461 1953 500 2003 624 2003 1099 1971 835 1903 479 1949 505 1921 651 2007 1109 1973 842 1977 496 2003 517 1946 665 1989 1119 1956 850 1938 505 1971 519 1942 671 1994 1121 1921 861 1946 542 1928 522 1938 688 1975 1135 1983 877 1950 557 1924 523 1911 691 1946 1136 1920 882 1992 563
# since 1924.
Table 1-7. Trends in indices of precipitation extremes (DD – dry days, R75% - wet days, R95% -
very wet days, R95%T – annual precipitation fraction due to very wet days, Rx1d – annual 1-day
precipitation maxima, Rx5d – annual 5-day precipitation maxima). Trends significant at the 5%
level are bolded .
Osijek Zagreb-Grič Gospić # Crikvenica Hvar
Trend 1901-2000 (in 10 years) DD (dani) +0.9 +1.5 +1.6 +2.1 +1.1 R75% (dani) -0.3 +0.0 -0.2 -0.5 -0.3 R95% (dani) -0.1 +0.1 +0.1 -0.1 -0.0 R95%T (%) -0.3 +0.4 +0.5 +0.1 +0.3 Rx1d (mm) -0.4 +0.0 -1.3 +1.4 +0.5 Rx5d (mm) -2.2 -0.4 -0.3 -2.7 -0.7
Trend 1901-2008 (in 10 years) DD (dani) +1.0 +1.4 +1.4 +2.3 +1.1 R75% (dani) -0.2 +0.1 -0.2 -0.5 -0.2 R95% (dani) -0.1 +0.1 +0.0 -0.1 -0.0 R95%T (%) -0.2 +0.3 +0.1 -0.0 +0.3 Rx1d (mm) +0.2 -0.2 -1.4 +0.8 +0.9 Rx5d (mm) -1.0 -0.6 +0.3 -2.4 +0.6 # od 1924.

12
Years
Prec
ipita
tion
anom
alie
s (m
m)
1900 1910 1920 1930 1940 1950 1960 1970 1980 1990 2000 2010-600-500-400-300-200-100
0100200300400500600700800
Trend=-5.5mm/10years
P1961-1990= 651 mmOSIJEK
Years
Prec
ipita
tion
anom
alie
s (m
m)
1900 1910 1920 1930 1940 1950 1960 1970 1980 1990 2000 2010-600-500-400-300-200-100
0100200300400500600700800
Trend=-2.7mm/10years
P1961-1990= 883 mmZAGREB - GRIČ
Years
Prec
ipita
tion
anom
alie
s (m
m)
1900 1910 1920 1930 1940 1950 1960 1970 1980 1990 2000 2010-600-500-400-300-200-100
0100200300400500600700800
Trend=-14.3mm/10years
P1961-1990= 1369 mmGOSPIĆ
Years
Prec
ipita
tion
anom
alie
s (m
m)
1900 1910 1920 1930 1940 1950 1960 1970 1980 1990 2000 2010-600-500-400-300-200-100
0100200300400500600700800
Trend=-21.7mm/10years *
P1961-1990= 1243 mmCRIKVENICA
Years
Prec
ipita
tion
anom
alie
s (m
m)
1900 1910 1920 1930 1940 1950 1960 1970 1980 1990 2000 2010-600-500-400-300-200-100
0100200300400500600700800
Trend=-7.5mm/10years
P1961-1990= 730 mm
HVAR
0.10
0.15
0.20
0.25
0.30
1900
1910
1920
1930
1940
1950
1960
1970
1980
1990
2000
2010
Years
Coe
ficie
nt o
f var
iatio
n (c
v )
OSIJEKCV1961-1990 = 0,16
Trend = -0,003/10yrs *
0.10
0.15
0.20
0.25
0.30
1900
1910
1920
1930
1940
1950
1960
1970
1980
1990
2000
2010
YearsC
oeffi
cien
t of v
aria
tion
(cv )
ZAGREB-GRIČcv 1961-1990 = 0,15
Trend = -0,010/10yrs *
0.10
0.15
0.20
0.25
0.3019
00
1910
1920
1930
1940
1950
1960
1970
1980
1990
2000
2010
Years
Coe
ffici
ent o
f var
iatio
n (c
v )
GOSPIĆcv1961-1990 = 0,15
Trend = -0,005/10yrs *
0.10
0.15
0.20
0.25
0.30
1900
1910
1920
1930
1940
1950
1960
1970
1980
1990
2000
2010
Years
Coe
ffici
ent o
f var
iatio
n (c
v )
CRIKVENICAcv 1961-1990 = 0.19
Trend = -0.004/10yrs *
0.10
0.15
0.20
0.25
0.30
1900
1910
1920
1930
1940
1950
1960
1970
1980
1990
2000
2010
Years
Coe
ffici
ent o
f var
iatio
n (c
v )
HVARcv1961-1990 = 0,21
Trend = 0,029/10yrs *
Figure 1-4. Time series for the annual precipitation amounts, related 11-year binomial moving averages and trends (left), unit is anomalies (mm) with respect to 1961-1990 average). Time series for the coefficients of variation for 30-year periods with one year shift and trends (right). (* - trends significant at the 5% level). Period: 1901-2008 (Gospić: 1924-2008).

13
-50
-40
-30
-20
-10
0
10
20
30
40
1900 1910 1920 1930 1940 1950 1960 1970 1980 1990 2000 2010Godine
Ano
mal
ies
(day
s)
OSIJEKDD1961-1990=271days
Trend=+1.0day/10yrs *
-50
-40
-30
-20
-10
0
10
20
30
40
1900 1910 1920 1930 1940 1950 1960 1970 1980 1990 2000 2010Godine
Ano
mal
ies
(day
s)
ZAGREB-GRIČDD1961-1990=266days
Trend=+1.4days/10yrs *
-50
-40
-30
-20
-10
0
10
20
30
40
1900 1910 1920 1930 1940 1950 1960 1970 1980 1990 2000 2010Godine
Ano
mal
ies
(day
s)
GOSPIĆDD1961-1990=254days
Trend=+1.4days/10yrs
-50
-40
-30
-20
-10
0
10
20
30
40
1900 1910 1920 1930 1940 1950 1960 1970 1980 1990 2000 2010Godine
Ano
mal
ies
(day
s)
CRIKVENICADD1961-1990=268days
Trend=+2.3days/10yrs *
-50
-40
-30
-20
-10
0
10
20
30
40
1900 1910 1920 1930 1940 1950 1960 1970 1980 1990 2000 2010Godine
Ano
mal
ies
(day
s)
HVARDD1961-1990=288days
Trend=+1.1day/10yrs *
0
10
20
30
40
50
60
1900 1910 1920 1930 1940 1950 1960 1970 1980 1990 2000 2010Years
n (d
ays)
OSIJEK TrendR75=-0.2days/10yrs
TrendR95=-0.1days/10yrs
0
10
20
30
40
50
60
1900 1910 1920 1930 1940 1950 1960 1970 1980 1990 2000 2010Years
n (d
ays)
ZAGREB-GRIČ TrendR75=+0.1days/10yrs
TrendR95=+0.1days/10yrs
0
10
20
30
40
50
60
1900 1910 1920 1930 1940 1950 1960 1970 1980 1990 2000 2010Years
n (d
ays)
GOSPIĆ TrendR75=-0.2days/10yrs
TrendR95=+0.0days/10yrs
0
10
20
30
40
50
60
1900 1910 1920 1930 1940 1950 1960 1970 1980 1990 2000 2010Years
n (d
ays)
CRIKVENICA TrendR75=-0.5days/10yrs *
TrendR95=-0.1days/10yrs
0
10
20
30
40
50
60
1900 1910 1920 1930 1940 1950 1960 1970 1980 1990 2000 2010Years
n (d
ays)
HVAR TrendR75=-0.2days/10yrs
TrendR95=-0.0days/10yrs
Figure 1-5. Time series for the number of dry days (left), unit is anomalies (days) with respect to 1961-1990 average. On the right time series for the number of moderate wet days (Rd>R75% - above) and very wet days (Rd>R95% - below), related 11-year binomial moving averages and trends (* - trends significant at the 5% level). Period: 1901-2008. (Gospić: 1924-2008).
14
1.3. Dry spells
Detected significant positive trend in number of dry days in the area of Croatia raises the
question on frequency of consecutive dry days. Variations of dry sequences are analysed
imploying daily precipitaiton data from the period 1961-2000 at 25 meteorological stations, which
uniformly comprise main climate zones in Croatia (continental, mountain and maritime). Dry spell
is defined as a sequence of days with daily precipitation amount (Rd) less than defined
threshold. Seasonal and annual mean and maximum durations of dry spells have been analyzed
for precipitation threshold of 1 mm and 10 mm. Trend is expressed as depature per decade in
relation to the respective long-term mean value.
Results of trend analysis indicate prevailing increase of mean annual duration of dry
spells with Rd < 1 mm . It is statistically significant in Istria (5 to 6%/10years) and on southern
islands (Hvar and Lastovo 5%/10years) (Figure 1-6). Increase of dry spells on annual basis is a
result of prevailing increase in all seasons, except in autumn, when negative trend has been
observed. The most significant changes have been detected in spring, especially in northern
Adriatic (8 to 11%/10years). Analysis of annual maximum dry spells with Rd < 1 mm does not
reveal any significant positive or negative trend in Croatia (Figure 1-6). Positive trend prevails in
spring and it is statistically significant in northern Adriatic (9 to 11%/10years), while negative
trend prevails in autumn, which is significant only in Rijeka, Šibenik and Osijek (9 to
12%/10years).
Analysis of annual mean durations of dry spells for daily precipitation threshold of 10 mm
indicates prevailing positive trend in Croatia, significant in Istria and Dubrovnik (6 to 8%/10years)
(Figure 1-6). Negative, but statistically insignificant trend has been observed only in lowlands of
Croatia. Statistical significance of trend at annual scale is mostly forced by winter and summer
significant increase of mean dry spells. Still, positive trend, statistically the most significant one,
has been observed in spring; while in autumn, durations of mean dry spells with Rd < 10 mm
decline, especially in the area of Slavonija (10 to 11%/10years). Maximum dry spells have being
increased along the coast (10 to 11 %/10years), while reduced in the inland (8 %/10years)
(Figure 1-7). Such annual trend of maximum dry spells is mostly contributed by summer
variations. Prevailing increase of dry spells at the Adriatic, as well as poorly expressed trend in
the continental area contribute to the fact that Croatia remains within the transitional area
between the northern Europe with general tendency of precipitation increase, and the drying
Mediterranean.

15
Figure 1-6. Trend results of mean dry spells for the precipitation threshold of 1 mm (left column) and 10 mm (right column), for seasons (upper four rows) and a year (lower row). Circles indicate positive trend, triangles negative trend, while symbols in bold type indicate statistically significant trend. Size of symbols is proportional to the absolute value of change per decade relative to the respective average: 1-5%/10years, 5-10%/10 years and larger than 10%. Squares indicate trend between +/- 1%/10years.

16
Figure 1-7. Trend results for maximum durations of dry spells for precipitation threshold of 1 mm (left column) and 10 mm (right column), for seasons (upper four rows) and a year (lower row). Circles indicate positive trend, triangles negative trend, while symbols in bold type indicate statistically significant trend. Size of symbols is proportional to the absolute value of change per decade relative to the respective average: 1-5%/10years, 5-10%/10 years and larger than 10%. Squares indicate trend between +/- 1%/10years.
17
References: Anagnostopoulou C, Maheras P, Karacostas T, Vafiadis M (2003) Spatial and temporal analysis of dry
spells in Greece. Theor Appl Climatol 74: 77-91 Cindrić, K. (2006): The statistical analysis of wet and dry spells in Croatia by binary DARMA (1,1) model.
Hrv. meteor čas., 41, 43-51 Cindrić K. (2006) The statistical analysis of wet and dry days by binary DARMA (1,1) model in Split,
Croatia. BALWOIS – Conference on Water observation and Information System for Decision Support, 23-26.5.2006., Ohrid, Macedonia, Ministry of Education and Science of Republic of Macedonia: A-239.
Cindrić, K., Pasarić, Z., Gajić-Čapka, M. (2009) Spatial and temporal analysis of dry spells in Croatia. Theor Appl Climatol (predano)
Gajić-Čapka M (2006) Trends in indices of precipitation extremes in Croatia, 1901-2004 Sixth European Conference on Applied Climatology (ECAC), Ljubljana, Slovenia, 4-8 September 2006, Abstracts, A-00471
Gilbert RO (1987) Statistical methods for environmental pollution monitoring. John Wiley & Sons, Inc., New York
Juras J, Jurčec V (1976) The statistical analysis of dry and wet spells by the application of Markov chain probability model (in Croatian). Papers, RHMZ Hrvatske, 13: 59-98
Klein Tank, A.M.G., Können, G.P., 2003: Trends in Indices of Daily Temperature and Precipitation Extremes in Europe, 1946-99, J. Climate, 16, 3665-3680
Lana X, Martinez M D, and Burgueno A, Serra C, Martin-Vide and Gomez L (2008) Spatial and temporal patterns of dry spell lengths in the Iberian Peninsula for the second half of the twentieth century. Theor Appl Climatol 91: 99-116
Meehl, GA, Stocker TF, Collins WD, Friedlingstein P, Gaye AT, Gregory JM, Kitoh A, Knutti R, Murphy JM, Noda A, Raper SCB, Watterson IG, Weaver AJ, Zhao Z-C (2007) Global Climate Projections. In: Solomon S, Qin D, Manning M, Chen Z, Marquis M, Averyt KB, Tignor M, Miller HL (eds) Climate Change 2007: The Physical Science Basis. Contribution of Working Group 1 to the Fourth Assessment Report of the Intergovernmental Panel on Climate Change, Cambridge University Press, Cambridge, United Kingdom and New York, NY, USA.
Peterson, T. et al, 2001: Report on the activities of the working group on climate change detection and related rapporteurs, WCDMP - No. 47
Sen PK (1968) Esitmates of the regression coefficient based on Kedall’s tau. J Am Stat Assoc 63: 1379-1389
Serra C, Burgueno A, Martinez MD and Lana X (2006) Trends in dry spells across Catalonia (NE Spain) during the second half of the 20th century. Theor Appl Climatol, 85: 165-183
Schmidli J, Frei C (2005) Trends of heavy precipitation and wet and dry spells in Switzerland during the 20 th century. Int J Climatol 25: 753-771
WMO, 2004: Report of the CCI/CLIVAR expert team on climate change detection, monitoring and indices (ETCCDMI), WCDMP - No. 54.
Zaninović, K., 2006: Trends in indices of temperature extremes in Croatia, 1901-2004, Sixth European Conference on Applied Climatology (ECAC), Ljubljana, Slovenia, 4-8 September 2006, CD, Abstracts, A-00470
Zaninović, K., Gajić-Čapka, M., Perčec Tadić, M. et al, 2008: Klimatski atlas Hrvatske / Climate atlas of Croatia 1961-1990., 1971-2000. Državni hidrometeorološki zavod, Zagreb, 200 str.

18
2. Climate Change Scenario
2.1. Introduction
2.1.1 General remarks
Information on global climate change of the mean value of some climatological
parameter, temperature for example, is not sufficient to estimate climate change at regional or
local level. The intensity of local climate change can differ from the change of global mean value
because of specific latitude, topographic features, distribution of land and sea, etc. However,
local climate change should be viewed within the context of global change modulated by local
impacts. In this report the results of dynamical downscaling by a regional climate model for the
two 30-year periods are described and discussed – for the climate of the 20th century and the
future climate from the 21st century, according to the A2 scenario of Intergovernmental Panel on
Climate Change (IPCC).
Dynamical downscaling is the method that adjusts the output of a global climate model to
a smaller area by the help of a regional climate model. Thus, the results of climate change at a
relatively coarse resolution (200-300 km) are being adjusted to much finer space resolution (20-
50 km). In this process a regional model defines its “own” hydro- and thermo-dynamical
processes at smaller scales, adjusting to the boundary forcing from a global model. In such a
way, dynamical consistency in the modelled atmosphere is being achieved. Space variations of
climate parameters are better represented at smaller scales by dynamical downscaling,
especially extreme events, whose intensity in global models is usually weakened as the smallest
grid box of few hundred kilometres can cover the whole region of interest. The alternatives to
dynamical downscaling are statistical downscaling methods, but they do not take into account
the dynamical connection between global and regional scales.
Although defined for smaller areas and finer resolution, regional climate models cannot
improve possible poor results of global models. Of course, vice versa is valid as well –
dynamical downscaling by a poor regional climate model cannot improve the global model
simulation regardless of the resolution improvement. In other words, the quality of dynamical
downscaling results depends on the quality of regional model used for dynamical downscaling
as well as on the quality of global model results.
It should be pointed out that the results of a regional climate model cannot accurately
describe observational data at regional (local) scale. Of course, it is important that the difference
between model results and observations would be as small as possible, but, as model offers
only approximation of the actual situation, it inevitably contains errors. Accordingly, a good
model is the one with relatively small (systematic) errors. After comparing the model results with

19
observations, by which the modelled climate “state” of the atmosphere for the 20th century is
determined, differences between the future model climate and 20th century climate have been
analysed. Such differences primarily point out to qualitative assessment of climate change. Due
to a number of uncertainties, quantitative climate change assessments should be taken with
caution. However, they are necessary in order to execute concrete adaptation and mitigation
measures to climate change effects. For example, one of key uncertainties in climate change is
the definition of future scenarios given by IPCC (see chapter 2.1.4). This uncertainty is not a
result of our lack of understanding of climate system, but a fact that human activities and their
possible impact on a future climate should be observed through complex and unpredictable
interactions.
2.1.2 Global model, regional model and dynamical downscaling
Dynamical downscaling has been applied to the results of the EH5OM global model,
included in the IPCC Fourth Assessment Report (AR4). EH5OM is a coupled atmospheric and
oceanic model developed at Max Planck Institute for Meteorology, Hamburg, Germany. Details
of EH5OM are given in Roeckner et al. (2003). The EH5OM simulation of the 20th century
climate was performed for three different realisations, which differ in a definition of initial
conditions. In such a way, sensitivity of climate model to initial conditions is accounted for. For
the A2 scenario there are also three model realisations available, each of them being the
continuation of the current climate.
The IPCC scenarios for some future period (see Nakićenović et al. 2000) define general
assumptions, which climate models should take into consideration after they have been adapted
to a model. The A2 scenario assumes the growth of global population to 15 billion by 2100, a
moderate economic growth, very high energy consumption and variable hydrocarbons (gas, oil,
coal) consumption, as well as moderate to significant arable land usage. These projections are
then adapted to a model as the concentrations of greenhouse gases and ozone. The A2
scenario is also called the strong forcing scenario because it predicts the most unfavourable
conditions that could occur to the environment – it represents the upper limit of anthropogenic
impact to the atmosphere and climate in this century.
For this report, the results of dynamical downscaling by so-called Regional Climate
Model of the third generation (RegCM3), have been used. RegCM was developed by Dickinson
et al. (1989) and Giorgi (1990). The detailed description of the model version used here is given
in Pal et al. (2007). In our experiments the Grell convection scheme (Grell 1993) has been
applied along with the Fritsch-Chappel closure (Fritsch and Chappel, 1980). The model
horizontal resolution is 35 km in the area with 126 X 88 points centred at 46ºN, 7.5ºE and cover
central and eastern Europe and a large part of the Mediterranean. In the vertical, there are 23
20
levels with the highest level at 100 hPa. Boundary conditions, taken from the EH5OM model,
were updated every 6 hours. Dynamical downscaling is performed for all three realisations of the
EH5OM global model for 20th century climate and for future climate according to the IPCC A2
scenario.
2.1.3 Selection of periods and seasons
Seasonal mean values for all climatological seasons have been used in the analysis of
climate change, while for upper-air fields only the results for winter and summer have been
shown. For winter, seasonal mean values were calculated for December-January-February
(DJF) period, for spring for March-April-May (MAM) period, etc. Mean values of the 30-year
period of future climate (2041-2070) have been compared with mean values of the 30-year
period of the 20th century climate (1961-1990). For each parameter and season, statistical
significance of the change in the mean value between future and 20th century climate has been
calculated. It is based on the testing of the null-hypothesis where the mean values of future and
current climate “populations” do not differ. The null-hypothesis is accepted or rejected at the
95% confidence level. In addition to mean values, interannual variability within each 30-year
period has been calculated as well. The change in variability is expressed as a difference in
standard deviation between future and 20th century climate, calculated from all three model
realisations. From the change in mean value and variability, the change of extreme values for
the given parameter can be indirectly assessed.
2.1.4 Uncertainties in climate modelling
An estimate of uncertainty in the assessment of future climate change, in particular at
regional scale, is an important aspect of the climate change analysis. Uncertainty can be
attributed to the following factors: firstly, uncertainty due to inherent (internal) variability of
climate system; secondly, uncertainty in defining the future climate scenarios; and thirdly,
modelling uncertainty because of approximations in representing processes in the atmosphere
and oceans. Relative significance of each of the above factors varies on how far we reach into
the future, as well as on spatial and time averaging scales (Hawkins and Sutton 2009). For
example, at the regional level, for multi-decade time scales, dominant source of uncertainty is
uncertainty in modelling and uncertainty of the given scenario. For smaller time scales, model
and inherent variability of climate system represent the main cause of uncertainty. This report
does not include explicit assessment of uncertainties of climate integrations by regional model.
However, some results of regional model were compared with the results of global model, thus
enabling to evaluate, at least partly, to what extent the uncertainty of climate change could be
attributed to different modelling approaches.
21
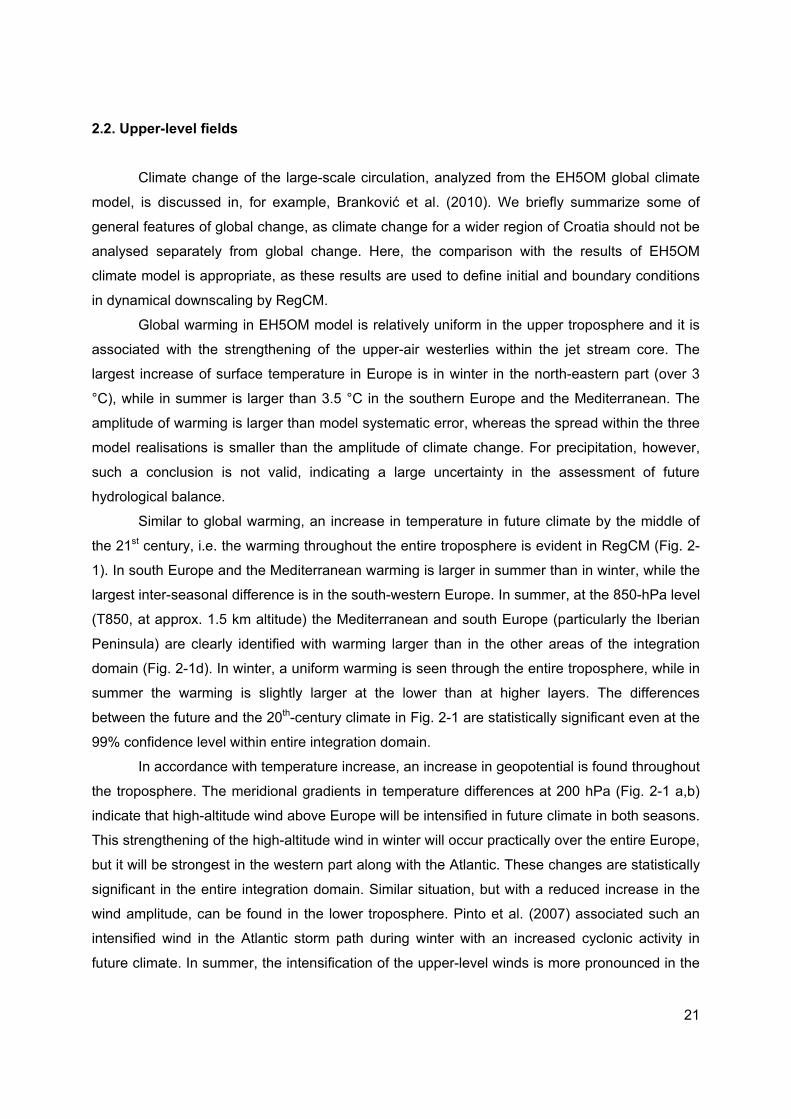
2.2. Upper-level fields
Climate change of the large-scale circulation, analyzed from the EH5OM global climate
model, is discussed in, for example, Branković et al. (2010). We briefly summarize some of
general features of global change, as climate change for a wider region of Croatia should not be
analysed separately from global change. Here, the comparison with the results of EH5OM
climate model is appropriate, as these results are used to define initial and boundary conditions
in dynamical downscaling by RegCM.
Global warming in EH5OM model is relatively uniform in the upper troposphere and it is
associated with the strengthening of the upper-air westerlies within the jet stream core. The
largest increase of surface temperature in Europe is in winter in the north-eastern part (over 3
°C), while in summer is larger than 3.5 °C in the southern Europe and the Mediterranean. The
amplitude of warming is larger than model systematic error, whereas the spread within the three
model realisations is smaller than the amplitude of climate change. For precipitation, however,
such a conclusion is not valid, indicating a large uncertainty in the assessment of future
hydrological balance.
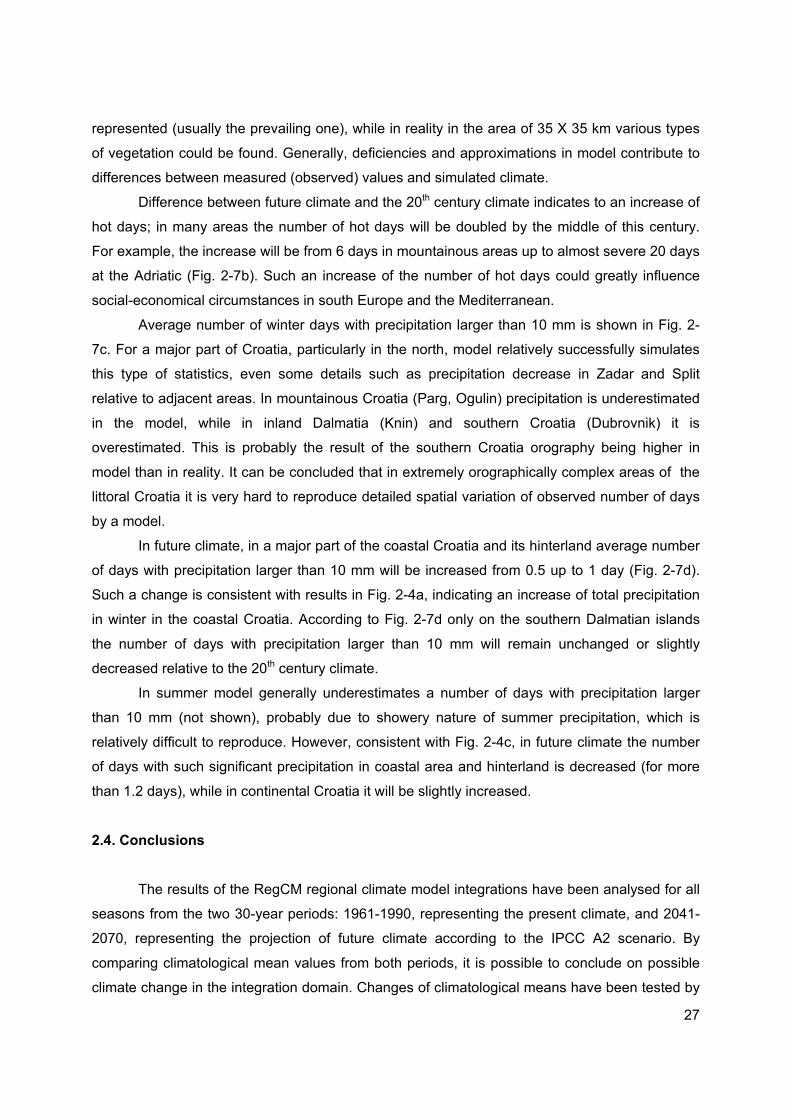
Similar to global warming, an increase in temperature in future climate by the middle of
the 21st century, i.e. the warming throughout the entire troposphere is evident in RegCM (Fig. 2-
1). In south Europe and the Mediterranean warming is larger in summer than in winter, while the
largest inter-seasonal difference is in the south-western Europe. In summer, at the 850-hPa level
(T850, at approx. 1.5 km altitude) the Mediterranean and south Europe (particularly the Iberian
Peninsula) are clearly identified with warming larger than in the other areas of the integration
domain (Fig. 2-1d). In winter, a uniform warming is seen through the entire troposphere, while in
summer the warming is slightly larger at the lower than at higher layers. The differences
between the future and the 20th-century climate in Fig. 2-1 are statistically significant even at the
99% confidence level within entire integration domain.
In accordance with temperature increase, an increase in geopotential is found throughout
the troposphere. The meridional gradients in temperature differences at 200 hPa (Fig. 2-1 a,b)
indicate that high-altitude wind above Europe will be intensified in future climate in both seasons.
This strengthening of the high-altitude wind in winter will occur practically over the entire Europe,
but it will be strongest in the western part along with the Atlantic. These changes are statistically
significant in the entire integration domain. Similar situation, but with a reduced increase in the
wind amplitude, can be found in the lower troposphere. Pinto et al. (2007) associated such an
intensified wind in the Atlantic storm path during winter with an increased cyclonic activity in
future climate. In summer, the intensification of the upper-level winds is more pronounced in the

22
northern part of the domain, whereas above our areas the northern wind component will be
strengthened, although the westerly wind will still prevail.
2.3. Surface fields
2.3.1 Temperature at 2 m (T2m)
In all seasons temperature at 2 m will be increased in future climate (Fig. 2-2); this is
statistically significant even at the 99% confidence level. However, warming of the European
continent is not the same across the seasons. For example, in winter and spring, the warming is
larger in the north-eastern part of Europe than in the Mediterranean (Fig. 2-2 a,b). Such a
differential field in T2m is reflected on the Croatian region as well, where a temperature increase
in winter is slightly higher in the northern part (for approximately 1.8 °C), and less pronounced in
the southern parts of the country (about 1.5 °C; Fig. 2-2a). The warming in future climate,
indicated in Fig. 2-2a, is smaller, on average, for about 0.5-1.0 degree than the warming
obtained by EH5OM global model (Branković et al. 2010). In spring, an increase in temperature
is relatively uniform throughout Croatia (Fig. 2-2b), and, with the amplitude of warming of about
1.5 °C, it is quite similar to winter warming.
In summer and autumn, warming is more pronounced in south Europe and along the
coastal part of the Mediterranean (Fig. 2-2 c,d), and significantly exceeds the warming from
colder part of the year. For example, above the Iberian Peninsula, amplitude exceeds 4 °C in
summer, while in Croatia the warming is between 2 °C in the northern and almost 3 °C in the
southern part of the country. In autumn, the T2m increase will be between 1.5 °C in a larger
portion of the continental Croatia and slightly above 2 °C in the coastal zone, as well as in Istria
and the Dalmatian hinterland. In summer, the warming is similar to that from the winter period
(Fig. 2-2c), and for approximately 1 °C smaller than in EH5OM global model. The differences in
the future T2m warming between global and regional model can be the consequence of various
factors or of their combination. Probably the main source of largest differences between the
models is differently defined parameterization of unresolved physical processes. However, the
differences could be also attributed to a more detailed (better) orography resolution in the
regional model.
The above warming is calculated as the mean value of the three-member ensemble.
Unlike the ensemble mean, change in temperature interannual variability, expressed by
standard deviation, indicates only a slight increase of temperature variability in future climate
(not shown). The T2m standard deviation has a maximum a little higher than 0.3 °C in summer
in the eastern and southern Croatia – that is much lower than mean values from Fig. 2-2. In
autumn and winter, the change in variability is even smaller, with no change at all in spring.

23
Such a result indicates that in future climate interannual variation of extreme temperature
(usually quantified as the sum of mean value and interannual variation) will mostly depend on
change/increase of mean temperature, while it will depend significantly less on the year-to-year
temperature variation. Räisänen (2002) came to a similar conclusion analyzing results for the
globe from 19 global models.
Increased greenhouse gases concentration according to the A2 scenario will cause
relatively larger warming of near-surface atmosphere in summer, which may have a negative
impact on human activities and health (see e.g. Srnec i Zaninović 2008). However, global
warming should not have damaging consequences if adequate adaptation measures are taken.
A higher average temperature in spring can cause an earlier beginning of the vegetation period,
while higher temperature in autumn could bring, for example, a prolonged tourist season at the
Adriatic coast. However, positive consequences in one season can be “counterbalanced” by
negative consequences in another season (for example, a possible reduction of energy
consumption for heating in winter is being compensated by increased energy consumption for
cooling in summer).
2.3.2 Surface pressure and wind
The increase of geopotential above south Europe in winter is reflects as an increase in
mean surface pressure in future climate (not shown). This increase in surface pressure is
statistically significant for southern Croatia, but not for other areas. A tendency towards
increased pressure can result in an increased frequency of anticyclonic weather types. In
summer our regions will be affected by relatively insignificant change of mean pressure – the
pressure will be slightly higher in northern areas and slightly lower in south Croatia. However,
regardless of the small change in amplitude, the pressure decrease in south Croatia is
statistically significant. Therefore, the middle and southern Adriatic will be exposed to an
increased cyclonic activity in summer, which will cause more frequent unstable weather types.
In chapter 2.2, it has been ascertained that in future climate, associated with an
intensification of the Atlantic storm path, westerly upper-level winds will become stronger, in
particular in winter within free atmosphere above the north-western Europe. Similar is true for
wind at 10 m (surface wind), which will be intensified in winter to the north of the Alps and
weakened at its southern slopes (Fig. 2-3a). Above our areas differential wind (the difference
between mean wind in future climate and mean wind in the 20th century climate) will retain
similar intensity as in the 20th century, but it will slightly turn to the north-east direction, i.e. it will
get a somewhat stronger south-western component. Such a differential surface wind will bring to
our areas a slightly increased humidity from the western Mediterranean and the Adriatic (not

24
shown), causing a slight increase in winter precipitation in the littoral and mountain areas (see
Fig. 2-4a).
In spring and autumn surface wind will remain unchanged in future climate, while in
summer north-eastern component will be intensified (Fig. 2-3b). Related to this intensified wind
from the inland of the Balkan Peninsula (where in summer humidity in the near-surface layer is
smaller than humidity above the Adriatic Sea) is the associated precipitation decrease, at the
coastal part of Croatia (cf. Fig. 2-4c).
2.3.3 Precipitation
At regional and local scale the precipitation may have large spatial variability even in
climatological mean. It primarily depends on physical features of the surface – altitude and relief
indentation. These features are better represented in regional than in global models, so it can be
expected that precipitation will be better represented as well. In addition to the representation of
precipitation, a better resolved orography has a more appropriate impact on physical processes -
for example, in triggering summer convection.
(i) Total precipitation
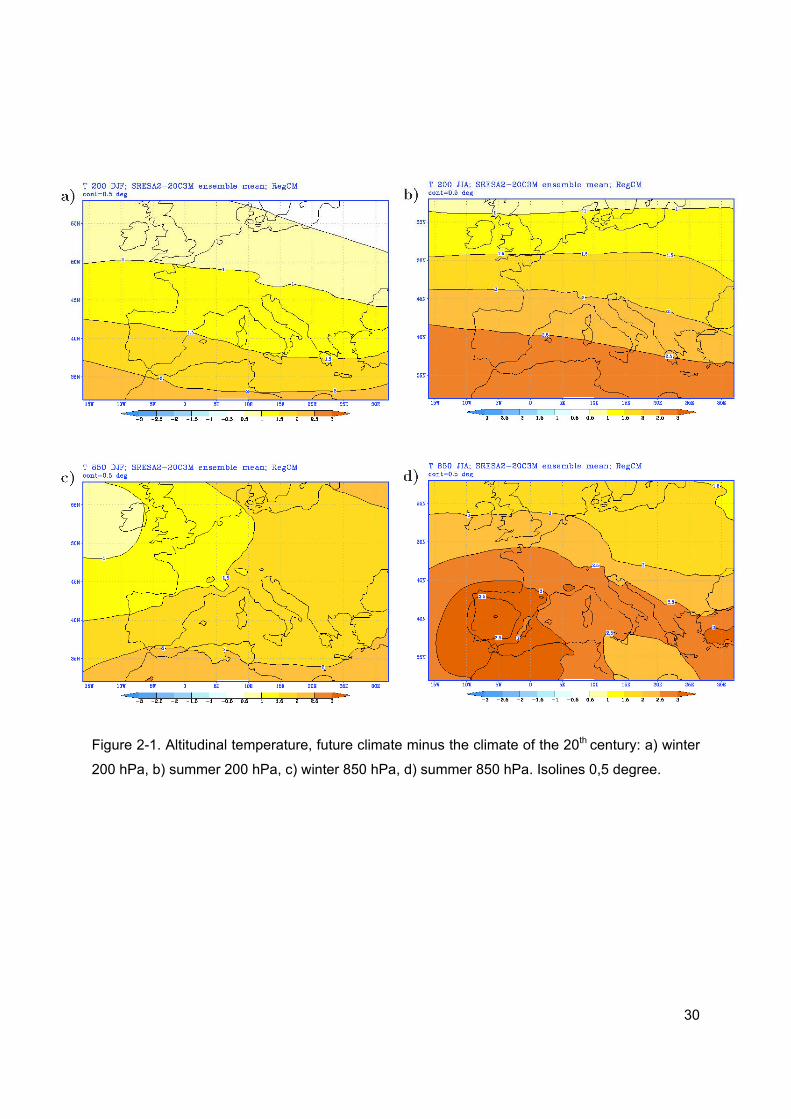
Change in total precipitation in future climate relative to the 20th century climate, is shown
in Fig. 2-4 for all four seasons. The structure of change – an increase of future total precipitation
in north Europe and a decrease in the south – is similar in all seasons and it is associated with
the path of storm disturbances from the Atlantic into the European continent. The region of the
precipitation increase is moved to the north in summer as storm paths are located further north.
Giorgi and Coppola (2007) noticed such a “transition” of climate change in precipitation through
year analysing the results from 22 global climate models. Clearly, our results for regional
adaptation bear semblance to global models.
From Fig. 2-4 it can be seen that total precipitation is decreased in three seasons (spring,
summer and autumn), primarily in the coastal, southern and mountainous Croatia. The decrease
is less than 0.5 mm day-1 (or 45 mm in a season), except in autumn in southern areas, when it is
slightly higher than 0.5 mm day-1. Only in winter (Fig. 2-4a) there will be a slight precipitation
increase, mainly in the littoral and mountainous part of Croatia, as well as in the northern and
eastern parts.
Total precipitation change, especially in winter and spring (Fig. 2-4 a,b), is concentrated
in relatively narrow zone along the Adriatic, whereas for a major part of the Adriatic Sea there is
small or no change in total precipitation. Considering quite a complex orography of our Adriatic
coast (steep rise of high mountains), such a structure of climate change in precipitation (narrow

25
and elongated) indicates the need of dynamical downscaling with even finer horizontal resolution
than the current 35 km.
In summer, a relative decrease of total precipitation along the eastern Adriatic coast and
its inland is larger than in spring and autumn, as total precipitation is smallest in summer. For a
major part of our Adriatic coast and its inland a relative decrease of total precipitation in summer
is over 20%, while in autumn and spring deficit is lower than 15%. This is indirectly confirmed in
Fig. 2-5, where shaded areas of t-test indicate statistical significance in total precipitation change
at the 95% confidence level. In summer, a decrease of total precipitation along the eastern
Adriatic coast and inland is statistically significant (Fig. 2-5c), while in spring (Fig. 2-5b) and
autumn (Fig. 2-5d) precipitation decrease in future climate is significant only in the southern part
of the eastern Adriatic coast. It is interesting to notice that precipitation increase in winter is not
significant. It could be concluded therefore that in future climate in most of the year there will be
a deficit in precipitation in western and southern Croatia, while the increase in winter is not
reliable. In northern parts of the country there will be no significant change in total precipitation in
future climate. Change in interannual variation of precipitation described by the variation
coefficient, indicates an increase in variability in future climate. It is pronounced mainly in the
Mediterranean (mostly in summer, least in winter) and it is very weak north of 45 °N (not shown).
The comparison of climate change in total precipitation in Fig. 2-4 with the results of
global model indicates the following: the structure of anomaly fields in Fig. 2-4 generally
coincides with those from global model (compare with Giorgi and Coppola, 2007, and Branković
et al. 2010); however, in Fig. 2-4 there are clearly details at a finer scale, which cannot be seen
in global model. In winter, the amplitude of positive anomaly (increase of total precipitation) in
the littoral Croatia is slightly higher in RegCM (Fig. 2-4a), than in global model, where the result
is mostly neutral. In summer, a decrease of total precipitation is slightly more evident in the
littoral Croatia and its hinterland in RegCM model, while in global model it is more pronounced in
the northern Croatia. Therefore, model results should be interpreted cautiously, as they could
indicate the opposite effects, particularly in the analysis at smaller scales (see comment in
2.1.4).
(ii) Snow
It is expected that the change in the coverage (spatial distribution) and height of snow
cover in Europe will occur in association with global warming in winter (Fig. 2-2a). A large
decrease of snow cover in future climate, more than 30 mm (but less than 50 mm) of equivalent
water, can be found in the Alps (Fig. 2-6a). In other mountainous areas of middle and southern
Europe (the Carpathians, the Balkan mountains, the Pyrenees) there will be a reduction of snow
cover as well, and also in the lowlands of Germany, Poland and Russia. In our areas, the

26
reduction is 1 mm in northern Croatia, up to slightly more than 2 mm in mountainous areas.
Although such a reduction of snow cover in Croatia may seem irrelevant, compared, for
example, with the Alps, in relative terms it is quite significant. Except in the north-western
Croatia and Istria, the reduction of snow cover by the middle of this century is statistically
significant (Fig. 2-6b). The reduction of snow cover will generally bring a decrease in interannual
variability (not shown); only in the areas with relatively small snow reduction, for example in the
Pannonian lowland, variability will be slightly increased.
From the RegCM model results, the number of days with snow cover for the 20th century
has been calculated and compared with the data from the Croatian meteorological and
climatological stations (Fig. 2-6c). Model results underestimate observational data, because the
model is not capable to distinguish horizontal and vertical scales of climatological stations. For
example, the isoline indicating 15 days with snow borders with Gorski Kotar in the north, while
data from Sisak and Slavonski Brod indicate 21 and 20 days with snow. In the south, the same
isoline is moved too far inland due to an inadequate resolution of a quite sharp gradient in
number of days with snow between the littoral and mountainous Croatia, e.g. the Zavižan station
in the northern Velebit sticks out with 39 snowy days. However, more relevant is the relative
change of number of days with snow in future climate relative to the 20th century climate (Fig. 2-
6d). The number of days with snow in future climate is significantly reduced, in many parts, and
even halved relative to the 20th century. Regardless to the errors in the representation of present
climate, such a decrease is a significant indicator of what to be expected by the middle of this
century.
2.3.4 Some significant or extreme occurrences
As for days with snow (Fig. 2-6 c,d), similar statistics is considered for some
climatological parameters describing significant or extreme values of surface atmosphere
(temperature and precipitation). For climatological stations many extreme events are processed
and shown in Zaninović et al. (2008). Fig. 2-7a shows a comparison of stations data and
regional model for hot summer days, i.e. when maximum temperature is higher or equal to 30
°C. Although model generally underestimates a number of hot days, still the model results are
acceptable for many areas. The number of hot days in model is increased from mountainous
areas of the western Balkan, northwards to the Pannonian lowland and towards the Adriatic
coast. The largest discrepancy is found at the Knin station, where the number of observed hot
days (37) is the largest in Croatia and significantly exceeds the model value (4). Model
orography, which is much higher at the location of the Knin station than in reality, effects a
general decrease of temperature, as well as frequency of hot days. Also, vegetation cover has
an impact on temperature. Namely, in the model in each grid box only one vegetation type is
27
represented (usually the prevailing one), while in reality in the area of 35 X 35 km various types
of vegetation could be found. Generally, deficiencies and approximations in model contribute to
differences between measured (observed) values and simulated climate.
Difference between future climate and the 20th century climate indicates to an increase of
hot days; in many areas the number of hot days will be doubled by the middle of this century.
For example, the increase will be from 6 days in mountainous areas up to almost severe 20 days
at the Adriatic (Fig. 2-7b). Such an increase of the number of hot days could greatly influence
social-economical circumstances in south Europe and the Mediterranean.
Average number of winter days with precipitation larger than 10 mm is shown in Fig. 2-
7c. For a major part of Croatia, particularly in the north, model relatively successfully simulates
this type of statistics, even some details such as precipitation decrease in Zadar and Split
relative to adjacent areas. In mountainous Croatia (Parg, Ogulin) precipitation is underestimated
in the model, while in inland Dalmatia (Knin) and southern Croatia (Dubrovnik) it is
overestimated. This is probably the result of the southern Croatia orography being higher in
model than in reality. It can be concluded that in extremely orographically complex areas of the
littoral Croatia it is very hard to reproduce detailed spatial variation of observed number of days
by a model.
In future climate, in a major part of the coastal Croatia and its hinterland average number
of days with precipitation larger than 10 mm will be increased from 0.5 up to 1 day (Fig. 2-7d).
Such a change is consistent with results in Fig. 2-4a, indicating an increase of total precipitation
in winter in the coastal Croatia. According to Fig. 2-7d only on the southern Dalmatian islands
the number of days with precipitation larger than 10 mm will remain unchanged or slightly
decreased relative to the 20th century climate.
In summer model generally underestimates a number of days with precipitation larger
than 10 mm (not shown), probably due to showery nature of summer precipitation, which is
relatively difficult to reproduce. However, consistent with Fig. 2-4c, in future climate the number
of days with such significant precipitation in coastal area and hinterland is decreased (for more
than 1.2 days), while in continental Croatia it will be slightly increased.
2.4. Conclusions
The results of the RegCM regional climate model integrations have been analysed for all
seasons from the two 30-year periods: 1961-1990, representing the present climate, and 2041-
2070, representing the projection of future climate according to the IPCC A2 scenario. By
comparing climatological mean values from both periods, it is possible to conclude on possible
climate change in the integration domain. Changes of climatological means have been tested by

28
objective statistical method. Interannual variations of some meteorological parameters within
selected periods have been compared from which it can be concluded on the change of
variability in future climate in relation to the present one.
In all seasons, RegCM predicts temperature increase within the entire integration
domain, as well as throughout the depth of the model atmosphere. In the cold part of the year,
the warming will be slightly increased in the northern (continental) Croatia, while in warm periods
the warming will be increased in the littoral Croatia. Warming in RegCM integrations is in
agreement with warming in EH5OM global model, whose data were used to force RegCM via
initial and boundary conditions; however, the amplitude of the warming is generally a little lower
in RegCM, than in EH5OM model.
The decrease of total precipitation in future climate is expected in a large part of the year,
primarily in the littoral Croatia and its hinterland. Such a decrease is, in relative terms, highest in
summer because of pronounced climatological minimum in the annual cycle for total
precipitation in this part of Croatia. In winter there will be a slight increase of precipitation, again
in a narrow littoral zone, but such an increase is not statistically significant. In the northern
Croatia no significant precipitation change in future climate is expected.
Analysis of the modelled number of days for some significant and extreme events
(number of days with snow, hot days and days with precipitation larger than 10 mm) for the 20th
century climate broadly matches observational data, although not in all details. The largest
differences between the model and the observations could be attributed to inadequate
orography representation regardless of the fact that regional model has relatively fine horizontal
resolution. Future changes indicate a decrease in the average number of days with snow, an
increase in the number of hot days, as well as slight increase in the number of days with
significant precipitation in winter. This statistics agrees well with climate change of the mean
values for near-surface temperature and total precipitation.
References: Branković Č., Srnec L., Patarčić M. (2009): An assessment of global and regional climate change based
on the EH5OM climate model ensemble. Climatic Change (u tisku, DOI 10.1007/s10584-009-9731-y).
Dickinson, R.E., Errico R.M., Giorgi F. i Bates G.T. (1989): A regional climate model for the western United States. Climatic Change, 15, 383-422.
Fritsch, J.M. i Chappel C.F. (1980): Numerical prediction of convectively driven mesoscale pressure systems. Part I: Convective parameterization. Journal of the Atmospheric Sciences, 37, 1722-1733.
Giorgi, F. (1990): Simulation of regional climate using a limited area model nested in a general circulation model. Journal of Climate, 3, 941-963.

29
Giorgi F., Coppola E. (2007): European climate-change oscillation. Geophysical Research Letters, 34: L21703, doi: 10.1029/2007GL031223.
Grell, G.A. (1993): Prognostic evaluation of assumptions used by cumulus parameterizations. Monthly Weather Review, 121, 764-787.
Hawkins, E., Sutton R. (2009): The potential to narrow uncertainty in regional climate predictions. Bulletin of the American Meteorological Society, 90, 1095-1107.
Nakićenović N. i 27 suradnika (2000): Special report on emission scenarios. A special report of Working Group III of the IPCC. Cambridge University Press, Cambridge, pp 599.
Pal, J. i 19 suradnika (2007): Regional climate modeling for the developing world. The ICTP RegCM3 and RegCNET. Bulletin of the American Meteorological Society, 88, 1395-1409.
Pinto J.G., Ulbrich U., Leckebusch G.C., Spangehl T., Reyers M., Zacharias S. (2007): Changes in storm track and cyclone activity in three SRES ensemble experiments with the ECHAM5/MPI-OM1 GCM. Climate Dynamics 29: 195-210
Roeckner E. i 13 suradnika (2003): The atmospheric general circulation model ECHAM5. Part I: Model description. Max-Planck Institute for Meteorology Rep. 349, Hamburg, 127 pp.
Räisänen J. (2002): CO2-induced changes in interannual temperature and precipitation variability in 19 CMIP2 experiments. Journal of Climate, 15: 2395-2411
Srnec L., Zaninović K. (2008): The summer bioclimatic conditions at the Adriatic coast in 21st century. 18th International Congress on Biometeorology. 22-26 September, 2008. Tokyo, Japan.
Zaninović, K., Gajić-Čapka, M., Perčec Tadić, M. et al, 2008: Klimatski atlas Hrvatske / Climate atlas of Croatia 1961-1990., 1971-2000. Državni hidrometeorološki zavod, Zagreb, 200 str.
30
Figure 2-1. Altitudinal temperature, future climate minus the climate of the 20th century: a) winter
200 hPa, b) summer 200 hPa, c) winter 850 hPa, d) summer 850 hPa. Isolines 0,5 degree.

31
Figure 2-2. Temperature at 2 m, future climate minus the climate of the 20th century: a) winter,
b) spring, c) summer, d) autumn. Isolines every 0.3 degrees in a), b) and d), and every 0.5
degrees in c).

32
Figure 2-3. Wind at 10 m, future climate minus the climate of the 20th century: a) winter, b)
summer. Isolines every 0.2 m/s.
33
Figure 2-4. Total precipitation, future climate minus climate of the 20th century: a) winter, b)
spring, c) summer, d) autumn. Isolines 0.1, 0.2, 0.3, 0.5, 1, 2 mm/day; bold lines positive values,
dashed lines negative values.

34
Figure 2-5. t-test significancy of the differences in total precipitation, future climate minus the
climate of 20th century with a 95% level of confidence: a) winter, b) spring, c) summer, d)
autumn.

35
Figure 2-6. Snow in winter, future climate minus the climate of the20th century: a) difference in
mean values, b) t-test significancy of the difference of mean values with a 95% level of
confidence. Mean number of days with snow in winter c) model and climate stations for the
period 1961-1990, d) change of the number of days future climate minus the climate of the 20th
century. Isolines in a) 1, 2, 5, 10, 30, 50 mm of equivalent water. Isolines in c) 5, 10, 15, 20, 25,
30, 40, 50 days, in d) 1 day.

36
Figure 2-7. Median number of hot days a) model and climate stations for the period 1961-1990,
b) change of the number of days minus the climate of the 20th century. Mean number of days
with precipitation larger than 10 mm c) model and climate stations.
37
3. Impact of climate variations and change on plants and on wildfire danger 3.1. Impact of climate variations and change on plants
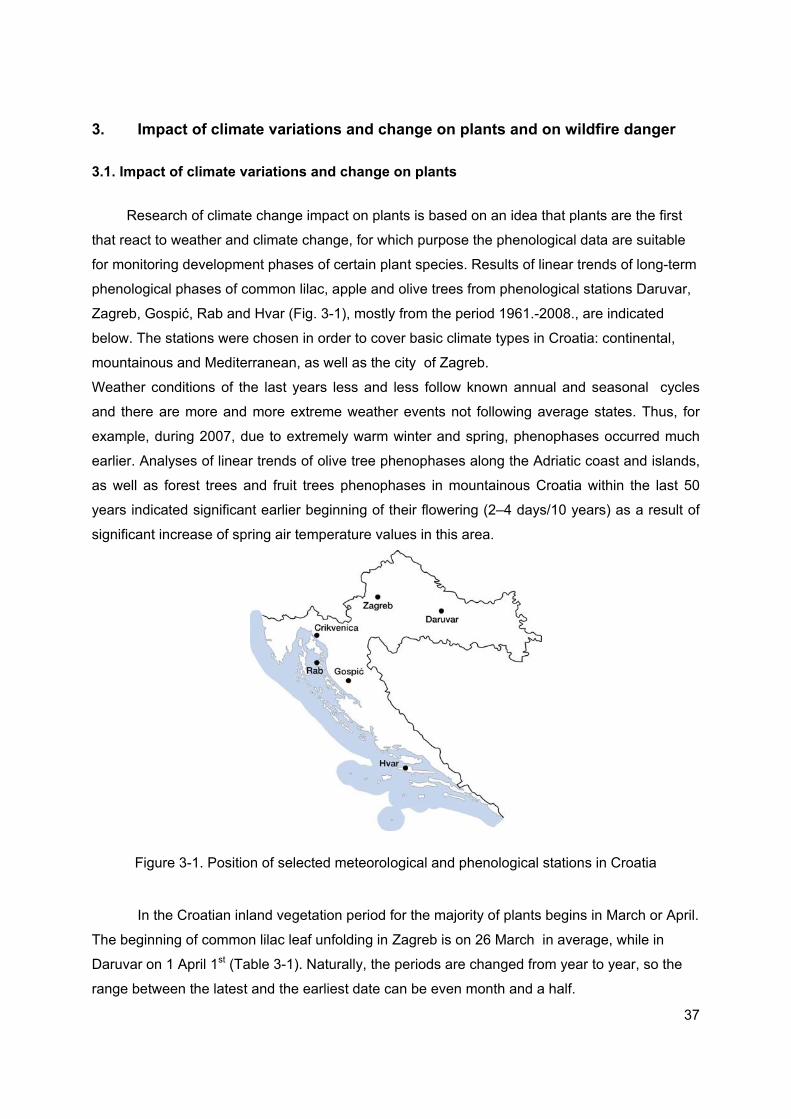
Research of climate change impact on plants is based on an idea that plants are the first
that react to weather and climate change, for which purpose the phenological data are suitable
for monitoring development phases of certain plant species. Results of linear trends of long-term
phenological phases of common lilac, apple and olive trees from phenological stations Daruvar,
Zagreb, Gospić, Rab and Hvar (Fig. 3-1), mostly from the period 1961.-2008., are indicated
below. The stations were chosen in order to cover basic climate types in Croatia: continental,
mountainous and Mediterranean, as well as the city of Zagreb.
Weather conditions of the last years less and less follow known annual and seasonal cycles
and there are more and more extreme weather events not following average states. Thus, for
example, during 2007, due to extremely warm winter and spring, phenophases occurred much
earlier. Analyses of linear trends of olive tree phenophases along the Adriatic coast and islands,
as well as forest trees and fruit trees phenophases in mountainous Croatia within the last 50
years indicated significant earlier beginning of their flowering (2–4 days/10 years) as a result of
significant increase of spring air temperature values in this area.
Figure 3-1. Position of selected meteorological and phenological stations in Croatia
In the Croatian inland vegetation period for the majority of plants begins in March or April.
The beginning of common lilac leaf unfolding in Zagreb is on 26 March in average, while in
Daruvar on 1 April 1st (Table 3-1). Naturally, the periods are changed from year to year, so the
range between the latest and the earliest date can be even month and a half.

38
The flowering usually starts three weeks after the leaf unfolding, while its fully flowering
the common lilac achieves a week after the flowering start. High values of standard deviation (8-
12 days) also indicate to a great annual variability of common lilac leaf unfolding and flowering
from year to year.
In mountainous Croatia the beginning of vegetation is moved to April and May, so in
Gospić the common lilac is usually leaf unfolding on 15 April and flowering on 6 May. It is
exactly a month later than in Hvar. Naturally, a limit of vegetation beginning is earlier as it moves
to the south of Croatia. Comparison between northern and middle Adriatic shows 4-5 days
earlier start of common lilac leaf unfolding and flowering in Hvar than in Rab.
In average, apple tree is leaf unfolding and flowering two weeks earlier in Daruvar (9 and
17 April ) than in Gospić (25 April 25th and 2 May). Apple maturation also starts two weeks
earlier in Daruvar (6 September) than in Gospić (22 September). Such vegetation period of
apple tree in the Croatian inland lasts for seven months, while in mountainous Croatia for six
months due to an earlier beginning of colouring and leaves falling.
Appearance of the first flowers, full flowering and end of olive tree flowering is a week
earlier in Hvar than in Rab. However, first ripe fruits are usually by the middle of October, while
the picking is in the first 10-day period in November at both locations.
In order to estimate a tendency of delay/earliness of phenophases in Croatia, linear
trends of their appearance have been calculated for observed long-time period (Table 3-1. and
Fig. 3-2). Linear trends values in Table 6.4.2 are reduced to 10-year period. One of the methods
providing the evaluation of statistical significance of limit change, around which the members of
time series are distributed, i.e. evaluation of linear trend existence is non-parametric Mann-
Kendall rank test.
Statistically significant trend at the level of 0.05 is noticed in earlier flowering of observed
plants (2-4 days/10 years) in all climate zones, except in city of Zagreb. Air temperature rise in
Zagreb cannot be just a result of global warming, but in rapid expansion of Zagreb in the last
hundred years.
Earlier apple tree flowering (3-4 days/10 years) is more expressed in the mountainous
Croatia than in the inland (2 days/10 years). Significant trend of apple tree ripe fruits and picking
is noticed only in the inland of Croatia, as well as a tendency of vegetation extension (leaves
falling is later 2 days/10 years). On the contrary, in the mountainous Croatia a negative trend of
apple tree colouring and leaves falling (3 days/10 years) has been observed, which indicates to
shortening the vegetation period in autumn.

39
Table 3-1. Mean (MEAN), maximum (MAX) and minimum (MIN) phenophase dates for common
lilac, apple and olive trees along with related standard deviation (STD) and amplitude (AMPL =
MAX - MIN) at selected stations in Croatia mostly within the period 1961–2008.
PHENO-PHASES UL BF FF EF RF RP CL FL MEAN 4/1 4/21 4/28 STD 12 10 9 MAKS 4/23 5/7 5/13 MIN 3/8 3/30 4/9 AMPL D
AR
UVA
R
46 38 34 MEAN 3/26 4/20 4/26 STD 12 8 8 MAX 4/15 5/2 5/10 MIN 3/8 4/1 4/9 AMPL
ZAG
REB
38 31 31
LEGEND: UL – Beginning of leaf unfolding BF – Beginning of flowering FF – Full (general) flowering EF – End of flowering RF – First ripe fruits RP – Fruit ripe for picking CL – Colouring of leaves FL – Leaf fall
MEAN 4/15 5/6 5/12 STD 11 9 9 MAX 5/2 5/20 5/26 MIN 3/24 4/10 4/17 AMPL
GO
SPIĆ
39 40 39 MEAN 3/22 4/11 4/18 STD 8 9 8 MAX 4/3 4/28 5/6 MIN 2/27 3/22 3/30 AMPL
RA
B
36 37 37 MEAN 3/17 4/6 4/14 STD 9 8 9 MAX 3/31 4/22 5/1 MIN 2/21 3/19 3/24
CO
MM
ON
LIL
AC
AMPL
HVA
R
39 34 38 MEAN 4/9 4/17 4/23 5/2 9/6 9/22 10/22 11/8 STD 9 9 8 7 7 6 11 11 MAX 4/25 5/3 5/9 5/16 9/18 10/9 11/11 11/25 MIN 3/19 3/23 3/31 4/19 8/24 9/9 9/29 10/7 AMPL D
AR
UVA
R
(196
9-20
08)
37 41 39 27 25 30 43 49 SRED 4/25 5/2 5/8 5/14 9/22 10/5 10/19 10/29 STD 9 8 8 9 6 7 9 9 MAX 5/8 5/19 5/23 5/29 10/7 10/18 11/4 11/11 MIN 4/3 4/17 4/20 4/27 9/7 9/24 10/1 10/6
APP
LE T
REE
AMPL
GO
SPIĆ
(1
968-
2008
)
35 32 33 32 30 24 34 36 MEAN 5/27 6/3 6/14 10/14 11/7 STD 8 8 7 10 10 MAX 6/14 6/18 6/30 11/3 11/25 MIN 5/6 5/13 5/31 9/9 9/30 AMPL
RA
B
39 36 30 55 56 MEAN 5/21 5/28 6/6 10/16 11/9 STD 10 10 11 11 8 MAX 6/5 6/15 6/26 11/5 11/25 MIN 4/4 4/8 4/14 9/9 10/20
OLI
VE T
REE
AMPL
HVA
R
62 68 73 57 36

40
Olive tree flowering is earlier 2 days/10 years in northern Adriatic, while in Dalmatia 3
days/10 years. Earlier olive ripe 2 days/10 years is observed in Dalmatia, while earlier picking is
not just a result of weather conditions, but it depends on available olive oil processing plants,
amount of yield that can be processed at defined moment, as well as on market demand for
certain oil quality.
Analysis of climate change impacts on plants indicated in all climate zones an earlier
beginning of flowering t of observed plants in spring, which is a result of warmer winter and
spring. In autumn there is no such unambiguous delay in colouring and leaves falling in all
climate zones, i.e. vegetation period extension is observed in the inland, but not in the
mountainous Croatia. These results are in accordance with observed more expressed mean air
temperature rise in spring than in autumn.
Table 3-2. Linear trends of phenophases (day/10 years) for common lilac, apple and olive trees
at selected stations in Croatia mostly in the period 1961-2008. Significant linear trends at the
level ≤ 0.05 are in bold.
TREND
(day/10 ys ) PHENO-PHASES UL BF FF EF RF RP CL FL
DARUVAR 0.7 -2.1 -2.8 ZAGREB -3.4 0.2 0.3 GOSPIĆ -3.5 -2.2 -2.4 RAB -0.6 -2.7 -2.3
COMMON LILAC
HVAR -1.6 -1.9 -2.3 DARUVAR (1969-2008)
-0.8 -2.2 -2.2 -1.7 -1.8 -2.1 -0.2 1.7
APPLE TREE GOSPIĆ (1968-2008)
-2.4 -3.0 -3.8 -4.5 -0.6 -0.7 -2.7 -2.9
RAB -1.8 -2.2 0.0 0.0 -1.7 OLIVE TREE
HVAR -2.9 -2.9 -2.9 -2.6 -2.0

41
y = -0.2184x + 117.4320-Mar
30-Mar
9-Apr
19-Apr
29-Apr
9-May
19-May
1961 1966 1971 1976 1981 1986 1991 1996 2001 2006year
DARUVAR (1961-2008)COMMON LILAC - beginning of flowering
y = 0.016x + 110.9220-Mar
30-Mar
9-Apr
19-Apr
29-Apr
9-May
19-May
1961 1966 1971 1976 1981 1986 1991 1996 2001 2006year
ZAGREB (1961-2008)COMMON LILAC - beginnig of flowering
y = 0.1748x + 310.3
6-Oct
16-Oct
26-Oct
5-Nov
15-Nov
25-Nov
5-Dec
1969 1974 1979 1984 1989 1994 1999 2004year
DARUVAR (1969-2008)APPLE - leaf fall
y = -0.2988x + 309.3226-Sep
6-Oct
16-Oct
26-Oct
5-Nov
15-Nov
25-Nov
1968 1973 1978 1983 1988 1993 1998 2003 2008year
GOSPIĆ (1968-2008)APPLE - leaf fall
y = -0.2603x + 155.21
29-Apr
9-May
19-May
29-May
8-Jun
18-Jun
28-Jun
1961 1966 1971 1976 1981 1986 1991 1996 2001 2006year
RAB (1961-2008)OLIVE - beginning of flowering
y = -0.2624x + 296.67
6-Sep
16-Sep
26-Sep
6-Oct
16-Oct
26-Oct
5-Nov
15-Nov
1962 1967 1972 1977 1982 1987 1992 1997 2002 2007year
HVAR (1962-2008)OLIVE - first ripe fruits
Figure 3-2. Time series of phenological phases of common lilac, apple and olive trees, 5-year
flexible mean values and linear trends for Daruvar, Zagreb, Gospić, Rab and Hvar mostly within
the period 1961–2008. x is a number of years (1,2…n).
References: Mitchell J. M. Jr., Dzerdzeevskii B., Flohn H., Hofmeyr W. L., Lamb H.H., Rao K.H., C.C. Wallen: 1966:
Climatic Change, WMO Tech. Note 79, 58–75. Vučetić, M., V. Vučetić, 1996: The phenological analysis of almond culture along the Adriatic coast,
Biometeorology, 14, 247–254. Vučetić, M., Ž. Lončar, 2006: Growing degree days between the phenological phases of forest trees and
shrubs in the NW part of Croatia, Zbornik sažetaka s 6th European Conference on Applied Climatology, Ljubljana, 4–8. rujna 2006, 1 str. (CD-ROM).
Vučetić, V., M. Vučetić, 2003: Fenološke značajke na području Zavižana, Šumarski list, 7-8, 359–372.

42
Vučetić, V., M. Vučetić, 2005: Variations of phenological stages of olive-trees along the Adriatic coast, Periodicum Biologorum, 107, 335–340.
Vučetić, V., M. Vučetić, 2006: Phenological fluctuations as a possible signal of climatic changes in the Croatian mountain area, Meteorologische Zeitschift, 15, 2, 237–242.
Vučetić, V., M. Vučetić, M., Ž. Lončar, 2008: History and present observations in Croatian plant phenology, poglavlje u knjizi, The history and current status of plant phenology in Europe (COST 725, Nekovar, J. (ur.)), 44–50.

43
3.2. Climate change impact on wildfire danger
Croatian Adriatic coast, particularly islands, is a typical example of area where the
common interconnection between water (precipitation) and fire is fully expressed. Generally it
can be said that in summer a number of fires and burned areas grow from the north to the south,
as well as from the inland to the coat and islands, while in winter and early spring is vice versa.
Even the precipitation amount is decreased from north to south and from inland to islands. Due
to its specificity, the most endangered areas considering forest fires are islands, among them
particularly middle Dalmatian islands. Results of global and regional models indicate that the
largest changes could be expected in coastal southern part of Adriatic.
In Croatia there are 450 fires in average per year and burned area of 9000 ha. In the last
10 years the largest number of forest fires, total of 730, was recorded in 2000, when 27400 ha
burned out. In extremely hot and dry years, such as 1998, 2003 and 2007, above average
number of forest fires was recorded in the Adriatic area.
For already 30 years The Meteorological and Hydrological Service has been applying the
Canadian method Fire Weather Index (FWI) to assess a danger of forest fires at the Adriatic. By
means of FWI daily severity rating (DSR) is determined, i.e. assessment of potential danger
according to relation:
DSR = 0.0272 FWI 1.77
Mean Monthly Severity Rating (MSR) or mean Seasonal Severity Rating (SSR) are
calculated from DSR. Generally, SSR values above 7 indicate extreme potential danger, values
between 3 and 7 are large to very large, values between 1 and 3 are moderate, while values
less than 1 are equal to small potential danger.
As severity assessment contains meteorological conditions, as well as moisture dead fuel
, MSR and SSR serve for climate-fire review of average state in certain area per months and fire
season. DSR daily values could be indicator of change of state from hour to hour for fast acting
and distribution of fire brigades in endangered area.
For the analysis of MSR secular variations, long-term time series of meteorological
stations Crikvenica (1891–2005) and Hvar (1867–2005) as representatives for climate
conditions of northern and middle Adriatic (Fig. 3-1). Due to a higher mean monthly air
temperature and lower precipitation amount in Hvar than in Crikvenica, MSR is 2-3 times larger
than in middle Adriatic in relation to the northern (Table 7-3).
In order to determine possible danger increase of forest fires at Adriatic, linear trends for
MSR and non-parametric Mann-Kendall rank test have been analyzed for Crikvenica and Hvar

44
within the season from May to September (Table 3-4 and Fig. 3-3). Significant increase of
potential danger is notified in Crikvenica in all months of fire season, while in Hvar in June and
July. Progressive test indicates a beginning of MSR increase in early 1980’s, while trends
became significant by the beginning of the 21st century.
Comparison of mean MSR secular values with an average from the period 1961.–1990.
indicates similar values in Crikvenica and less in Hvar for long-time period in relation to a
normal.
Table 3-3. Mean (MEAN), maximum (MAX) and minimum (MIN) monthly severity rating MSR
along with related standard deviation (STD) and amplitude (AMPL = MAX - MIN) for Crikvenica
(1891–2005) and Hvar (1867–2005), as well as a comparison with a normal 1961–1990.
MONTHS May June July August September CRIKVENICA (1891-2005)
MEAN 0.9 1.3 3.2 3.8 1.7 STD 0.8 1.1 2.3 3.6 2.1 MAX 3.3 4.4 7.8 16.9 10.5 MIN 0.0 0.0 0.6 0.3 0.1 AMPL 3.3 4.4 7.2 16.6 10.5
CRIKVENICA (1961-1990) MEAN 0.8 1.3 2.6 3.2 1.8 STD 1.3 1.3 2.2 3.2 2.0 MAX 5.6 6.4 10.9 23.7 19.8 MIN 0.0 0.0 0.1 0.0 0.0 AMPL 5.6 6.4 10.8 23.7 19.8
HVAR (1867-2005) MEAN 2.5 4.1 6.9 7.1 4.4 STD 1.9 2.8 3.3 3.2 3.4 MAX 10.1 12.5 22.2 17.8 18.0 MIN 0.1 0.5 1.2 1.8 0.0 AMPL 10.1 12.0 21.0 16.0 18.0
HVAR (1961-1990) MEAN 3.0 4.5 8.0 8.2 4.9 STD 1.7 2.4 2.9 3.6 3.6 MAX 7.0 10.6 13.2 16.8 14.7 MIN 0.5 0.7 2.5 2.8 0.6 AMPL 6.4 9.9 10.6 14.0 14.1

45
CRIKVENICA (1891-2005)June y = 0.0174x + 0.29
0
3
6
9
12
15
1891 1901 1911 1921 1931 1941 1951 1961 1971 1981 1991 2001year
MSR
HVAR (1867-2005)June y = 0.0075x + 3.55
0
3
6
9
12
15
1867 1882 1897 1912 1927 1942 1957 1972 1987 2002year
MS
R
CRIKVENICA (1891-2005)July
y = 0.0297x + 0.88
0
5
10
15
20
25
30
1891 1901 1911 1921 1931 1941 1951 1961 1971 1981 1991 2001year
MSR
HVAR (1867-2005)July y = 0.0107x + 6.20
0
5
10
15
20
25
30
1867 1882 1897 1912 1927 1942 1957 1972 1987 2002year
MSR
CRIKVENICA (1891-2005)August y = 0.0293x + 1.56
0
3
6
9
12
15
1891 1901 1911 1921 1931 1941 1951 1961 1971 1981 1991 2001year
MS
R
HVAR (1867-2005)August
y = 0.0131x + 6.20
0
3
6
9
12
15
1867 1882 1897 1912 1927 1942 1957 1972 1987 2002year
MS
R
Figure 3-3. Time series of monthly severity rate MSR, 5-year moving average and linear trends
for meteorological stations Crikvenica (1891–2006) and Hvar (1867–2005). x is a number of
years (1,2…n).
46
Increased forest fire risk, notified in June, is particularly important as it indicates to earlier
beginning of fire season at Adriatic. However, the analysis also shows the expansion of the area
with increased forest fire risk from the middle to northern Adriatic, especially in July and August.
Reason of increased forest fire risk at northern Adriatic is due to a significant increase of mean
air temperature and significant decrease of precipitation in summer.
References: Sneyers, R., 1990: On the Statistical analysis of series of observations, WMO Tech. Note, 143, 1–15. Van Wagner C.E., 1974.: Structure of the Canadian forest fire weather index, Department of the
Environment, Canadian Forestry Service, Publ. No. 1333, Ottava, 44 pp. Van Wagner C.E., T.L. Pickett, 1985: Equations and Fortran Program for the Canadian Forest Fire
Weather Index System, Canadian Forestry Service, Government of Canada, Forestry Technical Report, 33 pp.
Vučetić, M., 1987: Meteorološka analiza katastrofalnog šumskog požara na Korčuli 1985, Rasprave-Papers, 22, 67–72.
Vučetić, M., 1992: Vremenske prilike tijekom šumskog požara na otoku Hvaru 13–31.7.1990, Hrvatski meteorološki časopis, 27, 69–76.
Vučetić, M., 1998: The influence of weather condition on forest fire on the island of Hvar, 28 July–4 August 1997, Zbornik radova III International Conference on Forest Fire Research, Vol. I, Luso, Portugal, 16–20 studeni 1998,1295–1303.
Vučetić, M., V. Vučetić,1999: Different types of the forest fires on the Croatian coast, Zbornik radova sa Symposium Forest Fires: Needs and Innovations, DELFI99, Athens, Greece, 17–20 studeni 1999, 365–369.
Vučetić, M., 2001: Vremenske prilike i šumski požari na hrvatskom priobalju tijekom 2000., Šumarski list, 7–8, 367–378.
Vučetić, M., 2002: Vremenske prilike i usporedba sezone zaštite šuma od požara 2001. u odnosu na višegodišnji prosjek, Šumarski list, 11–12, 563–574.
Vučetić, M., V. Vučetić, 2002: Vrijeme na Jadranu – Meteorologija za nautičare, Fabra d.o.o., Zagreb, 129 pp.
Vučetić, M., Vučetić, V., Španjol, Ž., Barčić, D., Rosavec, R., A. Mandić, 2006: Secular variations of monthly severity rating on the Croatian Adriatic coast during the forest fire season, Forest Ecology and Management, 234 suplement 1, 251–261.