Metalloporphyrin-modified semiconductors for solar fuel … · S1 Supporting Information !!...
23
S1 Supporting Information Supporting Information for Metalloporphyrin-modified semiconductors for solar fuel production Diana Khusnutdinova, Anna M. Beiler, Brian L. Wadsworth, Samuel I. Jacob and Gary F. Moore* School of Molecular Sciences and the Biodesign Institute Center for Applied Structural Discovery (CASD), Arizona State University, Tempe, AZ 85287-1604, United States [email protected] Index 1. Molecular synthesis and characterization S2-S12 1.1 NMR spectra S5-S7 1.2 UV-Vis spectra S7-S8 1.3 FTIR data S9-S10 1.4 Electrochemical data S11-S12 2. Surface characterization S13-S18 2.1 FTIR data S14-S15 2.2 XPS data S16-S18 3. Photoelectrochemical data S19-S22 3.1 Spectral profile of a LSC-100 Series Oriel Solar Simulator S22 4. Supplemental information references S23 Electronic Supplementary Material (ESI) for Chemical Science. This journal is © The Royal Society of Chemistry 2016
Transcript of Metalloporphyrin-modified semiconductors for solar fuel … · S1 Supporting Information !!...

S1
Supporting Information
Supporting Information for
Metalloporphyrin-modified semiconductors for solar fuel production
Diana Khusnutdinova, Anna M. Beiler, Brian L. Wadsworth, Samuel I. Jacob and Gary F. Moore*
School of Molecular Sciences and the Biodesign Institute Center for Applied Structural Discovery (CASD), Arizona State University, Tempe, AZ 85287-1604, United States
Index
1. Molecular synthesis and characterization S2-S12
1.1 NMR spectra S5-S7
1.2 UV-Vis spectra S7-S8
1.3 FTIR data S9-S10
1.4 Electrochemical data S11-S12
2. Surface characterization S13-S18
2.1 FTIR data S14-S15
2.2 XPS data S16-S18
3. Photoelectrochemical data S19-S22
3.1 Spectral profile of a LSC-100 Series Oriel Solar Simulator S22
4. Supplemental information references S23
Electronic Supplementary Material (ESI) for Chemical Science.This journal is © The Royal Society of Chemistry 2016
S2
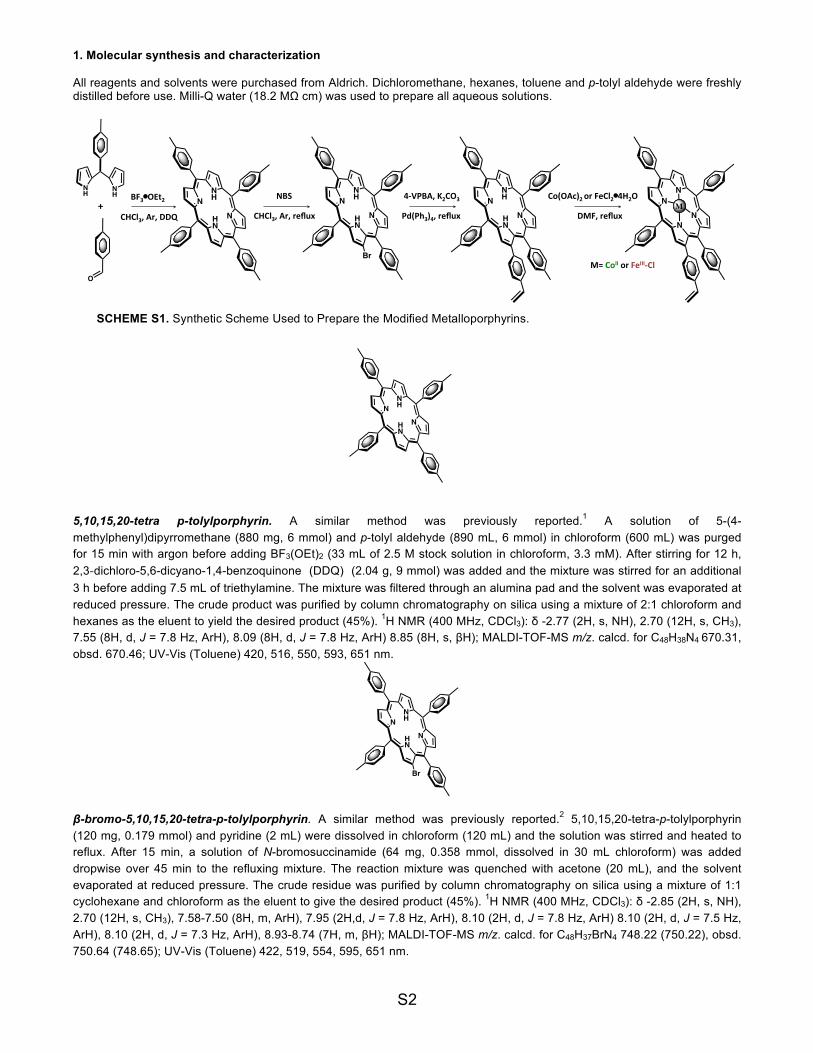
1. Molecular synthesis and characterization
All reagents and solvents were purchased from Aldrich. Dichloromethane, hexanes, toluene and p-tolyl aldehyde were freshly distilled before use. Milli-Q water (18.2 MΩ cm) was used to prepare all aqueous solutions.
5,10,15,20-tetra p-tolylporphyrin. A similar method was previously reported.1 A solution of 5-(4-methylphenyl)dipyrromethane (880 mg, 6 mmol) and p-tolyl aldehyde (890 mL, 6 mmol) in chloroform (600 mL) was purged for 15 min with argon before adding BF3(OEt)2 (33 mL of 2.5 M stock solution in chloroform, 3.3 mM). After stirring for 12 h, 2,3-‐dichloro-5,6-dicyano-1,4-benzoquinone (DDQ) (2.04 g, 9 mmol) was added and the mixture was stirred for an additional 3 h before adding 7.5 mL of triethylamine. The mixture was filtered through an alumina pad and the solvent was evaporated at reduced pressure. The crude product was purified by column chromatography on silica using a mixture of 2:1 chloroform and hexanes as the eluent to yield the desired product (45%). 1H NMR (400 MHz, CDCl3): δ -2.77 (2H, s, NH), 2.70 (12H, s, CH3), 7.55 (8H, d, J = 7.8 Hz, ArH), 8.09 (8H, d, J = 7.8 Hz, ArH) 8.85 (8H, s, βH); MALDI-TOF-MS m/z. calcd. for C48H38N4 670.31, obsd. 670.46; UV-Vis (Toluene) 420, 516, 550, 593, 651 nm.
β-bromo-5,10,15,20-tetra-p-tolylporphyrin. A similar method was previously reported.2 5,10,15,20-tetra-p-tolylporphyrin (120 mg, 0.179 mmol) and pyridine (2 mL) were dissolved in chloroform (120 mL) and the solution was stirred and heated to reflux. After 15 min, a solution of N-bromosuccinamide (64 mg, 0.358 mmol, dissolved in 30 mL chloroform) was added dropwise over 45 min to the refluxing mixture. The reaction mixture was quenched with acetone (20 mL), and the solvent evaporated at reduced pressure. The crude residue was purified by column chromatography on silica using a mixture of 1:1 cyclohexane and chloroform as the eluent to give the desired product (45%). 1H NMR (400 MHz, CDCl3): δ -2.85 (2H, s, NH), 2.70 (12H, s, CH3), 7.58-7.50 (8H, m, ArH), 7.95 (2H,d, J = 7.8 Hz, ArH), 8.10 (2H, d, J = 7.8 Hz, ArH) 8.10 (2H, d, J = 7.5 Hz, ArH), 8.10 (2H, d, J = 7.3 Hz, ArH), 8.93-8.74 (7H, m, βH); MALDI-TOF-MS m/z. calcd. for C48H37BrN4 748.22 (750.22), obsd. 750.64 (748.65); UV-Vis (Toluene) 422, 519, 554, 595, 651 nm.
NNH
NHN
NNH
NHN
Br
SCHEME S1. Synthetic Scheme Used to Prepare the Modified Metalloporphyrins.
+BF3�OEt2CHCl3,Ar,DDQ
NH N
H
O
NNH
NHN
NNH
NHN
Br
NNH
NHN
NN
NN
MMCo(OAc)2orFeCl2�4H2ODMF,reflux
NBSCHCl3,Ar,reflux
4-VPBA,K2CO3Pd(Ph3)4,reflux
M=CoIIorFeIII-Cl

S3
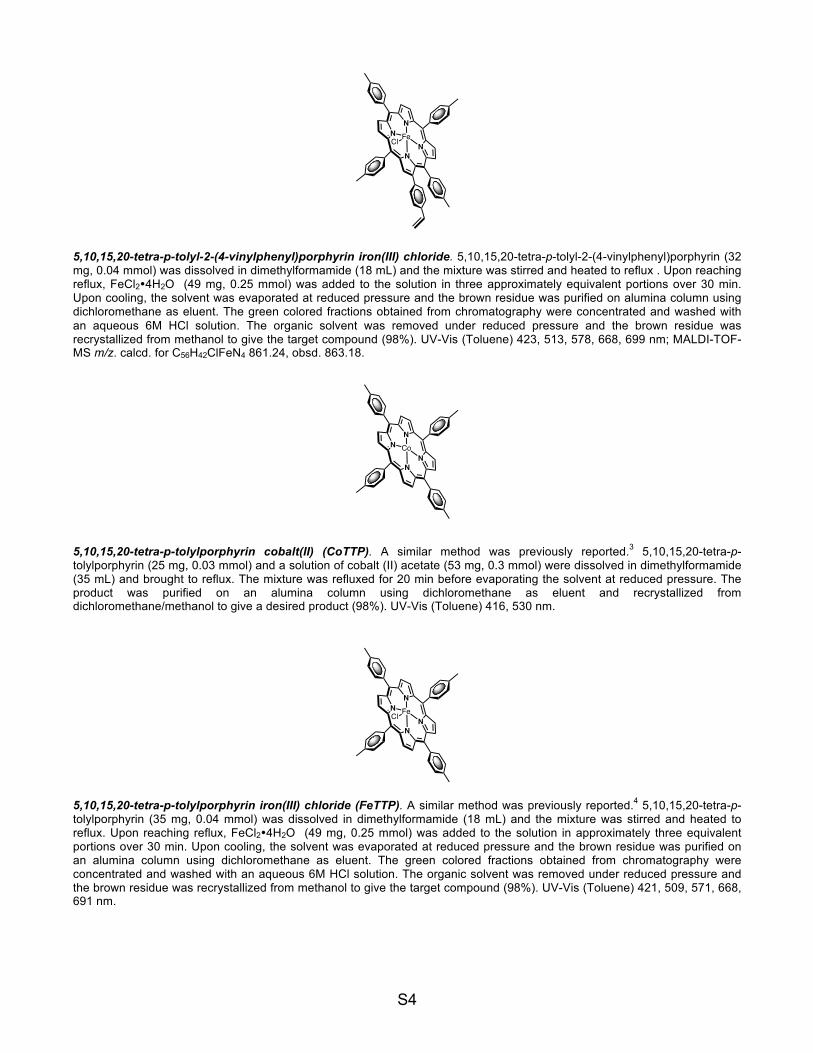
5,10,15,20-tetra-p-tolyl-2-(4-vinylphenyl)porphyrin. 4-vinylphenylboronic acid (4-VPBA) (89 mg, 0.6 mmol), potassium carbonate (138 mg, 1.2 mmol) and tetrakis(triphenylphosphine)palladium(0) (16 mg, 0.012 mmol) were added to a solution containing β-bromo-5,10,15,20-tetra-p-tolylporphyrin (90 mg, 0.12 mmol) dissolved in toluene (35 mL) and under an argon atmosphere. The reaction mixture was heated to reflux and the progress of the reaction was monitored via TLC. The reaction was stopped following consumption of the porphyrin starting material (~3-5 h) and the mixture was washed with a saturated solution of aqueous sodium bicarbonate then a saturated solution of aqueous sodium chloride. The organic phase was dried over sodium sulfate, filtered, and the solvent evaporated at reduced pressure. The residue was purified by column chromatography on silica using a mixture of 1:1 dichloromethane and hexanes as the eluent to yield the desired product (68%). 1H NMR (400 MHz, CDCl3) δ -2.63 (2H, s, NH), 2.38 (3H, s, CH3), 2.67 (3H, s, CH3), 2.70 (6H, s, CH3), 5.25 (1H, d, J = 11.1 Hz, CH), 5.78 (1H, d, J = 17.7 Hz, CH), 6.76 (1H, dd, J = 17.6 Hz, J = 10.87 Hz, CH), 7.01 (2H, d, J = 7.7 Hz, ArH), 7.18 (2H, d, J = 8.1 Hz, ArH), 7.25 (2H, d, J = 7.9 Hz, ArH), 7.51 (2H, d, J = 7.8 Hz, ArH), 7.54 (2H, d, J = 7.6 Hz, ArH), 7.56 (2H, d, J = 7.6 Hz, ArH), 7.73 (2H, d, J = 7.9 Hz, ArH), 8.09 (2H, d, J = 7.8 Hz, ArH), 8.10 (2H, d, J = 7.8 Hz, ArH), 8.10 (2H, d, J = 7.8 Hz, ArH), 8.87-8.74 (7H, m, βH); MALDI-TOF-MS m/z. calcd. for C56H44N4 772.36, obsd. 772.42. UV-Vis (Toluene) 424, 520, 554, 597, 653 nm.
5,10,15,20-tetra-p-tolyl-2-(4-vinylphenyl)porphyrin cobalt(II). A mixture containing 5,10,15,20-tetra-p-tolyl-2-(4-vinylphenyl)porphyrin (23 mg, 0.03 mmol) and cobalt (II) acetate (53 mg, 0.3 mmol) in dimethylformamide (35 mL) was stirred at reflux for 20 min. Upon cooling, the solvent was removed at reduced pressure. The residue was purified by column chromatography on alumina using dichloromethane as eluent. Recrystallization from dichloromethane/methanol gave the target compound (98%). UV-Vis (Toluene) 421, 535 nm; MALDI-TOF-MS m/z. calcd. for C56H42CoN4 829.27, obsd. 829.15.
NNH
NHN
NN
NN
Co
S4
5,10,15,20-tetra-p-tolyl-2-(4-vinylphenyl)porphyrin iron(III) chloride. 5,10,15,20-tetra-p-tolyl-2-(4-vinylphenyl)porphyrin (32 mg, 0.04 mmol) was dissolved in dimethylformamide (18 mL) and the mixture was stirred and heated to reflux . Upon reaching reflux, FeCl2�4H2O (49 mg, 0.25 mmol) was added to the solution in three approximately equivalent portions over 30 min. Upon cooling, the solvent was evaporated at reduced pressure and the brown residue was purified on alumina column using dichloromethane as eluent. The green colored fractions obtained from chromatography were concentrated and washed with an aqueous 6M HCl solution. The organic solvent was removed under reduced pressure and the brown residue was recrystallized from methanol to give the target compound (98%). UV-Vis (Toluene) 423, 513, 578, 668, 699 nm; MALDI-TOF-MS m/z. calcd. for C56H42ClFeN4 861.24, obsd. 863.18.
5,10,15,20-tetra-p-tolylporphyrin cobalt(II) (CoTTP). A similar method was previously reported.3 5,10,15,20-tetra-p-tolylporphyrin (25 mg, 0.03 mmol) and a solution of cobalt (II) acetate (53 mg, 0.3 mmol) were dissolved in dimethylformamide (35 mL) and brought to reflux. The mixture was refluxed for 20 min before evaporating the solvent at reduced pressure. The product was purified on an alumina column using dichloromethane as eluent and recrystallized from dichloromethane/methanol to give a desired product (98%). UV-Vis (Toluene) 416, 530 nm.
5,10,15,20-tetra-p-tolylporphyrin iron(III) chloride (FeTTP). A similar method was previously reported.4 5,10,15,20-tetra-p-tolylporphyrin (35 mg, 0.04 mmol) was dissolved in dimethylformamide (18 mL) and the mixture was stirred and heated to reflux. Upon reaching reflux, FeCl2�4H2O (49 mg, 0.25 mmol) was added to the solution in approximately three equivalent portions over 30 min. Upon cooling, the solvent was evaporated at reduced pressure and the brown residue was purified on an alumina column using dichloromethane as eluent. The green colored fractions obtained from chromatography were concentrated and washed with an aqueous 6M HCl solution. The organic solvent was removed under reduced pressure and the brown residue was recrystallized from methanol to give the target compound (98%). UV-Vis (Toluene) 421, 509, 571, 668, 691 nm.
NN
NN
FeCl
NN
NN
Co
NN
NN
FeCl

S5
1.1 NMR spectra
9.0 8.5 8.0 7.5 3 2
G�(ppm)-2.5 -3.0
(a)
NNH
NHN
9.0 8.5 8.0 7.5 3.6 2.4
G�(ppm)
-2.64
(b) N
NH
NHN
Br

S6
Figure S1. 1H NMR spectra of (a) 5,10,15,20-tetra-p-tolylporphyrin, (b) β-bromo-5,10,15,20-tetra-p-tolylporphyrin, and (c) 5,10,15,20-tetra-p-tolyl-2-(4-vinylphenyl)porphyrin in chloroform-d.
Figure S2. 1H NMR spectra (black) with overlaid COSY (blue) of 5,10,15,20-tetra-p-tolyl-2-(4-vinylphenyl)porphyrin in chloroform-d.
7.0 6.5 6.0 5.5 5.0
G�(ppm)Figure S2. 1H NMR spectra (black) with overlaid COSY (blue) of 5,10,15,20-tetra p-tolyl 2 (4-vinyl phenyl) porphyrin in chloroform-d showing features from 5 ppm to 7.2 ppm associated with a vinyl resonance of the linker group.
9.0 8.5 8.0 7.5 7.0 6.5 6.0 5.5 -2
G�(ppm)
Figure S1. 1H NMR spectra of (a) 5,10,15,20- tetra p-tolyl porphyrin, (b) 2-bromo 5,10,15,20-tetra p-tolyl porphyrin, and (c) 5,10,15,20-tetra p-tolyl 2 (4-vinyl phenyl) porphyrin in chloroform-d.
(c)
NNH
NHN

S7
Figure S3. (left) 1H NMR spectra showing the symmetry of the β-pyrrolic protons and (right) MALDI-TOF-MS data showing the isotopic distribution patterns of (top) 5,10,15,20-tetra-p-tolylporphyrin and (bottom) β-bromo-5,10,15,20-tetra-p-tolylporphyrin.
1.2 UV-Vis spectra
Figure S4. (a) Absorbance spectra of 5,10,15,20-tetra-p-tolyl-2-(4-vinylphenyl)porphyrin recorded in toluene showing the Soret band normalized to 1 (solid) and the highest energy Q band normalized to 0.5 (dashed). (b) Normalized absorbance spectra showing the lowest energy Q bands of the model compound 5,10,15,20-tetra-p-tolylporphyrin (dashed) and 5,10,15,20-tetra-p-tolyl-2-(4-vinylphenyl)porphyrin (solid) are included for comparison.
9.0 8.5
G�(ppm)
*
a
b c
d e
f g
9.0 8.5
G�(ppm)
a-g
*
669 672 675
Mass (m/z)
744 750 756
Mass (m/z)
(a)
650 6750.0
0.5
1.0
Abs
orba
nce
Wavelength (nm)400 500 600 700
0.0
0.5
1.0
Abs
orba
nce
Wavelength (nm)
(b)

S8
Figure S5. (a) Absorbance spectra of 5,10,15,20-tetra-p-tolyl-2-(4-vinylphenyl)porphyrin cobalt(II) recorded in toluene showing the Soret band normalized to 1 (solid) and the highest energy Q band normalized to 0.5 (dashed). (b) Normalized absorbance spectra showing the lowest energy Q bands of the model compound 5,10,15,20-tetra-p-tolylporphyrin cobalt(II) (dashed) and 5,10,15,20-tetra p-tolyl-2-(4-vinylphenyl)porphyrin cobalt(II) (solid) are included for comparison.
Figure S6. (a) Absorbance spectra of 5,10,15,20-tetra-p-tolyl-2-(4-vinylphenyl)porphyrin iron(III) chloride recorded in toluene showing the Soret band normalized to 1 (solid) and the highest energy Q band normalized to 0.5 (dashed). (b) Normalized absorbance spectra showing the lowest energy Q bands of the model compound 5,10,15,20-tetra-p-tolylporphyrin iron(III) chloride (dashed) and 5,10,15,20-tetra p-tolyl-2-(4-vinylphenyl)porphyrin iron(III) chloride (solid) are included for comparison.
400 500 6000.0
0.5
1.0
Abs
orba
nce
Wavelength (nm)
500 6000.0
0.5
1.0
Abs
orba
nce
Wavelength (nm)
(b) (a)
400 500 600 7000.0
0.5
1.0
Abs
orba
nce
Wavelength (nm)
Figure SX. Absorbance spectrum of 5,10,15,20-tetra p-tolyl 2 (4-vinyl phenyl) iron (III) porphyrin chloride recorded in toluene.
650 7000.0
0.5
1.0
Abs
orba
nce
Wavelength (nm)
(a) (b)

S9
1.3 FTIR data
Figure S7.
FTIR transmission spectra of the model compounds: (a) 5,10,15,20-tetra-p-tolylporphyrin, (b) 5,10,15,20-tetra-p-tolylporphyrin cobalt(II), and (c) 5,10,15,20-tetra-p-tolylporphyrin iron(III) chloride in KBr.
1600 1500 1400 1300 1200 1100 1000
% T
rans
mitt
ance
Wavenumber (cm-1)
C=Cph / CE=CE / CD�Cm CD-CNCm-Cph CE-H / CD-CE
(a)
1600 1500 1400 1300 1200 1100 1000
% T
rans
mitt
ance
Wavenumber (cm-1)
C=Cph / CE=CE / CD�Cm CD-CNCm-Cph CE-H / CD-CE
(b)
(c)
1600 1500 1400 1300 1200 1100 1000
% T
rans
mitt
ance
Wavenumber (cm-1)
C=Cph / CE=CE / CD�CmCD-CN Cm-Cph CE-H / CD-CE

S10
Figure S8. FTIR transmission spectra of the target compounds: (a) 5,10,15,20-tetra-p-tolyl-2-(4-vinylphenyl)porphyrin, (b) 5,10,15,20-tetra-p-tolyl-2-(4-vinylphenyl)porphyrin cobalt(II), and (c) 5,10,15,20-tetra-p-tolyl-2-(4-vinylphenyl)porphyrin iron(III) chloride in KBr.
1600 1500 1400 1300 1200 1100 1000
% T
rans
mitt
ance
Wavenumber (cm-1)
C=Cph / CE=CE / CD�CmCD-CN Cm-Cph CE-H / CD-CE
(a)
1600 1500 1400 1300 1200 1100 1000
% T
rans
mitt
ance
Wavenumber (cm-1)
C=Cph / CE=CE / CD�CmCD-CN Cm-Cph CE-H / CD-CE
(b)
1600 1500 1400 1300 1200 1100 1000
% T
rans
mitt
ance
Wavenumber (cm-1)
C=Cph / CE=CE / CD�CmCD-CN Cm-Cph CE-H / CD-CE
(c)

S11
1.4 Electrochemical data
Figure S9. Cyclic voltammograms of (a) 5,10,15,20-tetra-p-tolylporphyrin cobalt(II) (CoTTP) and (b) 5,10,15,20-tetra-p-tolylporphyrin iron(III) chloride (FeTTP) recorded in 0.1 M tetrabutylammonium hexafluorophosphate in butyronitrile using a glassy carbon working electrode and a scan rate of 250 mV s-1. The counter electrode was a platinum wire and the potential of the silver wire pseudoreference electrode was determined using the ferrocenium/ferrocene (Fc+/Fc) redox couple as an internal standard.
Compound IIIE IIE IE
CoTTP NA NA -1.33 (ΔEp= 90 mV)
FeTTP -2.21 (ΔEp= 80 mV) -1.56 (ΔEp= 80 mV) -0.78 (ΔEp= 84 mV)
Table S1. Midpoint potentials for the reduction (nE1/2) of 5,10,15,20-tetra-p-tolylporphyrin cobalt(II) (CoTTP) and 5,10,15,20-tetra-p-tolylporphyrin iron(III) chloride (FeTTP) as determined by cyclic voltammetry and reported in V vs Fc+/Fc. Peak–to–peak separations (ΔEp) are reported in parenthesis. The electrolyte was 0.1 M tetrabutylammonium hexafluorophosphate in butyronitrile and the scan rate was 250 mV s-1. The working electrode was glassy carbon, the counter electrode was a platinum wire, and the potential of the silver wire pseudoreference electrode was determined using the ferrocenium/ferrocene redox couple as an internal standard.
-2.5 -2.0 -1.5 -1.0 -0.5
-25
0
i (PA
)
E (V vs Fc+/Fc)
FeIII/FeII FeII/FeI
FeI/Fe0
-2.5 -2.0 -1.5 -1.0 -0.5
-25
0
i (PA
)
E (V vs Fc+/Fc)
CoII/CoI
(b)
(a)
S12
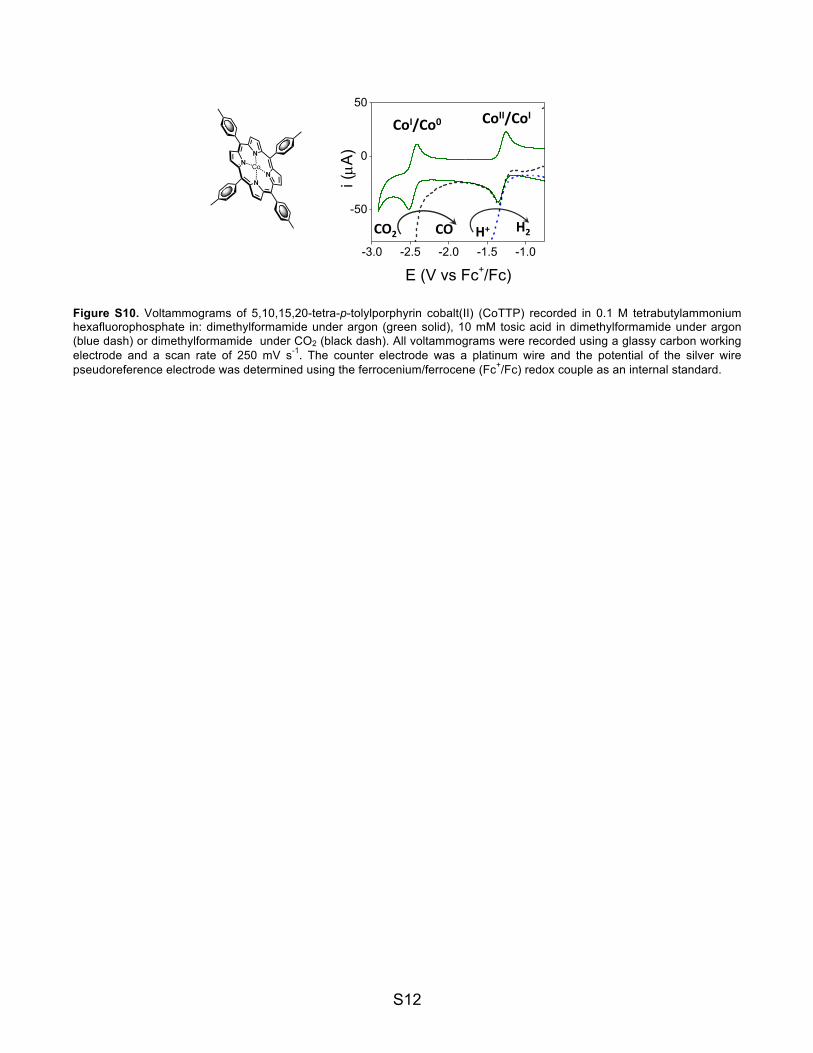
Figure S10. Voltammograms of 5,10,15,20-tetra-p-tolylporphyrin cobalt(II) (CoTTP) recorded in 0.1 M tetrabutylammonium hexafluorophosphate in: dimethylformamide under argon (green solid), 10 mM tosic acid in dimethylformamide under argon (blue dash) or dimethylformamide under CO2 (black dash). All voltammograms were recorded using a glassy carbon working electrode and a scan rate of 250 mV s-1. The counter electrode was a platinum wire and the potential of the silver wire pseudoreference electrode was determined using the ferrocenium/ferrocene (Fc+/Fc) redox couple as an internal standard.
-3.0 -2.5 -2.0 -1.5 -1.0
-50
0
50
i (PA
)
E (V vs Fc+/Fc)
CO2 CO H+ H2
CoII/CoI CoI/Co0

S13
2. Surface characterization
Figure S11. Optical spectra of GaP (100) including: transmission (solid), relative specular reflectance (dash dot), and diffuse reflectance (dash).
Figure S12. The air mass 1.5 global tilt solar flux spectrum (solid) and the transmission spectrum of the GaP substrates used in these experiments (dash). The shaded grey area shows the integrated region of the solar spectrum from 280 nm up to the band gap of GaP (Eg = 2.26 eV = 549 nm), representing the theoretical maximum number of photons (6.0 x 10¹⁶ photons s-1 cm-2) that can be collected. If all available photons give rise to current, the maximum theoretical photocurrent density is 9.6 mA cm-2. However, actual photocurrent densities are always lower given reflection and transmission losses as well as other ‘‘parasitic’’ processes that preclude absorbed photons from being converted to charge carriers moving through a potential. In addition, catalysts immobilized on a surface can also absorb a fraction of the incident photons.5
500 1000
Wavenumbers (cm-1)
% R
efle
ctan
ce
% T
rans
mitt
ance
65 4 3 2 1
Energy (eV)
400 600 800 1000 1200 14000
1x10¹⁴
2x10¹⁴
3x10¹⁴
4x10¹⁴
5x10¹⁴
Flux
(Pho
tons
s-1
cm-2 n
m-1)
Wavelength (nm)
Tra
nsm
issi
on

S14
2.1 FTIR data
Figure S13. GATR-FTIR absorbance spectra of unmodified GaP(100) before (gray) and after (black) etching with HF.
Figure S14. GATR-FTIR absorbance spectra of CoP-GaP (green) and unmodified GaP(100) (black). The porphyrin related absorbance bands observed on the modified-GaP surfaces are consistent with previous literature reports regarding the peak positions of analogous non-surface immobilized porphyrins.6,7
2500 2000 1500
Abs
orba
nce
Wavenumber (cm-1)
Q(POx)-
G(CHx)
OH bend
2000 1800 1600 1400 1200 1000
*
Abs
orba
nce
*
Wavenumber (cm-1)
*
S15
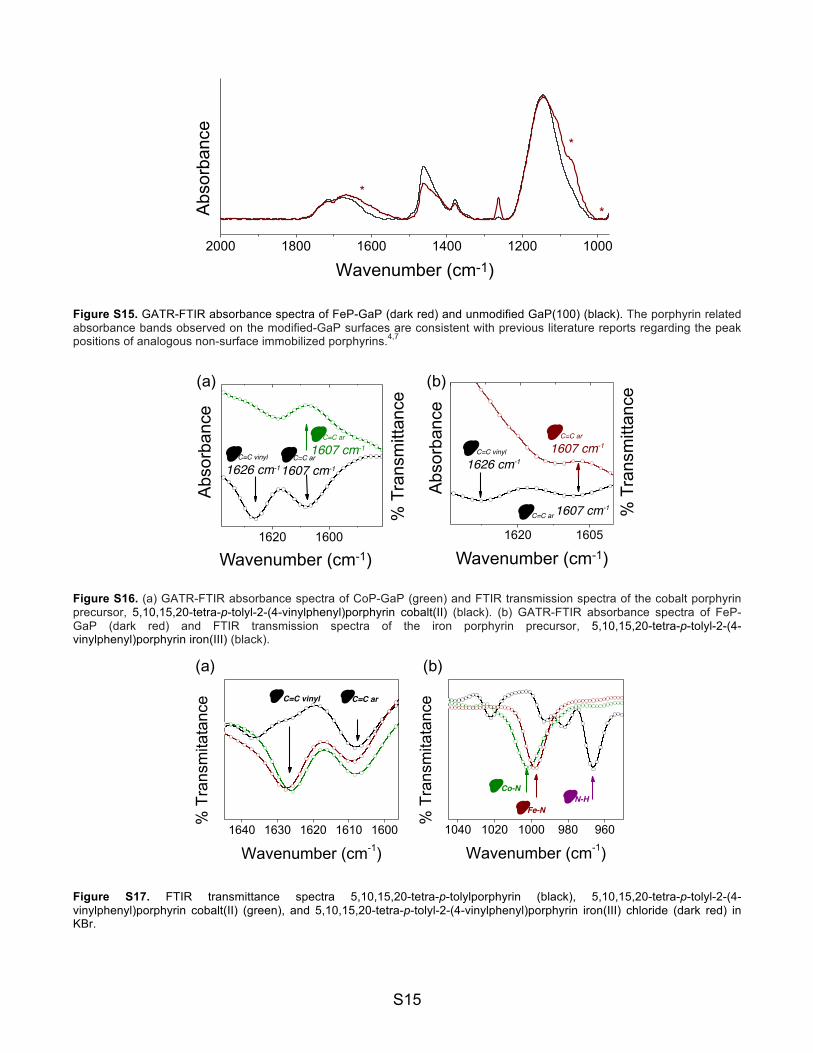
Figure S15. GATR-FTIR absorbance spectra of FeP-GaP (dark red) and unmodified GaP(100) (black). The porphyrin related absorbance bands observed on the modified-GaP surfaces are consistent with previous literature reports regarding the peak positions of analogous non-surface immobilized porphyrins.4,7
Figure S16. (a) GATR-FTIR absorbance spectra of CoP-GaP (green) and FTIR transmission spectra of the cobalt porphyrin precursor, 5,10,15,20-tetra-p-tolyl-2-(4-vinylphenyl)porphyrin cobalt(II) (black). (b) GATR-FTIR absorbance spectra of FeP-GaP (dark red) and FTIR transmission spectra of the iron porphyrin precursor, 5,10,15,20-tetra-p-tolyl-2-(4-vinylphenyl)porphyrin iron(III) (black).
Figure S17. FTIR transmittance spectra 5,10,15,20-tetra-p-tolylporphyrin (black), 5,10,15,20-tetra-p-tolyl-2-(4-vinylphenyl)porphyrin cobalt(II) (green), and 5,10,15,20-tetra-p-tolyl-2-(4-vinylphenyl)porphyrin iron(III) chloride (dark red) in KBr.
1620 1600
Q C=C ar
1607 cm-1 Q C=C vinyl
1626 cm-1 Q C=C ar
1607 cm-1
1620 1605
Q C=C vinyl
1626 cm-1
Q C=C ar 1607 cm-1
Q C=C ar
1607 cm-1
Abs
orba
nce
Wavenumber (cm-1)
% T
rans
mitt
ance
Figure SX. GATR-FTIR spectra of (a) CoP-GaP, (b) FeP-GaP with
% T
rans
mitt
ance
Abs
orba
nce
Wavenumber (cm-1)
(a) (b)
1040 1020 1000 980 960
Q Fe-N Q N-H
Q�Co-N
% T
rans
mita
tanc
e
Wavenumber (cm-1)
1640 1630 1620 1610 1600
Q C=C ar Q C=C vinyl
% T
rans
mita
tanc
e
Wavenumber (cm-1)
Figure S3. FTIR Transmission spectra of 5,10,15,20-tetra p-tolyl 2 (4-vinyl phenyl) cobalt (II) porphyrin ( green), 5,10,15,20-tetra p-tolyl 2 (4-vinyl phenyl) iron (III) porphyrin chloride (dark red), and 5,10,15,20-tetra porphyrin (porphyrin) in KBr.
(a) (b)
2000 1800 1600 1400 1200 1000
Abs
orba
nce
*
*
*
Wavenumber (cm-1)
Figure SX. GATR-FTIR spectra of (a) CoP-GaP, (b) FeP-GaP, and unmodified GaP(100) (black) on (a) and (b).

S16
2.2 XPS data
Figure S18. XP survey spectrum of unmodified GaP(100).
Figure S19. Core level XP spectra of unmodified GaP(100) showing the (a) Ga 2p3/2, (b) P 2p, (c) Co 2p, and (d) Fe 2p regions. In the Ga 2p3/2 and P 2p core level spectra (a & b), the circles (gray) are the spectral data, and the solid lines represent the background (light gray), component fit (gray), and overall fit (black).
1000 500 0
P 2pC1s
O1s
Wide
Inte
nsity
(a.u
.)Binding Energy (eV)
Ga 2p
Figure SX. XP survey spectra of unmodified GaP (100).
800 790 780
Co 2p
Inte
nsity
(a.u
.)
Binding Energy (eV)740 720 700
Fe 2p
Inte
nsity
(a.u
.)
Binding Energy (eV)
1120 1113
Ga 2p3/2
Inte
nsity
(a.u
.)
Binding Energy (eV)132 128
P 2pIn
tens
ity (a
.u.)
Binding Energy (eV)
Figure SX. XP survey spectra of unmodified GaP (100).
(a) (b)
(c) (d)

S17
Figure S20. XP survey spectrum of CoP-GaP.
Figure S21. Core level XP spectra of CoP-GaP showing the (a) Ga 2p3/2, (b) P 2p, (c) Co 2p3/2, and (d) N 1s regions. In all spectra, the circles (green) are the spectral data, and the solid lines represent the background (light gray), component fit (gray), and overall fit (black). These peak positions are consistent with previous literature reports on XP measurements of cobalt porphyrins.8,9
1250 1000 750 500 250 0
Co2pN1s
C1s
Binding Energy (eV)
Inte
nsity
(a.u
.)
Wide
P2p
Ga2p
O1s
Figure S6. XP survey spectra of CoTTP-Linker-GaP.
132 128
P 2p
Inte
nsity
(a.u
.)
Binding Energy (eV)
1120 1112
Ga 2p3/2
Inte
nsity
(a.u
.)
Binding Energy (eV)
Figure SX. (a) Ga 2p3/2 core level XP spectrum of CoP-GaP, (b) P 2p core level, © Co 2p3/2 core level, and (d0 N 1s core level XP spectrum of CoP-GaP. The solid light gray line is the background, the grey lines are the component fits and the solid black line is the overall fit. Circles?
790 785 780
Binding Energy (eV)
Inte
nsity
(a.u
.)
Co 2p3/2
402 400 398
Binding Energy (eV)
Inte
nsity
(a.u
.)
N 1s
(a) (b)
(c) (d)

S18
Figure S22. XP survey spectrum of FeP-GaP.
Figure S23. Core level XP spectra of FeP-GaP showing (a) Ga 2p3/2, (b) P 2p, (c) Fe 2p, and (d) N 1s regions. In all spectra, the circles (dark red) are the spectral data, and the solid lines represent the background (light gray), component fit (gray), and overall fit (black). These peak positions are consistent with previous literature reports on XP measurements of cobalt porphyrins.10
1000 750 500 250 0
P2pCl2pC1s
N1s
O1s
Fe2p
Wide
Inte
nsity
(a.u
.)
Binding Energy (eV)
Ga2p
Figure SX. XP survey spectra of FeTTP-Linker-GaP.
132 128
P 2p
Inte
nsity
(a.u
.)
Binding Energy (eV)1120 1112
Ga 2p3/2
Inte
nsity
(a.u
.)
Binding Energy (eV)
730 720 710
Binding Energy (eV)
Inte
nsity
(a.u
.)
Fe 2p
402 400 398 396
Binding Energy (eV)
Inte
nsity
(a.u
.)
N1 s
Figure S6. (a) Ga 2p3/2 core level XP spectrum of FeP-GaP and (b) P 2p core level (c) and (d) XP spectrum of FeP-GaP. The solid gray line is the background, the blue lines are the component fits and the solid black line is the overall fit.
(a) (b)
(c) (d)

S19
3. Photoelectrochemical data
Figure S24. (a) Photo of the photoelectrochemical cell used in this report and equipped with a CoP-GaP photoelectrode (working electrode), platinum coil (counter electrode) and Ag/AgCl electrode (reference electrode) in aqueous conditions (pH 7, 0.1 M phosphate buffer). (b) Gas chromatograms obtained using samples of the headspace gas collected from a sealed photoelectrochemical cell equipped with a CoP-GaP working electrode polarized at 0 V vs RHE. The samples were collected before (dash dot) and after (solid) 30 min of illumination (100 mW cm-2).
Figure S25. Linear sweep voltammograms recorded using a CoP-GaP working electrode in phosphate buffer (pH 7) under intermittent (gray dash) and constant (green solid) 1-sun illumination at a scan rate of 100 mV s-1.
(b) (a)
-1.0 -0.8 -0.6 -0.4 -0.2 0.0
-1.2
-0.8
-0.4
0.0
J (m
A c
m-2)
E (V vs Ag/AgCl)
-0.2 0.0 0.2 0.4 0.6
E ( V vs RHE)
pH=7
Figure x. J-V curve of a Co porphyrin-functionalized GaP in aqueous phosphate electrolyte (pH 7) under chopped ( blue dash) illumination. (scan rate 100 mV s-1)
-0.8 -0.4 0.0
-1.2
-0.6
0.0
J (m
A cm
-2)
E (V vs Ag/AgCl)
-0.2 0.0 0.2 0.4 0.6
E (V vs RHE)
CoP-GaP
29 30 31 Retention time (s)
Det
ecto
r S
igna
l (a.
u.)
H2
(a) (b)

S20
Figure S26. Three-electrode electrolysis measurements using a CoP-GaP working electrode polarized at 0 V vs RHE in phosphate buffer (pH 7) under intermittent 1-sun illumination.
Figure S27. Three-electrode electrolysis measurements using CoP-GaP working electrodes polarized at 0 V vs RHE in phosphate buffer (pH 7) under 1-sun illumination for 2 h (green) and 4 h (teal). The current density (J) represents the amount of current generated per unit cross-sectional area of the CoP-GaP working electrodes (not the electrolyte exposed surface area). During these measurements, hydrogen gas bubbles accumulating on the surface of the working electrodes are periodically dislodged from the sample, resulting in the sudden change in current density due to a sudden change in the electrolyte exposed surface area.
0 16 32 48 64 80-2.0
-1.5
-1.0
-0.5
0.0
J (m
A c
m-2)
Time (s)

S21
Figure S28. (a) Cyclic voltammograms of 5,10,15,20-tetra-p-tolylporphyrin cobalt(II) (CoTTP) (green) and a model cobaloxime complex, Co(dmgH)2(Py)Cl, (red) recorded in 0.1 M tetrabutylammonium hexafluorophosphate in dimethylformamide using a glassy carbon working electrode and a scan rate of 250 mV s-1. As recommended by IUPAC12, electrode potentials in nonaqueous solvents are reported with respect to the ferrocenium/ferrocene redox couple (V vs Fc+/Fc) as a reference redox system. Conversion to a normal hydrogen electrode scale (V vs NHE) is included to facilitate comparisons (with E1/2 of the Fc+/Fc couple taken as 0.45 V vs. SCE13 and the potential of the SCE electrode taken as 0.241 V vs NHE14). This latter method of reporting potentials is not recommended in large part because it involves conversion from actual experimentally measured potentials to potentials versus a theoretical reference standard.15 (b) Linear sweep voltammograms recorded using CoP-GaP (green), cobaloxime-polyvinylpyridine-GaP11 (red), or unmodified GaP(100) (black) working electrodes in phosphate buffer (pH 7) at a scan rate, 100 mV s-1 under 100 mW cm-2 illumination. The dashed line at 0 V vs RHE represents the reversible hydrogen electrode potential (-0.41 V vs NHE at pH 7).
Compound IIIE IIE IE
CoTTP NA -2.47 (ΔEp= 100 mV) -1.3 (ΔEp= 100 mV)
Co(dmgH)2(Py)Cl NA NA -1.55 (ΔEp= 70 mV)
Table S2. Midpoint potentials for the reduction (nE1/2) of 5,10,15,20-tetra-p-tolylporphyrin cobalt(II) (CoTTP) and a model cobaloxime complex, Co(dmgH)2(Py)Cl, as determined by cyclic voltammetry and reported in V vs Fc+/Fc. Peak–to–peak separations (ΔEp) are reported in parenthesis. The electrolyte was 0.1 M tetrabutylammonium hexafluorophosphate in dimethylformamide, and the scan rate was 250 mV s-1. The working electrode was glassy carbon, the counter electrode was a platinum wire, and the potential of the silver wire pseudoreference electrode was determined using the ferrocenium/ferrocene redox couple as an internal standard.
-3.0 -2.5 -2.0 -1.5 -1.0
-50
0
50
i (PA
)
E (V vs Fc+/Fc)
CoII/CoI
CoII/CoI CoI/Co0
-1.0 -0.8 -0.6 -0.4 -0.2 0.0
-1.2
-0.8
-0.4
0.0
J (m
A c
m-2)
E (V vs Ag/AgCl)
-0.2 0.0 0.2 0.4 0.6
E ( V vs RHE)
-1.0 -0.8 -0.6 -0.4 -0.2 0.0
-1.2
-0.8
-0.4
0.0
J (m
A c
m-2)
E (V vs Ag/AgCl)
-0.2 0.0 0.2 0.4 0.6
E ( V vs RHE)
-2.4 -1.8 -1.2
-50
0
50
i (PA
)
E (V vs Fc+/Fc)
-1.8 -1.2 -0.6
E (V vs NHE)
CoII/CoI
CoII/CoI
CoI/Co0
(a) (b)
S22
3.1 Spectral profile of a LSC-100 Series Oriel Solar Simulator
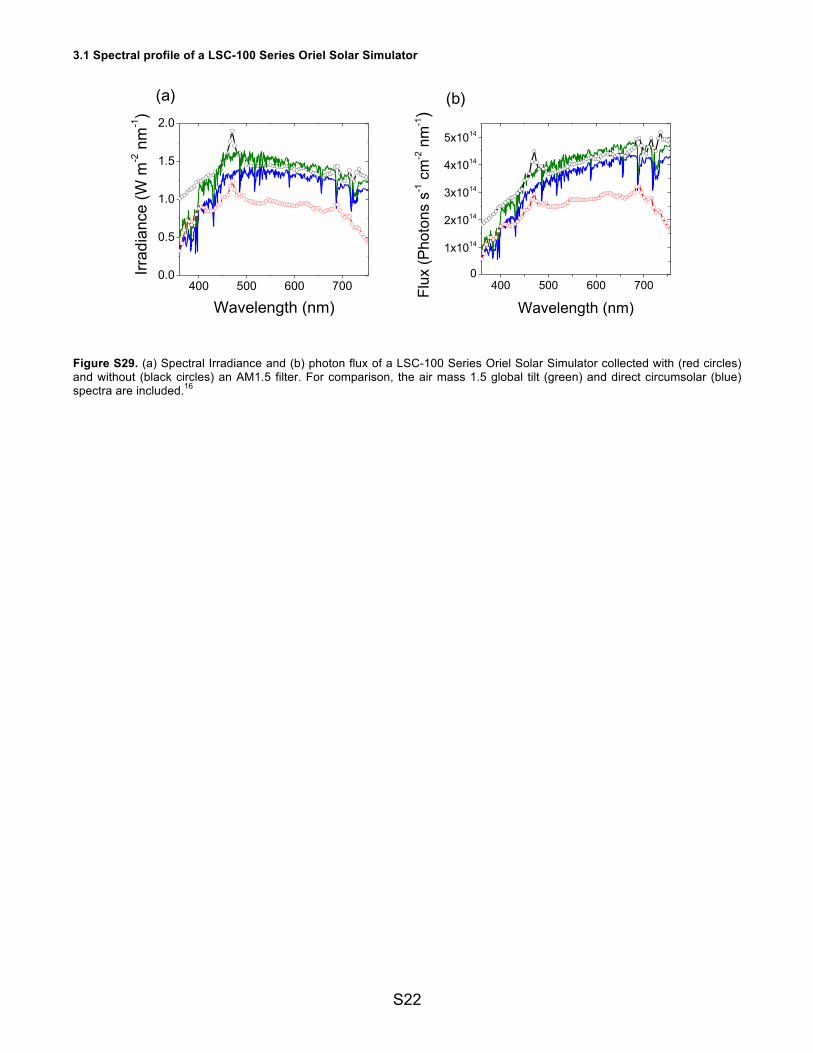
Figure S29. (a) Spectral Irradiance and (b) photon flux of a LSC-100 Series Oriel Solar Simulator collected with (red circles) and without (black circles) an AM1.5 filter. For comparison, the air mass 1.5 global tilt (green) and direct circumsolar (blue) spectra are included.16
400 500 600 7000
1x10¹⁴
2x10¹⁴
3x10¹⁴
4x10¹⁴
5x10¹⁴
Flux
(Pho
tons
s-1 c
m-2 n
m-1)
Wavelength (nm)400 500 600 700
0.0
0.5
1.0
1.5
2.0
Irrad
ianc
e (W
m-2 n
m-1)
Wavelength (nm)
(a) (b)
S23
4. Supplemental information references
1. Lee, C.H; Lindsey, J.S. One-Flask Synthesis of Meso-Substituted Dipyrromethanes Their Application in the Synthesis of Trans-Substituted Porphyrin Building Blocks. Tetrahedron 1994,50(39): 11427-11440.
2. Gao, G.Y.; Ruppel, J.V.; Allen, D.B.; Chen, Y.; Zhang, X.P. Synthesis of β-Functionalized Porphyrins via Palladium- Catalyzed Carbon - Heteroatom Bond Formations : Expedient Entry into β -Chiral Porphyrins. JOC Artic. 2007,72(6): 9060-9066.
3. Chizhova N.V.; Kumeev R.S.; Mamardashvili N.Zh. Synthesis and Spectral Properties of Cobalt (II) and Cobalt (III) Tetraarylporphyrinates. Russ. J. Inorg. Chem. 2013,58(6): 740-743.
4. Sun, Z.-C.; She, Y.-B.; Zhou, Y.; Song X.-F.; Li, Kai. Synthesis, Characterization and Spectral Properties of Substituted Tetraphenylporphyrin Iron Chloride Complexes. Molecules 2011,16: 2960-2970.
5. Trotochaud, L.; Mills, T. J.; Boettcher, S. W.; An Optocatalytic Model for Semiconductor-Catalyst Water-splitting Photoelectrodes Based on In Situ Optical Measurements on Operational Catalyst. J. Phys. Chem. lett. 2013,4: 931-935.
6. Lu, X.; Geng, Z.; Wang, Y.; Lv, B.; Kang, J. Synthesis and Characterization of Three New Unsymmetrical Porphyrins and Their Cobalt Complexes. Synth.React. Inorg. Met. Org. Chem.2002,32: 843-851.
7. Costa, A.A.; Ghesti, G.F.; Macedo, J.L.; Braga V.S.; Santos, M.M., Dias, J.A., Dias, S.L. Immobilization of Fe, Mn and Co Tetraphenylporphyrin Complexes in MCM-41 and their Catalytic Activity in Cyclohexene Oxidation Reaction by Hydrogen Peroxide. J. of Mol. Cat. A 2008,282: 149-157.
8. Karweik, D.H.; Winograd, N. Nitrogen Charge Distributions in Free-Base Porphyrins, Metalloporphyrins, and Their Reduced Analogues Observed by X-Ray Photoelectron Spectroscopy. Inorg. Chem. 1976,15: 2336-2342.
9. Flechtner, K.; Andreas Kretschmann, A.; Steinru ̈ck, H.-P.; Gottfried, J.M. NO-Induced Reversible Switching of the Electronic Interaction between a Porphyrin-Coordinated Cobalt Ion and Silver Surface. J. Am. Chem. Soc. 2007,129: 12110-12111.
10. Lipińska, M.E.; Novais, J.P.; Rebelo, S.L.-H.; Bachiller-Baeza, B.; Rodriguez-Ramos, I.; Guerrero-Ruiz, A.; Freire, C. Microwave assisted Silylation of Graphite Oxide and Iron (III) Porphyrin Interaction. Polyhedron 2014,81: 475-484.
11. Beiler, A.M.; Khusnutdinova D.; Jacob S.I.; Moore G.F. Chemistry at the interface: Polymer-Functionalized GaP Semiconductors for Solar Hydrogen Production. Ind. Eng. Chem. Res. 2016, 55: 5306-5314.
12. Gritzner, G.; Kuta. Recommendations on reporting electrode potentials in nonaqueous solvents. J. Pure Appl. Chem. 1984, 56: 461-466.
13. Connelly, N. G.; Geiger, W. E. Chemical Redox Agents for Organometallic Chemistry. Chem. Rev. 1996, 96, 877-910.
14. Bard, A. J.; Faulkner, L. R. Electrochemical Methods: Fundamentals and Applications, 2nd edn. Wiley & Sons: New York, 2001.
15. Kadish, K. M.; Smith, K. M.; Guilard, R. The Porphyrin Handbook: Electron transfer, Volume 8, 2000
16. At the time of writing, the air-mass 1.5 global tilt (AM 1.5G) and direct circumsolar (AM 1.5D) solar spectra, from the ASTM G173-03 data set, is available online at http://rredc.nrel.gov/solar/spectra/am1.5/.