Metal-Organic Frameworks as stationary phases for mixed ...
18
Metal-Organic Frameworks as stationary phases for mixed-mode separation applications Chris S. Hawes, Yada Nolvachai, Chadin Kulsing, Gregory P. Knowles, Alan L. Chaffee, Philip J. Marriott,* Stuart R. Batten* and David R. Turner* Supporting Information Index 2 Table of analyte parameters and retention values 3-4 Plots of analyte retention versus polarity, length and width 5-6 Structural analysis of compound 1B 7-9 Experimental Section 10 X-ray powder diffraction patterns for 1A and 1B 11 Thermogravimetric analysis for fresh and solvent-exchanged 1B 12-13 Discussion of separation method 14-16 Gas sorption experiments 17 References Electronic Supplementary Material (ESI) for ChemComm. This journal is © The Royal Society of Chemistry 2014
Transcript of Metal-Organic Frameworks as stationary phases for mixed ...
Metal-Organic Frameworks as stationary phases for mixed-mode separation applications
Chris S. Hawes, Yada Nolvachai, Chadin Kulsing, Gregory P. Knowles, Alan L. Chaffee, Philip J.
Marriott,* Stuart R. Batten* and David R. Turner*
Supporting Information
Index
2 Table of analyte parameters and retention values
3-4 Plots of analyte retention versus polarity, length and width
5-6 Structural analysis of compound 1B
7-9 Experimental Section
10 X-ray powder diffraction patterns for 1A and 1B
11 Thermogravimetric analysis for fresh and solvent-exchanged 1B
12-13 Discussion of separation method
14-16 Gas sorption experiments
17 References
Electronic Supplementary Material (ESI) for ChemComm.This journal is © The Royal Society of Chemistry 2014
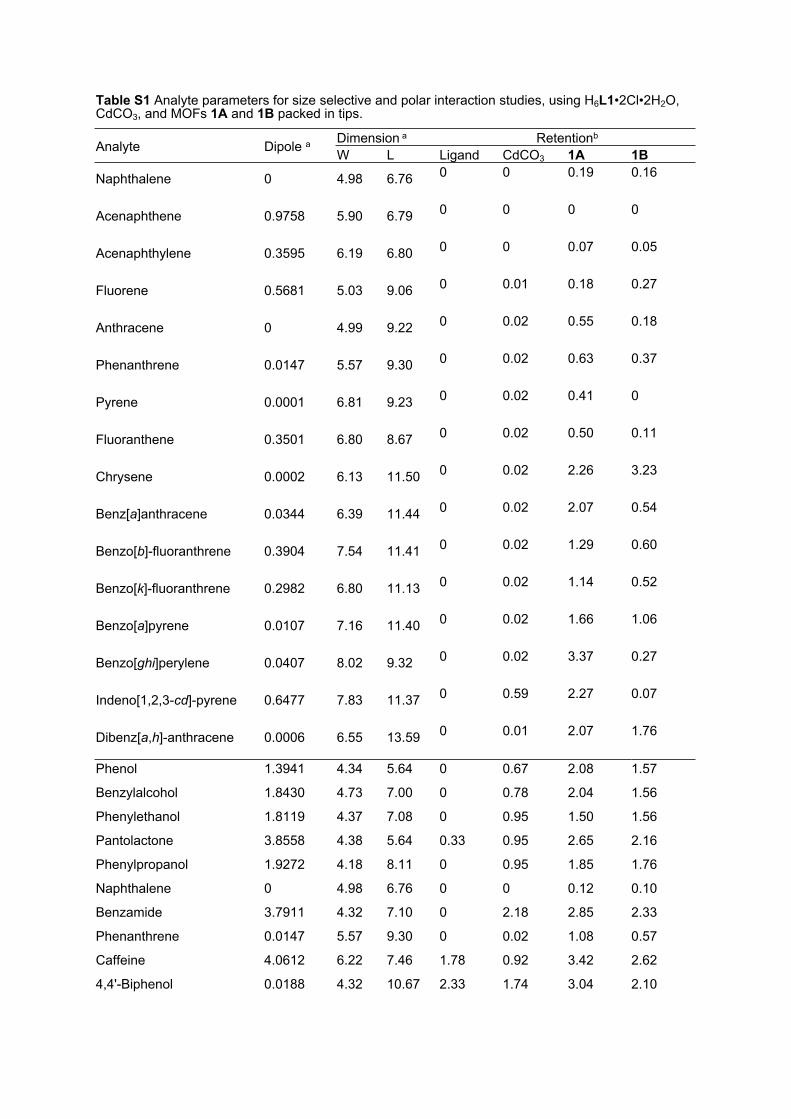
Table S1 Analyte parameters for size selective and polar interaction studies, using H6L1•2Cl•2H2O, CdCO3, and MOFs 1A and 1B packed in tips.
Dimension a RetentionbAnalyte Dipole a W L Ligand CdCO3 1A 1B
Naphthalene 0 4.98 6.76 0 0 0.19 0.16
Acenaphthene 0.9758 5.90 6.79 0 0 0 0
Acenaphthylene 0.3595 6.19 6.80 0 0 0.07 0.05
Fluorene 0.5681 5.03 9.06 0 0.01 0.18 0.27
Anthracene 0 4.99 9.22 0 0.02 0.55 0.18
Phenanthrene 0.0147 5.57 9.30 0 0.02 0.63 0.37
Pyrene 0.0001 6.81 9.23 0 0.02 0.41 0
Fluoranthene 0.3501 6.80 8.67 0 0.02 0.50 0.11
Chrysene 0.0002 6.13 11.50 0 0.02 2.26 3.23
Benz[a]anthracene 0.0344 6.39 11.44 0 0.02 2.07 0.54
Benzo[b]-fluoranthrene 0.3904 7.54 11.41 0 0.02 1.29 0.60
Benzo[k]-fluoranthrene 0.2982 6.80 11.13 0 0.02 1.14 0.52
Benzo[a]pyrene 0.0107 7.16 11.40 0 0.02 1.66 1.06
Benzo[ghi]perylene 0.0407 8.02 9.32 0 0.02 3.37 0.27
Indeno[1,2,3-cd]-pyrene 0.6477 7.83 11.37 0 0.59 2.27 0.07
Dibenz[a,h]-anthracene 0.0006 6.55 13.59 0 0.01 2.07 1.76
Phenol 1.3941 4.34 5.64 0 0.67 2.08 1.57
Benzylalcohol 1.8430 4.73 7.00 0 0.78 2.04 1.56
Phenylethanol 1.8119 4.37 7.08 0 0.95 1.50 1.56
Pantolactone 3.8558 4.38 5.64 0.33 0.95 2.65 2.16
Phenylpropanol 1.9272 4.18 8.11 0 0.95 1.85 1.76
Naphthalene 0 4.98 6.76 0 0 0.12 0.10
Benzamide 3.7911 4.32 7.10 0 2.18 2.85 2.33
Phenanthrene 0.0147 5.57 9.30 0 0.02 1.08 0.57
Caffeine 4.0612 6.22 7.46 1.78 0.92 3.42 2.62
4,4'-Biphenol 0.0188 4.32 10.67 2.33 1.74 3.04 2.10

Pyrene 0.0001 6.81 9.23 0 0.02 1.31 0.22
Bisphenol A 0.9729 5.53 9.48 2.33 1.70 3.23 2.41a Parameters obtained from GAUSSIAN091, using B3LYP 6-311++G(d,p) basis set. Dipole moment values are expressed as debye (D). Dimensions, width (W) and length (L) are inter-atomic distances, expressed in angstrom (Å) units.bRelative to acenaphthene. PAH elution was carried out by stepwise gradient 100% EtOAc – 50% EtOAc/Hexane, and polar compounds by 50% EtOAc/Hexane - 100% EtOAc
Figure S1 (a) Correlations of polar analyte retention and their dipole moment using 1A and
1B packed tips (diamonds and crosses, respectively). (b). Dipole moment correlation using
CdCO3-packed tips. The corresponding values are shown in Table 1. Linear equations were
calculated without the highlighted analytes, which were suspected to undergo hydrogen
bonding and/or metal coordination as well as dipole effects.
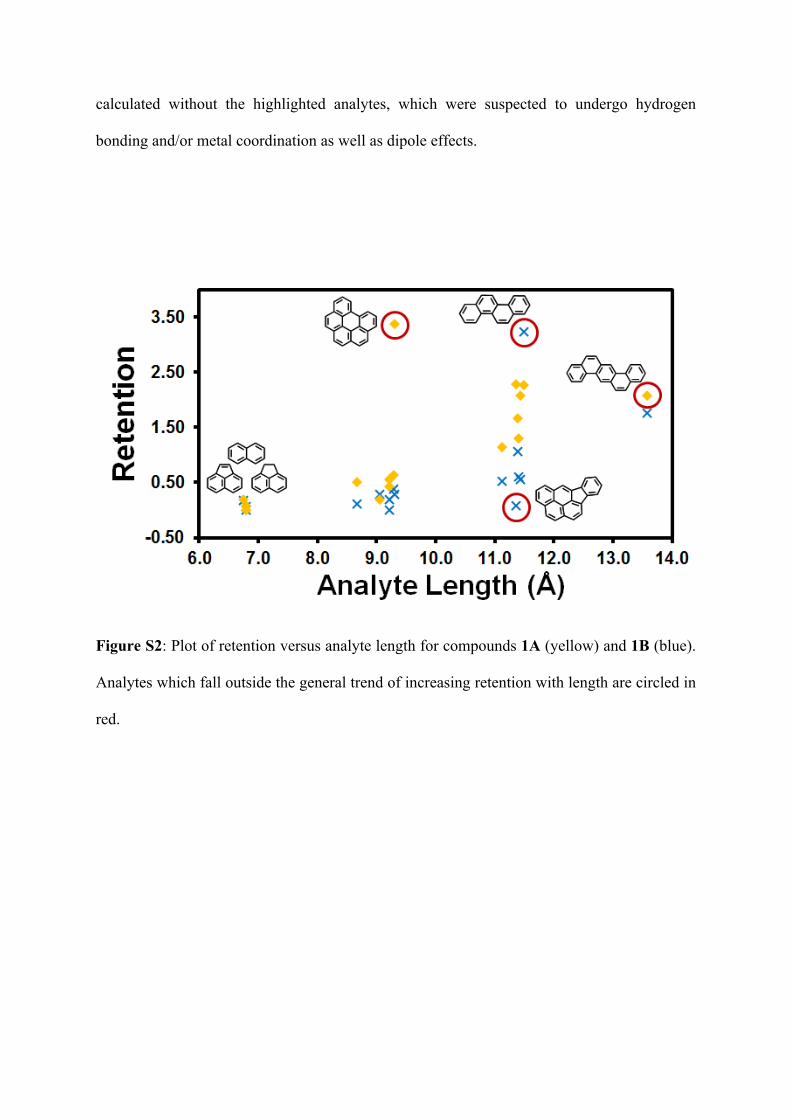
Figure S2: Plot of retention versus analyte length for compounds 1A (yellow) and 1B (blue).
Analytes which fall outside the general trend of increasing retention with length are circled in
red.

Figure S3: Plot of retention versus analyte width for compounds 1A (yellow) and 1B (blue).
Representative example compounds are circled in red and structures shown for reference.
Structural Analysis of 1B
The structure displayed a doubly-interpenetrated 3,4-connected binodal topology, containing
two Cd(II) sites - one encapsulated within the macrocyclic cavity with a chelating
carboxylate group in the axial position, with an overall +1 charge, and the second engaged in
a tris-carboxylate chelate coordination mode, displaying a -1 charge (Figure S4). This results
in an overall neutral framework with pseudo-zwitterionic character. The interpenetration
allows the networks to associate such that electrostatic contacts between frameworks are
maximised (~6Å between +1 and -1 charges from adjacent frameworks), while retaining
porosity.
The four arms of the ligand are splayed out in a roughly square planar conformation,
so that each arm connects to a different cadmium atom, three being Cd atoms bound by three
carboxylates and thus acting as 3-connecting nodes, and the other to a macrocylic-bound Cd.
These structural features are shared by both 1A and 1B. The coordination of the macrocyclic

Cd by a carboxylate arm from an adjacent macrocycle leads to the CdL1 species acting as 5-
connecting nodes, to generate an overall 3,5-connected kdd net. By contrast, in 1A one of the
arms is twisted out of the plane of the others.2 This arm coordinates to the metal in the centre
of an adjacent macrocycle, and this second macrocycle reciprocates the interaction with its
own out-of-plane benzoate arm, leading to a double bridge which reduces the connectivity of
the cadmium macrocyle node, generating a 3,4-connected ins net.
The topological differences between the two structures can be observed in Figure S5;
MOF 1B contains one additional link compared to 1A, effectively reducing the size of the
primary channels in 1B.
Gao et al. reported the presence of a water molecule coordinating to the carboxylate-
bound cadmium atom in 1A.2 Due in part to framework disorder and difficult diffraction
characteristics, we were unable to locate an equivalent ligand bound to compound 1B,
however the presence of considerable quantities of solvent within the isolated material
suggests that some solvent coordination to the Cd2 site is possible.
Figure S4: Comparison of chemical connectivity within the structures of 1A (left) and 1B
(right), showing the effect of the pivot of one benzoate arm towards or away from the axial
donor, respectively.

Figure S5: Topological comparison of MOFs 1A (left) and 1B (right), with independent
networks coloured separately, and nodes representing cadmium ions with 3,4-connectivity
(1A) or 3,5-connectivity (1B)
Experimental
Materials and Methods
Ethyl acetate (EtOAc), dimethylformamide and hexane (GC grade) were obtained from
Merck KGaA. (Darmstadt, Germany). PAH mix (49156) was from Supelco (Bellafonte, PA,
USA). Cadmium carbonate and all other compounds in Table 1 were from Sigma Aldrich
(St. Louis, MO, USA). Synthesis of H6L1·2Cl·2H2O was carried out as previously
described.3 Cadmium nitrate was obtained from Alfa Aesar. Melting points were recorded in
air on an Electrothermal melting point apparatus, and are uncorrected. Microanalysis was
performed by Campbell Microanalytical Laboratory, University of Otago, New Zealand.
Infrared spectra were obtained using an Agilent Cary 630 spectrometer equipped with an
Attenuated Total Reflectance (ATR) sampler. Thermogravimetric analysis was carried out
using a Mettler-Toledo TGA/DSC 1 STARe system. Samples were heated at a rate of 5 °C
min-1 under a nitrogen purge flow of 30 ml min-1Bulk purity of all crystalline materials was
confirmed with powder X-ray diffraction (PXRD) patterns recorded with a Bruker X8 Focus
powder diffractometer operating at Cu Kα wavelength (1.5418 Å), with samples mounted on
a zero-background silicon single crystal stage. Scans were performed at room temperature in
the 2θ range 5 – 55° and compared with predicted patterns based on single crystal data. Both
materials were stable on standing in air after isolation from the reaction mixtures, although
the presence of diffuse pore contents resulted in relatively poor PXRD intensity. On exchange
of the non-volatile reaction solvent, no appreciable diffraction was observed, preventing any
further PXRD analysis of the materials. As a precaution, during solvent exchange and
separation experiments, both 1A and 1B were prevented from completely drying.
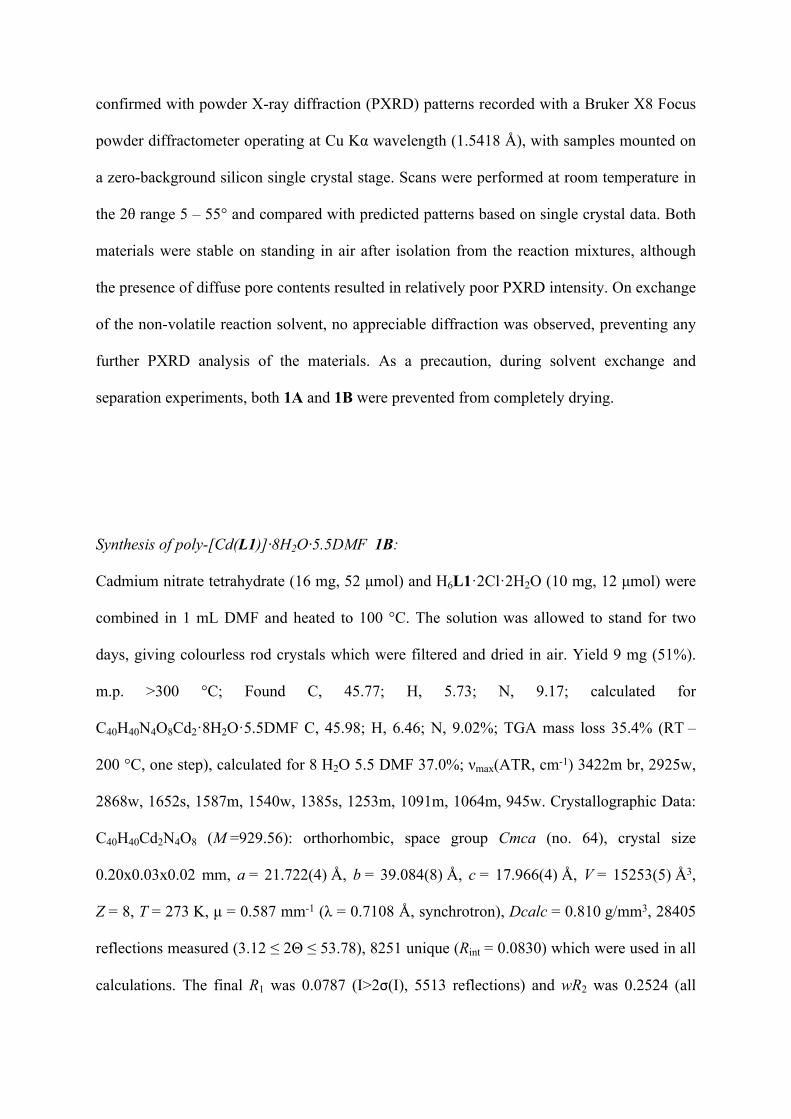
Synthesis of poly-[Cd(L1)]·8H2O·5.5DMF 1B:
Cadmium nitrate tetrahydrate (16 mg, 52 μmol) and H6L1·2Cl·2H2O (10 mg, 12 μmol) were
combined in 1 mL DMF and heated to 100 °C. The solution was allowed to stand for two
days, giving colourless rod crystals which were filtered and dried in air. Yield 9 mg (51%).
m.p. >300 °C; Found C, 45.77; H, 5.73; N, 9.17; calculated for
C40H40N4O8Cd2·8H2O·5.5DMF C, 45.98; H, 6.46; N, 9.02%; TGA mass loss 35.4% (RT –
200 °C, one step), calculated for 8 H2O 5.5 DMF 37.0%; νmax(ATR, cm-1) 3422m br, 2925w,
2868w, 1652s, 1587m, 1540w, 1385s, 1253m, 1091m, 1064m, 945w. Crystallographic Data:
C40H40Cd2N4O8 (M =929.56): orthorhombic, space group Cmca (no. 64), crystal size
0.20x0.03x0.02 mm, a = 21.722(4) Å, b = 39.084(8) Å, c = 17.966(4) Å, V = 15253(5) Å3,
Z = 8, T = 273 K, μ = 0.587 mm-1 (λ = 0.7108 Å, synchrotron), Dcalc = 0.810 g/mm3, 28405
reflections measured (3.12 ≤ 2Θ ≤ 53.78), 8251 unique (Rint = 0.0830) which were used in all
calculations. The final R1 was 0.0787 (I>2σ(I), 5513 reflections) and wR2 was 0.2524 (all

data, 8251 reflections). The SQUEEZE routine within PLATON4 was used to account for
diffuse electron density within the solvent channels. CCDC 977250.
Synthesis of MOF-1A
A slight modification to the reported procedure was employed to prepare 1A on a bulk scale,
due to difficulties in reproducibility encountered from using the dihydrochloride salt of L1 as
a starting material. To H6L1·2Cl·2H2O (10 mg; 12 μmol) in a 200:1 mixture of N,N-
dimethylacetamide: N-methyl pyrollidinone (2 mL) was added cadmium nitrate tetrahydrate
(16 mg; 52 μmol), and the mixture was sealed in a glass vial and heated to 120 °C for 16 h.
The small, pale yellow crystals obtained were filtered and dried in air. Yield 4 mg. Phase
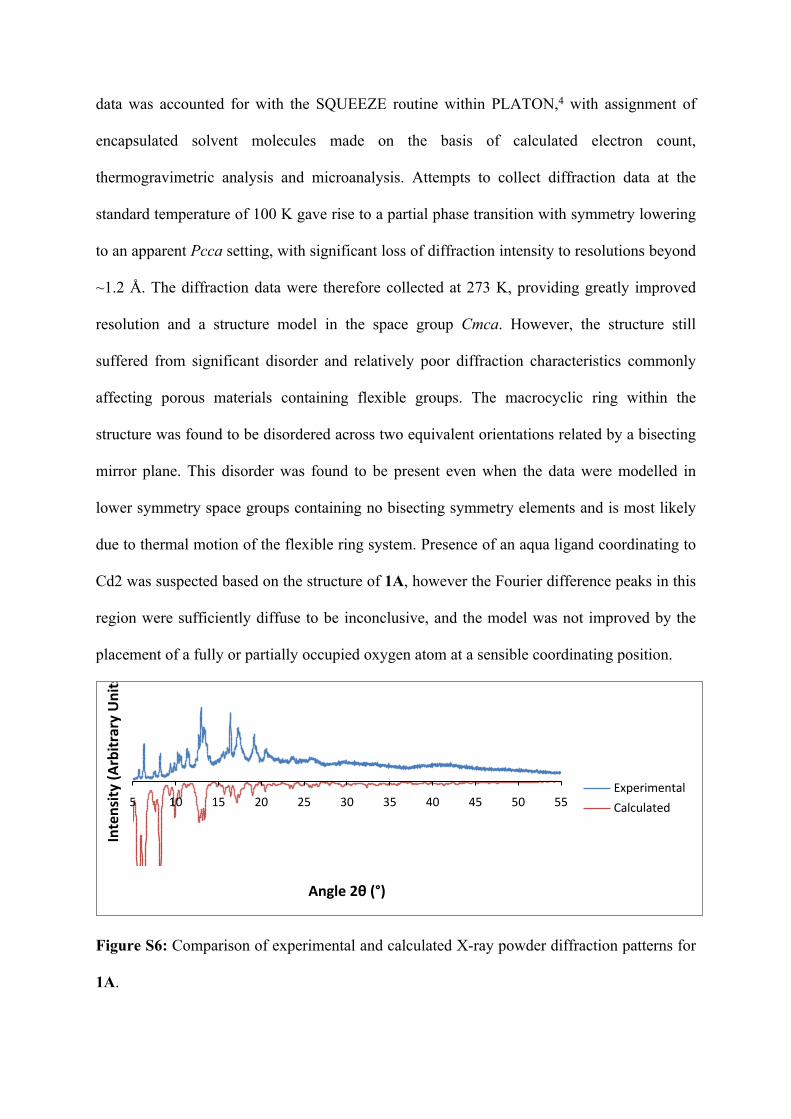
purity was confirmed by X-ray powder diffraction (Figure S6)
X-Ray Crystallography
Data collection for compound 1B was carried out at the Australian Synchrotron on the MX1
beamline, operating at 17.4 keV (λ = 0.7108 Å) with data collection conducted using BluIce
control software.5 Corrected anomalous dispersion values were calculated where necessary
using Brennan and Cowan data.6 The diffraction data were processed, reduced and corrected
with the XDS software suite.7 The diffraction data were solved using direct methods with
SHELXS8 and refined on F2 using all data by full matrix least-squares procedures with
SHELXL-979 within OLEX 2.10 Non-hydrogen atoms were refined with anisotropic
displacement parameters. Hydrogen atoms were modelled in calculated positions with
isotropic displacement parameters 1.2 times the isotropic equivalent of their carrier atoms.
The functions minimized were Σw(F2o-F2
c), with w=[σ2(F2o)+aP2+bP]-1, where
P=[max(Fo)2+2Fc 2]/3. The structure was found to contain regions of diffuse electron density
which were unable to be sensibly modelled, and as such, their contribution to the diffraction
data was accounted for with the SQUEEZE routine within PLATON,4 with assignment of
encapsulated solvent molecules made on the basis of calculated electron count,
thermogravimetric analysis and microanalysis. Attempts to collect diffraction data at the
standard temperature of 100 K gave rise to a partial phase transition with symmetry lowering
to an apparent Pcca setting, with significant loss of diffraction intensity to resolutions beyond
~1.2 Å. The diffraction data were therefore collected at 273 K, providing greatly improved
resolution and a structure model in the space group Cmca. However, the structure still
suffered from significant disorder and relatively poor diffraction characteristics commonly
affecting porous materials containing flexible groups. The macrocyclic ring within the
structure was found to be disordered across two equivalent orientations related by a bisecting
mirror plane. This disorder was found to be present even when the data were modelled in
lower symmetry space groups containing no bisecting symmetry elements and is most likely
due to thermal motion of the flexible ring system. Presence of an aqua ligand coordinating to
Cd2 was suspected based on the structure of 1A, however the Fourier difference peaks in this
region were sufficiently diffuse to be inconclusive, and the model was not improved by the
placement of a fully or partially occupied oxygen atom at a sensible coordinating position.
5 10 15 20 25 30 35 40 45 50 55ExperimentalCalculated
Angle 2θ (°)
Inte
nsity
(Arb
itrar
y U
nits
)
Figure S6: Comparison of experimental and calculated X-ray powder diffraction patterns for
1A.
5 10 15 20 25 30 35 40 45 50ExperimentalCalculated
Angle 2θ (°)
Inte
nsity
(Arb
itrar
y U
nits
)
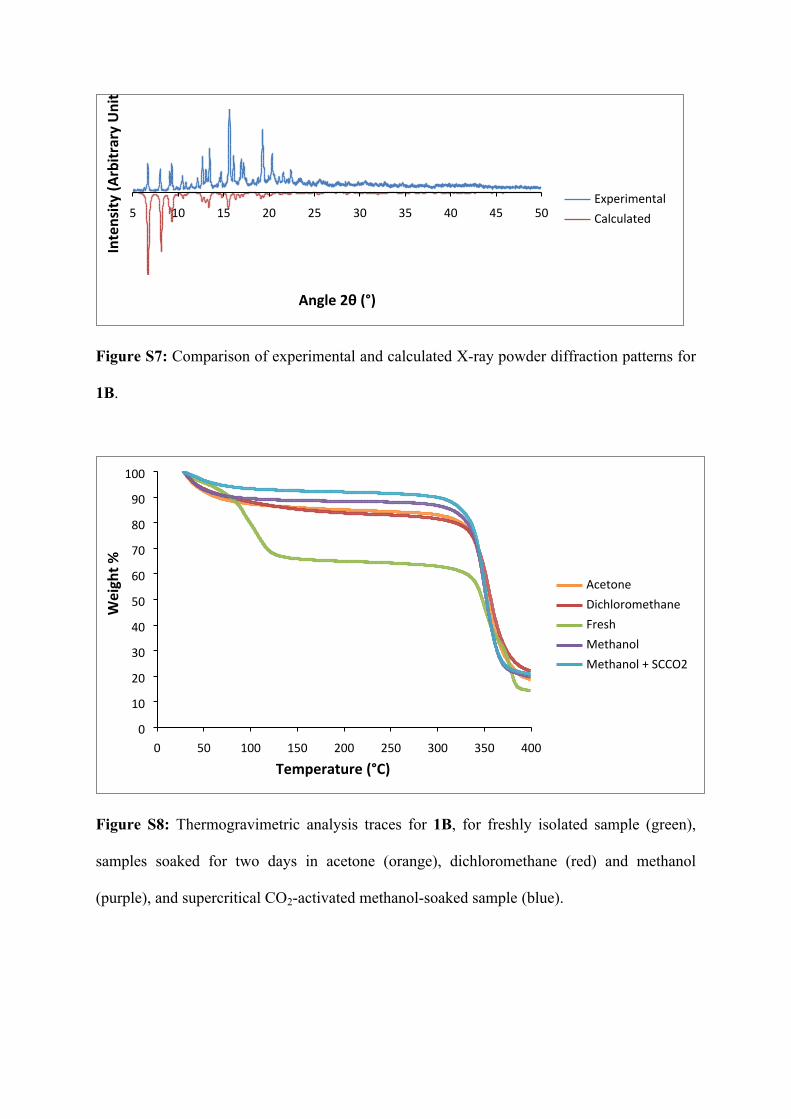
Figure S7: Comparison of experimental and calculated X-ray powder diffraction patterns for
1B.
0 50 100 150 200 250 300 350 4000
10
20
30
40
50
60
70
80
90
100
AcetoneDichloromethaneFreshMethanolMethanol + SCCO2
Temperature (°C)
Wei
ght %
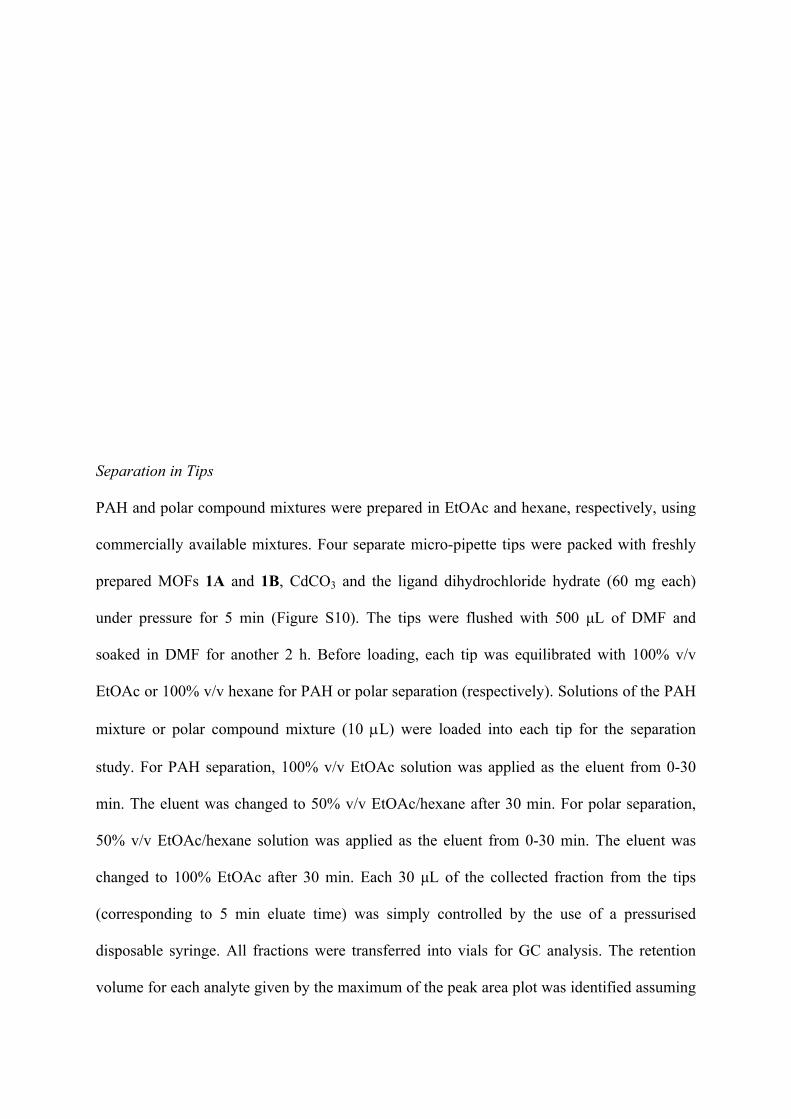
Figure S8: Thermogravimetric analysis traces for 1B, for freshly isolated sample (green),
samples soaked for two days in acetone (orange), dichloromethane (red) and methanol
(purple), and supercritical CO2-activated methanol-soaked sample (blue).
Separation in Tips
PAH and polar compound mixtures were prepared in EtOAc and hexane, respectively, using
commercially available mixtures. Four separate micro-pipette tips were packed with freshly
prepared MOFs 1A and 1B, CdCO3 and the ligand dihydrochloride hydrate (60 mg each)
under pressure for 5 min (Figure S10). The tips were flushed with 500 μL of DMF and
soaked in DMF for another 2 h. Before loading, each tip was equilibrated with 100% v/v
EtOAc or 100% v/v hexane for PAH or polar separation (respectively). Solutions of the PAH
mixture or polar compound mixture (10 L) were loaded into each tip for the separation
study. For PAH separation, 100% v/v EtOAc solution was applied as the eluent from 0-30
min. The eluent was changed to 50% v/v EtOAc/hexane after 30 min. For polar separation,
50% v/v EtOAc/hexane solution was applied as the eluent from 0-30 min. The eluent was
changed to 100% EtOAc after 30 min. Each 30 μL of the collected fraction from the tips
(corresponding to 5 min eluate time) was simply controlled by the use of a pressurised
disposable syringe. All fractions were transferred into vials for GC analysis. The retention
volume for each analyte given by the maximum of the peak area plot was identified assuming

Gaussian peak shape, and retention was then calculated from the relative retention volume
(Table S1). Gaussian peak shapes could not be applied for analytes displaying highly
asymmetric distribution, such as benzo[k]fluoranthene (Manuscript, Figure 2a). In this case,
the elution volume corresponding to the maximum peak intensity was selected to be the
retention volume. It should be noted that the separation of non-polar analytes (PAHs) was
improved by firstly using a more polar mobile phase (ethyl acetate) eluting unretained
analytes followed by a less polar mobile phase (hexane/ethyl acetate) eluting the rest, as is
standard strategy for reverse phase chromatography. Conversely, polar analyte separation was
improved by using a non-polar mobile phase (hexane) eluting unretained analytes followed
by the more polar mobile phase (ethyl acetate/hexane) eluting the rest, as standard for the
concept of normal phase chromatography.
Figure S9: Schematic diagram of tip separation protocol
Analyte solutions (1 µL, split ratio of 5:1 for PAH and 20:1 for polar compounds) were
injected into an Agilent 6850 GC (Agilent Technologies, Mulgrave, Australia) coupled with
FID, installed with an Rxi®-17Sil MS column of 15 m × 0.18 mm × 0.18 µm film thickness
(Restek, Bellefonte, PA). For PAH, the oven temperature program was set at 50 °C, heated to
260 °C at 25 °C min-1, and finally to 280 °C at 5 °C min-1 (held for 5 min), while for polar
compounds the program started at 40 °C, ramped to 150 °C at 20 °C min-1 and to 320 °C at
25 °C min-1 (held for 5 min). Hydrogen was used as the carrier gas at a flow rate of 0.5 mL
min-1. Injector and detector temperatures were 320 °C and 300 °C respectively. Data were
collected at 20 Hz. Data acquisition and analysis was performed using ChemStation software.
Gas Sorption Experiments
A sample of compound 1B (~150 mg) was soaked in 20 mL of methanol for 3 days, with the
solvent decanted and replaced with fresh methanol every 24 h. Following this period, the
solids were filtered and subjected to supercritical CO2 exchange using a Tousimis Samdri
PVT-3D instrument. Liquid CO2 was passed across the material within porous Teflon cups
for 2 h, after which the chamber pressure and temperature were increased above the critical
point, and allowed to dwell for 4 h. The chamber was purged to atmospheric pressure, and the
process was repeated once more. Immediately following the completion of the exchange
cycle, the sample was loaded into a standard glass bulb sample tube, which was evacuated at
room temperature overnight using a Micromeritics VacPrep 061 Degasser instrument to
prepare it for gas sorption analysis. The sample was analysed for carbon dioxide and nitrogen
uptake, at 273 K and 77 K, respectively, using a Micromeritics Tristar 3020 instrument. Ultra
high purity gasses (AirLiquide) were used for all analyses. MOF 1B was found to uptake only
minimal quantities of N2 up to the saturation pressure at 77 K under the experimental
conditions, and as such, nitrogen was not considered a useful probe gas for this material.

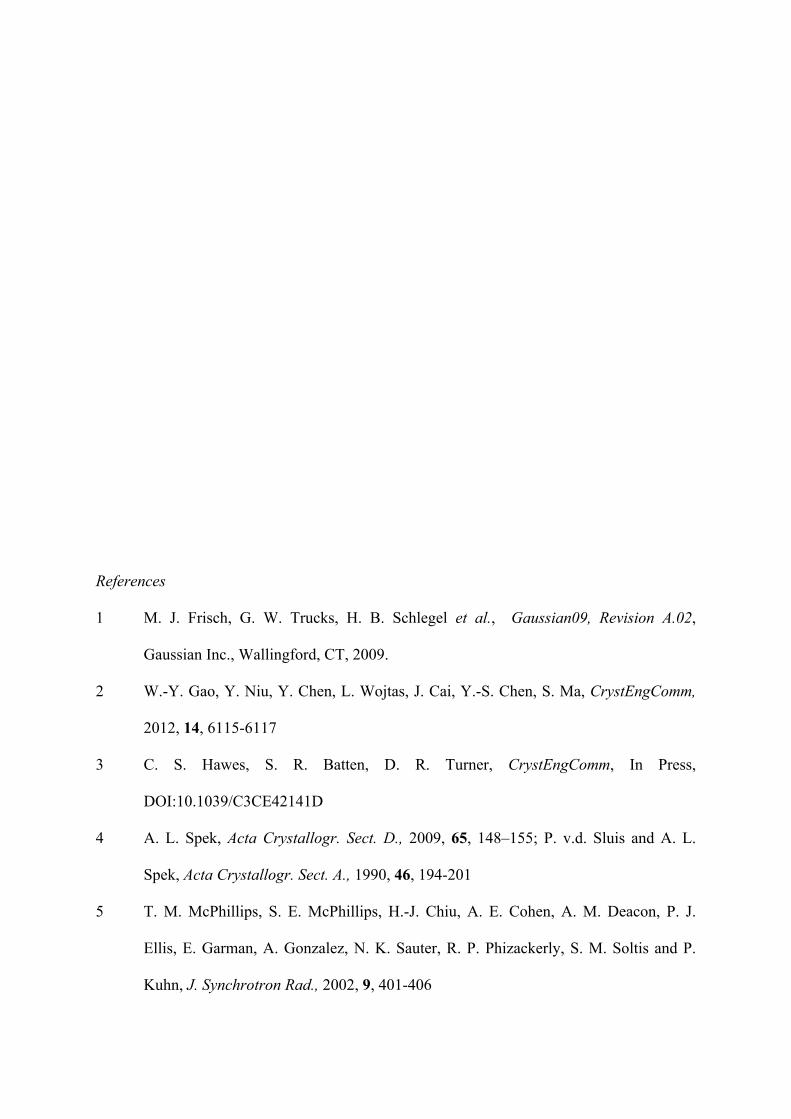
Similar behaviour was observed by Gao et al. for compound 1A.[2] Surface area was
calculated from the CO2 data using both the BET and Dubinin-Radushkevitch models within
the Tristar 3020 V1.03 Software, using datapoints in the range P/Po = 0.01 – 0.025 for BET
and using all datapoints for DR (Figures S10 and S11). The surface area values obtained were
141 and 204 m2 g-1 for BET and DR, respectively.
Figure S9: CO2 sorption isotherm plot for 1B, measured at 273K
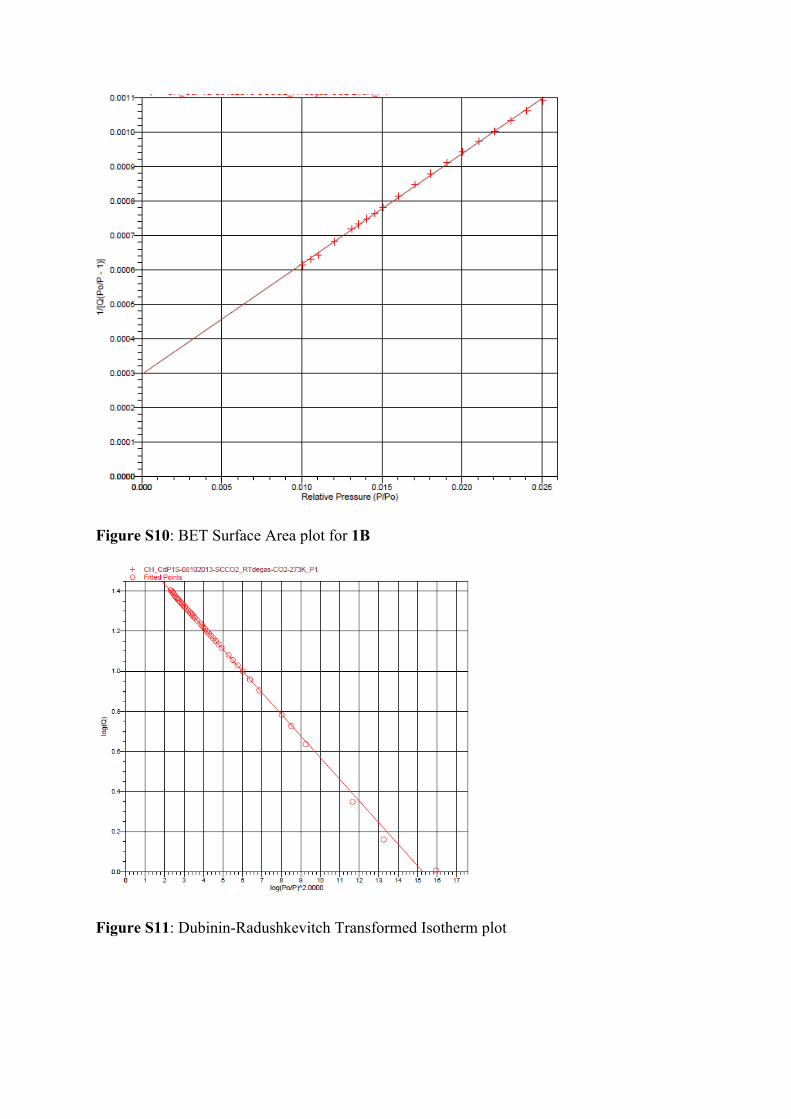
Figure S10: BET Surface Area plot for 1B
Figure S11: Dubinin-Radushkevitch Transformed Isotherm plot
References
1 M. J. Frisch, G. W. Trucks, H. B. Schlegel et al., Gaussian09, Revision A.02,
Gaussian Inc., Wallingford, CT, 2009.
2 W.-Y. Gao, Y. Niu, Y. Chen, L. Wojtas, J. Cai, Y.-S. Chen, S. Ma, CrystEngComm,
2012, 14, 6115-6117
3 C. S. Hawes, S. R. Batten, D. R. Turner, CrystEngComm, In Press,
DOI:10.1039/C3CE42141D
4 A. L. Spek, Acta Crystallogr. Sect. D., 2009, 65, 148–155; P. v.d. Sluis and A. L.
Spek, Acta Crystallogr. Sect. A., 1990, 46, 194-201
5 T. M. McPhillips, S. E. McPhillips, H.-J. Chiu, A. E. Cohen, A. M. Deacon, P. J.
Ellis, E. Garman, A. Gonzalez, N. K. Sauter, R. P. Phizackerly, S. M. Soltis and P.
Kuhn, J. Synchrotron Rad., 2002, 9, 401-406

6 S. Brennan and P. L. Cowan, Rev. Sci. Instrum., 1992, 63, 850-853
7 W. J. Kabsch, J. Appl. Cryst., 1993, 26, 795-800.
8 G. M. Sheldrick, Acta Crystallogr. Sect. A., 2008, 64, 112–122.
9 G. M. Sheldrick, SHELXL-97, Programs for X-ray Crystal Structure Refinement;
University of Göttingen: Göttingen, Germany, 1997.
10 O. V. Dolomanov, L. J. Bourhis, R. J. Gildea, J. A. K. Howard, H. Puschmann, J.
Appl. Cryst., 2009, 42, 339-341