Metabolomics combined with chemometric tools (PCA, HCA ... · PDF filechemotaxonomy...
12
Metabolomics combined with chemometric tools (PCA, HCA, PLS-DA and SVM) for screening cassava (Manihot esculenta Crantz) roots during postharvest physiological deterioration Virgílio Gavicho Uarrota a,b , Rodolfo Moresco a , Bianca Coelho a , Eduardo da Costa Nunes d,1 , Luiz Augusto Martins Peruch d,1 , Enilto de Oliveira Neubert d,1 , Miguel Rocha c,2 , Marcelo Maraschin a,⇑ a Plant Morphogenesis and Biochemistry Laboratory, Plant Science Center, Federal University of Santa Catarina, Florianópolis, SC, Brazil b Postgraduate Program in Plant Genetic Resources, Federal University of Santa Catarina, Rodovia Admar Gonzaga 1346, CEP 88.034-001 Florianópolis, SC, Brazil c Centre of Biological Engineering, University of Minho, Campus de Gualtar, 4710-057 Braga, Portugal d Santa Catarina State Agricultural Research and Rural Extension Agency (EPAGRI), Experimental Station of Urussanga (EEUR), Rd. SC 446, Km 19 S/N, CEP 88840-000 Urussanga, Florianópolis, SC, Brazil article info Article history: Received 13 December 2013 Received in revised form 15 March 2014 Accepted 23 March 2014 Available online 1 April 2014 Keywords: Cassava Postharvest deterioration Chemometrics Metabolomics abstract Cassava roots are an important source of dietary and industrial carbohydrates and suffer markedly from postharvest physiological deterioration (PPD). This paper deals with metabolomics combined with che- mometric tools for screening the chemical and enzymatic composition in several genotypes of cassava roots during PPD. Metabolome analyses showed increases in carotenoids, flavonoids, anthocyanins, phen- olics, reactive scavenging species, and enzymes (superoxide dismutase family, hydrogen peroxide, and catalase) until 3–5 days postharvest. PPD correlated negatively with phenolics and carotenoids and positively with anthocyanins and flavonoids. Chemometric tools such as principal component analysis, partial least squares discriminant analysis, and support vector machines discriminated well cassava samples and enabled a good prediction of samples. Hierarchical clustering analyses grouped samples according to their levels of PPD and chemical compositions. Ó 2014 Elsevier Ltd. All rights reserved. 1. Introduction Cassava (Manihot esculenta Crantz) is widely cultivated for its starchy storage roots, and is a staple food and animal feed in trop- ical and sub-tropical areas. It is also considered to be an important source of modified starches and bioethanol in China and other south-east Asian countries. Nevertheless, as a tropical root crop, cassava is categorised as a postharvest deterioration sensitive specie (An, Yang, & Zhang, 2012). It is a key subsistence crop, and its industrial uses are steadily growing. In spite of its economic and social relevance, relatively little investment has been made in research on cassava (Ceballos et al., 2012). Cassava roots deterioration is related to two separate processes: one being physiological (also termed primary deterioration) and the other microbiological (or secondary deterioration). Physiologi- cal deterioration is usually the initial cause of the loss of acceptability of roots and it is shown by blue–black streaks in the root vascular tissue, which later spread, causing a more general brown discoloration, unsatisfactory cooking qualities, and adverse taste. Primary deterioration also involves changes in oxidative enzyme activities, generating phenols including catechins and leucoanthocyanidins, which in later stages polymerise to form con- densed tannins. On the other hand, microbiological deterioration is due to pathogenic rots, fermentation and/or softening of the roots and generally occurs when the roots have already become unac- ceptable because of physiological deterioration (Garcia, Sánchez, Ceballos, & Alonso, 2013; Sánchez et al., 2013; Zidenga, 2011; Wheatley & Schwabe, 1985; Booth, 1975; Maini & Balagopal, 1978). Postharvest physiological deterioration (PPD) often begins rapidly within 24 h postharvest. Because of PPD, cassava roots need to be consumed shortly after harvesting. The short posthar- vest storage life of cassava is a characteristic that limits the mar- ketability of the roots (Chávez et al., 2005). Cortés et al. (2002) evaluated the inheritance of PPD in cassava with the aim to iden- tify and localise those regions of the cassava genome that control PPD. They concluded that the biochemical processes involved in http://dx.doi.org/10.1016/j.foodchem.2014.03.110 0308-8146/Ó 2014 Elsevier Ltd. All rights reserved. ⇑ Corresponding author. Tel.: +55 48 37215333; fax: +55 48 37215335. E-mail address: [email protected] (M. Maraschin). 1 Tel.: +55 48 3465 1933. 2 Tel.: +351 253 604435; fax: +351 253 604471. Food Chemistry 161 (2014) 67–78 Contents lists available at ScienceDirect Food Chemistry journal homepage: www.elsevier.com/locate/foodchem
Transcript of Metabolomics combined with chemometric tools (PCA, HCA ... · PDF filechemotaxonomy...
Food Chemistry 161 (2014) 67–78
Contents lists available at ScienceDirect
Food Chemistry
journal homepage: www.elsevier .com/locate / foodchem
Metabolomics combined with chemometric tools (PCA, HCA, PLS-DAand SVM) for screening cassava (Manihot esculenta Crantz) roots duringpostharvest physiological deterioration
http://dx.doi.org/10.1016/j.foodchem.2014.03.1100308-8146/� 2014 Elsevier Ltd. All rights reserved.
⇑ Corresponding author. Tel.: +55 48 37215333; fax: +55 48 37215335.E-mail address: [email protected] (M. Maraschin).
1 Tel.: +55 48 3465 1933.2 Tel.: +351 253 604435; fax: +351 253 604471.
Virgílio Gavicho Uarrota a,b, Rodolfo Moresco a, Bianca Coelho a, Eduardo da Costa Nunes d,1,Luiz Augusto Martins Peruch d,1, Enilto de Oliveira Neubert d,1, Miguel Rocha c,2, Marcelo Maraschin a,⇑a Plant Morphogenesis and Biochemistry Laboratory, Plant Science Center, Federal University of Santa Catarina, Florianópolis, SC, Brazilb Postgraduate Program in Plant Genetic Resources, Federal University of Santa Catarina, Rodovia Admar Gonzaga 1346, CEP 88.034-001 Florianópolis, SC, Brazilc Centre of Biological Engineering, University of Minho, Campus de Gualtar, 4710-057 Braga, Portugald Santa Catarina State Agricultural Research and Rural Extension Agency (EPAGRI), Experimental Station of Urussanga (EEUR), Rd. SC 446, Km 19 S/N,CEP 88840-000 Urussanga, Florianópolis, SC, Brazil
a r t i c l e i n f o
Article history:Received 13 December 2013Received in revised form 15 March 2014Accepted 23 March 2014Available online 1 April 2014
Keywords:CassavaPostharvest deteriorationChemometricsMetabolomics
a b s t r a c t
Cassava roots are an important source of dietary and industrial carbohydrates and suffer markedly frompostharvest physiological deterioration (PPD). This paper deals with metabolomics combined with che-mometric tools for screening the chemical and enzymatic composition in several genotypes of cassavaroots during PPD. Metabolome analyses showed increases in carotenoids, flavonoids, anthocyanins, phen-olics, reactive scavenging species, and enzymes (superoxide dismutase family, hydrogen peroxide, andcatalase) until 3–5 days postharvest. PPD correlated negatively with phenolics and carotenoids andpositively with anthocyanins and flavonoids. Chemometric tools such as principal component analysis,partial least squares discriminant analysis, and support vector machines discriminated well cassavasamples and enabled a good prediction of samples. Hierarchical clustering analyses grouped samplesaccording to their levels of PPD and chemical compositions.
� 2014 Elsevier Ltd. All rights reserved.
1. Introduction
Cassava (Manihot esculenta Crantz) is widely cultivated for itsstarchy storage roots, and is a staple food and animal feed in trop-ical and sub-tropical areas. It is also considered to be an importantsource of modified starches and bioethanol in China and othersouth-east Asian countries. Nevertheless, as a tropical root crop,cassava is categorised as a postharvest deterioration sensitivespecie (An, Yang, & Zhang, 2012). It is a key subsistence crop, andits industrial uses are steadily growing. In spite of its economicand social relevance, relatively little investment has been madein research on cassava (Ceballos et al., 2012).
Cassava roots deterioration is related to two separate processes:one being physiological (also termed primary deterioration) andthe other microbiological (or secondary deterioration). Physiologi-cal deterioration is usually the initial cause of the loss of
acceptability of roots and it is shown by blue–black streaks inthe root vascular tissue, which later spread, causing a more generalbrown discoloration, unsatisfactory cooking qualities, and adversetaste. Primary deterioration also involves changes in oxidativeenzyme activities, generating phenols including catechins andleucoanthocyanidins, which in later stages polymerise to form con-densed tannins. On the other hand, microbiological deterioration isdue to pathogenic rots, fermentation and/or softening of the rootsand generally occurs when the roots have already become unac-ceptable because of physiological deterioration (Garcia, Sánchez,Ceballos, & Alonso, 2013; Sánchez et al., 2013; Zidenga, 2011;Wheatley & Schwabe, 1985; Booth, 1975; Maini & Balagopal,1978).
Postharvest physiological deterioration (PPD) often beginsrapidly within 24 h postharvest. Because of PPD, cassava rootsneed to be consumed shortly after harvesting. The short posthar-vest storage life of cassava is a characteristic that limits the mar-ketability of the roots (Chávez et al., 2005). Cortés et al. (2002)evaluated the inheritance of PPD in cassava with the aim to iden-tify and localise those regions of the cassava genome that controlPPD. They concluded that the biochemical processes involved in
68 V.G. Uarrota et al. / Food Chemistry 161 (2014) 67–78
the rapid deterioration of cassava are essentially wound-healingresponses, which are well known in many plant species (Cortéset al., 2002).
Phytochemical analysis of compounds of low molecular weight(<500 Da) of roots, as well as those produced during deterioration,is a matter of interest, with few reports in the literature to improvethe understanding of the process of PPD. Metabolomic approachesenable the parallel assessment of the levels of a broad range ofmetabolites and have been documented to have great value in bothphenotyping and diagnostic analyses in plants (Fernie & Schauer,2008). These tools have recently been used in the evaluation ofthe natural variance apparent in metabolite composition (Fernie& Schauer, 2008). A combination of metabolomic techniques withchemometric tools provides a fast, easy and reliable method forchemotaxonomy characterisation (Schulz & Baranska, 2007).
Aiming to identify changes in the chemical and enzymatic com-position of four cassava genotype samples during postharvestdeterioration and possibly seeking related biochemical markers,metabolomics and chemometric tools, e.g., multivariate analysisusing algorithms implemented in the R language (R Core Team,2014), were used, as well as enzymatic assays related to theoxidative stress process. Supervised and unsupervised methodsof data analysis were used to discriminate cassava samples duringpost-harvest physiological deterioration (fresh samples – tzero, 3, 5,8, and 11 days postharvest).
2. Materials and methods
2.1. Selection of cassava cultivars and on-farm trials
Cassava cultivars were provided by Santa Catarina State Agricul-tural Research and Rural Extension Agency (EPAGRI), experimentalstation of Urussanga and produced over the growing season in2011/2012. Four cultivars were selected for this study: SCS 253Sangão (hereafter designed as SAN); Branco (hereafter designed asBRA); IAC576-70 – ‘‘Instituto Agronômico de Campinas’’, hereafterdesigned as (IAC), and Oriental (hereafter designed as ORI). Thesecultivars were selected as they are widely used by small farmers,with morpho-agronomical characteristics and are currently lackingresearch efforts that will allow better applicability. The farm trialswere conducted at the Ressacada Experimental Farm (Plant ScienceCenter, Federal University of Santa Catarina, Florianópolis, SC, Bra-zil-27� 3504800 S, 48� 320 5700 W), starting in September 2011. Theexperimental design was done in randomised blocks (DBCC), with4 blocks (6.3 � 15 m2/block) spaced at 1 m. Each block consistedof four plots (12 � 1.2 m2/plot), spaced at 0.5 m. Cassava cuttingswith 15 cm in length were used, which were planted upright, spaced1 � 1 m. Each plot was considered a treatment. For laboratory anal-ysis, each cultivar in each plot was mixed as a single sample. All cropmanagement was mechanised and cultivation was done manually.The soil fertility was analysed previously and according to theresults fertilisation was performed by applying calcium beforecultivation (see Supplementary Table 2 for soil analysis).
2.2. Postharvest physiological deterioration (PPD)
Samples of 12-month-old cassava roots were collected and thesame cultivars in each plot were mixed for the analysis of freshsamples, as well as for the induction of physiological deteriorationin the laboratory, under controlled conditions. Induction of PPDwas performed for 11 days. Immediately after harvest, the rootswere washed, proximal and distal parts of the root were removedand cross sections (0.5–1 cm) were made over the remaining rootand stored at room temperature (66–76% humidity, ±25 �C).Monitoring the development of PPD and associated metabolic
disturbances was performed daily after induction of PPD (seeSupplementary Fig. 1 for root images during PPD). Fresh samplesand those 3, 5, 8, and 11 days postharvest were collected, driedin an oven (35–40 �C), milled with a coffee grinder and stored(�18 �C) for further analysis. For the enzymatic analysis, freshsamples were collected and stored (�80 �C) until analysis.
2.3. Postharvest physiological deterioration scoring (PPD scoring)
Five independent evaluations of PPD were carried out underlaboratory conditions. A random sample of 3 sliced roots from eachplant variety was scored (from 1–10% to 10–100%) in each point ofthe PPD and imaged with a digital camera (Olympus FE-4020, 14megapixel). The mean PPD score for each root was calculated byaveraging the scores for the 3 transverse sections and five evalua-tions. Roots showing symptoms of microbial rotting (very differentfrom those related to PPD) or affected by insects were discarded.
2.4. Mid-infrared vibrational Fourier transform spectroscopy(ATR-FTIR)
Infrared spectroscopy allows the analysis of physiologicalchanges during postharvest physiological deterioration. Flour sam-ples of fresh roots and from those 3, 5, and 8 days postharvest werecollected for analysis. An IFS-55 (Model Opus v. 5.0; Bruker Bio-spin, Rheinstetten, Germany) spectrometer with a DTGS detectorequipped with a golden gate single reflection diamond attenuatedtotal reflectance (ATR) accessory (45� incidence angle) was used. Abackground spectrum of the clean crystal was acquired and sam-ples (100 mg) were spread and measured directly after they werepressed on the crystal. The spectra were recorded in transmittancemode over a spectral window from 4000 to 400 cm�1 at a resolu-tion of 4 cm�1. Five replicate spectra (128 co-added scans beforeFourier transform) were collected for each sample, in a total of80 spectra. In the data pre-processing stage (using R software),the spectra were normalised, baseline-corrected (see Supplemen-tary Fig. 3A and B) in the region of interest by drawing a straightline before resolution enhancement (k factor of 1.7) using Fourierself-deconvolution (Rubens, Snauwaert, Heremans, & Stute, 1999;Wilson & Belston, 1988). The assumed line shape was Lorentzianwith a half width of 19 cm�1 (Mathlouthi & Koenig, 1987 andrecently improved by Copiková et al. (2006)).
2.5. Extraction of phenolic compounds
The dried and powdered cassava material (1 g per batch) wasmixed with 10 mL of ethanol 80% and extracted using a water bathat 55 �C, for 30 min. The mixture was centrifuged (4000 rpm/5 min), filtered through Whatman No. 2 filter paper, ethanol wasremoved using rotatory evaporator at 65 �C and dried extractdiluted to 3 mL with ethanol (Engida et al., 2013).
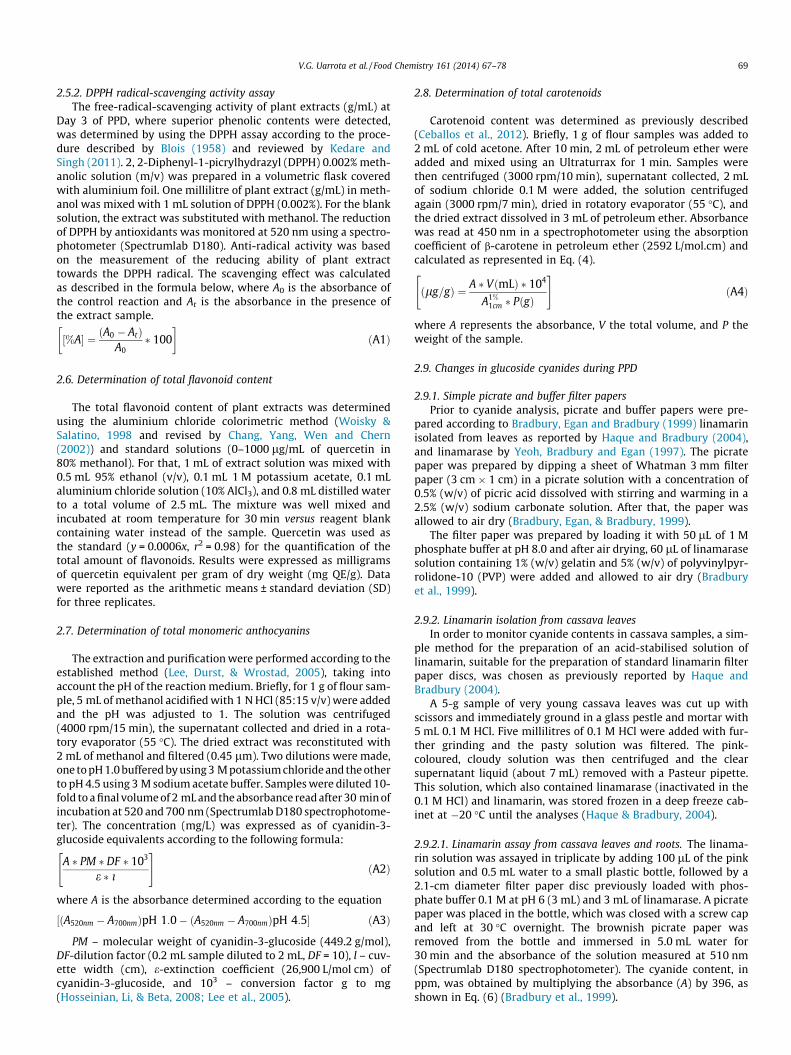
2.5.1. Determination of total phenolic contentThe total phenolic contents of the cassava extracts during PPD
were determined by the Folin–Ciocalteau reagent (FCR) method.For a total volume of 2.0 mL, 200 lL of extract were first mixedwith 100 lL of FCR reagent after adding 1.40 mL of distilled waterand the contents were kept at room temperature for 10 min. Later,300 lL of Na2CO3 aqueous solution (20%) were added and incu-bated for 1 h. The absorbance was measured at 765 nm using aUV-visible spectrophotometer (Spectrumlab D180). Total pheno-lics content was expressed as lg of gallic acid equivalents/g ofdry extract (lg GAE/g) using a standard curve (0–1000 lg/mL) ofgallic acid (Folin & Ciocalteu, 1927).
V.G. Uarrota et al. / Food Chemistry 161 (2014) 67–78 69
2.5.2. DPPH radical-scavenging activity assayThe free-radical-scavenging activity of plant extracts (g/mL) at
Day 3 of PPD, where superior phenolic contents were detected,was determined by using the DPPH assay according to the proce-dure described by Blois (1958) and reviewed by Kedare andSingh (2011). 2, 2-Diphenyl-1-picrylhydrazyl (DPPH) 0.002% meth-anolic solution (m/v) was prepared in a volumetric flask coveredwith aluminium foil. One millilitre of plant extract (g/mL) in meth-anol was mixed with 1 mL solution of DPPH (0.002%). For the blanksolution, the extract was substituted with methanol. The reductionof DPPH by antioxidants was monitored at 520 nm using a spectro-photometer (Spectrumlab D180). Anti-radical activity was basedon the measurement of the reducing ability of plant extracttowards the DPPH radical. The scavenging effect was calculatedas described in the formula below, where A0 is the absorbance ofthe control reaction and At is the absorbance in the presence ofthe extract sample.
½%A� ¼ ðA0 � AtÞA0
� 100� �
ðA1Þ
2.6. Determination of total flavonoid content
The total flavonoid content of plant extracts was determinedusing the aluminium chloride colorimetric method (Woisky &Salatino, 1998 and revised by Chang, Yang, Wen and Chern(2002)) and standard solutions (0–1000 lg/mL of quercetin in80% methanol). For that, 1 mL of extract solution was mixed with0.5 mL 95% ethanol (v/v), 0.1 mL 1 M potassium acetate, 0.1 mLaluminium chloride solution (10% AlCl3), and 0.8 mL distilled waterto a total volume of 2.5 mL. The mixture was well mixed andincubated at room temperature for 30 min versus reagent blankcontaining water instead of the sample. Quercetin was used asthe standard (y = 0.0006x, r2 = 0.98) for the quantification of thetotal amount of flavonoids. Results were expressed as milligramsof quercetin equivalent per gram of dry weight (mg QE/g). Datawere reported as the arithmetic means ± standard deviation (SD)for three replicates.
2.7. Determination of total monomeric anthocyanins
The extraction and purification were performed according to theestablished method (Lee, Durst, & Wrostad, 2005), taking intoaccount the pH of the reaction medium. Briefly, for 1 g of flour sam-ple, 5 mL of methanol acidified with 1 N HCl (85:15 v/v) were addedand the pH was adjusted to 1. The solution was centrifuged(4000 rpm/15 min), the supernatant collected and dried in a rota-tory evaporator (55 �C). The dried extract was reconstituted with2 mL of methanol and filtered (0.45 lm). Two dilutions were made,one to pH 1.0 buffered by using 3 M potassium chloride and the otherto pH 4.5 using 3 M sodium acetate buffer. Samples were diluted 10-fold to a final volume of 2 mL and the absorbance read after 30 min ofincubation at 520 and 700 nm (Spectrumlab D180 spectrophotome-ter). The concentration (mg/L) was expressed as of cyanidin-3-glucoside equivalents according to the following formula:
A � PM � DF � 103
e � i
" #ðA2Þ
where A is the absorbance determined according to the equation
½ðA520nm � A700nmÞpH 1:0� ðA520nm � A700nmÞpH 4:5� ðA3Þ
PM – molecular weight of cyanidin-3-glucoside (449.2 g/mol),DF-dilution factor (0.2 mL sample diluted to 2 mL, DF = 10), l – cuv-ette width (cm), e-extinction coefficient (26,900 L/mol cm) ofcyanidin-3-glucoside, and 103 – conversion factor g to mg(Hosseinian, Li, & Beta, 2008; Lee et al., 2005).
2.8. Determination of total carotenoids
Carotenoid content was determined as previously described(Ceballos et al., 2012). Briefly, 1 g of flour samples was added to2 mL of cold acetone. After 10 min, 2 mL of petroleum ether wereadded and mixed using an Ultraturrax for 1 min. Samples werethen centrifuged (3000 rpm/10 min), supernatant collected, 2 mLof sodium chloride 0.1 M were added, the solution centrifugedagain (3000 rpm/7 min), dried in rotatory evaporator (55 �C), andthe dried extract dissolved in 3 mL of petroleum ether. Absorbancewas read at 450 nm in a spectrophotometer using the absorptioncoefficient of b-carotene in petroleum ether (2592 L/mol.cm) andcalculated as represented in Eq. (4).
ðlg=gÞ ¼ A � VðmLÞ � 104
A1%1cm � PðgÞ
" #ðA4Þ
where A represents the absorbance, V the total volume, and P theweight of the sample.
2.9. Changes in glucoside cyanides during PPD
2.9.1. Simple picrate and buffer filter papersPrior to cyanide analysis, picrate and buffer papers were pre-
pared according to Bradbury, Egan and Bradbury (1999) linamarinisolated from leaves as reported by Haque and Bradbury (2004),and linamarase by Yeoh, Bradbury and Egan (1997). The picratepaper was prepared by dipping a sheet of Whatman 3 mm filterpaper (3 cm � 1 cm) in a picrate solution with a concentration of0.5% (w/v) of picric acid dissolved with stirring and warming in a2.5% (w/v) sodium carbonate solution. After that, the paper wasallowed to air dry (Bradbury, Egan, & Bradbury, 1999).
The filter paper was prepared by loading it with 50 lL of 1 Mphosphate buffer at pH 8.0 and after air drying, 60 lL of linamarasesolution containing 1% (w/v) gelatin and 5% (w/v) of polyvinylpyr-rolidone-10 (PVP) were added and allowed to air dry (Bradburyet al., 1999).
2.9.2. Linamarin isolation from cassava leavesIn order to monitor cyanide contents in cassava samples, a sim-
ple method for the preparation of an acid-stabilised solution oflinamarin, suitable for the preparation of standard linamarin filterpaper discs, was chosen as previously reported by Haque andBradbury (2004).
A 5-g sample of very young cassava leaves was cut up withscissors and immediately ground in a glass pestle and mortar with5 mL 0.1 M HCl. Five millilitres of 0.1 M HCl were added with fur-ther grinding and the pasty solution was filtered. The pink-coloured, cloudy solution was then centrifuged and the clearsupernatant liquid (about 7 mL) removed with a Pasteur pipette.This solution, which also contained linamarase (inactivated in the0.1 M HCl) and linamarin, was stored frozen in a deep freeze cab-inet at �20 �C until the analyses (Haque & Bradbury, 2004).
2.9.2.1. Linamarin assay from cassava leaves and roots. The linama-rin solution was assayed in triplicate by adding 100 lL of the pinksolution and 0.5 mL water to a small plastic bottle, followed by a2.1-cm diameter filter paper disc previously loaded with phos-phate buffer 0.1 M at pH 6 (3 mL) and 3 mL of linamarase. A picratepaper was placed in the bottle, which was closed with a screw capand left at 30 �C overnight. The brownish picrate paper wasremoved from the bottle and immersed in 5.0 mL water for30 min and the absorbance of the solution measured at 510 nm(Spectrumlab D180 spectrophotometer). The cyanide content, inppm, was obtained by multiplying the absorbance (A) by 396, asshown in Eq. (6) (Bradbury et al., 1999).

70 V.G. Uarrota et al. / Food Chemistry 161 (2014) 67–78
½ppm ¼ A � 396� ðA5Þ
where 396 is the gradient factor observed in the normal picratemethod. Linamarin content (ppm) from cassava roots was deter-mined as the difference accordingly to Eq. (6) (Bradbury, 2009).Tcy represents total cyanide and AcCN is acetone cyanohydrin.
mgHCNKg
¼ ðTcy� AcCNÞ� �
ðA6Þ
2.9.3. Linamarase isolation from cassava leavesBecause the cost of commercial linamarase is prohibitive, an
acid hydrolysis method was adopted. Linamarase was isolated witha simple and rapid method developed by Yeoh et al. (1997). Briefly,about 2 g of fresh, fully expanded young leaves were homogenisedin a mortar with 10 mL 100 mM Na-citrate buffer at pH 6.0 contain-ing 10 g/L of PVP, followed by the addition of 12 mL of 2 M(NH4)2SO4. The homogenate was allowed to stand for 30 min atroom temperature and then filtered with Whatman No.1 filterpaper.
2.9.3.1. Linamarase assay. The linamarase assay was carried outby using 1.5 mL of the homogenate previously prepared(Section 2.9.3), 0.5 mL of 5 mM linamarin in 50 mM of Na-citrate,pH 6.0 at 37 �C (Yeoh et al., 1997). After 15 min, the reaction wasstopped by boiling the reaction mixture for 2 min and the glucosereleased was measured by the glucose oxidase method using theglucose-oxidase kit (Glucose-PAP, LAB TEST diagonostica). Briefly,3 mL reagent were added to 0.3 mL of the sample, followed bymixing and incubation at 37 �C for 15 min and absorbance read at520 nm (Spectrumlab D180 spectrophotometer). The glucosereleased in (mg/dL) was quantified accordingly (Eq. (7)) andconverted to mmol/L.
Glucosemmol
L
� �¼ Asample
Astandard� 100
18
� �ðA7Þ
where A is the absorbance.
2.9.4. Total cyanide and acetone cyanohydrin in cassava roots duringPPD
To determine total cyanide, the method reported by Bradbury(2009) was used with some modifications. Briefly, 1 g flour sam-ples during PPD were weighed out into plastic bottles; 10 mL1 M phosphate buffer pH 7.0 and buffer paper were added. A pic-rate paper was also added; the bottle was closed with a lid andwas left for 16 h at 30 �C. The picrate paper was removed, elutedwith 0.5 mL of water, incubated for 30 min, and absorbancemeasured at 510 nm against a blank in a spectrophotometer andconverted to ppm using Eq. (5). Acetone cyanohydrin wasdetermined on the same flour samples as described for totalcyanide, but by adding also 0.5 mL of 0.1 M HCl. Calculations wereperformed using the Eq. (A8), where A is the observed absorbanceand 45.7 is the gradient factor.
½ppm ¼ A � 45:7� ðA8Þ
2.10. Enzyme activities during PPD
2.10.1. Catalase activity (CAT)For the measurement of enzyme activity, flour samples (1 g) from
different days of PPD (0, 3, 5, 8, and 11) were homogenised in 5 mL of10 mM potassium phosphate buffer (pH 7.0) containing 4% (w/v)PVP (Mr 25 000). The homogenate was centrifuged (4000 rpm/30 min) and the supernatant used as enzyme extract (An et al.,2012). CAT activity was measured directly by the decomposition ofH2O2 at 240 nm in a spectrophotometer (y = 2.1247x, r2 = 0.97) and
expressed in units (U) per milligram (U mg�1, 1U = 1 mM of H202
reduced per minutes �milligrams of protein) (Aebi, 1983). The reac-tion mixture contained 1 mL of 50 mM potassium phosphate buffer(pH 7.0), 1 mL of 10 mM H2O2, and 1 mL of the extract. Protein wasmeasured following the procedure described by Bradford (1976).
2.10.2. Determination of hydrogen peroxide (H2O2) contentHydrogen peroxide was determined according to Velikova,
Yordanov and Edreva (2000). A 1-g flour sample was homogenisedin an ice bath with 5 mL of 0.1% (w/v) trichloroacetic acid (TCA).The homogenate was centrifuged (4000 rpm for 5 min), thesupernatant collected (1 mL) and added to 50 mM of 1 mL potas-sium phosphate buffer (pH 7.0) and 2 mL of 1 M KI. The reactionmixture was read at 390 nm in a spectrophotometer and the con-tent of hydrogen peroxide calculated through a standard curve(y = 2.1247x, r2 = 0.97).
2.10.3. Total superoxide dismutase, copper/zinc (Cu/ZnSOD) andmanganese superoxide dismutase (MnSOD) (SOD family of enzymes)activities during PPD in cassava roots
The analysis of the SOD family of enzymes was carried outaccording to Fridovich (1995). Briefly, 1 g flour sample was homog-enised with 10 mL of 50 mM potassium phosphate buffer (pH 7.0),centrifuged (4000 rpm/30 min) and the supernatant containing thecrude enzyme extract for assay was recovered. For the total ofsuperoxide dismutase enzyme (Total SOD), 1 mL of 0.05 M sodiumcarbonate buffer (pH 10.2) was added to 1 mL of enzyme extractand 0.5 mL of 0.4 �mM epinephrine. The rate of epinephrineauto-oxidation was observed by monitoring spectrophotometri-cally the absorbance in samples at the starting point of the reactionand 2.5 min later. SOD was expressed in units per dry weight basis(U/g of dry weight – Eq. (A9)), where 1 U g�1 of SOD is the amountof enzyme required for 50% inhibition of the oxidation per minuteof epinephrine to adenochrome at 480 nm.
The MnSOD was assayed using the same method as above,except with the addition of sodium cyanide (NaCN), an inorganiccompound with high affinity for metals to inhibit Cu/ZnSOD activ-ity. The enzyme activity of Cu/ZnSOD was then determined as thedifference between total SOD and MnSOD.
ðU=gÞ ¼ ð%inhibitionÞy
� 150� 1000
� �ðA9Þ
where y is mg of tissue per mL of reaction medium.
2.11. Exploratory data analysis using chemometric tools
The spectral profiles of ATR-FTIR and other metabolic profilingdata were processed using multivariate statistical techniques. Forsuch analyzes, classification, clustering, and regression methodswere used, namely principal component analysis (PCA), partial leastsquares discriminant analysis (PLS-DA), hierarchical clusteringanalysis (HA), and support vector machines (SVM). Chemometricanalyses were implemented in the R (R Core Team, 2014) language(version 3.0.1), using the packages ChemoSpec, Chemometrics,mixOmics, e1071, and pls. All statistical analyses were performedusing the same software and data were represented as mean ±standard deviation of three repetitions (n = 3). One-way ANOVAand Tukey HSD tests were applied to the data set when adequate.
3. Results and discussion
3.1. PPD scoring, secondary metabolites in cassava roots, and DPPHradical scavenging activity
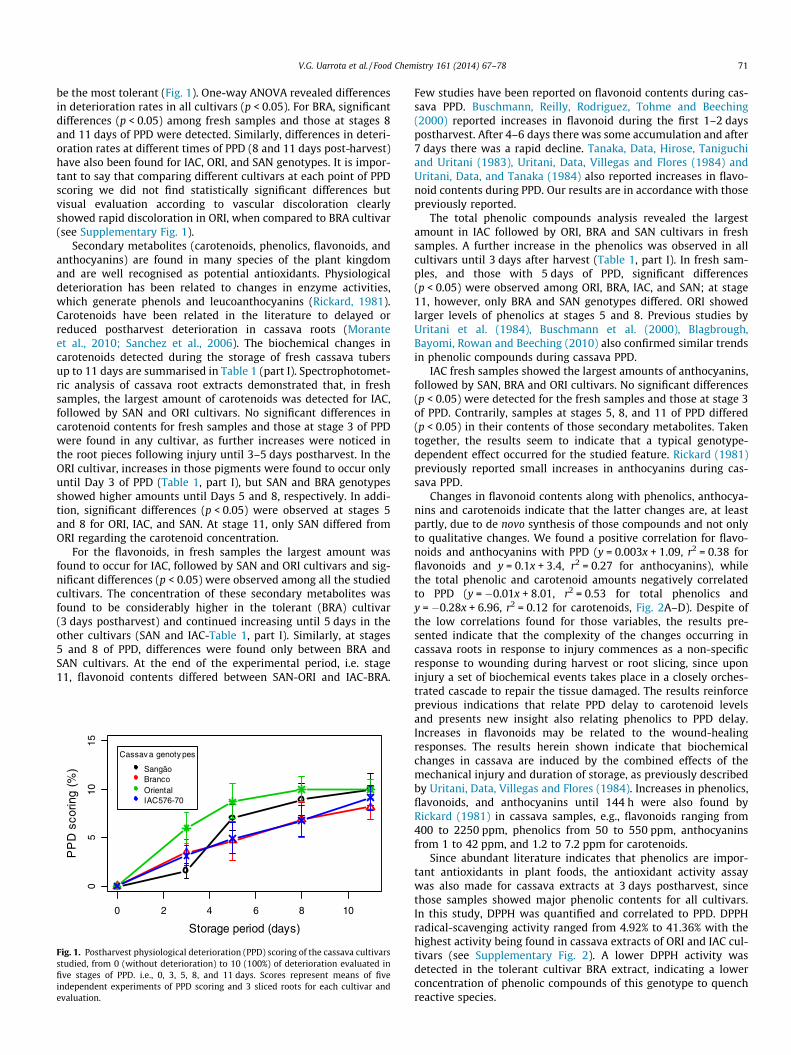
Results of PPD scoring of the four genotypes studied revealedthe cultivar ORI as the most susceptible, while BRA was found to
V.G. Uarrota et al. / Food Chemistry 161 (2014) 67–78 71
be the most tolerant (Fig. 1). One-way ANOVA revealed differencesin deterioration rates in all cultivars (p < 0.05). For BRA, significantdifferences (p < 0.05) among fresh samples and those at stages 8and 11 days of PPD were detected. Similarly, differences in deteri-oration rates at different times of PPD (8 and 11 days post-harvest)have also been found for IAC, ORI, and SAN genotypes. It is impor-tant to say that comparing different cultivars at each point of PPDscoring we did not find statistically significant differences butvisual evaluation according to vascular discoloration clearlyshowed rapid discoloration in ORI, when compared to BRA cultivar(see Supplementary Fig. 1).
Secondary metabolites (carotenoids, phenolics, flavonoids, andanthocyanins) are found in many species of the plant kingdomand are well recognised as potential antioxidants. Physiologicaldeterioration has been related to changes in enzyme activities,which generate phenols and leucoanthocyanins (Rickard, 1981).Carotenoids have been related in the literature to delayed orreduced postharvest deterioration in cassava roots (Moranteet al., 2010; Sanchez et al., 2006). The biochemical changes incarotenoids detected during the storage of fresh cassava tubersup to 11 days are summarised in Table 1 (part I). Spectrophotomet-ric analysis of cassava root extracts demonstrated that, in freshsamples, the largest amount of carotenoids was detected for IAC,followed by SAN and ORI cultivars. No significant differences incarotenoid contents for fresh samples and those at stage 3 of PPDwere found in any cultivar, as further increases were noticed inthe root pieces following injury until 3–5 days postharvest. In theORI cultivar, increases in those pigments were found to occur onlyuntil Day 3 of PPD (Table 1, part I), but SAN and BRA genotypesshowed higher amounts until Days 5 and 8, respectively. In addi-tion, significant differences (p < 0.05) were observed at stages 5and 8 for ORI, IAC, and SAN. At stage 11, only SAN differed fromORI regarding the carotenoid concentration.
For the flavonoids, in fresh samples the largest amount wasfound to occur for IAC, followed by SAN and ORI cultivars and sig-nificant differences (p < 0.05) were observed among all the studiedcultivars. The concentration of these secondary metabolites wasfound to be considerably higher in the tolerant (BRA) cultivar(3 days postharvest) and continued increasing until 5 days in theother cultivars (SAN and IAC-Table 1, part I). Similarly, at stages5 and 8 of PPD, differences were found only between BRA andSAN cultivars. At the end of the experimental period, i.e. stage11, flavonoid contents differed between SAN-ORI and IAC-BRA.
0 2 4 6 8 10
05
1015
Storage period (days)
PP
D s
corin
g (%
)
Cassav a genoty pes
SangãoBrancoOrientalIAC576-70
Fig. 1. Postharvest physiological deterioration (PPD) scoring of the cassava cultivarsstudied, from 0 (without deterioration) to 10 (100%) of deterioration evaluated infive stages of PPD. i.e., 0, 3, 5, 8, and 11 days. Scores represent means of fiveindependent experiments of PPD scoring and 3 sliced roots for each cultivar andevaluation.
Few studies have been reported on flavonoid contents during cas-sava PPD. Buschmann, Reilly, Rodriguez, Tohme and Beeching(2000) reported increases in flavonoid during the first 1–2 dayspostharvest. After 4–6 days there was some accumulation and after7 days there was a rapid decline. Tanaka, Data, Hirose, Taniguchiand Uritani (1983), Uritani, Data, Villegas and Flores (1984) andUritani, Data, and Tanaka (1984) also reported increases in flavo-noid contents during PPD. Our results are in accordance with thosepreviously reported.
The total phenolic compounds analysis revealed the largestamount in IAC followed by ORI, BRA and SAN cultivars in freshsamples. A further increase in the phenolics was observed in allcultivars until 3 days after harvest (Table 1, part I). In fresh sam-ples, and those with 5 days of PPD, significant differences(p < 0.05) were observed among ORI, BRA, IAC, and SAN; at stage11, however, only BRA and SAN genotypes differed. ORI showedlarger levels of phenolics at stages 5 and 8. Previous studies byUritani et al. (1984), Buschmann et al. (2000), Blagbrough,Bayomi, Rowan and Beeching (2010) also confirmed similar trendsin phenolic compounds during cassava PPD.
IAC fresh samples showed the largest amounts of anthocyanins,followed by SAN, BRA and ORI cultivars. No significant differences(p < 0.05) were detected for the fresh samples and those at stage 3of PPD. Contrarily, samples at stages 5, 8, and 11 of PPD differed(p < 0.05) in their contents of those secondary metabolites. Takentogether, the results seem to indicate that a typical genotype-dependent effect occurred for the studied feature. Rickard (1981)previously reported small increases in anthocyanins during cas-sava PPD.
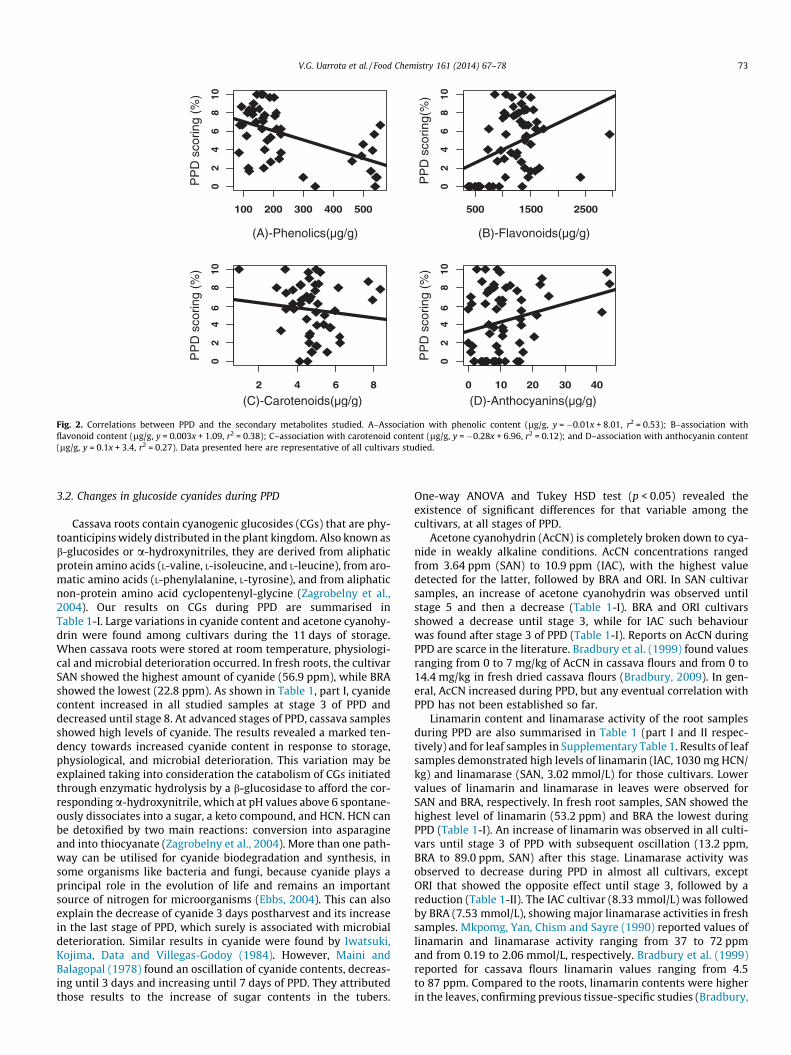
Changes in flavonoid contents along with phenolics, anthocya-nins and carotenoids indicate that the latter changes are, at leastpartly, due to de novo synthesis of those compounds and not onlyto qualitative changes. We found a positive correlation for flavo-noids and anthocyanins with PPD (y = 0.003x + 1.09, r2 = 0.38 forflavonoids and y = 0.1x + 3.4, r2 = 0.27 for anthocyanins), whilethe total phenolic and carotenoid amounts negatively correlatedto PPD (y = �0.01x + 8.01, r2 = 0.53 for total phenolics andy = �0.28x + 6.96, r2 = 0.12 for carotenoids, Fig. 2A–D). Despite ofthe low correlations found for those variables, the results pre-sented indicate that the complexity of the changes occurring incassava roots in response to injury commences as a non-specificresponse to wounding during harvest or root slicing, since uponinjury a set of biochemical events takes place in a closely orches-trated cascade to repair the tissue damaged. The results reinforceprevious indications that relate PPD delay to carotenoid levelsand presents new insight also relating phenolics to PPD delay.Increases in flavonoids may be related to the wound-healingresponses. The results herein shown indicate that biochemicalchanges in cassava are induced by the combined effects of themechanical injury and duration of storage, as previously describedby Uritani, Data, Villegas and Flores (1984). Increases in phenolics,flavonoids, and anthocyanins until 144 h were also found byRickard (1981) in cassava samples, e.g., flavonoids ranging from400 to 2250 ppm, phenolics from 50 to 550 ppm, anthocyaninsfrom 1 to 42 ppm, and 1.2 to 7.2 ppm for carotenoids.
Since abundant literature indicates that phenolics are impor-tant antioxidants in plant foods, the antioxidant activity assaywas also made for cassava extracts at 3 days postharvest, sincethose samples showed major phenolic contents for all cultivars.In this study, DPPH was quantified and correlated to PPD. DPPHradical-scavenging activity ranged from 4.92% to 41.36% with thehighest activity being found in cassava extracts of ORI and IAC cul-tivars (see Supplementary Fig. 2). A lower DPPH activity wasdetected in the tolerant cultivar BRA extract, indicating a lowerconcentration of phenolic compounds of this genotype to quenchreactive species.
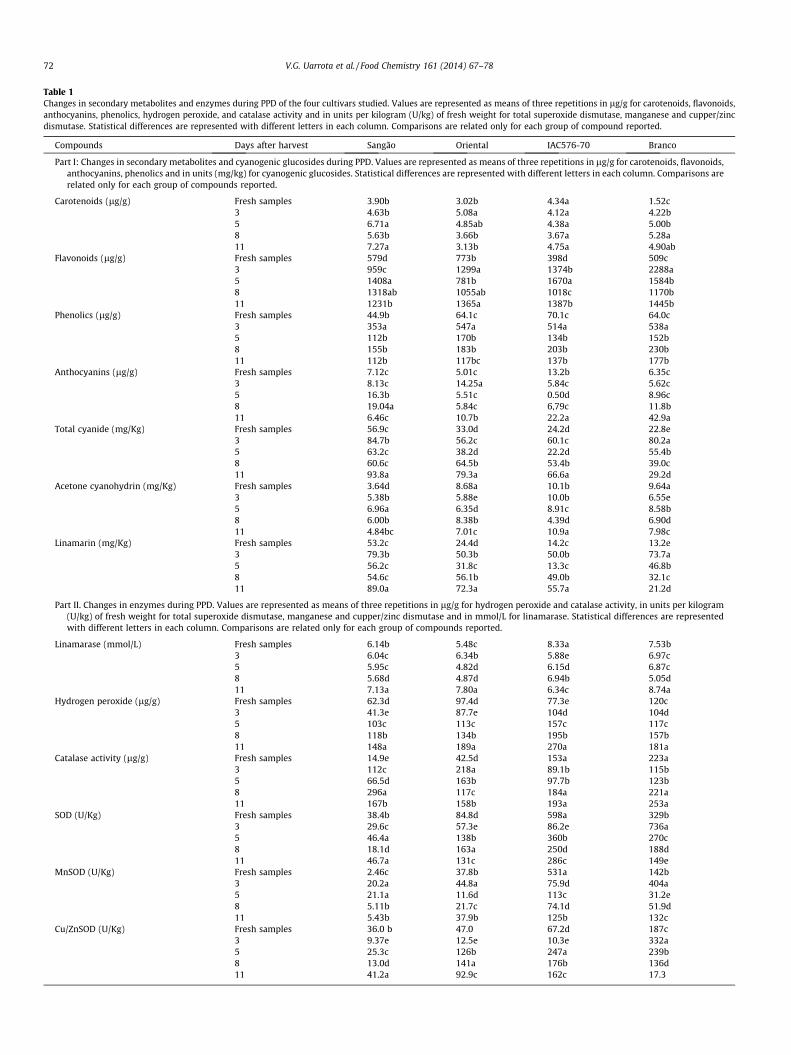
Table 1Changes in secondary metabolites and enzymes during PPD of the four cultivars studied. Values are represented as means of three repetitions in lg/g for carotenoids, flavonoids,anthocyanins, phenolics, hydrogen peroxide, and catalase activity and in units per kilogram (U/kg) of fresh weight for total superoxide dismutase, manganese and cupper/zincdismutase. Statistical differences are represented with different letters in each column. Comparisons are related only for each group of compound reported.
Compounds Days after harvest Sangão Oriental IAC576-70 Branco
Part I: Changes in secondary metabolites and cyanogenic glucosides during PPD. Values are represented as means of three repetitions in lg/g for carotenoids, flavonoids,anthocyanins, phenolics and in units (mg/kg) for cyanogenic glucosides. Statistical differences are represented with different letters in each column. Comparisons arerelated only for each group of compounds reported.
Carotenoids (lg/g) Fresh samples 3.90b 3.02b 4.34a 1.52c3 4.63b 5.08a 4.12a 4.22b5 6.71a 4.85ab 4.38a 5.00b8 5.63b 3.66b 3.67a 5.28a11 7.27a 3.13b 4.75a 4.90ab
Flavonoids (lg/g) Fresh samples 579d 773b 398d 509c3 959c 1299a 1374b 2288a5 1408a 781b 1670a 1584b8 1318ab 1055ab 1018c 1170b11 1231b 1365a 1387b 1445b
Phenolics (lg/g) Fresh samples 44.9b 64.1c 70.1c 64.0c3 353a 547a 514a 538a5 112b 170b 134b 152b8 155b 183b 203b 230b11 112b 117bc 137b 177b
Anthocyanins (lg/g) Fresh samples 7.12c 5.01c 13.2b 6.35c3 8.13c 14.25a 5.84c 5.62c5 16.3b 5.51c 0.50d 8.96c8 19.04a 5.84c 6,79c 11.8b11 6.46c 10.7b 22.2a 42.9a
Total cyanide (mg/Kg) Fresh samples 56.9c 33.0d 24.2d 22.8e3 84.7b 56.2c 60.1c 80.2a5 63.2c 38.2d 22.2d 55.4b8 60.6c 64.5b 53.4b 39.0c11 93.8a 79.3a 66.6a 29.2d
Acetone cyanohydrin (mg/Kg) Fresh samples 3.64d 8.68a 10.1b 9.64a3 5.38b 5.88e 10.0b 6.55e5 6.96a 6.35d 8.91c 8.58b8 6.00b 8.38b 4.39d 6.90d11 4.84bc 7.01c 10.9a 7.98c
Linamarin (mg/Kg) Fresh samples 53.2c 24.4d 14.2c 13.2e3 79.3b 50.3b 50.0b 73.7a5 56.2c 31.8c 13.3c 46.8b8 54.6c 56.1b 49.0b 32.1c11 89.0a 72.3a 55.7a 21.2d
Part II. Changes in enzymes during PPD. Values are represented as means of three repetitions in lg/g for hydrogen peroxide and catalase activity, in units per kilogram(U/kg) of fresh weight for total superoxide dismutase, manganese and cupper/zinc dismutase and in mmol/L for linamarase. Statistical differences are representedwith different letters in each column. Comparisons are related only for each group of compounds reported.
Linamarase (mmol/L) Fresh samples 6.14b 5.48c 8.33a 7.53b3 6.04c 6.34b 5.88e 6.97c5 5.95c 4.82d 6.15d 6.87c8 5.68d 4.87d 6.94b 5.05d11 7.13a 7.80a 6.34c 8.74a
Hydrogen peroxide (lg/g) Fresh samples 62.3d 97.4d 77.3e 120c3 41.3e 87.7e 104d 104d5 103c 113c 157c 117c8 118b 134b 195b 157b11 148a 189a 270a 181a
Catalase activity (lg/g) Fresh samples 14.9e 42.5d 153a 223a3 112c 218a 89.1b 115b5 66.5d 163b 97.7b 123b8 296a 117c 184a 221a11 167b 158b 193a 253a
SOD (U/Kg) Fresh samples 38.4b 84.8d 598a 329b3 29.6c 57.3e 86.2e 736a5 46.4a 138b 360b 270c8 18.1d 163a 250d 188d11 46.7a 131c 286c 149e
MnSOD (U/Kg) Fresh samples 2.46c 37.8b 531a 142b3 20.2a 44.8a 75.9d 404a5 21.1a 11.6d 113c 31.2e8 5.11b 21.7c 74.1d 51.9d11 5.43b 37.9b 125b 132c
Cu/ZnSOD (U/Kg) Fresh samples 36.0 b 47.0 67.2d 187c3 9.37e 12.5e 10.3e 332a5 25.3c 126b 247a 239b8 13.0d 141a 176b 136d11 41.2a 92.9c 162c 17.3
72 V.G. Uarrota et al. / Food Chemistry 161 (2014) 67–78
100 200 300 400 500
(A)-Phenolics(µg/g)
PP
D s
corin
g (%
)500 1500 2500
(B)-Flavonoids(µg/g)
PP
D s
corin
g(%
)
2 4 6 8
(C)-Carotenoids(µg/g)
PP
D s
corin
g (%
)
0 10 20 30 40
02
46
810
02
46
810
02
46
810
02
46
810
(D)-Anthocyanins(µg/g)
PP
D s
corin
g (%
)Fig. 2. Correlations between PPD and the secondary metabolites studied. A–Association with phenolic content (lg/g, y = �0.01x + 8.01, r2 = 0.53); B–association withflavonoid content (lg/g, y = 0.003x + 1.09, r2 = 0.38); C–association with carotenoid content (lg/g, y = �0.28x + 6.96, r2 = 0.12); and D–association with anthocyanin content(lg/g, y = 0.1x + 3.4, r2 = 0.27). Data presented here are representative of all cultivars studied.
V.G. Uarrota et al. / Food Chemistry 161 (2014) 67–78 73
3.2. Changes in glucoside cyanides during PPD
Cassava roots contain cyanogenic glucosides (CGs) that are phy-toanticipins widely distributed in the plant kingdom. Also known asb-glucosides or a-hydroxynitriles, they are derived from aliphaticprotein amino acids (L-valine, L-isoleucine, and L-leucine), from aro-matic amino acids (L-phenylalanine, L-tyrosine), and from aliphaticnon-protein amino acid cyclopentenyl-glycine (Zagrobelny et al.,2004). Our results on CGs during PPD are summarised inTable 1-I. Large variations in cyanide content and acetone cyanohy-drin were found among cultivars during the 11 days of storage.When cassava roots were stored at room temperature, physiologi-cal and microbial deterioration occurred. In fresh roots, the cultivarSAN showed the highest amount of cyanide (56.9 ppm), while BRAshowed the lowest (22.8 ppm). As shown in Table 1, part I, cyanidecontent increased in all studied samples at stage 3 of PPD anddecreased until stage 8. At advanced stages of PPD, cassava samplesshowed high levels of cyanide. The results revealed a marked ten-dency towards increased cyanide content in response to storage,physiological, and microbial deterioration. This variation may beexplained taking into consideration the catabolism of CGs initiatedthrough enzymatic hydrolysis by a b-glucosidase to afford the cor-responding a-hydroxynitrile, which at pH values above 6 spontane-ously dissociates into a sugar, a keto compound, and HCN. HCN canbe detoxified by two main reactions: conversion into asparagineand into thiocyanate (Zagrobelny et al., 2004). More than one path-way can be utilised for cyanide biodegradation and synthesis, insome organisms like bacteria and fungi, because cyanide plays aprincipal role in the evolution of life and remains an importantsource of nitrogen for microorganisms (Ebbs, 2004). This can alsoexplain the decrease of cyanide 3 days postharvest and its increasein the last stage of PPD, which surely is associated with microbialdeterioration. Similar results in cyanide were found by Iwatsuki,Kojima, Data and Villegas-Godoy (1984). However, Maini andBalagopal (1978) found an oscillation of cyanide contents, decreas-ing until 3 days and increasing until 7 days of PPD. They attributedthose results to the increase of sugar contents in the tubers.
One-way ANOVA and Tukey HSD test (p < 0.05) revealed theexistence of significant differences for that variable among thecultivars, at all stages of PPD.
Acetone cyanohydrin (AcCN) is completely broken down to cya-nide in weakly alkaline conditions. AcCN concentrations rangedfrom 3.64 ppm (SAN) to 10.9 ppm (IAC), with the highest valuedetected for the latter, followed by BRA and ORI. In SAN cultivarsamples, an increase of acetone cyanohydrin was observed untilstage 5 and then a decrease (Table 1-I). BRA and ORI cultivarsshowed a decrease until stage 3, while for IAC such behaviourwas found after stage 3 of PPD (Table 1-I). Reports on AcCN duringPPD are scarce in the literature. Bradbury et al. (1999) found valuesranging from 0 to 7 mg/kg of AcCN in cassava flours and from 0 to14.4 mg/kg in fresh dried cassava flours (Bradbury, 2009). In gen-eral, AcCN increased during PPD, but any eventual correlation withPPD has not been established so far.
Linamarin content and linamarase activity of the root samplesduring PPD are also summarised in Table 1 (part I and II respec-tively) and for leaf samples in Supplementary Table 1. Results of leafsamples demonstrated high levels of linamarin (IAC, 1030 mg HCN/kg) and linamarase (SAN, 3.02 mmol/L) for those cultivars. Lowervalues of linamarin and linamarase in leaves were observed forSAN and BRA, respectively. In fresh root samples, SAN showed thehighest level of linamarin (53.2 ppm) and BRA the lowest duringPPD (Table 1-I). An increase of linamarin was observed in all culti-vars until stage 3 of PPD with subsequent oscillation (13.2 ppm,BRA to 89.0 ppm, SAN) after this stage. Linamarase activity wasobserved to decrease during PPD in almost all cultivars, exceptORI that showed the opposite effect until stage 3, followed by areduction (Table 1-II). The IAC cultivar (8.33 mmol/L) was followedby BRA (7.53 mmol/L), showing major linamarase activities in freshsamples. Mkpomg, Yan, Chism and Sayre (1990) reported values oflinamarin and linamarase activity ranging from 37 to 72 ppmand from 0.19 to 2.06 mmol/L, respectively. Bradbury et al. (1999)reported for cassava flours linamarin values ranging from 4.5to 87 ppm. Compared to the roots, linamarin contents were higherin the leaves, confirming previous tissue-specific studies (Bradbury,
74 V.G. Uarrota et al. / Food Chemistry 161 (2014) 67–78
2009; Bradbury et al., 1999) on cyanogenic glucosides of M. escu-lenta. Taken together, these results suggest that tissue and varietaldifferences play a role in the catabolism of linamarin and linamar-ase activity.
3.3. Enzyme and reactive oxygen specie activities during PPD
As previously reported, stress conditions may lead to the accu-mulation of many reactive oxygen species (ROS), such as hydrogenperoxide, and to the activation or downregulation of many kinds ofenzymes (An et al., 2012). PPD has been explained as a physiolog-ical process due not to microorganisms, but having a molecularbasis as an oxidative burst which commences 15 min after rootsbeing injured (Reilly, Gomes-Vásquez, Buschmann, Tohme, &Beeching, 2003), followed by altered gene expression. The latterphenomenon is expected to play a role in cellular processes(Reilly et al., 2007) and on the accumulation of secondary metabo-lites (Buschmann, Rodriguez, Tohme, & Beeching, 2000). Therefore,it would be important to increase our understanding of thephysiological and biochemical traits associated with PPD,especially during the early stages.
Hydrogen peroxide (H2O2) is moderately reactive, has a rela-tively long half-life and high permeability across membranes. Ithas been well established that excess of H2O2 in plant cells leadsto oxidative stress. H2O2 inactivates enzymes by oxidising theirthiol groups (Gill & Tuteja, 2010). In our study, during PPD,increases in hydrogen peroxide amounts were detected in all culti-vars, ranging from 41.3 ppm (SAN) to 270 ppm (IAC). High levels ofhydrogen peroxide were observed at the last stage of PPD (11 dayspostharvest), where physiological and microbiological deteriora-tion were noticed as well (Table 1, part II). Statistical analysesshowed significant differences among cultivars at different stagesof PPD (p < 0.05). A high positive correlation (r2 = 0.87) was foundbetween PPD and hydrogen peroxide content in all studied culti-vars. These results are consistent with the literature, indicatingthat oxidative stress may exert a toxic effect on cassava roots toadapt or tolerate under PPD conditions.
Plants, as well as other organisms, have evolved antioxidantsystems to protect themselves against toxic species of oxygen.ROS scavenging enzymes, including catalase (CAT), superoxide dis-mutase (SOD) – including manganese SOD (MnSOD) and copper/zinc SOD (Cu/ZnSOD) – have been demonstrated to play key rolesin the removal of ROS. In the present study, a slight decrease of CATactivity was found until stage 3 and then an accelerated increasewas observed until the last stage of PPD in IAC and BRA cultivars(Table 1-II). ORI, the most susceptible cultivar to PPD, showed anincrease of CAT in the early stages and then a decrease. Theincrease of CAT in SAN cultivar was observed until 3 days posthar-vest, oscillating in the next stages of PPD. CAT ranged from 14.9(SAN) to 296 (SAN) mM of H2O2/min.g (Table 1-II). Interestingly,the most tolerant cultivar (BRA) to PPD showed a high level ofCAT in fresh samples. Similar results on peroxide hydrogen andCAT were also found by An et al. (2012) in cassava subjected to coldstress. Barceló (1998) showed increases in hydrogen peroxideunder chemical stress. Gill and Tuteja (2010) related the increasesin hydrogen peroxide concentration to the augmentation of CATactivity and other scavenging enzymes, corroborating the findingsherein described.
The metalloenzyme superoxide dismutase (SOD) is the mosteffective intracellular enzymatic antioxidant, being ubiquitous inall aerobic organisms and in all subcellular compartments proneto ROS-mediated oxidative stress. SOD has been proposed to beimportant in plant stress tolerance and provides the first line ofdefence against the toxic effects of elevated ROS (Gill & Tuteja,2010; Mittler, 2002). Results on ROS scavenging enzymes are sum-marised in Table 1-II. SOD values ranged from 18.1 (SAN) to 735
U/kg of dry weight (BRA). Total SOD activity increased in the toler-ant cultivar BRA until stage 3 followed by a decrease. In compari-son, SAN, ORI, and IAC showed a decrease of SOD until stage 3followed by an increase of SOD in the next stages of PPD. ORIand SAN (i.e., cultivars with major PPD) showed lower SOD activi-ties in all stages of PPD.
MnSOD activity was reduced in the BRA cultivar only in stage 3followed by an increase until the last stage. The ORI cultivar had asimilar variation, but with lower MnSOD activity. In its turn, ahigher level of MnSOD was detected for the SAN genotype at stage3, followed by a reduction until the last stage of PPD. In general,MnSOD activity decreased during PPD (Table 1-II).
The Cu/ZnSOD activity in all cultivars ranged from 9.37 (SAN) to332 U/kg of dry weight (Table 1, part-II). Differently, for the totalSOD and MnSOD, the BRA cultivar showed an increase in theCu/ZnSOD activity until stage 3 and, after that, a reduction wasnoticed. ORI, IAC, and SAN showed lower activity of Cu/ZnSOD atstage 3 and an increase until stage 8 of PPD. In general, increasesof activity were observed during PPD, but such behaviour was geno-type dependent. The findings herein reported corroborate those ofAn et al. (2012) in cassava cold stress. The authors observedincreases in SOD only 4 h after stress induction and then a decreaseof enzymatic activity. Similar results in CAT, hydrogen peroxide,and SOD family of enzymes were found by Reilly et al. (2003,2007). The variation in data observed may reflect that PPD is a com-plex phenomenon and other variables (environmental and genetic)must be viewed together for a better understanding of the physio-logical events occurring over the deterioration process.
3.4. Chemometric analysis
3.4.1. Principal component analysis (PCA)In this study, PCA was used to objectively interpret and com-
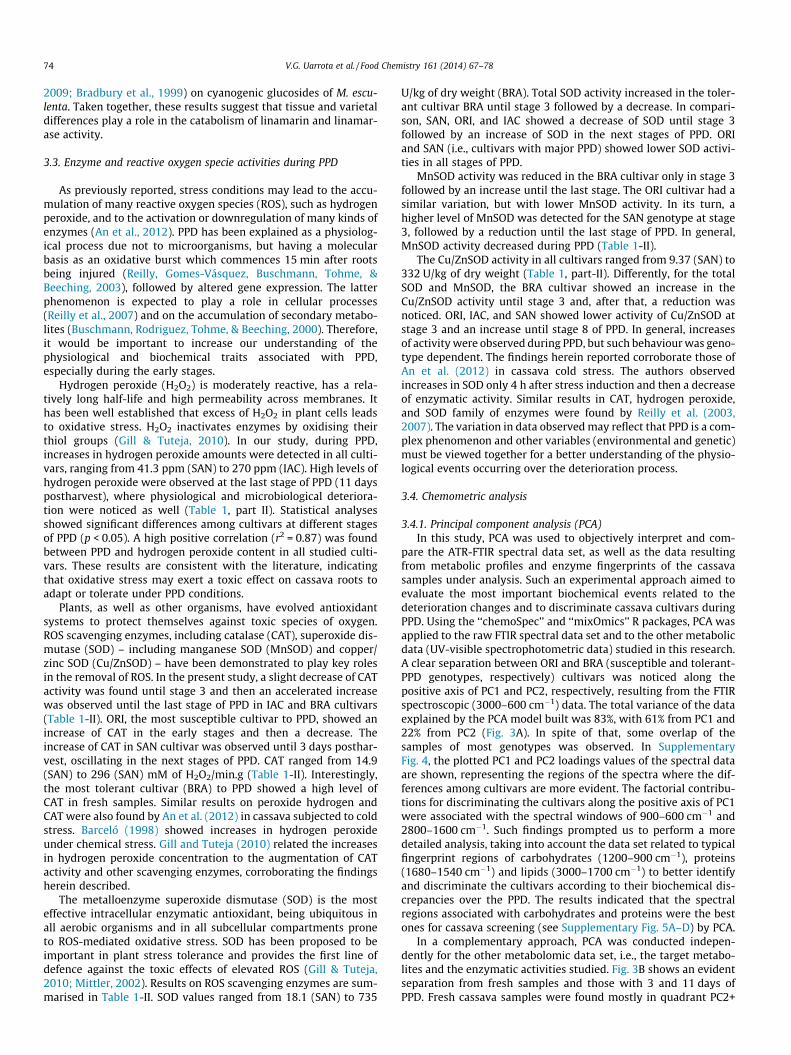
pare the ATR-FTIR spectral data set, as well as the data resultingfrom metabolic profiles and enzyme fingerprints of the cassavasamples under analysis. Such an experimental approach aimed toevaluate the most important biochemical events related to thedeterioration changes and to discriminate cassava cultivars duringPPD. Using the ‘‘chemoSpec’’ and ‘‘mixOmics’’ R packages, PCA wasapplied to the raw FTIR spectral data set and to the other metabolicdata (UV-visible spectrophotometric data) studied in this research.A clear separation between ORI and BRA (susceptible and tolerant-PPD genotypes, respectively) cultivars was noticed along thepositive axis of PC1 and PC2, respectively, resulting from the FTIRspectroscopic (3000–600 cm�1) data. The total variance of the dataexplained by the PCA model built was 83%, with 61% from PC1 and22% from PC2 (Fig. 3A). In spite of that, some overlap of thesamples of most genotypes was observed. In SupplementaryFig. 4, the plotted PC1 and PC2 loadings values of the spectral dataare shown, representing the regions of the spectra where the dif-ferences among cultivars are more evident. The factorial contribu-tions for discriminating the cultivars along the positive axis of PC1were associated with the spectral windows of 900–600 cm�1 and2800–1600 cm�1. Such findings prompted us to perform a moredetailed analysis, taking into account the data set related to typicalfingerprint regions of carbohydrates (1200–900 cm�1), proteins(1680–1540 cm�1) and lipids (3000–1700 cm�1) to better identifyand discriminate the cultivars according to their biochemical dis-crepancies over the PPD. The results indicated that the spectralregions associated with carbohydrates and proteins were the bestones for cassava screening (see Supplementary Fig. 5A–D) by PCA.
In a complementary approach, PCA was conducted indepen-dently for the other metabolomic data set, i.e., the target metabo-lites and the enzymatic activities studied. Fig. 3B shows an evidentseparation from fresh samples and those with 3 and 11 days ofPPD. Fresh cassava samples were found mostly in quadrant PC2+
-2.0 -1.5 -1.0 -0.5 0.0 0.5 1.0
-0.5
0.0
0.5
1.0
1.5
2.0
PC1 score (61%)
PC
2 sc
ore
(22%
)
l1median/noscale/robust SANBRAIACORI
Fresh3 days5 days8 days
-4 -2 0 2
-4-2
02
PC1 Score (24%)
PC
2 sc
ore
(18%
)
fresh3 days5 days8 days11 days
SANBRAIACORI
A
B
Fig. 3. First and second principal component (PCA) scores plot of cassava samples.A–ATR-FTIR spectral (3000–600 cm�1) data set of cassava samples during PPD (0, 3,5, and 8 days). B–Summary data of all metabolites, enzymes, and cyanogenicglucosides studied during PPD (0, 3, 5, 8, and 11 days).
-3 -2 -1 0 1 2 3
-4-3
-2-1
01
2
PC1 Score (43%)
PC
2 sc
ore
(30%
)
fresh3 days5 days8 days11 days
SANBRAIACORI
-1.0 -0.5 0.0 0.5 1.0 1.5 2.0
-10
12
34
phenolics
flavo
noid
s
o
fresh3 days5 days8 days11 days
SANBRAIACORI
A
B
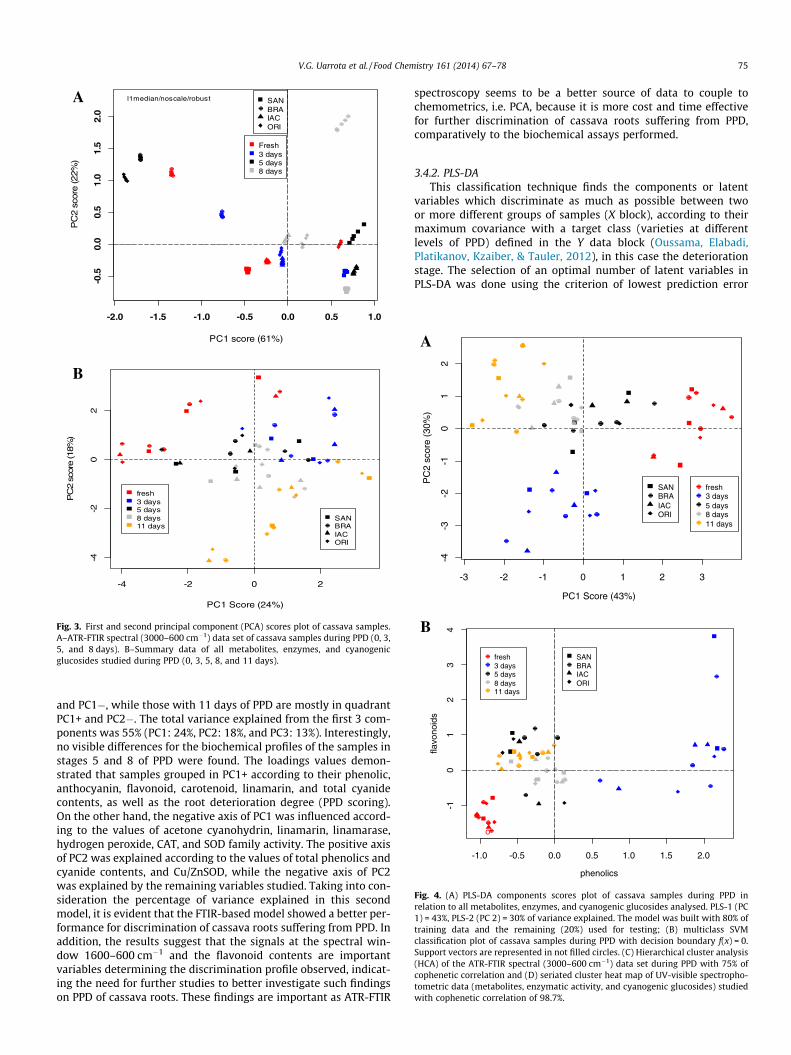
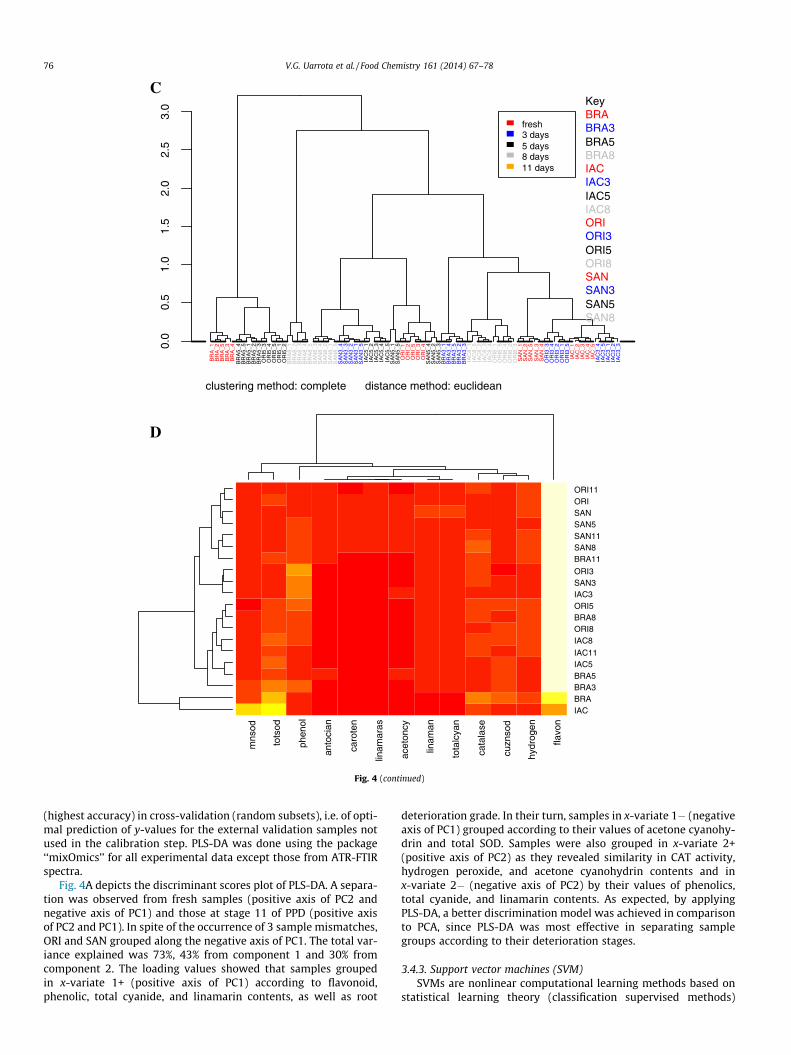
Fig. 4. (A) PLS-DA components scores plot of cassava samples during PPD inrelation to all metabolites, enzymes, and cyanogenic glucosides analysed. PLS-1 (PC1) = 43%, PLS-2 (PC 2) = 30% of variance explained. The model was built with 80% oftraining data and the remaining (20%) used for testing; (B) multiclass SVMclassification plot of cassava samples during PPD with decision boundary f(x) = 0.Support vectors are represented in not filled circles. (C) Hierarchical cluster analysis(HCA) of the ATR-FTIR spectral (3000–600 cm�1) data set during PPD with 75% ofcophenetic correlation and (D) seriated cluster heat map of UV-visible spectropho-tometric data (metabolites, enzymatic activity, and cyanogenic glucosides) studiedwith cophenetic correlation of 98.7%.
V.G. Uarrota et al. / Food Chemistry 161 (2014) 67–78 75
and PC1�, while those with 11 days of PPD are mostly in quadrantPC1+ and PC2�. The total variance explained from the first 3 com-ponents was 55% (PC1: 24%, PC2: 18%, and PC3: 13%). Interestingly,no visible differences for the biochemical profiles of the samples instages 5 and 8 of PPD were found. The loadings values demon-strated that samples grouped in PC1+ according to their phenolic,anthocyanin, flavonoid, carotenoid, linamarin, and total cyanidecontents, as well as the root deterioration degree (PPD scoring).On the other hand, the negative axis of PC1 was influenced accord-ing to the values of acetone cyanohydrin, linamarin, linamarase,hydrogen peroxide, CAT, and SOD family activity. The positive axisof PC2 was explained according to the values of total phenolics andcyanide contents, and Cu/ZnSOD, while the negative axis of PC2was explained by the remaining variables studied. Taking into con-sideration the percentage of variance explained in this secondmodel, it is evident that the FTIR-based model showed a better per-formance for discrimination of cassava roots suffering from PPD. Inaddition, the results suggest that the signals at the spectral win-dow 1600–600 cm�1 and the flavonoid contents are importantvariables determining the discrimination profile observed, indicat-ing the need for further studies to better investigate such findingson PPD of cassava roots. These findings are important as ATR-FTIR
spectroscopy seems to be a better source of data to couple tochemometrics, i.e. PCA, because it is more cost and time effectivefor further discrimination of cassava roots suffering from PPD,comparatively to the biochemical assays performed.
3.4.2. PLS-DAThis classification technique finds the components or latent
variables which discriminate as much as possible between twoor more different groups of samples (X block), according to theirmaximum covariance with a target class (varieties at differentlevels of PPD) defined in the Y data block (Oussama, Elabadi,Platikanov, Kzaiber, & Tauler, 2012), in this case the deteriorationstage. The selection of an optimal number of latent variables inPLS-DA was done using the criterion of lowest prediction error
0.0
0.5
1.0
1.5
2.0
2.5
3.0
clustering method: complete distance method: euclidean
BR
A_1
BR
A_2
BR
A_5
BR
A_3
BR
A_4
BR
A5_
4B
RA
5_5
BR
A5_
1B
RA
5_2
BR
A5_
3O
RI5
_3O
RI5
_4O
RI5
_5O
RI5
_1O
RI5
_2B
RA
8_1
BR
A8_
2B
RA
8_3
BR
A8_
4B
RA
8_5
SA
N8_
3S
AN
8_4
SA
N8_
2S
AN
8_1
SA
N8_
5S
AN
3_4
SA
N3_
3S
AN
3_2
SA
N3_
1S
AN
3_5
IAC
5_1
IAC
5_2
IAC
5_3
IAC
5_4
IAC
5_5
SA
N5_
1S
AN
5_5
OR
I_1
OR
I_2
OR
I_5
OR
I_3
OR
I_4
SA
N5_
4S
AN
5_2
SA
N5_
3B
RA
3_1
BR
A3_
4B
RA
3_5
BR
A3_
2B
RA
3_3
IAC
8_1
IAC
8_5
IAC
8_2
IAC
8_3
IAC
8_4
OR
I8_1
OR
I8_5
OR
I8_4
OR
I8_2
OR
I8_3
SA
N_1
SA
N_2
SA
N_5
SA
N_3
SA
N_4
OR
I3_3
OR
I3_4
OR
I3_2
OR
I3_1
OR
I3_5
IAC
_1IA
C_2
IAC
_3IA
C_4
IAC
_5IA
C3_
4IA
C3_
5IA
C3_
1IA
C3_
2IA
C3_
3
KeyBRABRA3BRA5BRA8IACIAC3IAC5IAC8ORIORI3ORI5ORI8SANSAN3SAN5SAN8
fresh3 days5 days8 days11 days
mns
od
tots
od
phen
ol
anto
cian
caro
ten
linam
aras
acet
oncy
linam
an
tota
lcya
n
cata
lase
cuzn
sod
hydr
ogen
flavo
n
IACBRABRA3BRA5IAC5IAC11
IAC8ORI8BRA8ORI5IAC3SAN3ORI3
BRA11SAN8SAN11SAN5SANORIORI11
C
D
Fig. 4 (continued)
76 V.G. Uarrota et al. / Food Chemistry 161 (2014) 67–78
(highest accuracy) in cross-validation (random subsets), i.e. of opti-mal prediction of y-values for the external validation samples notused in the calibration step. PLS-DA was done using the package‘‘mixOmics’’ for all experimental data except those from ATR-FTIRspectra.
Fig. 4A depicts the discriminant scores plot of PLS-DA. A separa-tion was observed from fresh samples (positive axis of PC2 andnegative axis of PC1) and those at stage 11 of PPD (positive axisof PC2 and PC1). In spite of the occurrence of 3 sample mismatches,ORI and SAN grouped along the negative axis of PC1. The total var-iance explained was 73%, 43% from component 1 and 30% fromcomponent 2. The loading values showed that samples groupedin x-variate 1+ (positive axis of PC1) according to flavonoid,phenolic, total cyanide, and linamarin contents, as well as root
deterioration grade. In their turn, samples in x-variate 1� (negativeaxis of PC1) grouped according to their values of acetone cyanohy-drin and total SOD. Samples were also grouped in x-variate 2+(positive axis of PC2) as they revealed similarity in CAT activity,hydrogen peroxide, and acetone cyanohydrin contents and inx-variate 2� (negative axis of PC2) by their values of phenolics,total cyanide, and linamarin contents. As expected, by applyingPLS-DA, a better discrimination model was achieved in comparisonto PCA, since PLS-DA was most effective in separating samplegroups according to their deterioration stages.
3.4.3. Support vector machines (SVM)SVMs are nonlinear computational learning methods based on
statistical learning theory (classification supervised methods)
V.G. Uarrota et al. / Food Chemistry 161 (2014) 67–78 77
aiming to separate groups here defined as cultivars at different lev-els of PPD. The SVM method was implemented using the R package‘‘e1071’’, used in a classification mode, with a radial SVM-kernel,cost of 4, and gamma of 0.5 as the best values found. Similarly tothe PLS-DA model, our training model clearly separated fresh sam-ples from those at stage 11 of PPD (Fig. 4B) using phenolics andflavonoids as target variables. Other classification methods suchas artificial neural networks (ANN), K-nearest neighbours (KNN)and classification trees were also tested (data not shown), butSVM showed the lowest test classification error (see Supplemen-tary Fig. 6A–E). The predicted values (data not shown) were consis-tent in our classification model and the mean and standarddeviation of the accuracy in a 5-fold cross validation scheme were88.4% and 2.6%, respectively (over 30 repetitions).
3.4.4. Hierarchical clustering analysis (HCA)Cluster analysis is often based on the concept of similarity. The
easiest and most intuitive way to mathematically define the simi-larity between two objects is based on the Euclidean distance,which was adopted in this study, without loss of generality. WhenHCA was applied to the FTIR spectral data, four groups emerged(Fig. 4C). The cophenetic correlation found was 75% and the simi-larities found were related to the spectral regions of carbohydratesand proteins as observed in feature selection (see SupplementaryFig. 5) and previously in PCA.
When a seriated cluster heat-map was applied to the metabo-lites and enzymatic data set, four groups were also found, with ahigh similarity correlation (cophenetic correlation = 98.7%;Fig. 4D). BRA and IAC showed similarities according to their valuesof flavonoids, total SOD, and MnSOD activities. ORI3, SAN3, andIAC3 cultivars were found to be grouped as a function of flavo-noids. Most samples at stage 11 of PPD grouped with stages 5and 8 samples of PPD and a clear separation between BRA andORI at stage 8 of PPD was found. Looking for what drives theclusters, a feature selection was also applied for the 4 smallmolecules, CN-related compounds and enzymes (SupplementaryFigs. 1A–H). It seems that clustering is driven by flavonoids,phenolics, total cyanide, linamarin, catalase, superoxide dismutase,and hydrogen peroxide.
4. Conclusion
The metabolomic-chemometrics approach used in this study forscreening cassava roots during postharvest physiological deterio-ration gave rise to evidence of metabolic differentiation for thestudied genotypes during PPD. A rapid screening of cassava duringPPD was achieved with successful realisation of the researchobjectives, by combining the visual inspection of cassava roots(e.g., tolerant BRA and susceptible ORI) to PPD, their biochemicalprofiles, the ATR-FTIR spectral data set, and the proposed chemo-metric tools. A clear trend was evident with fresh samples andthose with 3, 5, 8 and 11 days of PPD, being well discriminatedby PCA, PLS-DA, and SVM. PLS-DA and SVM modelling of the bio-chemical data enabled satisfactory prediction of cassava samples.PPD seems to be related negatively with phenolic compounds,carotenoids and positively with flavonoids and anthocyanins.Reactive scavenging species and enzymes such as SOD, MnSOD,and Cu/ZnSOD are activated as a protective form of the oxidativestress by cells over the PPD. Finally, the results clearly indicatedthat further biochemical studies focusing on the tzero–stage 3 per-iod of PPD seem to be important to gain more detailed insights asto the metabolic and enzymatic events related to that physiologicalprocess in root cassava genotypes.
Authors contributions
The research was conducted by the first author as PhD thesisunder supervision of the last author. All co-authors contributedequally.
Conflict of Interest
None declared.
Acknowledgements
We are thankful to PEC-PG (‘‘Programa de Estudantes Convêniode Pós-Graduação’’) coordinated by CAPES (‘‘Coordenação de Aper-feiçoamento de Pessoal de Nível Superior’’) for fully-funded stu-dentship. We are also grateful to Professor Bryan A. Hanson(DePauw University, Department of Chemistry and Biochemistry,Greencastle, Indiana, USA) for his valuable help in ChemoSpecpackage and R software data mining. Marcelo Maraschin thanksto CNPq for the research productivity fellowship.
Appendix. Supplementary data
Supplementary data associated with this article can be found, inthe online version, at http://dx.doi.org/10.1016/j.foodchem.2014.03.110.
References
Aebi, H. E. (1983). Catalase. In H. U. Bergmeyer (Ed.). Methods of enzymatic analyses(Vol. 3, pp. 273–282). Weinheim: Verlag Chemie.
An, D., Yang, J., & Zhang, P. (2012). Transcriptome profiling of low temperaturetreated cassava apical shoots showed dynamic responses of tropical plant tocold stress. BMC Genomics, 13, 64.
Barceló, A. R. (1998). The generation of H2O2 in the xylem of Zinnia elegans ismediated by an NADPH-oxidase-like enzyme. Planta, 207, 207–216.
Blagbrough, I. S., Bayoumi, S. A. L., Rowan, M. G., & Beeching, J. R. (2010). Cassava:An appraisal of its phytochemistry and its biotechnological prospects.Phytochemistry, 71, 1940–1951.
Blois, M. S. (1958). Antioxidant determinations by the use of a stable free radical.Nature, 181, 1199–1200.
Booth, R.H. (1975). Cassava storage. Post-harvest deterioration and storage of freshcassava roots. Centro Internacional de Agricultura Tropical. Cali. Colombia.Series EE 16. 20p.
Bradbury, J. H. (2009). Development of a sensitive picrate method to determinetotal cyanide and acetone cyanohydrin contents of gari from cassava. FoodChemistry, 113, 1329–1333.
Bradbury, M. G., Egan, S. V., & Bradbury, J. H. (1999). Picrate paper kits fordetermination of total cyanogens in cassava roots and all forms of cyanogens incassava products. Journal of the Science of Food and Agriculture, 79, 593–601.
Bradford, M. M. (1976). A rapid and sensitive method for the quantitation ofmicrogram quantities of protein utilizing the principle of protein-dye binding.Analytical Biochemistry, 72, 248–254.
Buschmann, H., Reilly, K., Rodriguez, M. X., Tohme, J., & Beeching, J. R. (2000b).Hydrogen peroxide and flavan-3-ols in storage roots of cassava (Manihotesculenta Crantz) during postharvest deterioration. Journal of Agricultural andFood Chemistry, 48, 5522–5529.
Buschmann, H., Rodriguez, M. X., Tohmes, J., & Beeching, J. R. (2000a). Accumulationof hydroxycoumarins during post-harvest deterioration of tuberous roots ofcassava (Manihot esculenta). Annals of Botany, 86, 1153–1160.
Ceballos, H., Luna, J., Escobar, A. F., Ortiz, D., Perez, J. C., Pachon, H., et al. (2012).Spatial distribution of dry matter in yellow fleshed cassava roots and itsinfluence on carotenoid retention upon boiling. Food Research International, 45,52–59.
Chang, C.-C., Yang, M.-H., Wen, H.-M., & Chern, J.-C. (2002). Estimation of totalflavonoid content in propolis by two complementary colorimetric methods.Journal of Food and Drug Analysis, 10, 178–182.
Chavez, A. L., Sanchez, T., Jaramillo, G., Bedoya, J. M., Echeverry, J., & Bolanos, E. A.(2005). Variation of quality traits in cassava roots evaluated in landraces andimproved clones. Euphytica, 143, 125–133.
Copíková, J., Barros, A. S., Smidová, I., Cerná, M., Teixeira, D. H., & Delgadillo, I.(2006). Influence of hydration of food additive polysaccharides on FT-IR spectradistinction. Carbohydrate Polymers, 63, 355–359.
Cortes, D. F., Reilly, K., Okogbenin, E., Beeching, J. R., Iglesias, C., & Tohme, J. (2002).Mapping wound-response genes involved in post-harvest physiologicaldeterioration (PPD) of cassava (Manihot esculenta Crantz). Euphytica, 128, 47–53.
78 V.G. Uarrota et al. / Food Chemistry 161 (2014) 67–78
Ebbs, S. (2004). Biological degradation of cyanide compounds. Current Opinion inBiotechnology, 15, 231–236.
Engida, A. M., Kasim, N. S., Tsigie, Y. A., Ismadji, S., Huynh, L. H., & Ju, Y. (2013).Extraction, identification and quantitative HPLC analysis of flavonoids fromsarang semut (Myrmecodia pendan). Industrial Crops and Products, 41,392–396.
Fernie, A. R., & Shauer, N. (2008). Metabolomics-assisted breeding: A viable optionfor crop improvement. Trends in Genetics, 25, 39–48.
Folin, O., & Ciocalteu, V. (1927). On tyrosine and tryptophane determinations inproteins. The Journal of Biological Chemistry, 73, 627–650.
Fridovich, I. (1995). Superoxide radicals and superoxide dismutases. Annual Reviewin Biochemistry, 64, 97–112.
García, J. A., Sánchez, T., Ceballos, H., & Alonso, L. (2013). Non-destructive samplingprocedure for biochemical or gene expression studies on post-harvestphysiological deterioration of cassava roots. Postharvest Biology andTechnology, 86, 529–535.
Gill, S. S., & Tuteja, N. (2010). Reactive oxygen species and antioxidant machinery inabiotic stress tolerance in crop plants. Plant Physiology and Biochemistry, 48,909–930.
Haque, M. R., & Bradbury, J. H. (2004). Preparation of linamarin from cassava leavesfor use in a cassava cyanide kit. Food Chemistry, 85, 27–29.
Hosseinian, F. S., Li, W., & Beta, T. (2008). Measurement of anthocyanins and otherphytochemicals in purple wheat. Food Chemistry, 109, 916–924.
Iwatsuki, N., Kojima, M., Data, E. S., & Villegas-Godoy, C. D. V. (1984). Changes incyanide content and linamarase activity in cassava roots after harvest. In I.Uritani & E. D. Reyes (Eds.), Tropical root crops: Postharvest physiology andprocessing (pp. 328). Tokyo: Japan Scientific Societies Press. 151-161.
Kedare, S. B., & Singh, R. P. (2011). Genesis and development of DPPH method ofantioxidant assay. Journal of Food Science and Technology, 48, 412–422.
Lee, J., Durst, R. W., & Wrostad, R. E. (2005). Determination of total monomericanthocyanin pigment content of fruit juices, beverages, natural colorants, andwines by the pH differential method: Collaborative study. Journal of AOAC, 88,1269–1278.
Maini, S. B., & Balagopal, C. (1978). Biochemical changes during post-harvestphysiological deterioration of cassava. Journal of Root Crops, 4, 31–33.
Mathlouthi, M., & Koenig, J. L. (1987). Vibrational spectra of carbohydrates. Advancesin Carbohydrate Chemistry and Biochemistry, 44, 7–89.
Mittler, R. (2002). Oxidative stress, antioxidants and stress tolerance. Trends in PlantScience, 7, 405–410.
Mkpong, O. E., Yan, H., Chisam, G., & Sayre, R. T. (1990). Purification,characterization, and localization of linamarase in cassava. Plant Physiology,93, 176–181.
Morante, N., Sanchez, T., Ceballos, H., Calle, F., Pérez, J. C., Egesi, C., et al. (2010).Tolerance to postharvest physiological deterioration in cassava roots. CropScience, 50, 1333–1338.
Oussama, A., Elabadi, F., Platikanov, F., Kzaiber, F., & Tauler, R. (2012). Detection ofolive oil adulteration using FT-IR spectroscopy and PLS with variableimportance of projection (VIP) scores. Journal of the American Oil ChemistsSociety, 89, 1807–1812.
R Core Team (2014). R: A language and environment for statistical computing. Vienna,Austria: R Foundation for Statistical Computing. http://www.R-project.org/.
Reilly, K., Bernal, D., Cortés, D. F., Gómez-Vásquez, R., Tohme, J., & Beeching, J. R.(2007). Towards identifying the full set of genes expressed during cassava post-harvest physiological deterioration. Plant Molecular Biology, 64, 187–203.
Reilly, K., Gomez-Vasquez, R., Buschmann, H., Tohme, J., & Beeching, J. R. (2003).Oxidative stress responses during cassava post-harvest physiologicaldeterioration. Plant Molecular Biology, 53, 669–685.
Rickard, J. E. (1981). Biochemical changes involved in the post-harvest deteriorationof cassava roots. Tropical Science, 23, 235–237.
Rubens, P., Snauwaert, J., Heremans, K., & Stute, R. (1999). In situ observation ofpressure-induced gelation of starches studied with FTIR in the diamond anvilcell. Carbohydrate Polymers, 39, 231–235.
Sanchez, T., Chávez, A. L., Ceballos, H., Rodriguez-Amaya, D. B., Nestel, P., & Ishitani,M. (2006). Reduction or delay of post-harvest physiological deterioration incassava roots with higher carotenoid content. Journal of the Science of Food andAgriculture, 86, 634–639.
Sánchez, T., Dufour, D., Moreno, J. L., Pizarro, M., Aragón, I. J., Domínguez, M., et al.(2013). Changes in extended shelf life of cassava roots during storage inambient conditions. Postharvest Biology and Technology, 86, 520–528.
Schulz, H., & Baranska, M. (2007). Identification and quantification of valuable plantsubstances by IR and Raman spectroscopy. Vibrational Spectroscopy, 43, 13–25.
Tanaka, Y., Data, E. S., Hirose, S., Taniguchi, T., & Uritani, I. (1983). Biochemicalchanges in secondary metabolites in wounded and deteriorated cassava roots.Agricultural and Biological Chemistry, 47, 693–700.
Uritani, I., Data, E. S., & Tanaka, Y. (1984b). Biochemistry of postharvestdeterioration of cassava and sweet potato roots. In I. Uritani & E. D. Reyes(Eds.), Tropical root crops: Postharvest physiology and processing (pp. 328). Tokyo:Japan Scientific Societies Press. 61-75.
Uritani, I., Data, E. S., Villegas, R. J., & Flores, P. (1984a). Changes in secondarymetabolism in cassava roots in relation to physiological deterioration. In I.Uritani & E. D. Reyes (Eds.), Tropical root crops: Postharvest physiology andprocessing (pp. 328). Tokyo: Japan Scientific Societies Press. 109-118.
Velikova, V., Yordanov, I., & Edreva, A. (2000). Oxidative stress and some antioxidantsystems in acid rain-treated bean plants protective role of exogenouspolyamines. Plant Science, 151, 59–66.
Wheatley, C. C., & Schwabe, W. W. (1985). Scopoletin involvement in post-harvestphysiological deterioration of cassava root (Manihot esculenta Crantz). Journal ofExperimental Botany, 36, 783–791.
Wilson, R. H., & Belton, P. S. (1988). A Fourier transform infrared study of wheatstarch gels. Carbohydrate Research, 180. 399-344.
Woisky, R. G., & Salatino, A. (1998). Analysis of propolis: Some parameters andprocedures for chemical quality control. Journal of Apicultural Research, 37,99–105.
Yeoh, H.-H., Bradbury, J. H., & Egan, S. V. (1997). A simple and rapid method forisolating cassava leaf linamarase suitable for cassava cyanide determination.Journal of the Science of Food and Agriculture, 75, 258–262.
Zagrobelny, M., Bak, S., Rasmussen, A. V., Jørgensen, B., Naumann, C. M., & Møller, B.L. (2004). Cyanogenic glucosides and plant–insect interactions. Phytochemistry,65, 293–306.
Zidenga, T. (2011). Cyanide metabolism, postharvest physiological deteriorationand abiotic stress tolerance in cassava (Manihot esculenta Crantz) (Ph.D. thesis).Ohio State University.