Metabolite profiling in blood plasma - Fiehn Lab -...
19
Metabolite profiling in blood plasma Oliver Fiehn, Tobias Kind UC Davis, Genome Center GBSF Building, 451 East Health Sciences Drive, Davis (CA), USA 5 Email: [email protected] , phone: +1-530-754-8258 Key words: mass spectrometry, GC-MS, metabolomics, data mining, diabetes Abstract 10 Metabolite profiling has been established as a multiparallel strategy for relative quantification of a mixture of compounds or compound classes using chromatography and universal detection technologies (GC-MS, LC-MS). Despite its origins dating back to the late 1960’s, it was only in the 1980’s that its use was acknowledged to diagnose metabolic disorders in men, 15 especially for rapid screening of inborn errors. Even faster ESI-MS/MS screening methods replaced longish chromatographic methods, and method development had stopped despite its potential use for other, less imminent diseases such as likelihood assessments of type II diabetes mellitus or cardiovascular risk factor evaluation. In addition to its diagnostic use, profiling blood samples can be employed to investigate specific biochemical responses. The 20 broader scope of analysis outweighs the disadvantages by taking compromises in method development and the reduced accuracy for specific metabolites. This chapter exemplifies the strategies in metabolite profiling by GC-MS. It gives experimental details on basic steps like blood plasma withdrawal, storage, protein precipitation, extraction, concentration, derivatization, data acquisition, raw data processing and result data tranformation. A major 25 difference to profiling plant tissues is that no fractionation step is utilized, enabling the analysis of primary metabolites like sugars and amino acids concomitant with lipids such as sterols and free fatty acids.
Transcript of Metabolite profiling in blood plasma - Fiehn Lab -...

Metabolite profiling in blood plasma
Oliver Fiehn, Tobias Kind
UC Davis, Genome Center
GBSF Building, 451 East Health Sciences Drive, Davis (CA), USA 5
Email: [email protected] , phone: +1-530-754-8258
Key words: mass spectrometry, GC-MS, metabolomics, data mining, diabetes
Abstract 10
Metabolite profiling has been established as a multiparallel strategy for relative quantification
of a mixture of compounds or compound classes using chromatography and universal
detection technologies (GC-MS, LC-MS). Despite its origins dating back to the late 1960’s, it
was only in the 1980’s that its use was acknowledged to diagnose metabolic disorders in men, 15
especially for rapid screening of inborn errors. Even faster ESI-MS/MS screening methods
replaced longish chromatographic methods, and method development had stopped despite its
potential use for other, less imminent diseases such as likelihood assessments of type II
diabetes mellitus or cardiovascular risk factor evaluation. In addition to its diagnostic use,
profiling blood samples can be employed to investigate specific biochemical responses. The 20
broader scope of analysis outweighs the disadvantages by taking compromises in method
development and the reduced accuracy for specific metabolites. This chapter exemplifies the
strategies in metabolite profiling by GC-MS. It gives experimental details on basic steps like
blood plasma withdrawal, storage, protein precipitation, extraction, concentration,
derivatization, data acquisition, raw data processing and result data tranformation. A major 25
difference to profiling plant tissues is that no fractionation step is utilized, enabling the
analysis of primary metabolites like sugars and amino acids concomitant with lipids such as
sterols and free fatty acids.

Fiehn and Kind: Metabolite profiling in blood plasma
2
1. Introduction 30
Metabolite profiling is an analytical method for relative quantification of a select number of
metabolites from biological samples (1), i.e. members of specific pathways or compound
classes. In plant biology, samples have been garnered from a specific tissue or a part of a
tissue of interest, but for biomedical purposes, analysis of metabolite profiles in body fluids 35
such as blood, urine or saliva, is equally important. Metabolite profiling is distinguished from
other analytical procedures by its scope:
(a) Target analysis is constrained to one or a very few target compounds (such as
hormones). Such targets are usually quantified in an absolute manner using calibration 40
curves and/or stable isotope labeled internal standards.
(b) Metabolite profiling restricts itself to a certain range of compounds or even to screening
a pre-defined number of members of a compound class. Within these constraints, a
single analytical platform may be sufficient. Examples might be the analysis of
carotenoid intermediates by liquid chromatography/diode array UV detection (HPLC-45
UV), or sugars, hydroxy – and amino acids by fractionation and gas
chromatography/mass spectrometry (GC-MS), or vitamin profiling by HPLC-MS/MS.
Quantification in metabolite profiling is usually carried out relative to comparator
samples, such as positive and negative controls.
(c) Metabolomics seeks for a truly unbiased quantitative and qualitative analysis of all 50
biochemical intermediates in a sample. It must not be restricted by any physicochemical
property of the metabolites, such as molecular weight, polarity, volatility, electrical
charge, chemical structure and others. Since there is currently no single technology
available that would allow such comprehensive analysis, metabolomics is characterized
by the use of multiple techniques and unbiased software. Metabolomics also uses 55
relative quantification. In addition, it must include a strong focus on de novo
identification of unknown metabolites whose presence is demonstrated.
(d) Metabolite fingerprinting is different from the other three approaches in that it does not
aim to physically separate individual metabolites. Instead, spectra from full sample
extracts are acquired by a single instrument (such as 1H-NMR). Spectra are then 60
compared by multivariate statistics in order to find spectral regions that discriminate
samples by their biological origin. In some instances, these regions may again point

Fiehn and Kind: Metabolite profiling in blood plasma
3
towards specific metabolites; in general, however, one dimensional methods are
restricted in resolving complex mixtures.
65
Metabolite profiling therefore must be seen as a compromise between truly quantitative target
analysis and completely unbiased metabolomics. Each metabolite profiling method is directed
towards a chemically very different compound class, hence there are various methods
published depending on the actual task. In itself, each procedure will be a compromise
between several parameters such as compound stability, solubility, influence of the cellular 70
matrix, time needed to carry out the protocol, constraints given to garner samples (blood
withdrawal), extraction (potentially followed by fractionation), submission to analytical
instruments, raw data analysis and statistics. For example, a protocol found to be well suited
for the analysis of oxylipids in urine will be very much different from one that aims at
hydrophilic sugars and amino acids in blood plasma. Validation criteria for metabolite 75
profiling protocols are therefore different from target analysis: (a) Reproducibility (precision
of relative metabolite levels) is more important than absolute recovery. (b) Robustness and
practicability are more important than accuracy (correctness in absolute metabolite
concentrations). (c) Comprehensiveness is more important than inclusion of a certain
metabolite that might be missed. (d) Overall dynamic range for the majority of compounds is 80
more important than the detection limit for a specific substance. (e) On contrary, the ability to
include important known key metabolites may still be more important than the detection of
unidentified peaks that might be biochemical side-products of enzymes with low substrate
specificity.
Obviously, these considerations can only serve as guidelines and must be weighed for 85
importance when new methods are developed, explicitly stating which criteria were regarded
most important and why. This refers to the need of exact definitions of the scope of an
analytical method (2), which is dependent on the research area to which it is applied.
In this chapter, a validated method for metabolite profiling of primary metabolites and sterols 90
is elaborated for blood plasma matrix. Analysis of lipophilic components such as
(unsaturated) free fatty acids and sterols is regarded equally important to sugars and hydroxy
acids in medical diagnostics, therefore, classical metabolite profiling techniques that made use
of inexpensive and mature technologies (such as GC/quadrupole MS) needed to be replaced
by more sophisticated setups. The basic steps in the process can be summarized as: 95

Fiehn and Kind: Metabolite profiling in blood plasma
4
1. Design an experiment according to the biological question. Use randomization
wherever possible. Use preexisting knowledge to target the number of individuals to
be tested: generally, biological variation among humans exceeds greatly the variation
found in animals. If there is not enough information available about (metabolic) 100
variation in your test populations, consider small test experiments to gather such
values. Consult statisticians before carrying out the experiments!
2. Collect as much background information about your individuals or animals as
possible: this will later aid interpretation of data. This includes any data that
potentially may have an effect on the measured variables, for instance: genotype 105
(gender, ethnicity/line, SNPs, progeny etc), phenotypic descriptions (e.g. images,
weight, body mass index, waist-hip ratio, size etc), environmental impacts
(food/nutrition, health status, drug treatments, physical exercise, mental status/stress,
fasting state etc.)
3. Withdraw blood using standard procedures into EDTA-containing tubes. Freeze at -110
20°C after blood withdrawal. Do not use samples that have been thawn more than
twice.
4. Extract blood plasma in a comprehensive and mild way concomitant with enzyme
inactivation and addition of internal standards.
5. Dry down an aliquot of extract, and keep the other aliquots frozen for record purposes. 115
6. Derivatize the extract by first adding methoxyamine in an aprotic basic solvent, and
then adding a trimethylsilylating agent.
7. Analyze the derivatized sample by direct thermodesorption GC-TOF.
8. Process the raw GC-TOF data.
9. Normalize and transform the result data, and perform statistical evaluations. 120
The basic theoretical considerations behind this process are quite simple: the measured
metabolite levels should reflect the in vivo state which need background information for
interpretation of metabolic changes (and variation). Therefore, any metabolic variation by
formation of chemical or post-harvest biochemical artifacts must be prevented. Biochemical 125
inactivation can be ensured by coagulation of enzymes, either using heat-shock or cold-shock
methods, with the help of organic solvents such as chloroform, acetone, isopropanol or
acetonitrile that force protein precipitation. Conversely, chemical artifact formation depends
on the stability of each specific compound and is therefore hard to predict. Generally, any
harsh treatment of the metabolome mixture should be avoided. Instead, conditions for 130
Fiehn and Kind: Metabolite profiling in blood plasma
5
extraction, storage, chemical derivatization and analysis should be as mild and as
comprehensive and universal as possible. In this respect, cold treatments are generally
preferred over heat treatments.
2. Materials 135
2.1 Blood plasma collection
A notebook in electronic or paper format is needed to keep track on sample identity numbers,
fasting state, day, time, and physiological parameters. Vacutainer safety equipment for
collection of blood plasma samples should be used, withdrawing blood directly into K3EDTA 140
lavender-top tubes. Spare tubes and a centrifuge capable of 3000 g centrifugation to separate
plasma from blood cells are needed. Micro centrifuge tubes and a vortexer are employed for
aliquotation and homogenization. Dewars with liquid nitrogen will ensure the immediate
arrest of residual biological activity after centrifugation. Dry ice and a -80°C freezer are
needed to ensure plasma stability during storage and transportation. 145
2.2 Extraction
For rinsing or cleaning dishes, only ultra-pure water with a level of total organic carbon
TOC<10 ppb should be employed (standard deionized water still contains large amounts or
organic contaminants). For preparing the extraction mixture, degassing devices (such as 150
vacuum/ultrasonic bath, or pure argon or nitrogen gas bombs) and a liquid cooling system
must be available. A freshly prepared, chilled (-15°C) and degassed mixture of acetone and
isopropanol is prepared at a ratio of 2 : 1 (v/v). For each solvent, the highest quality (e.g.
>99% ultra-pure HPLC-MS gradient grade purity) is used and stored at room temperature in
the dark. A pH measurement device will be needed to check neutrality of solvents. Volumes 155
are measured using calibrated pipettes whose accuracies are subjected to quality control
routines at least once every six months. An ice bath and liquid nitrogen dewars are used for
temporarily storing samples during the process. Large twisters are useful to operate in
nitrogen dewars. Extraction is performed in a micro centrifuge tube shaker.
160
2.3 Derivatisation
A speed vacuum concentrator or lyophilizer is used for drying extracts to complete dryness. A
mixture of 40 mg/mL of methoxyamine.HCl in pyridine (p.a. quality) is freshly prepared
using an ultrasonicator. In case ATAS (NL) liners are used, pyridine must be exchanged

Fiehn and Kind: Metabolite profiling in blood plasma
6
against dimethylformamide as polar, aprotic and basic solvent. N-methyl-N-165
trimethylsilyltrifluoroacetamide (MSTFA) is used from freshly opened 1-mL bottles.
Reagents and solvents are stored in a desiccator in the dark. Derivatizations are carried out in
thermoshakers which are set to 45°C and 37°C for the first and second reaction step, resp.
2.4 Mass spectrometric analysis 170
GC-MS analysis is carried out on a quadrupole or a time-of-flight mass spectrometer
equipped with autosampler and electron impact ionization. Samples must be injected in
randomized order or appropriate block designs. For each injection sequence, the analysis of
quality control samples is a prerequisite (e.g. reagent blanks, method blanks, reference
compound mixture, reference design sample). 175
Low bleeding injector septa or septum free injector systems are prerequisite. Standard 10 µL
gas chromatography injection needles are mounted into the autosampler. Chromatography is
carried out on a 30 m long, 0.32 mm I.D. and 0.25 µm (35%-Phenyl)-methylpolysiloxane
column. The GC oven must be temperature programmable up to 360 °C. The mass 180
spectrometer must be capable of a data acquisition rate of at least 20 s-1 and a mass range of at
least 83-500 Da. Raw GC-MS data files are transferred to servers. Long-term data safety is
ensured by back up routines on DVD’s or by mirrored server space. Data analysis is carried
out on office personal computers using the vendor’s GC-TOF software that is able to carry
out multi-target analysis, including compound identity checks based on mass spectral and 185
retention index matching (e.g. ChromaTOF 2.25). The software must be capable of
quantitation by area and height on user defined ion traces.
3. Methods 3.1 Blood plasma withdrawal (see Note 4.1) 190
1. Take patient metadata and store them
2. Collect 2 ml blood plasma into K3EDTA tubes
3. Separate cells from plasma by centrifugation within 15 min after blood withdrawal
4. After centrifugation store plasma in a separate tube.
5. Ensure homogeneity by vortexing for 10 s. 195
6. Aliquot samples in six 30 µl batches into micro centrifuge tubes, storing the residual
plasma in a 2 ml centrifuge tube.
Fiehn and Kind: Metabolite profiling in blood plasma
7
7. If plasma is not directly extracted, close tubes and store at 4°C for up to 24 h,
otherwise place into liquid nitrogen and store at -20°C for up to 10 d.
200
3.2 Protein precipitation and metabolite extraction (see Note 4.3)
1. Take out 30 µl sample aliquots one by one and add internal standards, e.g. U-13C-
Sorbitol (200 ng per vial) for normalization, vortex for 10 s.
2. Add 0.4 mL of cold extraction solvent mixture (-15°C, degassed) to each (3) and
vortex vigorously for 20 s. 205
3. Shake the samples in batches of 10 for 5 min in a 4°C room. When taking out the
samples, place them in an ice bath.
4. Centrifuge samples at 20.800 rcf for 2 min.
5. Collect the liquid supernatant of each sample and store in a clean micro centrifuge
tubes. The metal balls can be re-used after cleaning. The cell debris pellet can be 210
discarded.
6. Repeat steps 1-5 until all samples are extracted.
7. For storage, extracts must be degassed with a gentle stream of nitrogen or argon gas
for 1 min prior to tube closure. Tubes can then be stored in the dark at -80°C for about
four weeks. 215
8. Dry the extracts in a speed vacuum concentrator or a lyophilizer to complete dryness.
9. For storage, deoxygenate samples with a gentle stream of nitrogen or argon gas for 1
min before closing the tubes. Tubes can then be stored in the dark at -80°C for at least
four weeks.
220
3.3 Derivatization (see Note 4.4)
1. Take out dried samples from store and allow them to warm up to room temperature for
at least 15 min before start of derivatization.
2. Add 10 µL of methoxyamine solution (40 mg/mL in dimethylformamide) to each
dried extract, and immediately close tubes afterwards. 225
3. Shake extracts for 90 min at 28°C.
4. Add 180 µL silylating agent (MSTFA) to each tube, and immediately close tubes
afterwards.
5. Shake samples for 30 min at 37°C.

Fiehn and Kind: Metabolite profiling in blood plasma
8
6. Transfer sample reaction solutions to glass vials suitable for the GC-MS autosampler. 230
Immediately close each sample with crimps that contain a teflon rubber seal. Wait two
hours before injecting the first sample into the GC-MS.
3.4 Data acquisition by GC-MS (see Note 4.5)
1. The mass spectrometer must be tuned according to the manufacturer’s manuals for 235
optimal parameters for ion lenses, detector voltage and other settings. Usually, this can
be performed in autotune operation.
2. Change or clean the liner every sample, otherwise data for lipids and aromatic
compounds will not be reliable. If an ATAS direct thermodesorption/automatic liner
exchange system is used, see extended note 4.5. 240
3. Check that manufacturere’s recommended maintenance routines have all been carried
out.
4. Inject 1 µL (1.5 µL for ATAS liners) of each sample in splitless mode, depending on
the metabolite concentrations and eventual signal-to-noise ratios in the GC-MS
profiles. Injection temperature is set to 230°C (see extended table in note 4.5 for 245
ATAS liners). Injection programs have to include syringe washing steps before and
after the injection, a sample pumping step for removal of small air bubbles and an air
buffer for complete sample removal during injection.
5. Separate metabolites using a GC temperature ramping program. Reasonable values
are: GC start conditions at 80°C, 2 min isothermal, ramp with 5°C/min up to 330°C, 5 250
min isothermal, cool down to initial conditions. The ion source should be turned off
during the solvent delay.
6. Detect metabolites by setting the ion source filament energy to 70 eV. Scan a mass
range of at least 83-500 Da, or 40-500 Da, if low mass-to-charge (m/z) fragment ions
are to be recorded. At least two scans per second should be recorded in full scan mode. 255
7. Transfer raw GC-MS profile chromatograms to a server station.
3.6 Data analysis (see Note 4.6)
1. For raw data processing, use appropriate software. First choice is the GC-MS
manufacturer’s software (Fig. 1). For general quadrupole mass spectrometers, data 260
deconvolution by the freely available software AMDIS is recommended
(http://chemdata.nist.gov/mass-spc/amdis/ ) (4).

Fiehn and Kind: Metabolite profiling in blood plasma
9
2. For TOF instruments, LECO’s ChromaTOF software is superior (version 2.25 and
higher). Define target peaks that are to be included in the metabolite profiles.
3. Define optimal peak finding thresholds and quantification ion traces for each target 265
compound. Peak identifications have to be carried out by matching retention indices
and mass spectral similarity against a user-defined metabolite library.
4. Quantify metabolite peaks by area of target ion traces. Export result peak tables of all
chromatograms to a data base or a PC office table calculation software (e.g. MS Excel
2000). 270
5. Organize peak area results in a matrix of metabolites vs. chromatograms.
6. Count the number of detected metabolites per chromatogram. In case one or a few
chromatograms show an unexplainable large deviation in the number of detected
peaks, check the chromatograms visually and delete them from the result table.
7. For each target metabolite, count the number of chromatograms in which the 275
metabolite could be positively identified. In case one or a few metabolites show an
unexplainable large deviation in the number of positive peak findings, check the
chromatograms visually, especially for the thresholds that were used for peak finding.
Delete the metabolites from the result table that have lots of negative peak findings
(missing values). 280
8. For each chromatogram, divide all peak areas by the area of the internal standard (e.g.
U-13C-sorbitol) and the sample weight. Log10 transform all data to down weight
outliers and ensure a more Gaussian-type frequency distribution.
9. Calculate univariate statistics (e.g. t-test in Excel, ANOVA in MatLab).
10. Calculate multivariate statistics. Often, such calculations do not accommodate missing 285
values for metabolites so suitable strategies must be employed for dealing with such
occurrences. The results of multivariate statistics from two strategies have to be
compared: (a) calculations that were carried out on all metabolites that had no missing
values. (b) calculations that were carried on all metabolites after replacement of
missing values. 290
4. Notes
4.1 Blood plasma collection
Metabolite profiling starts with the experimental design of the study. It is a rather
inexpensive technique, compared to proteomics or transcript expression analysis. 295
Therefore, larger numbers of individual analysis can be carried out allowing rigid

Fiehn and Kind: Metabolite profiling in blood plasma
10
statistical assessments of the quantitative results. This allows the adequate addressing of
the issue of natural biological variability, which usually contributes more to the standard
deviation of metabolite mean levels than technical errors. Especially for human blood
plasma the individuality of samples must not been neglected. In this respect, the first 300
issue to consider is the accurate description of blood donors with respect to underlying
metadata, most importantly the fasting state. Without such well-defined metadata, no
interpretation of metabolic levels will be possible! Depending on the biological question
underlying a study, pooling strategies may be designed to counteract this variability.
Proteins in full blood will coagulate quickly by clotting factors, so it is of utmost 305
importance to stop coagulation by complexation with EDTA (or other chemicals). There
are protocols using coagulated and centrifuged blood, however, the process of
coagulation is uncontrollable and co-precipitation of metabolites seems unavoidable.
Blood plasma further contains metabolically active cells, therefore cells need to be
quickly centrifuged out to preserve the metabolic state at sampling time. 310
4.2 Extraction and protein precipitation
Many protocols exist for protein precipitation, mostly with chilled (-15 to -40°C)
organic solvents. If solvents are used that are water miscible, this mixture may not only
precipitate proteins but concurrently extract metabolites. No comprehensive test has 315
been published so far that tests a multitude of solvents and mixtures of thereof with the
objective to quantitatively extract an array of different metabolites of different classes.
Therefore, the solvent composition given in this chapter has been validated only for the
mixtures that have been tested in the author’s laboratory after thorough experimental
designs but is likely not the final solution for this task. Ultimately the idea of 320
metabolomics has to be kept in mind that demands for ruggedness, precision and
comprehensiveness (for various chemical classes) rather than accuracy for any given
target molecule.
It is important that for any solvent mixture both the chilling temperature and the
solvent:sample ratio must be followed. We suggest that the latter ratio should always be 325
larger than 10:1. Another important point is the working time needed per sample,
especially when a multitude of samples is to be handled like in cohort studies. For
example, it might be tried to re-extract the protein precipitate pellet two or three times.
However, more time would be needed per sample and it does not seem very likely to
extract relevant amounts of soluble metabolites from such a condensed pellet. With the 330

Fiehn and Kind: Metabolite profiling in blood plasma
11
single extraction/precipitation method suggested here, repeatability was found to be
around 20% CV for most compounds. The high water content in blood plasma renders it
unnecessary to add further water for polar compounds (such as glucose) to the mixture,
however, when chloroform was added both recovery and precision declined
dramatically. In addition to stopping enzymatic activity by cold temperatures and 335
protein coagulation is avoiding oxidation. Solvents will contain huge amounts of oxygen
if they are not degassed by vacuum/ultrasonicator or by bubbling inert gases through it
(argon or nitrogen are most convenient). If deoxygenation is performed by gas
exchange, great care must be taken to use ultrapure gases and clean bubble tips (e.g.
rinsed Pasteur pipettes). It is somewhat less important to avoid light: some metabolites, 340
such as catecholamines, will decompose if exposed to light for too long. In initial
method development, no difference was found for blood samples that were strictly kept
in the dark throughout the sample preparation and samples that were handled under
regular laboratory conditions. We generally recommend to specifically care for reactive
metabolites such as cysteine, the ratio of ascorbate/dehydroascorbate and tocopherol. 345
Loss of (low abundant) organic phosphates points to inappropriate sample handling
causing partial enzymatic activity. Classical compounds such as glucose and cholesterol
will always be the dominant metabolites in blood profiles since these metabolites also
mark different metabolic pathways and octanol/water partition coefficients, they can be
used as important marker compounds for assessing general reproducibility. If extracts 350
are concentrated to complete dryness in a speed vacuum concentrator, caution should be
taken to avoid sample losses, spilling or cross-contamination due to boiling retardation.
For this reason extracts need be dried with punctured plastic tube caps.
4.4 Derivatization 355
During derivatization, access of moisture to the reaction solution must be totally
avoided. The amount of water during the silylation reaction can be assessed by the
occurrence and abundance of polysiloxanes which are degradation (hydrolysis) products
of the reactant MSTFA. Polysiloxanes are recognized by their typical spectra with
abundant ions m/z 221 and m/z 281. We have not found it to be necessary to perform 360
the derivatization in dry atmosphere. The most likely step to reload significant amounts
of water is when samples are too early opened after cold storage which would cause
severe water condensation. For the same reason we do not recommend storing samples
longer than 48 hours, and even if this is needed they must not be stored in the cold but

Fiehn and Kind: Metabolite profiling in blood plasma
12
just kept dark. Re-analysis of samples that have already been injected into the GC/MS 365
does not result in reproducible data, most likely again due to air (moisture) access after
punctuation of the vial septa. Temperatures and times of derivatization steps can be kept
flexible, because they again present a compromise between completeness of reaction,
time and efforts needed to perform the reactions, and breakdown of certain compounds
(e.g. chemical conversion of glutamine to oxoproline). The basic and apolar solvent 370
pyridine serves as catalyst in the methoximation procedure which is used to avoid sugar
ring cyclization. Generally it has been proven as the most suitable solvent for this
purpose, however, if ATAS direct thermodesorption liners are used, dicarboxylic acids
were found to be highly uncontrollable and irreproducible. Instead dimethylformamide
(DMF) can be used, however, the volume ratio of DMF to the silylation agent MSTFA 375
must be strictly kept at ≤ 1:20.
4.5 GC-MS
The most critical part of GC/MS is largely unknown to many people: it is neither the
gas chromatograph nor the mass spectrometer (5) but in >80% of cases the injection 380
process. Especially if full extract metabolomics is aimed for (such as suggested in this
protocol), between-sample cross contamination of lipids is basically unavoidable with
standard split/splitless liners. Because lipids such as sterols and arachidonic acid are
presumed to have high indicative value for diseases, the integration of polar and
lipophilic components seems to be highly advantageous. For this reason this proposal 385
suggests an automatic liner exchange, for example by ATAS’ direct thermodesorption
unit. Specialized (large-volume) glass liners with small inserted microvials are used.
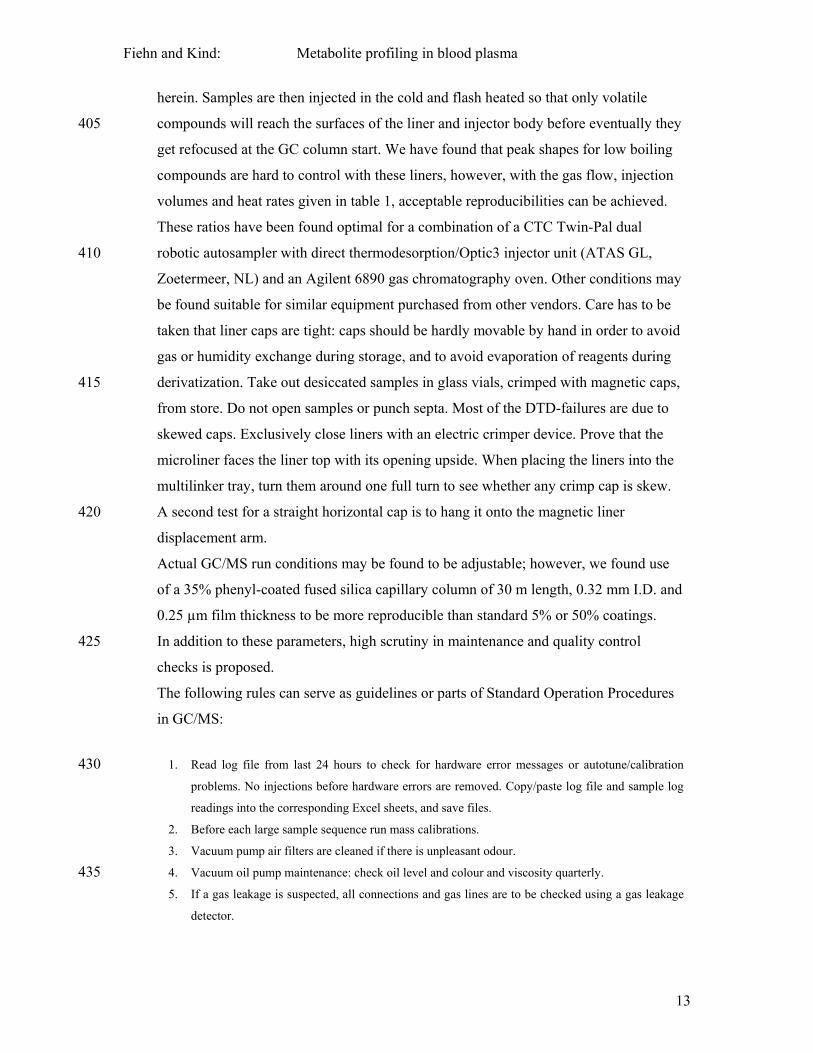
Method Name DTD-Analysis DTD-Deactivation Method Type Splitless Split Equilibration Time [s] 5 5 End Time [s] 1440 470 Initial Temperature [ºC] 45 85 Ramp Rate [ºC/s] 4.0 50.0 Final Temperature [ºC] 290 340 Temperature Control Keep Current Temperature Keep Current Temperature Solvent Cooling Effect No No Cooling Valve Mode No No Transfer Column Flow [ml/min] 2.0 2.0 Transfer Time [s] 150 0 Initial Column Flow [ml/min] 2.0 2.0 Final Column Flow [ml/min] 2.0 2.0 Split Flow [ml/min] 50 - Vent Mode - Fixed Time Vent Time - 0
Vent Flow [ml/min] - 150
Table 1: Injector program for direct thermal desorption
Fiehn and Kind: Metabolite profiling in blood plasma
13
herein. Samples are then injected in the cold and flash heated so that only volatile
compounds will reach the surfaces of the liner and injector body before eventually they 405
get refocused at the GC column start. We have found that peak shapes for low boiling
compounds are hard to control with these liners, however, with the gas flow, injection
volumes and heat rates given in table 1, acceptable reproducibilities can be achieved.
These ratios have been found optimal for a combination of a CTC Twin-Pal dual
robotic autosampler with direct thermodesorption/Optic3 injector unit (ATAS GL, 410
Zoetermeer, NL) and an Agilent 6890 gas chromatography oven. Other conditions may
be found suitable for similar equipment purchased from other vendors. Care has to be
taken that liner caps are tight: caps should be hardly movable by hand in order to avoid
gas or humidity exchange during storage, and to avoid evaporation of reagents during
derivatization. Take out desiccated samples in glass vials, crimped with magnetic caps, 415
from store. Do not open samples or punch septa. Most of the DTD-failures are due to
skewed caps. Exclusively close liners with an electric crimper device. Prove that the
microliner faces the liner top with its opening upside. When placing the liners into the
multilinker tray, turn them around one full turn to see whether any crimp cap is skew.
A second test for a straight horizontal cap is to hang it onto the magnetic liner 420
displacement arm.
Actual GC/MS run conditions may be found to be adjustable; however, we found use
of a 35% phenyl-coated fused silica capillary column of 30 m length, 0.32 mm I.D. and
0.25 µm film thickness to be more reproducible than standard 5% or 50% coatings.
In addition to these parameters, high scrutiny in maintenance and quality control 425
checks is proposed.
The following rules can serve as guidelines or parts of Standard Operation Procedures
in GC/MS:
1. Read log file from last 24 hours to check for hardware error messages or autotune/calibration 430 problems. No injections before hardware errors are removed. Copy/paste log file and sample log
readings into the corresponding Excel sheets, and save files.
2. Before each large sample sequence run mass calibrations.
3. Vacuum pump air filters are cleaned if there is unpleasant odour.
4. Vacuum oil pump maintenance: check oil level and colour and viscosity quarterly. 435 5. If a gas leakage is suspected, all connections and gas lines are to be checked using a gas leakage
detector.

Fiehn and Kind: Metabolite profiling in blood plasma
14
6. O-rings for liners, filters for injector tubings, injector gold plates, filaments and other replacement
parts are exchanged if necessary, i.e. once lower intervention limits in corresponding quality
control charts are violated. 440 7. Exchange GC column to 10 m DB5 column (0.18 mm ID, 0.18 µm film thickness), inject and
record signal/noise ratios for a hexachlorobenzene standard if all intervention measures
(specifically filament change) have not restored the ‘in-control’ status. If QC is still out of control,
report findings and call GC/MS technicians for detector replacement after consulting the
supervising scientist. 445 8. Use a quality control standard mixture composed of compounds of different chemical properties
and classes. Inject a dilution series of 10, 30, 50, 100% of the mix in splitless and split 1:3 mode.
After quality control injections, reagent blank and method blank control injections are carried out.
The splitless 100% QC injection is evaluated right after the run. No sample injection is performed
if the upper or lower intervention limits are violated. 450 9. Check for peak shape and occurrence of double peaks for low boiling point (early eluting)
compounds. If peak width is larger than 6 s with deteriorated peak shape (‘mountain-like’), stop
injection of samples and clean direct thermodesorption injector port. Check for peak shape and
detectability for high boiling point (last eluting) compounds at 100% QC splitless injection. If
these are undetectable (S/N<10), stop all further injections, disconnect and cut GC column by 10 455 cm. Readjust the total length of the column for gas flow calculations in the GC/MS software.
10. Randomize the injection sequence with respect to classes of your biological question /
experimental design in order not to compromise later statistical analysis.
It is generally suggested to refer to retention indices instead of retention times. 460
Retention indices are calculated from retention times of internal marker peaks: usually
alkanes are added to the samples to serve as retention anchor points, however, in
principle also other peaks can be used. In the protocol presented above, an unusual scan
range of 85-500 Da is proposed for mass spectrometric detection. Reasons for this
choice are found in the properties of silylated compounds, which often have 465
characteristic ions between 100-370 Da. Additionally, at m/z 79, bleeding of pyridine
may infer mass spectra of low boiling compounds. For almost all peaks, m/z 73 is the
most abundant ion – although this is helpful for lower limits of detection for pure
compounds, m/z 73 does not have any selectivity power in metabolic profiles.
470
4.6 Data analysis
Some metabolomic laboratories have missed the importance of data analysis as part of
the process. This process includes both raw data cleaning, alignment and reporting and
primary statistical analysis. Standard software of the leading mass spectrometry vendors
does not include a suitable data deconvolution software that alone can ensure valid peak 475

Fiehn and Kind: Metabolite profiling in blood plasma
15
identification in high throughput routine operations. This is especially important for low
abundant metabolites that might co-elute with abundant major peaks (Fig. 1). As general
solution we here propose use of AMDIS (www.nist.gov). However, we regard the
integrated deconvolution software of Leco corp. to be more dedicated for complex
samples. In any of these two software packages, model ions will be determined that best 480
describe the presence of a peak in its local environment, e.g. next to a co-eluting
abundant metabolite. Such model ions may serve as a valid default choice for
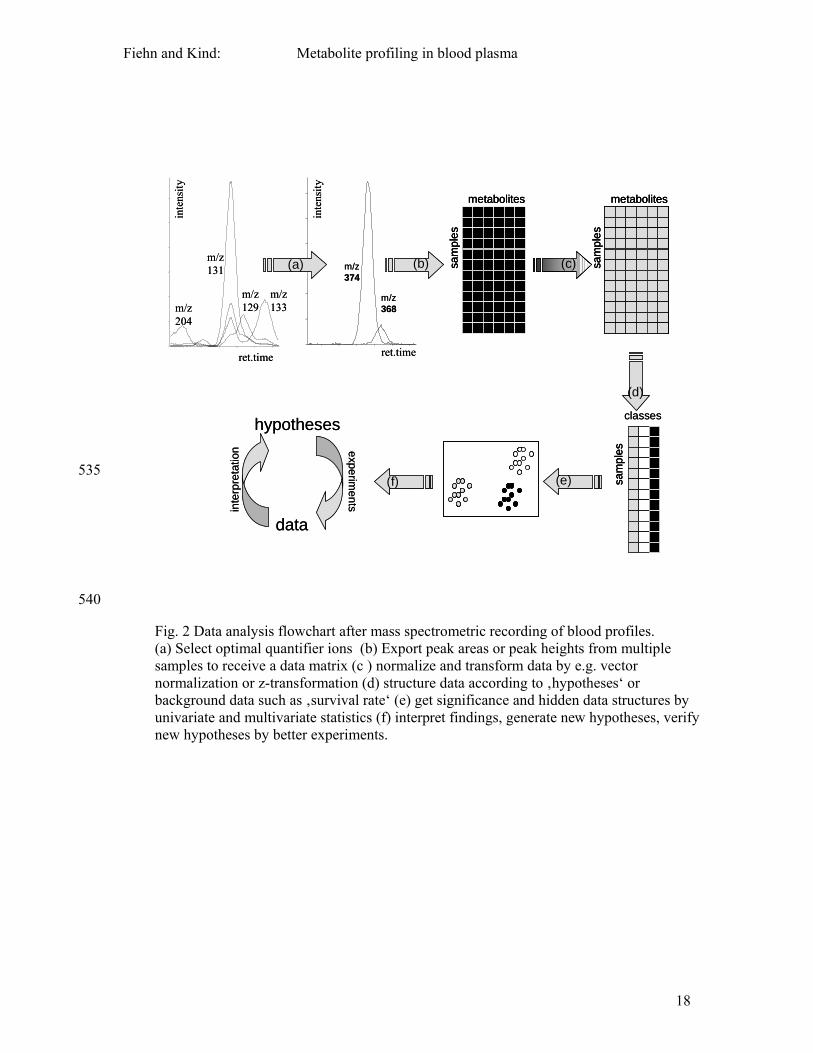
calculating peak areas from ion traces (Fig. 2). Defining thresholds for peak finding is
more delicate. If the thresholds for mass spectrum matching, retention index windows,
abundance and peak widths are set too high, a lot of peaks will not be taken as 485
metabolite targets although these are actually present in the chromatograms: such
instances are called false negatives and would result in missing values in the resulting
experiment data matrix. However, if these thresholds are set too low, peaks might be
falsely taken as true target metabolites although these are actually absent from the
chromatograms (false positives). The only way to remedy this situation is to store as 490
much mass spectral metadata as possible to allow other researches verify peak
identification claims.
After compiling a result data matrix, statistical analysis will need to be performed to test
that actual results are interpretable. Certain multivariate tools will require that there are
no missing values which might be caused by either false or true negatives. This cannot 495
be decided without manual chromatogram investigation, a task that is hardly doable in
high throughput metabolomics. Therefore, mock up data will be needed to fill these
‘missing values’, but great care must be taken that these mock up values do not skew or
bias the statistical analysis. For example, all statistical routines may be performed by
several means to replace ‘missing values’, e.g. by zeroes, arithmetic averages, random 500
generated numbers or else. If a given metabolite is not positively detected in 0-20% of
all samples of a given experimental design class, it may be suspected that it is indeed not
present in this class. In this case, entering half of the detection limit might be a sensible
way. In any case the means to replace missing values need be detailed when reporting
such data to the scientific community. Usually such data matrices are further 505
transformed to ensure better data homogeneity and adequacy for statistical analyses
(Fig. 2). Among others, z-transformations are used to normalize all data to unit
variances around zero means. We further suggest a log 10 transformation in order to
down weigh outliers and to transform the data matrix into a more Gaussian-type

Fiehn and Kind: Metabolite profiling in blood plasma
16
distribution. Similar logarithmic transformations are also used when analyzing 510
transcriptomic data. In any case data need to be re-transformed when x-fold average
values are to be computed, e.g. in comparisons blood plasma samples of healthy vs.
diseased individuals. For any interpretation of these univariate or multivariate statistical
tests, samples need to have a clear description by biological metadata describing the
actual experimental design, otherwise no novel hypotheses can be generated. Data 515
without metadata are irrelevant!
Acknowledgments
Blood plasma samples were provided by Dr. Joachim Spranger, German Institute for
Human Nutrition (DIfE), Potsdam-Rehbruecke, Germany. This work was funded by the 520
Max-Planck Society and the German ministry of education and research (BMBF),
BioProfile Nutrigenomics Berlin/Brandenburg, BMBF project number 0313036C.
.

Fiehn and Kind: Metabolite profiling in blood plasma
17
525
530
inte
nsity
ret. time (s) 840820800
inte
nsity
ret. time (s)834830826
m/z339
m/z341
m/z337
m/z205
337262
129
inte
nsity
m/z 35085
inte
nsity
m/z 35085
147
217205
103
inte
nsity
ret. time (s) 840820800
inte
nsity
ret. time (s)834830826
m/z339
m/z341
m/z337
m/z205
337262
129
inte
nsity
m/z 35085
inte
nsity
m/z 35085
147
217205
103
337262
129
inte
nsity
m/z 35085
inte
nsity
m/z 35085
147
217205
103
Fig. 1. Mass spectral deconvolution for comparison of blood plasma metabolite profiles. Left panel: total ion chromatogram (TIC) overlay of two profiles revealing differences in regulation. Mid panel: enlarged view of ion trace chromatograms for dotted TIC blood profile. Right panel: spectra are automatically deconvoluted despite dense co-elution of stearic (m/z 341), oleic (m/z 339) and linoleic acid (m/z 337), even for low abundant compounds like an unknown sugar alcohol at 829 s (m/z 205).
Fiehn and Kind: Metabolite profiling in blood plasma
18
535
540
Fig. 2 Data analysis flowchart after mass spectrometric recording of blood profiles. (a) Select optimal quantifier ions (b) Export peak areas or peak heights from multiple samples to receive a data matrix (c ) normalize and transform data by e.g. vector normalization or z-transformation (d) structure data according to ‚hypotheses‘ or background data such as ‚survival rate‘ (e) get significance and hidden data structures by univariate and multivariate statistics (f) interpret findings, generate new hypotheses, verify new hypotheses by better experiments.
classes
m/z 133m/z
204
m/z 131
m/z 129
m/z 374
m/z 368
metabolites
sam
ples
metabolites
sam
ples
sam
ples
hypotheses
data
experimentsin
terp
reta
tion
(a) (b) (c)
(d)
(e)(f)
ret.time ret.time
inte
nsity
inte
nsity
classes
m/z 133m/z
204
m/z 131
m/z 129
m/z 374
m/z 368
metabolites
sam
ples
metabolites
sam
ples
metabolites
sam
ples
metabolites
sam
ples
sam
ples
sam
ples
hypotheses
data
experimentsin
terp
reta
tion
(a) (b) (c)
(d)
(e)(f)
ret.time ret.time
inte
nsity
inte
nsity
Fiehn and Kind: Metabolite profiling in blood plasma
19
References
1. Fiehn, O. (2002) Metabolomics – the link between genotypes and phenotypes. Plant
Mol. Biol. 48, 155-171. 2. Krull, I.S. and Swartz, M. (1999) Analytical method development and validation for
the academic researcher. Anal. Lett. 32,1067-1080. 3 . Weckwerth, W., Wenzel, K. and Fiehn, O. (2004) Process for the integrated
extraction, identification and quantification of metabolites, proteins and RNA to reveal their co-regulation in biochemical networks. Proteomics 4, 78-83.
4 Stein, S.E. (1999) An integrated method for spectrum extraction and compound identification from gas chromatography/mass spectrometry data. J. Am. Soc. Mass. Spectrom. 10, 770-781
5. Oehme, M. (1998) Practical Introduction to GC-MS Analysis with Quadrupoles, 1st ed. Hüthig, Heidelberg, Germany.