Metabolism and Disposition of the Hepatitis C Protease...
10
1521-009X/44/8/1164–1173$25.00 http://dx.doi.org/10.1124/dmd.115.067488 DRUG METABOLISM AND DISPOSITION Drug Metab Dispos 44:1164–1173, August 2016 Copyright ª 2016 by The American Society for Pharmacology and Experimental Therapeutics Metabolism and Disposition of the Hepatitis C Protease Inhibitor Paritaprevir in Humans s Jianwei Shen, Michael Serby, Aimee Reed, Anthony J. Lee, Xiaomei Zhang, Kennan Marsh, Amit Khatri, Rajeev Menon, Olga Kavetskaia, 1 and Volker Fischer Drug Metabolism and Pharmacokinetics, Research & Development (J.S., M.S., A.J.L., X.Z., V.F.), Process Chemistry (A.R.), Drug Analysis (O.K.), Exploratory Science (K.M.), CPPM-Clinical PK/PD (A.K., R.M.), AbbVie, North Chicago, Illinois 60064 Received April 28, 2016; accepted May 11, 2016 ABSTRACT Paritaprevir (also known as ABT-450), a potent NS3-4A serine protease inhibitor [identified by AbbVie (North Chicago, IL) and Enanta Pharma- ceuticals (Watertown, MA)] of the hepatitis C virus (HCV), has been developed in combination with ombitasvir and dasabuvir in a three– direct-acting antiviral agent (DAA) oral regimen for the treatment of patients infected with HCV genotype 1. This article describes the mass balance, metabolism, and disposition of paritaprevir in humans. After the administration of a single 200-mg oral dose of [ 14 C]paritaprevir coadministered with 100 mg of ritonavir to four male healthy volun- teers, the mean total percentage of the administered radioactive dose recovered was 96.5%, with recovery in individual subjects rang- ing from 96.0% to 96.9%. Radioactivity derived from [ 14 C]paritaprevir was primarily eliminated in feces (87.8% of the dose). Radioactivity recovered in urine accounted for 8.8% of the dose. The biotransformation of paritaprevir in humans involves: 1) P450-mediated oxidation on the olefinic linker, the phenanthridine group, the methylpyrazinyl group, or combinations thereof; and 2) amide hydrolysis at the acyl cyclopropane-sulfonamide moiety and the pyrazine-2-carboxamide moiety. Paritaprevir was the major component in plasma [90.1% of total radioactivity in plasma, AUC from time 0 to 12 hours (AUC 0–12hours ) pool]. Five minor metabolites were identified in plasma, including the metab- olites M2, M29, M3, M13, and M6; none of the metabolites accounted for greater than 10% of the total radioactivity. Paritaprevir was primarily eliminated through the biliary-fecal route followed by microflora- mediated sulfonamide hydrolysis to M29 as a major component in feces (approximately 60% of dose). In summary, the biotransformation and clearance pathways of paritaprevir were characterized, and the struc- tures of metabolites in circulation and excreta were elucidated. Introduction Hepatitis C virus (HCV) is a virus that is a common cause of viral hepatitis. Untreated HCV can lead to chronic liver disease, including cirrhosis, organ failure, and liver cancer. An estimated 150–170 million people worldwide are chronically infected with HCV and have an increased risk of the development of liver cirrhosis or liver cancer (Lavanchy, 2011; Mohd Hanafiah et al., 2013). Genotype 1 is the most prevalent genotype in the United States, Europe, and Japan, and globally accounts for approximately 60% of HCV infections (Zein, 2000). HCV is an enveloped positive-strand RNA virus that replicates primarily in the cytoplasm of hepatocytes. Viral NS3-4A serine protease is a noncovalent heterodimer consisting of a catalytic subunit [the N-terminal one-third of nonstructural (NS) 3 protein] and an activating cofactor (NS4A protein), which is responsible for cleavage of the HCV polyprotein at four sites. HCV NS3-4A protease is essential for the viral replication process (Lin, 2006; Moradpour et al., 2007) and is a validated drug target (McHutchison et al., 2009; Poordad et al., 2011). Paritaprevir is a potent macrocyclic noncovalent peptidomimetic inhibitor [identified by AbbVie (North Chicago, IL) and Enanta Pharmaceuticals (Watertown, MA)] of HCV NS3/4A protease, with 50% effective concentration values of 1.0, 0.21, 5.3, 19, 0.09, and 0.69 nM against stable HCV replicons with NS3 protease from genotypes 1a, 1b, 2a, 3a, 4a, and 6a, respectively (Pilot-Matias et al., 2015). Paritaprevir with ritonavir demonstrated robust in vivo responses with mean maximum decreases in HCV RNA from 3.89 to 4.11 log10 IU/ml after 3-day monotherapy in treatment-naive HCV genotype 1–infected subjects among three dose groups (Lawitz et al., 2010). Paritaprevir with ritonavir has been used in combination with the NS5A inhibitor ombitasvir (formerly known as ABT-267), the non-nucleoside NS5B polymerase inhibitor dasabuvir (formerly known as ABT-333) for treatment with interferon-free DAAs of HCV infection with or without ribavirin (Feld et al., 2014; Kowdley et al., 2014; Zeuzem et al., 2014). Treatment with paritaprevir/r–ombitasvir, and dasabuvir with ribavirin showed higher rates of sustained virologic response among The design, study conduct, and financial support for this study were provided by AbbVie. AbbVie participated in the interpretation of data, writing, review, and approval of publication. All authors are current employees of AbbVie, except for Olga Kavetskaia, who was an AbbVie employee at the time the manuscript was developed. 1 Current affiliation: Global Clinical Pharmacology, Pfizer, Groton, Connecticut. dx.doi.org/10.1124/dmd.115.067488. s This article has supplemental material available at dmd.aspetjournals.org. ABBREVIATIONS: 1-ABT, 1-aminobenzotriazole; ACN, acetonitrile; AUC, area under the curve; AUC 0–last , area under the curve for concentration at time 0 to the last dose; AUC 0–12h , area under the curve from time 0 to 12 hours; CID, collisionally induced dissociation; C max , maximum plasma concentration; DAA, direct-acting antiviral agent; FaSSIF, fasted-state simulated intestinal fluid; FeSSIF, fed-state simulated intestinal fluid; HCV, hepatitis C virus; HPLC, high-performance liquid chromatography; IS, internal standard; LC, liquid chromatography; LSC, liquid scintillation counting; MS, mass spectrometry; MS 2 , tandem mass spectrometry; MS 3 , multistage mass spectrometry; NS, nonstructural protein; P450, cytochrome P450; SIF, simulated intestinal fluid; SPE, solid phase extraction; t 1/2 , half-life; T max , time at which maximum plasma concentration was achieved. 1164 http://dmd.aspetjournals.org/content/suppl/2016/05/13/dmd.115.067488.DC1 Supplemental material to this article can be found at: at ASPET Journals on June 25, 2018 dmd.aspetjournals.org Downloaded from
-
Upload
truongkhue -
Category
Documents
-
view
216 -
download
1
Transcript of Metabolism and Disposition of the Hepatitis C Protease...
1521-009X/44/8/1164–1173$25.00 http://dx.doi.org/10.1124/dmd.115.067488DRUG METABOLISM AND DISPOSITION Drug Metab Dispos 44:1164–1173, August 2016Copyright ª 2016 by The American Society for Pharmacology and Experimental Therapeutics
Metabolism and Disposition of the Hepatitis C Protease InhibitorParitaprevir in Humans s
Jianwei Shen, Michael Serby, Aimee Reed, Anthony J. Lee, Xiaomei Zhang, Kennan Marsh,Amit Khatri, Rajeev Menon, Olga Kavetskaia,1 and Volker Fischer
Drug Metabolism and Pharmacokinetics, Research & Development (J.S., M.S., A.J.L., X.Z., V.F.), Process Chemistry (A.R.), DrugAnalysis (O.K.), Exploratory Science (K.M.), CPPM-Clinical PK/PD (A.K., R.M.), AbbVie, North Chicago, Illinois 60064
Received April 28, 2016; accepted May 11, 2016
ABSTRACT
Paritaprevir (also known as ABT-450), a potent NS3-4A serine proteaseinhibitor [identified by AbbVie (North Chicago, IL) and Enanta Pharma-ceuticals (Watertown, MA)] of the hepatitis C virus (HCV), has beendeveloped in combination with ombitasvir and dasabuvir in a three–direct-acting antiviral agent (DAA) oral regimen for the treatment ofpatients infected with HCV genotype 1. This article describes themassbalance, metabolism, and disposition of paritaprevir in humans. Afterthe administration of a single 200-mg oral dose of [14C]paritaprevircoadministered with 100 mg of ritonavir to four male healthy volun-teers, the mean total percentage of the administered radioactivedose recovered was 96.5%, with recovery in individual subjects rang-ing from 96.0% to 96.9%. Radioactivity derived from [14C]paritaprevirwas primarily eliminated in feces (87.8% of the dose). Radioactivityrecovered in urine accounted for 8.8%of thedose. The biotransformation
of paritaprevir in humans involves: 1) P450-mediated oxidation onthe olefinic linker, the phenanthridine group, the methylpyrazinylgroup, or combinations thereof; and 2) amide hydrolysis at the acylcyclopropane-sulfonamide moiety and the pyrazine-2-carboxamidemoiety. Paritaprevir was themajor component in plasma [90.1% of totalradioactivity in plasma, AUC from time 0 to 12 hours (AUC0–12hours) pool].Five minor metabolites were identified in plasma, including the metab-olitesM2,M29,M3,M13, andM6; none of themetabolites accounted forgreater than 10% of the total radioactivity. Paritaprevir was primarilyeliminated through the biliary-fecal route followed by microflora-mediated sulfonamide hydrolysis toM29 as amajor component in feces(approximately 60% of dose). In summary, the biotransformation andclearance pathways of paritaprevir were characterized, and the struc-tures of metabolites in circulation and excreta were elucidated.
Introduction
Hepatitis C virus (HCV) is a virus that is a common cause of viralhepatitis. Untreated HCV can lead to chronic liver disease, includingcirrhosis, organ failure, and liver cancer. An estimated 150–170 millionpeople worldwide are chronically infected with HCV and have anincreased risk of the development of liver cirrhosis or liver cancer(Lavanchy, 2011; Mohd Hanafiah et al., 2013). Genotype 1 is the mostprevalent genotype in the United States, Europe, and Japan, and globallyaccounts for approximately 60% of HCV infections (Zein, 2000).HCV is an enveloped positive-strand RNA virus that replicates
primarily in the cytoplasm of hepatocytes. Viral NS3-4A serine proteaseis a noncovalent heterodimer consisting of a catalytic subunit [the
N-terminal one-third of nonstructural (NS) 3 protein] and an activatingcofactor (NS4A protein), which is responsible for cleavage of the HCVpolyprotein at four sites. HCV NS3-4A protease is essential for the viralreplication process (Lin, 2006; Moradpour et al., 2007) and is a validateddrug target (McHutchison et al., 2009; Poordad et al., 2011). Paritapreviris a potent macrocyclic noncovalent peptidomimetic inhibitor [identifiedbyAbbVie (NorthChicago, IL) and Enanta Pharmaceuticals (Watertown,MA)] of HCVNS3/4A protease, with 50% effective concentration valuesof 1.0, 0.21, 5.3, 19, 0.09, and 0.69 nM against stableHCV replicons withNS3 protease from genotypes 1a, 1b, 2a, 3a, 4a, and 6a, respectively(Pilot-Matias et al., 2015). Paritaprevir with ritonavir demonstrated robustin vivo responses with mean maximum decreases in HCV RNA from3.89 to 4.11 log10 IU/ml after 3-day monotherapy in treatment-naiveHCV genotype 1–infected subjects among three dose groups (Lawitzet al., 2010). Paritaprevir with ritonavir has been used in combinationwith the NS5A inhibitor ombitasvir (formerly known as ABT-267), thenon-nucleoside NS5B polymerase inhibitor dasabuvir (formerly knownas ABT-333) for treatment with interferon-free DAAs of HCV infectionwith or without ribavirin (Feld et al., 2014; Kowdley et al., 2014; Zeuzemet al., 2014). Treatment with paritaprevir/r–ombitasvir, and dasabuvirwith ribavirin showed higher rates of sustained virologic response among
The design, study conduct, and financial support for this study were providedby AbbVie. AbbVie participated in the interpretation of data, writing, review, andapproval of publication. All authors are current employees of AbbVie, except forOlga Kavetskaia, who was an AbbVie employee at the time the manuscript wasdeveloped.
1Current affiliation: Global Clinical Pharmacology, Pfizer, Groton, Connecticut.dx.doi.org/10.1124/dmd.115.067488.s This article has supplemental material available at dmd.aspetjournals.org.
ABBREVIATIONS: 1-ABT, 1-aminobenzotriazole; ACN, acetonitrile; AUC, area under the curve; AUC0–last, area under the curve for concentration attime 0 to the last dose; AUC0–12h, area under the curve from time 0 to 12 hours; CID, collisionally induced dissociation; Cmax, maximum plasmaconcentration; DAA, direct-acting antiviral agent; FaSSIF, fasted-state simulated intestinal fluid; FeSSIF, fed-state simulated intestinal fluid; HCV,hepatitis C virus; HPLC, high-performance liquid chromatography; IS, internal standard; LC, liquid chromatography; LSC, liquid scintillationcounting; MS, mass spectrometry; MS2, tandem mass spectrometry; MS3, multistage mass spectrometry; NS, nonstructural protein; P450,cytochrome P450; SIF, simulated intestinal fluid; SPE, solid phase extraction; t1/2, half-life; Tmax, time at which maximum plasma concentration wasachieved.
1164
http://dmd.aspetjournals.org/content/suppl/2016/05/13/dmd.115.067488.DC1Supplemental material to this article can be found at:
at ASPE
T Journals on June 25, 2018
dmd.aspetjournals.org
Dow
nloaded from
patients with genotype 1a infection compared with that in the ribavirin-free group (Ferenci et al., 2014).Paritaprevir is metabolized primarily by CYP3A4 (Bernstein et al.,
2009). To mitigate the high first-pass and hepatic elimination, paritapreviris coadministered with a low dose of ritonavir, a potent P450 andefflux transport inhibitor, as a boosting agent to improve systemicexposure. Clinical results confirmed that coadministration of ritonavirincreases paritaprevir plasma levels and half-life (t1/2), permitting once-daily dosing (Menon et al., 2009). A 100-mg ritonavir dose was found tobe optimal for increasing paritaprevir exposure without negativelyimpacting the safety profile (Menon et al., 2016). The pharmacokineticsof paritaprevir increased in a greater than dose-proportional fashion andshowed a 2- to 3-fold accumulation after multiple dosing (Bernsteinet al., 2009). Paritaprevir was shown to be safe and well tolerated withminimal side effects in genotype 1 HCV-infected treatment-naivesubjects (Lawitz et al., 2010). This report describes the metabolism anddisposition of a single 200-mg oral dose of [14C]paritaprevir, coad-ministered with a single 100-mg oral dose of ritonavir, in healthyhuman subjects. The purpose of this study was to determine the massbalance, elucidate the routes and rates of excretion, and determine theurine and fecal recovery of radioactivity. The study also intended toidentify the circulating metabolites in human plasma, elucidate themetabolite structures, determine the metabolite profiles in excreta, andunderstand the metabolic pathway of paritaprevir in humans. Mecha-nistic assessment of the formation of paritaprevir metabolites in vitrowas also conducted and discussed.
Materials and Methods
Drugs and Reagents
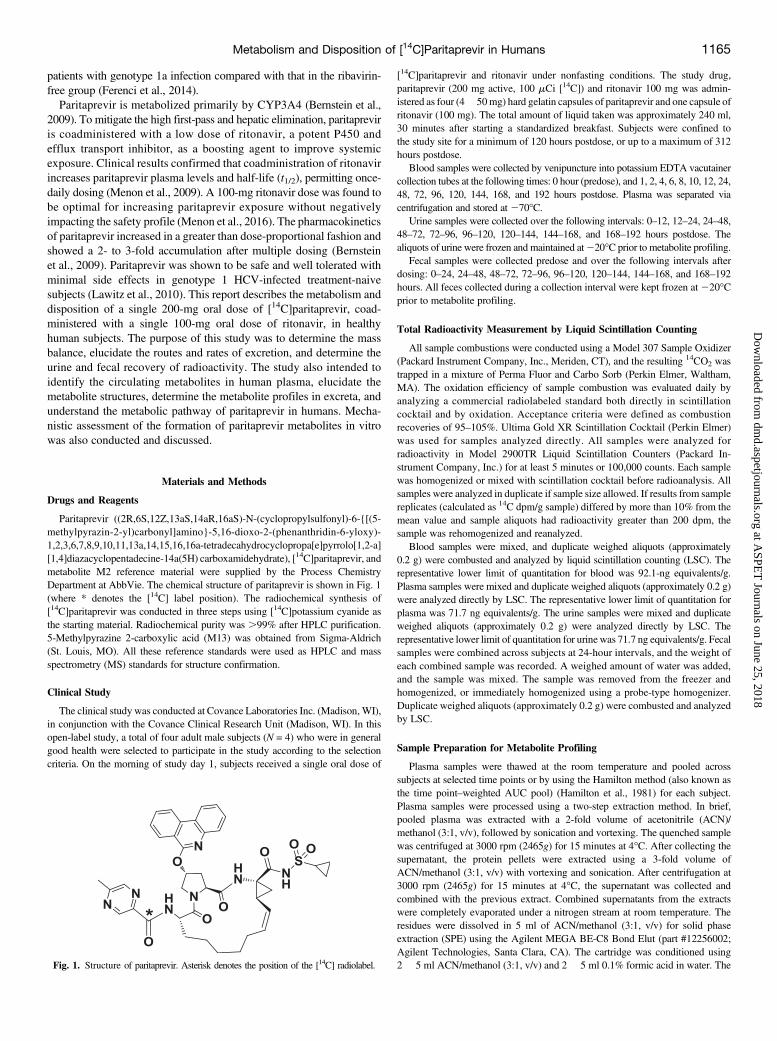
Paritaprevir ((2R,6S,12Z,13aS,14aR,16aS)-N-(cyclopropylsulfonyl)-6-{[(5-methylpyrazin-2-yl)carbonyl]amino}-5,16-dioxo-2-(phenanthridin-6-yloxy)-1,2,3,6,7,8,9,10,11,13a,14,15,16,16a-tetradecahydrocyclopropa[e]pyrrolo[1,2-a][1,4]diazacyclopentadecine-14a(5H) carboxamidehydrate), [14C]paritaprevir, andmetabolite M2 reference material were supplied by the Process ChemistryDepartment at AbbVie. The chemical structure of paritaprevir is shown in Fig. 1(where * denotes the [14C] label position). The radiochemical synthesis of[14C]paritaprevir was conducted in three steps using [14C]potassium cyanide asthe starting material. Radiochemical purity was .99% after HPLC purification.5-Methylpyrazine 2-carboxylic acid (M13) was obtained from Sigma-Aldrich(St. Louis, MO). All these reference standards were used as HPLC and massspectrometry (MS) standards for structure confirmation.
Clinical Study
The clinical study was conducted at Covance Laboratories Inc. (Madison, WI),in conjunction with the Covance Clinical Research Unit (Madison, WI). In thisopen-label study, a total of four adult male subjects (N = 4) who were in generalgood health were selected to participate in the study according to the selectioncriteria. On the morning of study day 1, subjects received a single oral dose of
[14C]paritaprevir and ritonavir under nonfasting conditions. The study drug,paritaprevir (200 mg active, 100 mCi [14C]) and ritonavir 100 mg was admin-istered as four (4� 50mg) hard gelatin capsules of paritaprevir and one capsule ofritonavir (100 mg). The total amount of liquid taken was approximately 240 ml,30 minutes after starting a standardized breakfast. Subjects were confined tothe study site for a minimum of 120 hours postdose, or up to a maximum of 312hours postdose.
Blood samples were collected by venipuncture into potassium EDTA vacutainercollection tubes at the following times: 0 hour (predose), and 1, 2, 4, 6, 8, 10, 12, 24,48, 72, 96, 120, 144, 168, and 192 hours postdose. Plasma was separated viacentrifugation and stored at 270�C.
Urine samples were collected over the following intervals: 0–12, 12–24, 24–48,48–72, 72–96, 96–120, 120–144, 144–168, and 168–192 hours postdose. Thealiquots of urine were frozen and maintained at220�C prior to metabolite profiling.
Fecal samples were collected predose and over the following intervals afterdosing: 0–24, 24–48, 48–72, 72–96, 96–120, 120–144, 144–168, and 168–192hours. All feces collected during a collection interval were kept frozen at220�Cprior to metabolite profiling.
Total Radioactivity Measurement by Liquid Scintillation Counting
All sample combustions were conducted using a Model 307 Sample Oxidizer(Packard Instrument Company, Inc., Meriden, CT), and the resulting 14CO2 wastrapped in a mixture of Perma Fluor and Carbo Sorb (Perkin Elmer, Waltham,MA). The oxidation efficiency of sample combustion was evaluated daily byanalyzing a commercial radiolabeled standard both directly in scintillationcocktail and by oxidation. Acceptance criteria were defined as combustionrecoveries of 95–105%. Ultima Gold XR Scintillation Cocktail (Perkin Elmer)was used for samples analyzed directly. All samples were analyzed forradioactivity in Model 2900TR Liquid Scintillation Counters (Packard In-strument Company, Inc.) for at least 5 minutes or 100,000 counts. Each samplewas homogenized or mixed with scintillation cocktail before radioanalysis. Allsamples were analyzed in duplicate if sample size allowed. If results from samplereplicates (calculated as 14C dpm/g sample) differed by more than 10% from themean value and sample aliquots had radioactivity greater than 200 dpm, thesample was rehomogenized and reanalyzed.
Blood samples were mixed, and duplicate weighed aliquots (approximately0.2 g) were combusted and analyzed by liquid scintillation counting (LSC). Therepresentative lower limit of quantitation for blood was 92.1-ng equivalents/g.Plasma samples were mixed and duplicate weighed aliquots (approximately 0.2 g)were analyzed directly by LSC. The representative lower limit of quantitation forplasma was 71.7 ng equivalents/g. The urine samples were mixed and duplicateweighed aliquots (approximately 0.2 g) were analyzed directly by LSC. Therepresentative lower limit of quantitation for urine was 71.7 ng equivalents/g. Fecalsamples were combined across subjects at 24-hour intervals, and the weight ofeach combined sample was recorded. A weighed amount of water was added,and the sample was mixed. The sample was removed from the freezer andhomogenized, or immediately homogenized using a probe-type homogenizer.Duplicate weighed aliquots (approximately 0.2 g) were combusted and analyzedby LSC.
Sample Preparation for Metabolite Profiling
Plasma samples were thawed at the room temperature and pooled acrosssubjects at selected time points or by using the Hamilton method (also known asthe time point–weighted AUC pool) (Hamilton et al., 1981) for each subject.Plasma samples were processed using a two-step extraction method. In brief,pooled plasma was extracted with a 2-fold volume of acetonitrile (ACN)/methanol (3:1, v/v), followed by sonication and vortexing. The quenched samplewas centrifuged at 3000 rpm (2465g) for 15 minutes at 4�C. After collecting thesupernatant, the protein pellets were extracted using a 3-fold volume ofACN/methanol (3:1, v/v) with vortexing and sonication. After centrifugation at3000 rpm (2465g) for 15 minutes at 4�C, the supernatant was collected andcombined with the previous extract. Combined supernatants from the extractswere completely evaporated under a nitrogen stream at room temperature. Theresidues were dissolved in 5 ml of ACN/methanol (3:1, v/v) for solid phaseextraction (SPE) using the Agilent MEGA BE-C8 Bond Elut (part #12256002;Agilent Technologies, Santa Clara, CA). The cartridge was conditioned using2 � 5 ml ACN/methanol (3:1, v/v) and 2 � 5 ml 0.1% formic acid in water. TheFig. 1. Structure of paritaprevir. Asterisk denotes the position of the [14C] radiolabel.
Metabolism and Disposition of [14C]Paritaprevir in Humans 1165
at ASPE
T Journals on June 25, 2018
dmd.aspetjournals.org
Dow
nloaded from
cartridge was prefilled with 4.5 ml of deionized water with the stopcock closedand 0.5 ml of the extracted sample was loaded, mixing well before opening thestopcock to initiate the flow through the cartridge. Once the sample was loaded,the process was repeated until all the extracted sample was loaded to the column.The cartridgewas washedwith 5ml of deionized water, and the sample was elutedwith 3 � 5 ml ACN/methanol (3:1, v/v). The eluent was evaporated to drynessunder a nitrogen stream at room temperature, and the residue was reconstituted in75ml of ACN/methanol (3:1, v/v), dilutedwith 150ml of water beforeHPLC-MS-radiochemical detection analysis. An aliquot of the reconstituted sample wassubjected to LSC counting to determine the total radioactivity recovery. The meanradioactivity recovery in the processed plasma samples was about 83%.
Pooled urine was extracted using SPE. In brief, an SPE cartridge (PhenomenexStrata X-AW 33 m Polymeric Weak Anion, 1 g/12 ml, part #8B-S038-HDG;Phenomenex, Torrance, CA) was conditionedwith 15 ml of methanol and 15 ml ofdeionized water. Aliquots of pooled urine were loaded to the preconditionedcolumn, followed by washing with 10 ml of 10 mM ammonium acetate buffersolution. The elution was achieved by using 4 � 5 ml 0.1% formic acid inACN/methanol (3:1, v/v). The eluent was dried down under the nitrogen stream atroom temperature. The residue was reconstituted in initial mobile phase for HPLC-MS-radiodetection analysis. The overall extraction recovery was about 88%.
Pooled fecal samples were processed using multiple solvent extractionswith ACN/methanol (3:1, v/v) using a 1:3 sample/solvent ratio, followed bycentrifugation at 4000 rpm (3220g) for 20 minutes at 4�C. The repeatedextraction was stopped when either 80% of the radioactivity had been recoveredor until less than 2% of the radioactivity was extracted. Aliquots of extractedsamples were subjected to LSC counting for total radioactivity. The extract wasdried down under the nitrogen stream at room temperature, and the final residueswere reconstituted in initial mobile phase for liquid chromatography (LC)-MS-radiodetection analysis. An aliquot of the reconstituted solution was subject toLSC radiocounting for extraction recovery calculation. The overall extractionrecovery for fecal sample was about 92%.
Method for Metabolite Profiles and Identification
HPLC separation of paritaprevir and metabolites was conducted using aThermo Accela UHPLC system (Thermo Fisher, San Jose, CA), which consistedof an UHPLC autosampler, a 1250 Series binary pump, and an Accela PDAdetector. Separation was achieved at room temperature on a Phenomenex SynergyPolar-RP 4 mm, 80 A, 4.6 � 150 mm HPLC column. The HPLC mobile phaseconsisted of 10 mM ammonium formate (adjusted to pH 3.1 with formic acid)(solvent A) and 100% ACN (solvent B), and the flow rate was maintained at1.0 ml/min. The gradient was as follows: 0–2 minutes, 20% solvent B; 2–60 minutes, 20–73% solvent B; 60–63 minutes, 73–95% solvent B; 63–63.5 minutes, 95–20% solvent B; 63.5–68 minutes, 20% solvent B. The UHPLCsystem was interfaced with a Thermo Fisher Orbitrap Discovery MassSpectrometer (ThermoFisher Scientific Waltham, MA). The MS analyses wereconducted using electrospray ionization operated in positive ionizationmode. TheMS settings were as follows: electrospray ionization voltage, 4.0 kV; capillarytemperature, 300�C; capillary voltage, 2 V; and tube lens, 105 V. The sheath gaswas set to 35.0 arbitrary units, and auxiliary gas to 10 arbitrary units. Theunchanged parent drug and its metabolites were detected using data-dependent,multiple-stagemass analysis withmass isolation of 2 Da, and normalized collisionenergy of 35% for both tandem MS (MS2) and multistage MS (MS3). The massresolution was set for 30,000 for full scan and 7500 for MS2 and MS3 scans.Accurate mass measurement was obtained using daily external calibration. Dataacquisition and processing were carried out using Xcalibur 2.2 (ThermoFisherScientific).
Radiolabeled components in plasma, urine, or feces samples were detected by aPerkinElmer TopCount 96 Deep Well Luma Plate (PerkinElmer, Waltham, MA).The HPLC eluent was split postcolumn between the mass spectrometer andAgilent 1100 Fraction Collector (Agilent Technologies, Wilmington, DE) at aratio of 20:80. The Agilent 1100 Fraction Collector was set at a 0.3-minuteinterval per well collection. Radioactivity counting was conducted using thePerkinElmer TopCount NXT System.
Quantitation of Metabolite M2 in Human Plasma
A single liquid-liquid extraction with a mixture of ethyl acetate and hexane wasused to extract the compounds of interest from plasma. An aliquot of plasma
(200ml, sample or spiked standard) was combined with 50ml of internal standard(IS) [(1S,3S,4S)-1-benzyl-4-{(S)-2-[3-cyclopropyl-3-(2-isopropyl-thiazol-4-ylmethyl)-ureido]-3-methyl-butyrylamino}-3-hydroxy-5-phenyl-pentyl)-carbamicacid thiazol-5-ylmethyl ester] in ethanol/water mixture (50:50, v/v). After a briefmixing, 850 ml of ethyl acetate and hexane (9:1, by volume) was added to thesample. After mixing and centrifugation, 500 ml of the organic extract wastransferred to a clean 96-well plate and evaporated to dryness under a stream of drynitrogen at room temperature. The samples were reconstituted with 300 ml ofmobile phase for LC-MS analysis.
M2 and IS were separated on a 50 � 3 mm 2.7-mm Ascentis Express C18(Supelco, Bellefonte, PA) columnwith anACN0.1% aqueous formic acidmobilephase containing 0.025% trifluoroacetic acid (;60:40, by volume) at a flow rateof 0.6 ml/min. Analysis was performed on a Sciex API 3000 Triple-QuadrupoleMass Spectrometer with a turbo-ionspray interface (Sciex, Framingham, MA).Analytes were ionized in the positive ion mode with a source temperature ofapproximately 450�C. Detection was in the multiple reaction monitoring mode atm/z 782.3→ 587.2 forM2 andm/z 747.3→ 322 for IS.M2 and IS peak areas weredetermined using Sciex TurboQuan SOFTWARE. The plasma drug concentrationof each sample was calculated by least-squares linear regression analysis of thepeak area ratio (parent/IS) of the spiked plasma standards versus concentration.
Pharmacokinetic Calculations
Plasma concentration-time radioactivity data were analyzed with SAS software(version 9.2; SAS Institute Inc., Cary, NC). Maximum plasma concentration(Cmax), the time at which Cmax was achieved (Tmax), concentration-time AUCfrom time 0 to the last measurable time point for total radioactivity, [14C]-paritaprevir, ritonavir and its metabolites in plasma were estimated. AUC fromtime 0 to infinity, t1/2 for total radioactivity, and [
14C]paritaprevir in plasma werealso calculated.
In Vitro Studies
Human Fecal Incubations. Fresh fecal samples were collected from twohealthy male subjects. Aliquots of the specimen (approximately 1 g) were placedinto preweighted 15-ml centrifuge tubes with screw caps. The sample tubes werekept in an AnaeroPouch (Mitsubishi Gas Chemical Company, Tokyo, Japan)(Delaney and Onderdonk, 1997; Van Horn et al., 1997) with a PouchAnaeroAnaerobic Gas Generating System and an RT AnaeroIndicator (Mitsubishi GasChemical Company) before transferring to a CO2-filled AldrichAtmosBag (glovebag; Sigma-Aldrich) that was connected to a CO2 cylinder to create an anaerobicenvironment. An RT AnaeroIndicator was placed inside the bag to monitor theanaerobic conditions. Dulbecco’s phosphate-buffered saline was degassed bybubbling nitrogen gas through the solution overnight. The fecal samples werediluted with the Dulbecco’s phosphate-buffered saline to a concentration of;100 mg/ml under a CO2 atmosphere. The samples were mixed by vortexing tobreak up solid matter. An aliquot of fecal homogenate (1.5 ml) was added to the2-ml Corning cryogenic vials containing [14C]paritaprevir and ritonavir at thefinal concentrations of 20 mM paritaprevir and 10 mM ritonavir. The vials werecapped, vortexed, and placed in an AnaeroPouch with a PouchAnaero anaerobicgas-generating system and an RT AnaeroIndicator. The pouches were sealedbefore being removed from the glove bag. The pouches containing sample vialswere placed in a 37�C water bath for 6-, 24-, and 48-hour. Anaerobic conditionswere maintained throughout the study as monitored by the RT AnaeroIndicator.At the end of the incubation, the sample was mixed with 1.5 ml of ACN/methanol(3:1, v/v). After centrifugation, aliquots of supernatants were injected for HLPC-radioflow analysis or HPLC-MS-radiodetection analysis.
Incubations in Human Hepatocytes. The cryopreserved hepatocytes (10-donor pool) were obtained from Celsis In Vitro Inc. (lot #VRR; Baltimore, MD).The hepatocyte suspension was diluted to 500,000 viable cells/ml. Theincubations were conducted with or without chemical inhibitors. For theincubations with inhibitors, either ritonavir or 1-ABT was added to 0.5 mlof the diluted hepatocyte suspensions, at a final concentration of 1 mM or 1 mMfor ritonavir or 1-ABT, respectively. The plates were incubated for 30 minutes at37�C. [14C]Paritaprevir was then added to the pretreated hepatocyte suspensionsolution, at a final concentration of 1 mM, and incubated for 4 and 24 hours at37�C. At the end of incubation, a 1-ml mixture of ACN/ethanol (50/50, v/v) wasadded to quench the reaction. Solutions were mixed thoroughly, spun down, andstored at 220�C until analysis.
1166 Shen et al.
at ASPE
T Journals on June 25, 2018
dmd.aspetjournals.org
Dow
nloaded from
Incubations in Simulated Intestinal Fluids. The simulated intestinal fluids(SIFs) were prepared by dissolving SIF power (Biorelevant, Croydon Surrey, UK)into A phosphate-buffered solution (pH 6.52) for fasted-state SIF (FaSSIF), orinto a phosphate-buffered solution (pH 5.00) for fed-state SIF (FeSSIF). [14C]Paritaprevir was added to the FaSSIF or FeSSIF solutions to a final concentrationof 10mM. The solutions were incubated for 4, 8, and 24 hours at 37�C; aliquots ofthe solutions were subjected to HPLC-radioflow analysis.
Results
Excretion of Radioactivity
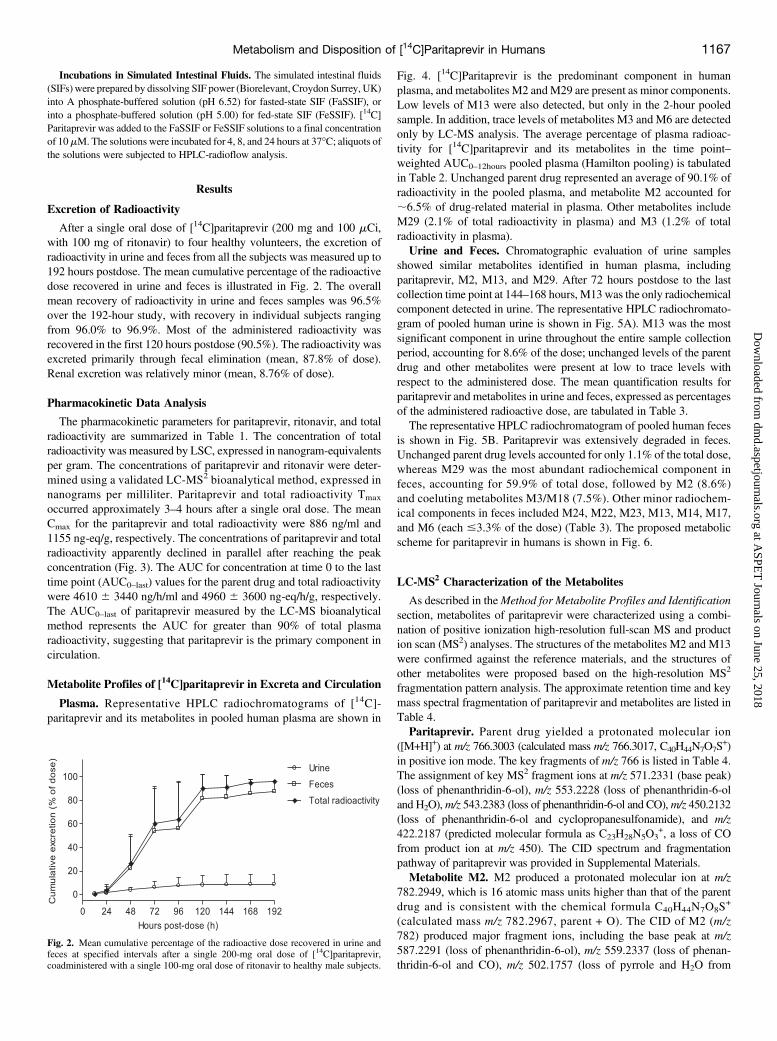
After a single oral dose of [14C]paritaprevir (200 mg and 100 mCi,with 100 mg of ritonavir) to four healthy volunteers, the excretion ofradioactivity in urine and feces from all the subjects was measured up to192 hours postdose. The mean cumulative percentage of the radioactivedose recovered in urine and feces is illustrated in Fig. 2. The overallmean recovery of radioactivity in urine and feces samples was 96.5%over the 192-hour study, with recovery in individual subjects rangingfrom 96.0% to 96.9%. Most of the administered radioactivity wasrecovered in the first 120 hours postdose (90.5%). The radioactivity wasexcreted primarily through fecal elimination (mean, 87.8% of dose).Renal excretion was relatively minor (mean, 8.76% of dose).
Pharmacokinetic Data Analysis
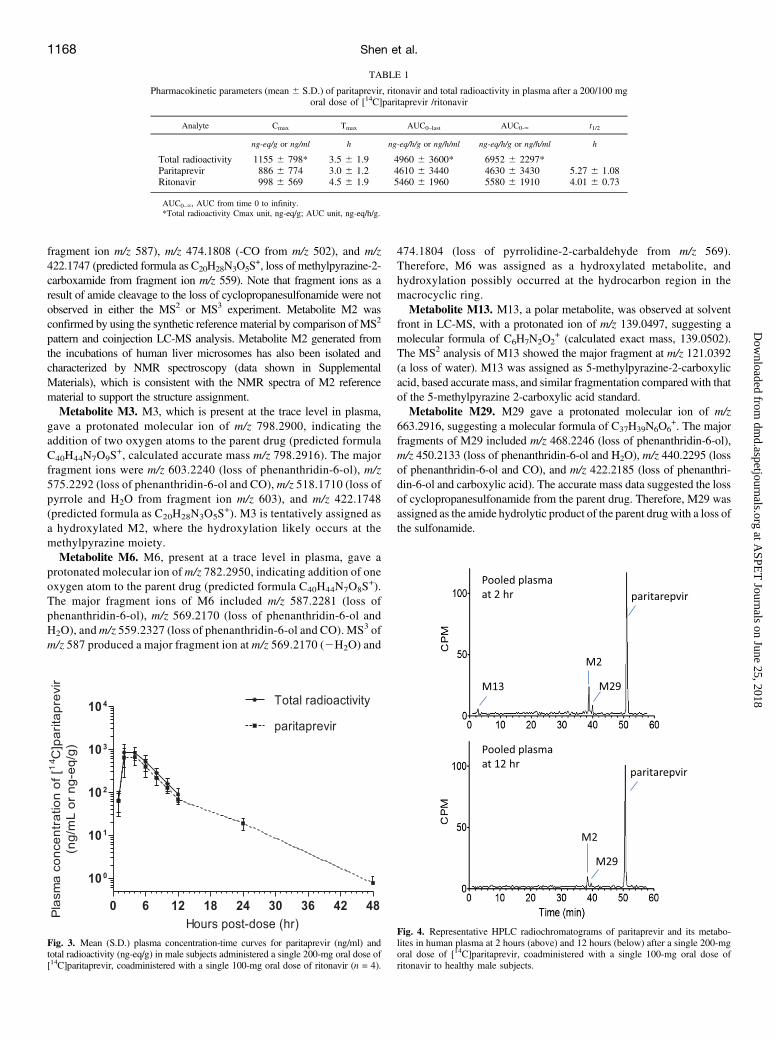
The pharmacokinetic parameters for paritaprevir, ritonavir, and totalradioactivity are summarized in Table 1. The concentration of totalradioactivity was measured by LSC, expressed in nanogram-equivalentsper gram. The concentrations of paritaprevir and ritonavir were deter-mined using a validated LC-MS2 bioanalytical method, expressed innanograms per milliliter. Paritaprevir and total radioactivity Tmax
occurred approximately 3–4 hours after a single oral dose. The meanCmax for the paritaprevir and total radioactivity were 886 ng/ml and1155 ng-eq/g, respectively. The concentrations of paritaprevir and totalradioactivity apparently declined in parallel after reaching the peakconcentration (Fig. 3). The AUC for concentration at time 0 to the lasttime point (AUC0–last) values for the parent drug and total radioactivitywere 4610 6 3440 ng/h/ml and 4960 6 3600 ng-eq/h/g, respectively.The AUC0–last of paritaprevir measured by the LC-MS bioanalyticalmethod represents the AUC for greater than 90% of total plasmaradioactivity, suggesting that paritaprevir is the primary component incirculation.
Metabolite Profiles of [14C]paritaprevir in Excreta and Circulation
Plasma. Representative HPLC radiochromatograms of [14C]-paritaprevir and its metabolites in pooled human plasma are shown in
Fig. 4. [14C]Paritaprevir is the predominant component in humanplasma, and metabolites M2 andM29 are present as minor components.Low levels of M13 were also detected, but only in the 2-hour pooledsample. In addition, trace levels of metabolites M3 and M6 are detectedonly by LC-MS analysis. The average percentage of plasma radioac-tivity for [14C]paritaprevir and its metabolites in the time point–weighted AUC0–12hours pooled plasma (Hamilton pooling) is tabulatedin Table 2. Unchanged parent drug represented an average of 90.1% ofradioactivity in the pooled plasma, and metabolite M2 accounted for;6.5% of drug-related material in plasma. Other metabolites includeM29 (2.1% of total radioactivity in plasma) and M3 (1.2% of totalradioactivity in plasma).Urine and Feces. Chromatographic evaluation of urine samples
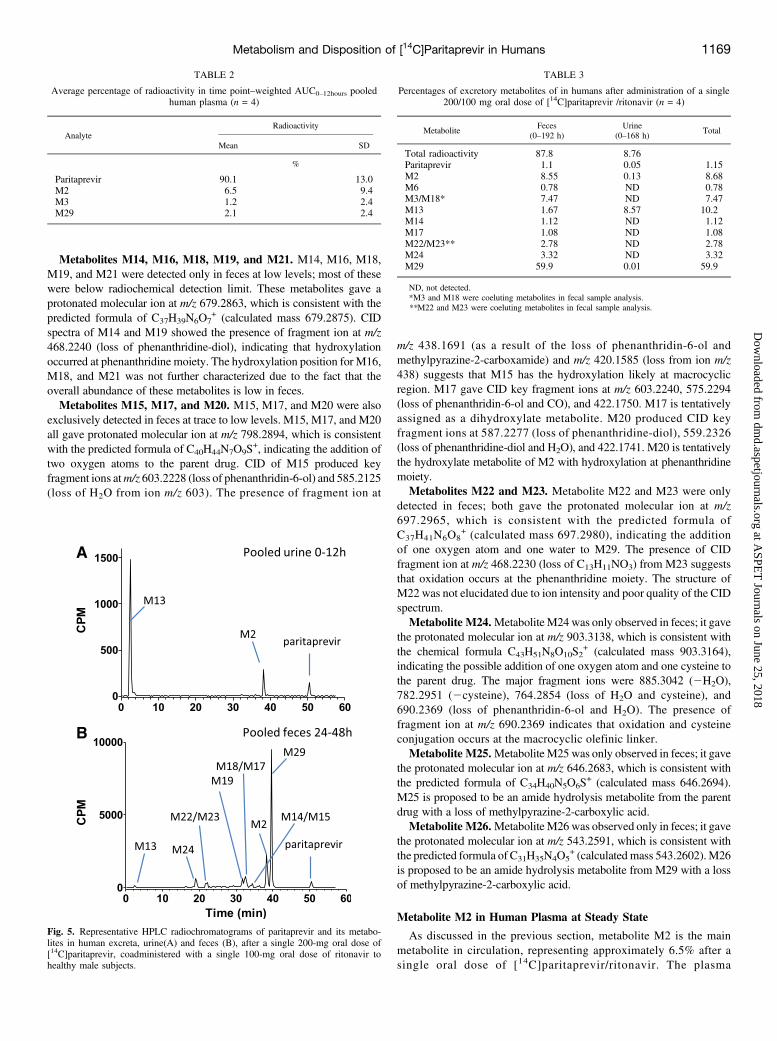
showed similar metabolites identified in human plasma, includingparitaprevir, M2, M13, and M29. After 72 hours postdose to the lastcollection time point at 144–168 hours, M13 was the only radiochemicalcomponent detected in urine. The representative HPLC radiochromato-gram of pooled human urine is shown in Fig. 5A). M13 was the mostsignificant component in urine throughout the entire sample collectionperiod, accounting for 8.6% of the dose; unchanged levels of the parentdrug and other metabolites were present at low to trace levels withrespect to the administered dose. The mean quantification results forparitaprevir and metabolites in urine and feces, expressed as percentagesof the administered radioactive dose, are tabulated in Table 3.The representative HPLC radiochromatogram of pooled human feces
is shown in Fig. 5B. Paritaprevir was extensively degraded in feces.Unchanged parent drug levels accounted for only 1.1% of the total dose,whereas M29 was the most abundant radiochemical component infeces, accounting for 59.9% of total dose, followed by M2 (8.6%)and coeluting metabolites M3/M18 (7.5%). Other minor radiochem-ical components in feces included M24, M22, M23, M13, M14, M17,and M6 (each #3.3% of the dose) (Table 3). The proposed metabolicscheme for paritaprevir in humans is shown in Fig. 6.
LC-MS2 Characterization of the Metabolites
As described in theMethod for Metabolite Profiles and Identificationsection, metabolites of paritaprevir were characterized using a combi-nation of positive ionization high-resolution full-scan MS and production scan (MS2) analyses. The structures of the metabolites M2 and M13were confirmed against the reference materials, and the structures ofother metabolites were proposed based on the high-resolution MS2
fragmentation pattern analysis. The approximate retention time and keymass spectral fragmentation of paritaprevir and metabolites are listed inTable 4.Paritaprevir. Parent drug yielded a protonated molecular ion
([M+H]+) at m/z 766.3003 (calculated mass m/z 766.3017, C40H44N7O7S+)
in positive ion mode. The key fragments of m/z 766 is listed in Table 4.The assignment of key MS2 fragment ions at m/z 571.2331 (base peak)(loss of phenanthridin-6-ol), m/z 553.2228 (loss of phenanthridin-6-oland H2O),m/z 543.2383 (loss of phenanthridin-6-ol and CO),m/z 450.2132(loss of phenanthridin-6-ol and cyclopropanesulfonamide), and m/z422.2187 (predicted molecular formula as C23H28N5O3
+, a loss of COfrom product ion at m/z 450). The CID spectrum and fragmentationpathway of paritaprevir was provided in Supplemental Materials.Metabolite M2. M2 produced a protonated molecular ion at m/z
782.2949, which is 16 atomic mass units higher than that of the parentdrug and is consistent with the chemical formula C40H44N7O8S
+
(calculated mass m/z 782.2967, parent + O). The CID of M2 (m/z782) produced major fragment ions, including the base peak at m/z587.2291 (loss of phenanthridin-6-ol), m/z 559.2337 (loss of phenan-thridin-6-ol and CO), m/z 502.1757 (loss of pyrrole and H2O from
Fig. 2. Mean cumulative percentage of the radioactive dose recovered in urine andfeces at specified intervals after a single 200-mg oral dose of [14C]paritaprevir,coadministered with a single 100-mg oral dose of ritonavir to healthy male subjects.
Metabolism and Disposition of [14C]Paritaprevir in Humans 1167
at ASPE
T Journals on June 25, 2018
dmd.aspetjournals.org
Dow
nloaded from
fragment ion m/z 587), m/z 474.1808 (-CO from m/z 502), and m/z422.1747 (predicted formula as C20H28N3O5S
+, loss of methylpyrazine-2-carboxamide from fragment ion m/z 559). Note that fragment ions as aresult of amide cleavage to the loss of cyclopropanesulfonamide were notobserved in either the MS2 or MS3 experiment. Metabolite M2 wasconfirmed by using the synthetic reference material by comparison ofMS2
pattern and coinjection LC-MS analysis. Metabolite M2 generated fromthe incubations of human liver microsomes has also been isolated andcharacterized by NMR spectroscopy (data shown in SupplementalMaterials), which is consistent with the NMR spectra of M2 referencematerial to support the structure assignment.Metabolite M3. M3, which is present at the trace level in plasma,
gave a protonated molecular ion of m/z 798.2900, indicating theaddition of two oxygen atoms to the parent drug (predicted formulaC40H44N7O9S
+, calculated accurate mass m/z 798.2916). The majorfragment ions were m/z 603.2240 (loss of phenanthridin-6-ol), m/z575.2292 (loss of phenanthridin-6-ol and CO), m/z 518.1710 (loss ofpyrrole and H2O from fragment ion m/z 603), and m/z 422.1748(predicted formula as C20H28N3O5S
+). M3 is tentatively assigned asa hydroxylated M2, where the hydroxylation likely occurs at themethylpyrazine moiety.Metabolite M6. M6, present at a trace level in plasma, gave a
protonated molecular ion of m/z 782.2950, indicating addition of oneoxygen atom to the parent drug (predicted formula C40H44N7O8S
+).The major fragment ions of M6 included m/z 587.2281 (loss ofphenanthridin-6-ol), m/z 569.2170 (loss of phenanthridin-6-ol andH2O), andm/z 559.2327 (loss of phenanthridin-6-ol and CO). MS3 ofm/z 587 produced a major fragment ion at m/z 569.2170 (2H2O) and
474.1804 (loss of pyrrolidine-2-carbaldehyde from m/z 569).Therefore, M6 was assigned as a hydroxylated metabolite, andhydroxylation possibly occurred at the hydrocarbon region in themacrocyclic ring.Metabolite M13. M13, a polar metabolite, was observed at solvent
front in LC-MS, with a protonated ion of m/z 139.0497, suggesting amolecular formula of C6H7N2O2
+ (calculated exact mass, 139.0502).The MS2 analysis of M13 showed the major fragment at m/z 121.0392(a loss of water). M13 was assigned as 5-methylpyrazine-2-carboxylicacid, based accurate mass, and similar fragmentation compared with thatof the 5-methylpyrazine 2-carboxylic acid standard.Metabolite M29. M29 gave a protonated molecular ion of m/z
663.2916, suggesting a molecular formula of C37H39N6O6+. The major
fragments of M29 included m/z 468.2246 (loss of phenanthridin-6-ol),m/z 450.2133 (loss of phenanthridin-6-ol and H2O), m/z 440.2295 (lossof phenanthridin-6-ol and CO), and m/z 422.2185 (loss of phenanthri-din-6-ol and carboxylic acid). The accurate mass data suggested the lossof cyclopropanesulfonamide from the parent drug. Therefore, M29 wasassigned as the amide hydrolytic product of the parent drug with a loss ofthe sulfonamide.
TABLE 1
Pharmacokinetic parameters (mean 6 S.D.) of paritaprevir, ritonavir and total radioactivity in plasma after a 200/100 mgoral dose of [14C]paritaprevir /ritonavir
Analyte Cmax Tmax AUC0–last AUC0-‘ t1/2
ng-eq/g or ng/ml h ng-eq/h/g or ng/h/ml ng-eq/h/g or ng/h/ml h
Total radioactivity 1155 6 798* 3.5 6 1.9 4960 6 3600* 6952 6 2297*Paritaprevir 886 6 774 3.0 6 1.2 4610 6 3440 4630 6 3430 5.27 6 1.08Ritonavir 998 6 569 4.5 6 1.9 5460 6 1960 5580 6 1910 4.01 6 0.73
AUC0–‘, AUC from time 0 to infinity.*Total radioactivity Cmax unit, ng-eq/g; AUC unit, ng-eq/h/g.
Fig. 3. Mean (S.D.) plasma concentration-time curves for paritaprevir (ng/ml) andtotal radioactivity (ng-eq/g) in male subjects administered a single 200-mg oral dose of[14C]paritaprevir, coadministered with a single 100-mg oral dose of ritonavir (n = 4).
Fig. 4. Representative HPLC radiochromatograms of paritaprevir and its metabo-lites in human plasma at 2 hours (above) and 12 hours (below) after a single 200-mgoral dose of [14C]paritaprevir, coadministered with a single 100-mg oral dose ofritonavir to healthy male subjects.
1168 Shen et al.
at ASPE
T Journals on June 25, 2018
dmd.aspetjournals.org
Dow
nloaded from
Metabolites M14, M16, M18, M19, and M21. M14, M16, M18,M19, and M21 were detected only in feces at low levels; most of thesewere below radiochemical detection limit. These metabolites gave aprotonated molecular ion at m/z 679.2863, which is consistent with thepredicted formula of C37H39N6O7
+ (calculated mass 679.2875). CIDspectra of M14 and M19 showed the presence of fragment ion at m/z468.2240 (loss of phenanthridine-diol), indicating that hydroxylationoccurred at phenanthridine moiety. The hydroxylation position for M16,M18, and M21 was not further characterized due to the fact that theoverall abundance of these metabolites is low in feces.Metabolites M15, M17, and M20. M15, M17, and M20 were also
exclusively detected in feces at trace to low levels. M15, M17, and M20all gave protonated molecular ion at m/z 798.2894, which is consistentwith the predicted formula of C40H44N7O9S
+, indicating the addition oftwo oxygen atoms to the parent drug. CID of M15 produced keyfragment ions atm/z 603.2228 (loss of phenanthridin-6-ol) and 585.2125(loss of H2O from ion m/z 603). The presence of fragment ion at
m/z 438.1691 (as a result of the loss of phenanthridin-6-ol andmethylpyrazine-2-carboxamide) and m/z 420.1585 (loss from ion m/z438) suggests that M15 has the hydroxylation likely at macrocyclicregion. M17 gave CID key fragment ions at m/z 603.2240, 575.2294(loss of phenanthridin-6-ol and CO), and 422.1750. M17 is tentativelyassigned as a dihydroxylate metabolite. M20 produced CID keyfragment ions at 587.2277 (loss of phenanthridine-diol), 559.2326(loss of phenanthridine-diol and H2O), and 422.1741. M20 is tentativelythe hydroxylate metabolite of M2 with hydroxylation at phenanthridinemoiety.Metabolites M22 and M23. Metabolite M22 and M23 were only
detected in feces; both gave the protonated molecular ion at m/z697.2965, which is consistent with the predicted formula ofC37H41N6O8
+ (calculated mass 697.2980), indicating the additionof one oxygen atom and one water to M29. The presence of CIDfragment ion at m/z 468.2230 (loss of C13H11NO3) from M23 suggeststhat oxidation occurs at the phenanthridine moiety. The structure ofM22 was not elucidated due to ion intensity and poor quality of the CIDspectrum.Metabolite M24.Metabolite M24 was only observed in feces; it gave
the protonated molecular ion at m/z 903.3138, which is consistent withthe chemical formula C43H51N8O10S2
+ (calculated mass 903.3164),indicating the possible addition of one oxygen atom and one cysteine tothe parent drug. The major fragment ions were 885.3042 (2H2O),782.2951 (2cysteine), 764.2854 (loss of H2O and cysteine), and690.2369 (loss of phenanthridin-6-ol and H2O). The presence offragment ion at m/z 690.2369 indicates that oxidation and cysteineconjugation occurs at the macrocyclic olefinic linker.Metabolite M25.Metabolite M25 was only observed in feces; it gave
the protonated molecular ion at m/z 646.2683, which is consistent withthe predicted formula of C34H40N5O6S
+ (calculated mass 646.2694).M25 is proposed to be an amide hydrolysis metabolite from the parentdrug with a loss of methylpyrazine-2-carboxylic acid.Metabolite M26.Metabolite M26 was observed only in feces; it gave
the protonated molecular ion at m/z 543.2591, which is consistent withthe predicted formula of C31H35N4O5
+ (calculated mass 543.2602).M26is proposed to be an amide hydrolysis metabolite from M29 with a lossof methylpyrazine-2-carboxylic acid.
Metabolite M2 in Human Plasma at Steady State
As discussed in the previous section, metabolite M2 is the mainmetabolite in circulation, representing approximately 6.5% after asingle oral dose of [14C]paritaprevir/ritonavir. The plasma
TABLE 2
Average percentage of radioactivity in time point–weighted AUC0–12hours pooledhuman plasma (n = 4)
AnalyteRadioactivity
Mean SD
%
Paritaprevir 90.1 13.0M2 6.5 9.4M3 1.2 2.4M29 2.1 2.4
Fig. 5. Representative HPLC radiochromatograms of paritaprevir and its metabo-lites in human excreta, urine(A) and feces (B), after a single 200-mg oral dose of[14C]paritaprevir, coadministered with a single 100-mg oral dose of ritonavir tohealthy male subjects.
TABLE 3
Percentages of excretory metabolites of in humans after administration of a single200/100 mg oral dose of [14C]paritaprevir /ritonavir (n = 4)
MetaboliteFeces
(0–192 h)Urine
(0–168 h)Total
Total radioactivity 87.8 8.76Paritaprevir 1.1 0.05 1.15M2 8.55 0.13 8.68M6 0.78 ND 0.78M3/M18* 7.47 ND 7.47M13 1.67 8.57 10.2M14 1.12 ND 1.12M17 1.08 ND 1.08M22/M23** 2.78 ND 2.78M24 3.32 ND 3.32M29 59.9 0.01 59.9
ND, not detected.*M3 and M18 were coeluting metabolites in fecal sample analysis.**M22 and M23 were coeluting metabolites in fecal sample analysis.
Metabolism and Disposition of [14C]Paritaprevir in Humans 1169
at ASPE
T Journals on June 25, 2018
dmd.aspetjournals.org
Dow
nloaded from

concentration of metabolite M2 at the steady state was also de-termined after multiple oral dosing with paritaprevir/ritonavir inhumans. Eight subjects received a 300-mg dose of paritaprevir,in combination with a 100-mg dose of ritonavir once daily for14 consecutive days. Paritaprevir peak plasma concentrations aver-aged 6398 ng/ml (Table 5). The M2 peak plasma concentration wassubstantially lower, with a mean concentration of 21.7 ng/ml.Paritaprevir AUC values averaged 33595 ng/h/ml; M2 AUC valuesfollowed the trend noted in the Cmax values, with a mean value of208.5 ng/h/ml. The M2 AUC values as a percentage of the A-1043422AUC averaged 0.6%.
Metabolite Formation in In Vitro Fecal Incubation
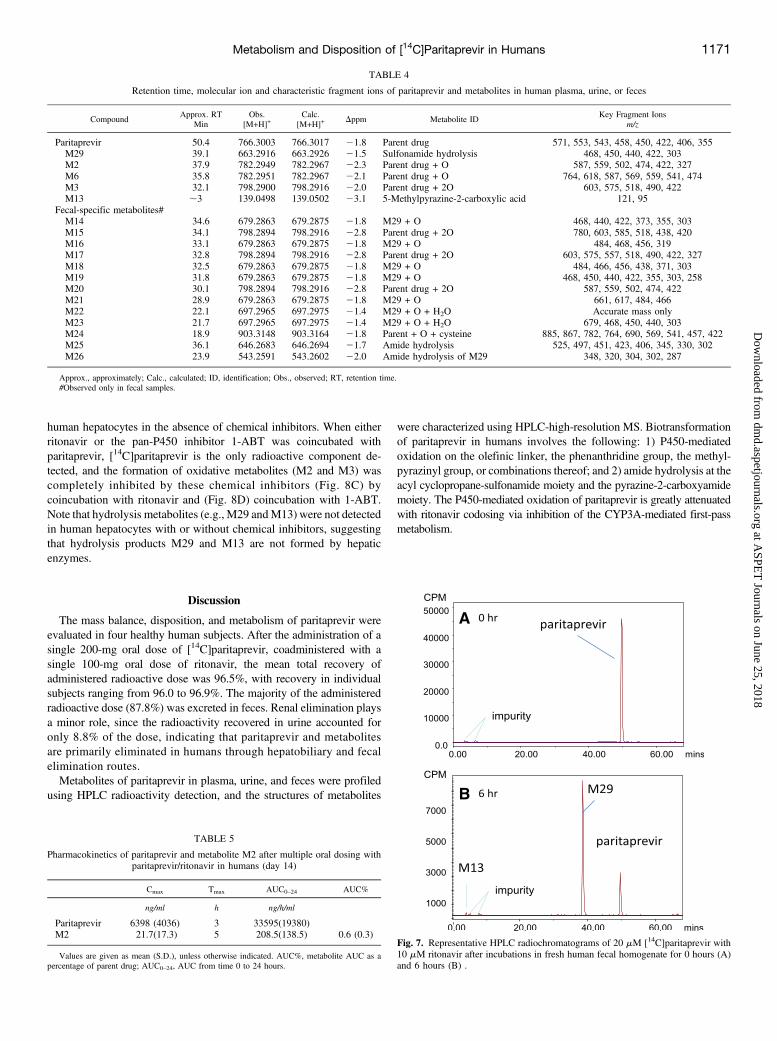
Biotransformation of paritaprevir by human intestinal microflora wasevaluated by incubations of [14C]paritaprevir (20 mM) with ritonavir(10 mM) in freshly prepared human fecal homogenate under anaerobicconditions. Figure 7 shows representative radiochromatograms of[14C]paritaprevir in human fecal homogenate incubations, indicatingthat paritaprevir rapidly undergoes extensive hydrolysis to form M29.M29 represented approximately 80% of the total radioactivity after a6-hour incubation, and approximately 95% after a 24-hour incubation.
In addition, the hydrolysis products M13 (representing 1–3% of thetotal radioactivity), and M26 (an amide hydrolysis product from M29with a loss of M13) were also observed by LC-MS analysis. The resultsconfirm that unchanged paritaprevir from biliary elimination and unab-sorbed paritaprevir can readily be hydrolyzed to M29 and M13 inhumans in vivo.
In Vitro Hydrolysis in SIFs
The stability of paritaprevir in SIFs was evaluated by incubating[14C]paritaprevir at 10 mM in either FaSSIF (pH 6.52) or FeSSIF (pH5.0) solutions for 8 and 24 hours. HPLC radiochromatographic analysisindicated that paritaprevir was stable in both FaSSIF and FeSSIFsolutions; no hydrolysis products were detected, indicating sulfonamideor amide hydrolysis is unlikely to occur chemically in human intestinalfluids either under fast or fed conditions.
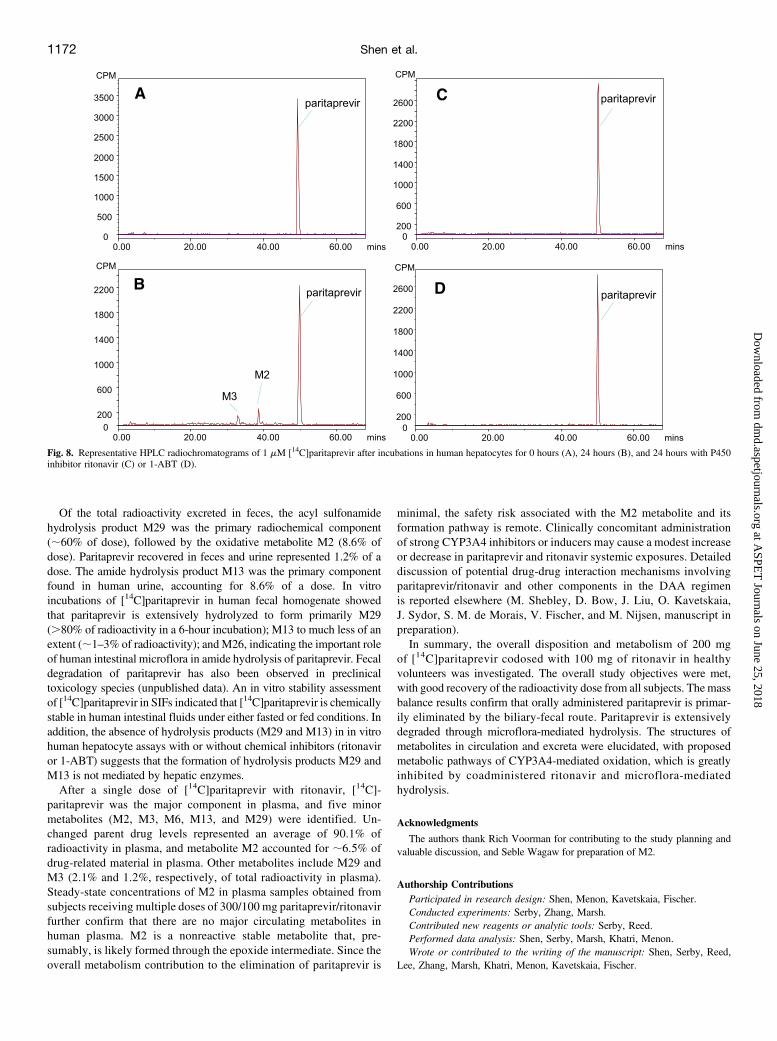
Metabolite Formation in In Vitro Human Hepatocyte Incubation
The in vitrometabolite profile in human hepatocytes was evaluated byincubations of [14C]paritaprevir with or without P450 inhibitors(ritonavir or 1-ABT). As shown in Fig. 8, A and B, [14C]paritaprevirgenerates oxidative metabolites M2 and M3 (confirmed by LC-MS) in
Fig. 6. Proposed metabolic pathways of paritaprevir in humans.
1170 Shen et al.
at ASPE
T Journals on June 25, 2018
dmd.aspetjournals.org
Dow
nloaded from
human hepatocytes in the absence of chemical inhibitors. When eitherritonavir or the pan-P450 inhibitor 1-ABT was coincubated withparitaprevir, [14C]paritaprevir is the only radioactive component de-tected, and the formation of oxidative metabolites (M2 and M3) wascompletely inhibited by these chemical inhibitors (Fig. 8C) bycoincubation with ritonavir and (Fig. 8D) coincubation with 1-ABT.Note that hydrolysis metabolites (e.g., M29 andM13) were not detectedin human hepatocytes with or without chemical inhibitors, suggestingthat hydrolysis products M29 and M13 are not formed by hepaticenzymes.
Discussion
The mass balance, disposition, and metabolism of paritaprevir wereevaluated in four healthy human subjects. After the administration of asingle 200-mg oral dose of [14C]paritaprevir, coadministered with asingle 100-mg oral dose of ritonavir, the mean total recovery ofadministered radioactive dose was 96.5%, with recovery in individualsubjects ranging from 96.0 to 96.9%. The majority of the administeredradioactive dose (87.8%) was excreted in feces. Renal elimination playsa minor role, since the radioactivity recovered in urine accounted foronly 8.8% of the dose, indicating that paritaprevir and metabolitesare primarily eliminated in humans through hepatobiliary and fecalelimination routes.Metabolites of paritaprevir in plasma, urine, and feces were profiled
using HPLC radioactivity detection, and the structures of metabolites
were characterized using HPLC-high-resolution MS. Biotransformationof paritaprevir in humans involves the following: 1) P450-mediatedoxidation on the olefinic linker, the phenanthridine group, the methyl-pyrazinyl group, or combinations thereof; and 2) amide hydrolysis at theacyl cyclopropane-sulfonamide moiety and the pyrazine-2-carboxyamidemoiety. The P450-mediated oxidation of paritaprevir is greatly attenuatedwith ritonavir codosing via inhibition of the CYP3A-mediated first-passmetabolism.
TABLE 4
Retention time, molecular ion and characteristic fragment ions of paritaprevir and metabolites in human plasma, urine, or feces
CompoundApprox. RT
MinObs.
[M+H]+Calc.
[M+H]+Dppm Metabolite ID
Key Fragment Ionsm/z
Paritaprevir 50.4 766.3003 766.3017 21.8 Parent drug 571, 553, 543, 458, 450, 422, 406, 355M29 39.1 663.2916 663.2926 21.5 Sulfonamide hydrolysis 468, 450, 440, 422, 303M2 37.9 782.2949 782.2967 22.3 Parent drug + O 587, 559, 502, 474, 422, 327M6 35.8 782.2951 782.2967 22.1 Parent drug + O 764, 618, 587, 569, 559, 541, 474M3 32.1 798.2900 798.2916 22.0 Parent drug + 2O 603, 575, 518, 490, 422M13 ;3 139.0498 139.0502 23.1 5-Methylpyrazine-2-carboxylic acid 121, 95
Fecal-specific metabolites#M14 34.6 679.2863 679.2875 21.8 M29 + O 468, 440, 422, 373, 355, 303M15 34.1 798.2894 798.2916 22.8 Parent drug + 2O 780, 603, 585, 518, 438, 420M16 33.1 679.2863 679.2875 21.8 M29 + O 484, 468, 456, 319M17 32.8 798.2894 798.2916 22.8 Parent drug + 2O 603, 575, 557, 518, 490, 422, 327M18 32.5 679.2863 679.2875 21.8 M29 + O 484, 466, 456, 438, 371, 303M19 31.8 679.2863 679.2875 21.8 M29 + O 468, 450, 440, 422, 355, 303, 258M20 30.1 798.2894 798.2916 22.8 Parent drug + 2O 587, 559, 502, 474, 422M21 28.9 679.2863 679.2875 21.8 M29 + O 661, 617, 484, 466M22 22.1 697.2965 697.2975 21.4 M29 + O + H2O Accurate mass onlyM23 21.7 697.2965 697.2975 21.4 M29 + O + H2O 679, 468, 450, 440, 303M24 18.9 903.3148 903.3164 21.8 Parent + O + cysteine 885, 867, 782, 764, 690, 569, 541, 457, 422M25 36.1 646.2683 646.2694 21.7 Amide hydrolysis 525, 497, 451, 423, 406, 345, 330, 302M26 23.9 543.2591 543.2602 22.0 Amide hydrolysis of M29 348, 320, 304, 302, 287
Approx., approximately; Calc., calculated; ID, identification; Obs., observed; RT, retention time.#Observed only in fecal samples.
TABLE 5
Pharmacokinetics of paritaprevir and metabolite M2 after multiple oral dosing withparitaprevir/ritonavir in humans (day 14)
Cmax Tmax AUC0–24 AUC%
ng/ml h ng/h/ml
Paritaprevir 6398 (4036) 3 33595(19380)M2 21.7(17.3) 5 208.5(138.5) 0.6 (0.3)
Values are given as mean (S.D.), unless otherwise indicated. AUC%, metabolite AUC as apercentage of parent drug; AUC0–24, AUC from time 0 to 24 hours.
Fig. 7. Representative HPLC radiochromatograms of 20 mM [14C]paritaprevir with10 mM ritonavir after incubations in fresh human fecal homogenate for 0 hours (A)and 6 hours (B) .
Metabolism and Disposition of [14C]Paritaprevir in Humans 1171
at ASPE
T Journals on June 25, 2018
dmd.aspetjournals.org
Dow
nloaded from
Of the total radioactivity excreted in feces, the acyl sulfonamidehydrolysis product M29 was the primary radiochemical component(;60% of dose), followed by the oxidative metabolite M2 (8.6% ofdose). Paritaprevir recovered in feces and urine represented 1.2% of adose. The amide hydrolysis product M13 was the primary componentfound in human urine, accounting for 8.6% of a dose. In vitroincubations of [14C]paritaprevir in human fecal homogenate showedthat paritaprevir is extensively hydrolyzed to form primarily M29(.80% of radioactivity in a 6-hour incubation); M13 to much less of anextent (;1–3% of radioactivity); andM26, indicating the important roleof human intestinal microflora in amide hydrolysis of paritaprevir. Fecaldegradation of paritaprevir has also been observed in preclinicaltoxicology species (unpublished data). An in vitro stability assessmentof [14C]paritaprevir in SIFs indicated that [14C]paritaprevir is chemicallystable in human intestinal fluids under either fasted or fed conditions. Inaddition, the absence of hydrolysis products (M29 and M13) in in vitrohuman hepatocyte assays with or without chemical inhibitors (ritonaviror 1-ABT) suggests that the formation of hydrolysis products M29 andM13 is not mediated by hepatic enzymes.After a single dose of [14C]paritaprevir with ritonavir, [14C]-
paritaprevir was the major component in plasma, and five minormetabolites (M2, M3, M6, M13, and M29) were identified. Un-changed parent drug levels represented an average of 90.1% ofradioactivity in plasma, and metabolite M2 accounted for ;6.5% ofdrug-related material in plasma. Other metabolites include M29 andM3 (2.1% and 1.2%, respectively, of total radioactivity in plasma).Steady-state concentrations of M2 in plasma samples obtained fromsubjects receiving multiple doses of 300/100 mg paritaprevir/ritonavirfurther confirm that there are no major circulating metabolites inhuman plasma. M2 is a nonreactive stable metabolite that, pre-sumably, is likely formed through the epoxide intermediate. Since theoverall metabolism contribution to the elimination of paritaprevir is
minimal, the safety risk associated with the M2 metabolite and itsformation pathway is remote. Clinically concomitant administrationof strong CYP3A4 inhibitors or inducers may cause a modest increaseor decrease in paritaprevir and ritonavir systemic exposures. Detaileddiscussion of potential drug-drug interaction mechanisms involvingparitaprevir/ritonavir and other components in the DAA regimenis reported elsewhere (M. Shebley, D. Bow, J. Liu, O. Kavetskaia,J. Sydor, S. M. de Morais, V. Fischer, and M. Nijsen, manuscript inpreparation).In summary, the overall disposition and metabolism of 200 mg
of [14C]paritaprevir codosed with 100 mg of ritonavir in healthyvolunteers was investigated. The overall study objectives were met,with good recovery of the radioactivity dose from all subjects. The massbalance results confirm that orally administered paritaprevir is primar-ily eliminated by the biliary-fecal route. Paritaprevir is extensivelydegraded through microflora-mediated hydrolysis. The structures ofmetabolites in circulation and excreta were elucidated, with proposedmetabolic pathways of CYP3A4-mediated oxidation, which is greatlyinhibited by coadministered ritonavir and microflora-mediatedhydrolysis.
Acknowledgments
The authors thank Rich Voorman for contributing to the study planning andvaluable discussion, and Seble Wagaw for preparation of M2.
Authorship ContributionsParticipated in research design: Shen, Menon, Kavetskaia, Fischer.Conducted experiments: Serby, Zhang, Marsh.Contributed new reagents or analytic tools: Serby, Reed.Performed data analysis: Shen, Serby, Marsh, Khatri, Menon.Wrote or contributed to the writing of the manuscript: Shen, Serby, Reed,
Lee, Zhang, Marsh, Khatri, Menon, Kavetskaia, Fischer.
Fig. 8. Representative HPLC radiochromatograms of 1 mM [14C]paritaprevir after incubations in human hepatocytes for 0 hours (A), 24 hours (B), and 24 hours with P450inhibitor ritonavir (C) or 1-ABT (D).
1172 Shen et al.
at ASPE
T Journals on June 25, 2018
dmd.aspetjournals.org
Dow
nloaded from
References
Bernstein B, Menon R, Klein C, Lawal A, Nada A, Gaultier I, Podsadecki T, and Awni W (2009)Pharmacokinetics, safety and tolerability of the HCV protease inhibitor ABT-450 with ritonavirfollowing multiple ascending doses in healthy adult volunteers, in HEP DART 2009; 2009 De-cember 6–10, Kohala Coast, Hawaii. pp 53-54, IHL Press, Burkburnett, Texas.
Delaney ML and Onderdonk AB (1997) Evaluation of the AnaeroPack system for growth ofclinically significant anaerobes. J Clin Microbiol 35:558–562.
Feld JJ, Kowdley KV, Coakley E, Sigal S, Nelson DR, Crawford D, Weiland O, Aguilar H, XiongJ, and Pilot-Matias T (2014) Treatment of HCV with ABT-450/r-ombitasvir and dasabuvir withribavirin. N Engl J Med 370:1594–1603.
Ferenci P, Bernstein D, Lalezari J, Cohen D, Luo Y, Cooper C, Tam E, Marinho RT, Tsai N,and Nyberg A, et al.; PEARL-III Study; ; PEARL-IV Study (2014) ABT-450/r-ombitasvir anddasabuvir with or without ribavirin for HCV. N Engl J Med 370:1983–1992.
Hamilton RA, Garnett WR, and Kline BJ (1981) Determination of mean valproic acid serum levelby assay of a single pooled sample. Clin Pharmacol Ther 29:408–413.
Kowdley KV, Lawitz E, Poordad F, Cohen DE, Nelson DR, Zeuzem S, Everson GT, Kwo P,Foster GR, and Sulkowski MS (2014) Phase 2b trial of interferon-free therapy for hepatitis Cvirus genotype 1. N Engl J Med 370:222–232.
Lavanchy D (2011) Evolving epidemiology of hepatitis C virus. Clin Microbiol Infect 17:107–115.
Lawitz E, Gaultier I, Poordad F, DeJesus E, Kowdley KV, Sepulveda G, Cohen DE, Menon R,Larsen LM, and Podsadecki TJ (2010) 4-Week virologic response and safety of ABT-450 givenwith low-dose ritonavir (ABT-450/r) in combination with pegylated interferon alpha-2a andribavirin (soc) after 3-day monotherapy in genotype 1 (gt1) HCV-infected treatment-naïvesubjects, in The Liver Meeting 2010: American Association for the Study of Liver Diseases(AASLD) 61st Annual Meeting; 2010 October 29–November 2, AASLD, Boston, MA.
Lin C (2006) HCV NS3-4A serine protease, in Hepatitis C Viruses: Genomes and MolecularBiology (Tan SL, ed) pp 163–206, Horizon Bioscience, Norfolk, UK.
McHutchison JG, Everson GT, Gordon SC, Jacobson IM, Sulkowski M, Kauffman R, McNair L,Alam J, and Muir AJ; PROVE1 Study Team (2009) Telaprevir with peginterferon and ribavirinfor chronic HCV genotype 1 infection. N Engl J Med 360:1827–1838.
Menon R, Klein C, Lawal A, Chiu Y, Awni W, Podsadecki T, Nada A, and Bernstein B (2009)Pharmacokinetics and tolerability of the HCV protease inhibitor ABT-450 following singleascending doses in healthy adult volunteers with and without ritonavir, in in HEP DART 2009;2009 December 6–10, Kohala Coast, Hawaii. p 53, IHL Press, Burkburnett, Texas.
Menon R, Klein C, Podsadecki T, Chiu Y, Dutta S, and Awni W (2016) Pharmacokinetics andtolerability of paritaprevir, a direct acting antiviral agent for hepatitis C virus treatment, with andwithout ritonavir in healthy volunteers. Br J Clin Pharmacol 81:929–940.
Mohd Hanafiah K, Groeger J, Flaxman AD, and Wiersma ST (2013) Global epidemiology ofhepatitis C virus infection: new estimates of age-specific antibody to HCV seroprevalence.Hepatology 57:1333–1342.
Moradpour D, Penin F, and Rice CM (2007) Replication of hepatitis C virus. Nat Rev Microbiol 5:453–463.
Pilot-Matias T, Tripathi R, Cohen D, Gaultier I, Dekhtyar T, Lu L, Reisch T, Irvin M, Hopkins T,and Pithawalla R (2015) In vitro and in vivo antiviral activity and resistance profile of thehepatitis C virus NS3/4A protease inhibitor ABT-450. Antimicrob Agents Chemother 59:988–997.
Poordad F, McCone J, Jr, Bacon BR, Bruno S, Manns MP, Sulkowski MS, Jacobson IM, ReddyKR, Goodman ZD, and Boparai N SPRINT-2 Investigators (2011) Boceprevir for untreatedchronic HCV genotype 1 infection. N Engl J Med 364:1195–1206.
Van Horn KG, Warren K, and Baccaglini EJ (1997) Evaluation of the AnaeroPack system forgrowth of anaerobic bacteria. J Clin Microbiol 35:2170–2173.
Zein NN (2000) Clinical significance of hepatitis C virus genotypes. Clin Microbiol Rev 13:223–235.Zeuzem S, Jacobson IM, Baykal T, Marinho RT, Poordad F, Bourlière M, Sulkowski MS,Wedemeyer H, Tam E, and Desmond P (2014) Retreatment of HCV with ABT-450/r-ombitasvirand dasabuvir with ribavirin. N Engl J Med 370:1604–1614.
Address correspondence to: Jianwei Shen, Drug Metabolism, AbbVie, 1 N.Waukegan Road, North Chicago, IL 60064. Phone: 847-935-7528. E-mail: [email protected]
Metabolism and Disposition of [14C]Paritaprevir in Humans 1173
at ASPE
T Journals on June 25, 2018
dmd.aspetjournals.org
Dow
nloaded from


![Absorption, Metabolism and Excretion of …dmd.aspetjournals.org/content/dmd/40/4/815.full.pdfAbsorption, Metabolism and Excretion of [14C]Mirabegron (YM178),a Potent and Selective](https://static.fdocuments.net/doc/165x107/5b3dd4207f8b9a986e8de445/absorption-metabolism-and-excretion-of-dmd-metabolism-and-excretion-of-14cmirabegron.jpg)