Metabolic gatekeeper function of B-lymphoid transcription ... · Metabolic gatekeeper function of...
21
23 FEBRUARY 2017 | VOL 542 | NATURE | 479 LETTER doi:10.1038/nature21076 Metabolic gatekeeper function of B-lymphoid transcription factors Lai N. Chan 1,2 , Zhengshan Chen 1,2 , Daniel Braas 3 , Jae-Woong Lee 1,2 , Gang Xiao 1,2 , Huimin Geng 4 , Kadriye Nehir Cosgun 1,2 , Christian Hurtz 4 , Seyedmehdi Shojaee 4 , Valeria Cazzaniga 4 , Hilde Schjerven 4 , Thomas Ernst 5 , Andreas Hochhaus 5 , Steven M. Kornblau 6 , Marina Konopleva 6 , Miles A. Pufall 7 , Giovanni Cazzaniga 8 , Grace J. Liu 9 , Thomas A. Milne 10 , H. Phillip Koeffler 11,12 , Theodora S. Ross 13 , Isidro Sánchez-García 14 , Arndt Borkhardt 15 , Keith R. Yamamoto 4 , Ross A. Dickins 9 , Thomas G. Graeber 3 & Markus Müschen 1,2 B-lymphoid transcription factors, such as PAX5 and IKZF1, are critical for early B-cell development 1,2 , yet lesions of the genes encoding these transcription factors occur in over 80% of cases of pre-B-cell acute lymphoblastic leukaemia (ALL) 3,4 . The importance of these lesions in ALL has, until now, remained unclear. Here, by combining studies using chromatin immunoprecipitation with sequencing and RNA sequencing, we identify a novel B-lymphoid program for transcriptional repression of glucose and energy supply. Our metabolic analyses revealed that PAX5 and IKZF1 enforce a state of chronic energy deprivation, resulting in constitutive activation of the energy-stress sensor AMPK 5–7 . Dominant- negative mutants of PAX5 and IKZF1, however, relieved this glucose and energy restriction. In a transgenic pre-B ALL mouse model, the heterozygous deletion of Pax5 increased glucose uptake and ATP levels by more than 25-fold. Reconstitution of PAX5 and IKZF1 in samples from patients with pre-B ALL restored a non- permissive state and induced energy crisis and cell death. A CRISPR/ Cas9-based screen of PAX5 and IKZF1 transcriptional targets identified the products of NR3C1 (encoding the glucocorticoid receptor) 8 , TXNIP (encoding a glucose-feedback sensor) 9 and CNR2 (encoding a cannabinoid receptor) 10 as central effectors of B-lymphoid restriction of glucose and energy supply. Notably, transport-independent lipophilic methyl-conjugates of pyruvate and tricarboxylic acid cycle metabolites bypassed the gatekeeper function of PAX5 and IKZF1 and readily enabled leukaemic transformation. Conversely, pharmacological TXNIP and CNR2 agonists and a small-molecule AMPK inhibitor strongly synergized with glucocorticoids, identifying TXNIP, CNR2 and AMPK as potential therapeutic targets. Furthermore, our results provide a mechanistic explanation for the empirical finding that glucocorticoids are effective in the treatment of B-lymphoid but not myeloid malignancies. Thus, B-lymphoid transcription factors function as metabolic gatekeepers by limiting the amount of cellular ATP to levels that are insufficient for malignant transformation. The transcription factors PAX5, IKZF1, EBF1 and TCF3 are critical for normal B-cell development 11 and are opposed by CEBPA, a cen- tral driver of myeloid differentiation 12 . In adipocytes, EBF1 decreases glucose transport 13 , whereas CEBPA promotes glucose transport 14 . Transforming oncogenes (for example, BCR–ABL1 or RAS) impose substantial metabolic requirements on the supply of glucose and energy. Given the high frequency of genetic lesions present on B-lymphoid transcription factors in pre-B ALL, we investigated whether these tran- scription factors restrict the supply of glucose and energy, and thus represent a metabolic barrier against malignant transformation. Studying inactivating lesions in PAX5, IKZF1, EBF1 and TCF3 in 279 patient samples from clinical trials for children and adults (see Methods), we found mutations or deletions in 209 cases. The patient-derived pre-B ALL xenografts that we studied here exhibited abnormal expression of PAX5 and IKZF1 proteins (Extended Data Fig. 1b, c). Analysis of chromatin immunoprecipitation with sequenc- ing (ChIP–seq) data of human B-cells revealed that PAX5, IKZF1, EBF1 and TCF3 bind to promoter regions of INSR, GLUT1, GLUT6, G6PD and HK2, genes encoding proteins that enable glucose uptake and uti- lization. We also observed binding peaks at promoter regions of genes that encode negative regulators of glucose uptake, including NR3C1, TXNIP and CNR2. Recruitment of PAX5 to these promoters was con- firmed by single-locus quantitative ChIP (Extended Data Fig. 1d, e). Inducible reconstitution of mouse Pax5 (Gene Expression Omnibus (GEO) accession number: GSE52870) in Pax5-deficient pre-B leukae- mia cells downregulated multiple mediators of glucose uptake, whereas the mRNA levels of glucose-transport inhibitors increased (Mlxip, Txnip, Cnr2; Extended Data Fig. 1a). We verified these results in four patient-derived pre-B ALL sam- ples. Inducible reconstitution of wild-type transcription factors in patient-derived pre-B ALL cells lacking functional PAX5 or IKZF1 (Fig. 1a) induced activation of the LKB1–AMPK energy-stress-sensor pathway 15 . As would be consistent with the depletion of glucose and energy, reconstitution of IKZF1 and PAX5 diminished AKT activation. Similarly, reconstitution of both IKZF1 and PAX5 decreased protein levels of the insulin receptor, the glucose transporters GLUT1, GLUT3 and GLUT6, and the effectors of glucose metabolism HK2, HK3, PFKL, PGAM, PYGL and G6PD. By contrast, PAX5 and IKZF1 induced strong expression of the glucose-transport inhibitors NR3C1, TXNIP and CNR2 8–10 . For loss-of-function studies, dominant-negative variants of IKZF1 (DN-IKZF1, lacking zinc fingers 1–4) and PAX5 (DN-PAX5; a PAX5–ETV6 fusion gene) were cloned from patient samples and expression was induced in two pre-B ALL xenografts carrying wild- type IKZF1 and PAX5 alleles (Extended Data Fig. 2a). As expected, 1 Department of Systems Biology, Beckman Research Institute and City of Hope National Medical Center, Pasadena, California 91016, USA. 2 City of Hope Comprehensive Cancer Center, Duarte, California 91010, USA. 3 Department of Molecular and Medical Pharmacology, UCLA Metabolomics Center and Crump Institute for Molecular Imaging, University of California Los Angeles, Los Angeles, California 90095, USA. 4 Departments of Laboratory Medicine and Cellular and Molecular Pharmacology, University of California San Francisco, San Francisco, California 94143, USA. 5 Hämatologie/Onkologie, Klinik für Innere Medizin II, Universitätsklinikum Jena, 07743 Jena, Germany. 6 Department of Leukemia, The University of Texas M.D. Anderson Cancer Center, Houston, Texas 77030, USA. 7 Department of Biochemistry, University of Iowa, Iowa City, Iowa 52242, USA. 8 Centro Ricerca Tettamanti, Clinica Pediatrica, Università di Milano-Bicocca, Ospedale S. Gerardo, 20052 Monza MB, Italy. 9 Australian Centre for Blood Diseases, Monash University, Melbourne, Victoria 3004 Australia. 10 MRC Molecular Haematology Unit, Weatherall Institute of Molecular Medicine, University of Oxford, Oxford OX3 9DS, UK. 11 Cancer Science Institute of Singapore, National University of Singapore, Singapore 117599. 12 Division of Hematology/Oncology, Cedars- Sinai Medical Center, University of California School of Medicine, Los Angeles, California 90095, USA. 13 Department of Internal Medicine and Cancer Genetics, University of Texas Southwestern Medical Center, Dallas, Texas 75390, USA. 14 Experimental Therapeutics and Translational Oncology Program, Instituto de Biología Molecular y Celular del Cáncer, CSIC/Universidad de Salamanca and Institute of Biomedical Research of Salamanca (IBSAL), 37007 Salamanca, Spain. 15 Pediatric Oncology, Hematology and Clinical Immunology, Medical Faculty, Heinrich Heine University, 40225 Düsseldorf, Germany. © 2017 Macmillan Publishers Limited, part of Springer Nature. All rights reserved.
Transcript of Metabolic gatekeeper function of B-lymphoid transcription ... · Metabolic gatekeeper function of...

2 3 f e b r u a r y 2 0 1 7 | V O L 5 4 2 | N a T u r e | 4 7 9
LeTTerdoi:10.1038/nature21076
Metabolic gatekeeper function of B-lymphoid transcription factorsLai N. Chan1,2, Zhengshan Chen1,2, Daniel braas3, Jae-Woong Lee1,2, Gang Xiao1,2, Huimin Geng4, Kadriye Nehir Cosgun1,2, Christian Hurtz4, Seyedmehdi Shojaee4, Valeria Cazzaniga4, Hilde Schjerven4, Thomas ernst5, andreas Hochhaus5, Steven M. Kornblau6, Marina Konopleva6, Miles a. Pufall7, Giovanni Cazzaniga8, Grace J. Liu9, Thomas a. Milne10, H. Phillip Koeffler11,12, Theodora S. ross13, Isidro Sánchez-García14, arndt borkhardt15, Keith r. yamamoto4, ross a. Dickins9, Thomas G. Graeber3 & Markus Müschen1,2
B-lymphoid transcription factors, such as PAX5 and IKZF1, are critical for early B-cell development1,2, yet lesions of the genes encoding these transcription factors occur in over 80% of cases of pre-B-cell acute lymphoblastic leukaemia (ALL)3,4. The importance of these lesions in ALL has, until now, remained unclear. Here, by combining studies using chromatin immunoprecipitation with sequencing and RNA sequencing, we identify a novel B-lymphoid program for transcriptional repression of glucose and energy supply. Our metabolic analyses revealed that PAX5 and IKZF1 enforce a state of chronic energy deprivation, resulting in constitutive activation of the energy-stress sensor AMPK5–7. Dominant-negative mutants of PAX5 and IKZF1, however, relieved this glucose and energy restriction. In a transgenic pre-B ALL mouse model, the heterozygous deletion of Pax5 increased glucose uptake and ATP levels by more than 25-fold. Reconstitution of PAX5 and IKZF1 in samples from patients with pre-B ALL restored a non-permissive state and induced energy crisis and cell death. A CRISPR/Cas9-based screen of PAX5 and IKZF1 transcriptional targets identified the products of NR3C1 (encoding the glucocorticoid receptor)8, TXNIP (encoding a glucose-feedback sensor)9 and CNR2 (encoding a cannabinoid receptor)10 as central effectors of B-lymphoid restriction of glucose and energy supply. Notably, transport-independent lipophilic methyl-conjugates of pyruvate and tricarboxylic acid cycle metabolites bypassed the gatekeeper function of PAX5 and IKZF1 and readily enabled leukaemic transformation. Conversely, pharmacological TXNIP and CNR2 agonists and a small-molecule AMPK inhibitor strongly synergized with glucocorticoids, identifying TXNIP, CNR2 and AMPK as potential therapeutic targets. Furthermore, our results provide a mechanistic explanation for the empirical finding that glucocorticoids are effective in the treatment of B-lymphoid but not myeloid malignancies. Thus, B-lymphoid transcription factors function as metabolic gatekeepers by limiting the amount of cellular ATP to levels that are insufficient for malignant transformation.
The transcription factors PAX5, IKZF1, EBF1 and TCF3 are critical for normal B-cell development11 and are opposed by CEBPA, a cen-tral driver of myeloid differentiation12. In adipocytes, EBF1 decreases glucose transport13, whereas CEBPA promotes glucose transport14. Transforming oncogenes (for example, BCR–ABL1 or RAS) impose
substantial metabolic requirements on the supply of glucose and energy. Given the high frequency of genetic lesions present on B-lymphoid transcription factors in pre-B ALL, we investigated whether these tran-scription factors restrict the supply of glucose and energy, and thus represent a metabolic barrier against malignant transformation.
Studying inactivating lesions in PAX5, IKZF1, EBF1 and TCF3 in 279 patient samples from clinical trials for children and adults (see Methods), we found mutations or deletions in 209 cases. The patient-derived pre-B ALL xenografts that we studied here exhibited abnormal expression of PAX5 and IKZF1 proteins (Extended Data Fig. 1b, c). Analysis of chromatin immunoprecipitation with sequenc-ing (ChIP–seq) data of human B-cells revealed that PAX5, IKZF1, EBF1 and TCF3 bind to promoter regions of INSR, GLUT1, GLUT6, G6PD and HK2, genes encoding proteins that enable glucose uptake and uti-lization. We also observed binding peaks at promoter regions of genes that encode negative regulators of glucose uptake, including NR3C1, TXNIP and CNR2. Recruitment of PAX5 to these promoters was con-firmed by single-locus quantitative ChIP (Extended Data Fig. 1d, e). Inducible reconstitution of mouse Pax5 (Gene Expression Omnibus (GEO) accession number: GSE52870) in Pax5-deficient pre-B leukae-mia cells downregulated multiple mediators of glucose uptake, whereas the mRNA levels of glucose-transport inhibitors increased (Mlxip, Txnip, Cnr2; Extended Data Fig. 1a).
We verified these results in four patient-derived pre-B ALL sam-ples. Inducible reconstitution of wild-type transcription factors in patient-derived pre-B ALL cells lacking functional PAX5 or IKZF1 (Fig. 1a) induced activation of the LKB1–AMPK energy-stress-sensor pathway15. As would be consistent with the depletion of glucose and energy, reconstitution of IKZF1 and PAX5 diminished AKT activation. Similarly, reconstitution of both IKZF1 and PAX5 decreased protein levels of the insulin receptor, the glucose transporters GLUT1, GLUT3 and GLUT6, and the effectors of glucose metabolism HK2, HK3, PFKL, PGAM, PYGL and G6PD. By contrast, PAX5 and IKZF1 induced strong expression of the glucose-transport inhibitors NR3C1, TXNIP and CNR28–10. For loss-of-function studies, dominant-negative variants of IKZF1 (DN-IKZF1, lacking zinc fingers 1–4) and PAX5 (DN-PAX5; a PAX5–ETV6 fusion gene) were cloned from patient samples and expression was induced in two pre-B ALL xenografts carrying wild-type IKZF1 and PAX5 alleles (Extended Data Fig. 2a). As expected,
1Department of Systems Biology, Beckman Research Institute and City of Hope National Medical Center, Pasadena, California 91016, USA. 2City of Hope Comprehensive Cancer Center, Duarte, California 91010, USA. 3Department of Molecular and Medical Pharmacology, UCLA Metabolomics Center and Crump Institute for Molecular Imaging, University of California Los Angeles, Los Angeles, California 90095, USA. 4Departments of Laboratory Medicine and Cellular and Molecular Pharmacology, University of California San Francisco, San Francisco, California 94143, USA. 5Hämatologie/Onkologie, Klinik für Innere Medizin II, Universitätsklinikum Jena, 07743 Jena, Germany. 6Department of Leukemia, The University of Texas M.D. Anderson Cancer Center, Houston, Texas 77030, USA. 7Department of Biochemistry, University of Iowa, Iowa City, Iowa 52242, USA. 8Centro Ricerca Tettamanti, Clinica Pediatrica, Università di Milano-Bicocca, Ospedale S. Gerardo, 20052 Monza MB, Italy. 9Australian Centre for Blood Diseases, Monash University, Melbourne, Victoria 3004 Australia. 10MRC Molecular Haematology Unit, Weatherall Institute of Molecular Medicine, University of Oxford, Oxford OX3 9DS, UK. 11Cancer Science Institute of Singapore, National University of Singapore, Singapore 117599. 12Division of Hematology/Oncology, Cedars-Sinai Medical Center, University of California School of Medicine, Los Angeles, California 90095, USA. 13Department of Internal Medicine and Cancer Genetics, University of Texas Southwestern Medical Center, Dallas, Texas 75390, USA. 14Experimental Therapeutics and Translational Oncology Program, Instituto de Biología Molecular y Celular del Cáncer, CSIC/Universidad de Salamanca and Institute of Biomedical Research of Salamanca (IBSAL), 37007 Salamanca, Spain. 15Pediatric Oncology, Hematology and Clinical Immunology, Medical Faculty, Heinrich Heine University, 40225 Düsseldorf, Germany.
© 2017 Macmillan Publishers Limited, part of Springer Nature. All rights reserved.
LetterreSeArCH
4 8 0 | N a T u r e | V O L 5 4 2 | 2 3 f e b r u a r y 2 0 1 7
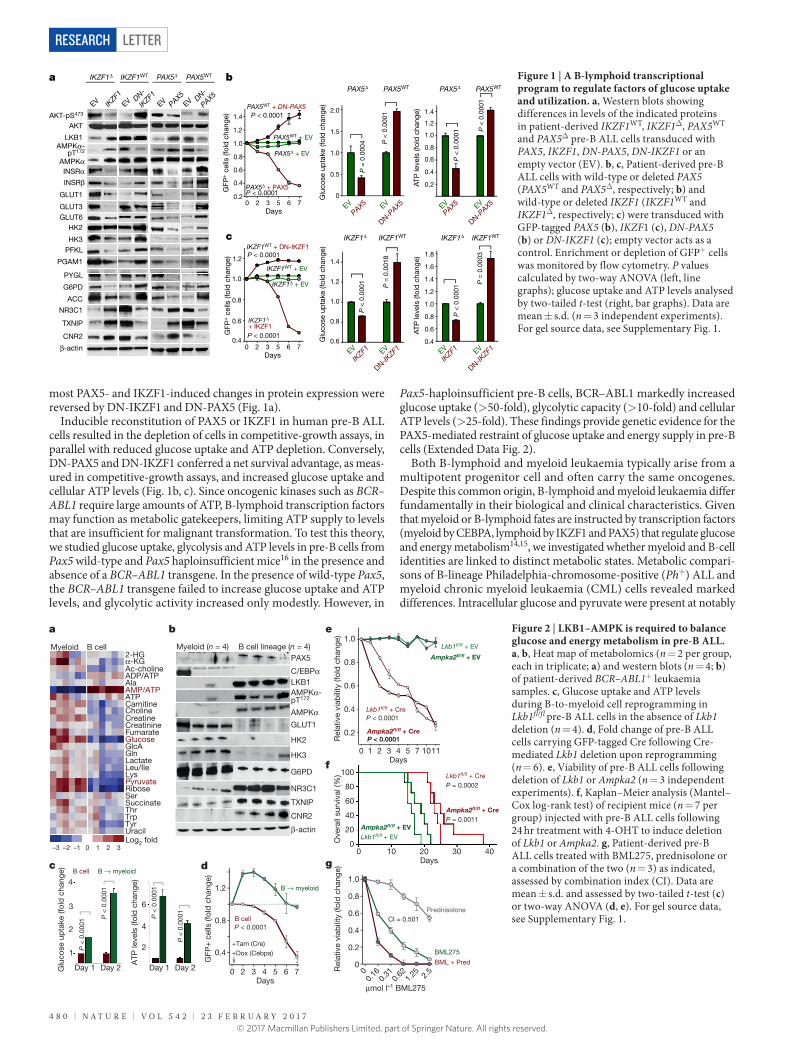
most PAX5- and IKZF1-induced changes in protein expression were reversed by DN-IKZF1 and DN-PAX5 (Fig. 1a).
Inducible reconstitution of PAX5 or IKZF1 in human pre-B ALL cells resulted in the depletion of cells in competitive-growth assays, in parallel with reduced glucose uptake and ATP depletion. Conversely, DN-PAX5 and DN-IKZF1 conferred a net survival advantage, as meas-ured in competitive-growth assays, and increased glucose uptake and cellular ATP levels (Fig. 1b, c). Since oncogenic kinases such as BCR–ABL1 require large amounts of ATP, B-lymphoid transcription factors may function as metabolic gatekeepers, limiting ATP supply to levels that are insufficient for malignant transformation. To test this theory, we studied glucose uptake, glycolysis and ATP levels in pre-B cells from Pax5 wild-type and Pax5 haploinsufficient mice16 in the presence and absence of a BCR–ABL1 transgene. In the presence of wild-type Pax5, the BCR–ABL1 transgene failed to increase glucose uptake and ATP levels, and glycolytic activity increased only modestly. However, in
Pax5-haploinsufficient pre-B cells, BCR–ABL1 markedly increased glucose uptake (> 50-fold), glycolytic capacity (> 10-fold) and cellular ATP levels (> 25-fold). These findings provide genetic evidence for the PAX5-mediated restraint of glucose uptake and energy supply in pre-B cells (Extended Data Fig. 2).
Both B-lymphoid and myeloid leukaemia typically arise from a multipotent progenitor cell and often carry the same oncogenes. Despite this common origin, B-lymphoid and myeloid leukaemia differ fundamentally in their biological and clinical characteristics. Given that myeloid or B-lymphoid fates are instructed by transcription factors (myeloid by CEBPA, lymphoid by IKZF1 and PAX5) that regulate glucose and energy metabolism14,15, we investigated whether myeloid and B-cell identities are linked to distinct metabolic states. Metabolic compari-sons of B-lineage Philadelphia-chromosome-positive (Ph+) ALL and myeloid chronic myeloid leukaemia (CML) cells revealed marked differences. Intracellular glucose and pyruvate were present at notably
5320 6 7
5320 6 7
PAX5WT + EV
PAX5Δ + EV
PAX5Δ + PAX5 0.2
0.4
0.6
0.8
1.0
1.2
1.4
P =
0.0
004 P
< 0
.000
1
PAX5Δ PAX5WT PAX5Δ PAX5WT
P <
0.0
001 P
< 0
.000
1
0.2
0.6
1.0
1.4 PAX5WT + DN-PAX5
0
0.5
1.0
1.5
2.0
b
IKZF1WT + DN-IKZF1
IKZF1WT + EV
IKZF1Δ + EV
0.4
0.6
0.8
1.0
1.2
Glu
cose
up
take
(fol
d c
hang
e)
P <
0.0
001 P =
0.0
018
IKZF1Δ + IKZF1
ATP
leve
ls (f
old
cha
nge)
0.4
0.6
0.8
1.0
1.2
1.4
1.6
1.8
P <
0.0
001 P
= 0
.000
3
0.6
0.8
1.0
1.2
1.4
c
P < 0.0001
P < 0.0001
P < 0.0001
P < 0.0001
1.2
0.8
0.4
a IKZF1Δ IKZF1WT PAX5Δ PAX5WT
IKZF1Δ IKZF1WT IKZF1Δ IKZF1WT
AKT-pS473
EV IKZF1
EV EV
EV
EVPAX5
PAX5 EVPAX5EV
DN-PAX5 EV
DN-PAX5
EVIK
ZF1 EVIK
ZF1EV
DN-IKZF1 EV
DN-IKZF1
DN-
PAX5DN-
IKZF1
AKT
LKB1
AMPKαINSRαINSRβ
AMPKα-pT172
GLUT1
GLUT6 HK2
HK3
G6PD
NR3C1
TXNIP
CNR2
β-actin
PGAM1
PYGL
ACC
GFP
+ c
ells
(fol
d c
hang
e)
PFKL
GLUT3
GFP
+ c
ells
(fol
d c
hang
e)
Glu
cose
up
take
(fol
d c
hang
e)
ATP
leve
ls (f
old
cha
nge)
Days
Days
Figure 1 | A B-lymphoid transcriptional program to regulate factors of glucose uptake and utilization. a, Western blots showing differences in levels of the indicated proteins in patient-derived IKZF1WT, IKZF1Δ, PAX5WT and PAX5Δ pre-B ALL cells transduced with PAX5, IKZF1, DN-PAX5, DN-IKZF1 or an empty vector (EV). b, c, Patient-derived pre-B ALL cells with wild-type or deleted PAX5 (PAX5WT and PAX5Δ, respectively; b) and wild-type or deleted IKZF1 (IKZF1WT and IKZF1Δ, respectively; c) were transduced with GFP-tagged PAX5 (b), IKZF1 (c), DN-PAX5 (b) or DN-IKZF1 (c); empty vector acts as a control. Enrichment or depletion of GFP+ cells was monitored by flow cytometry. P values calculated by two-way ANOVA (left, line graphs); glucose uptake and ATP levels analysed by two-tailed t-test (right, bar graphs). Data are mean ± s.d. (n = 3 independent experiments). For gel source data, see Supplementary Fig. 1.
2-HG α-KG Ac-choline ADP/ATP Ala AMP/ATP ATP Carnitine Choline Creatine Creatinine Fumarate Glucose GlcA Gln Lactate Leu/Ile Lys Pyruvate Ribose Ser Succinate Thr Trp Tyr
–3 –2 –1 0 1 2 3
Uracil Log2 fold
Myeloid B cell
a b e
Lkb1fl/fl + EV
Ampka2fl/fl + EV
Lkb1fl/fl + EVAmpka2fl/fl + EV
0.2
0.4
0.8
1.0
0.6
Rel
ativ
e vi
abili
ty (f
old
cha
nge)
1110
0 10 20 30 40
2 3 4Days
Days
5 7
20 00.
160.
310.
621.
25 2.53 4 5
Days6 7
10
f
AMPKα-pT172
μmol l–1 BML275
0
0.2
0.4
0.6
0.8
1.0
Rel
ativ
e vi
abili
ty (f
old
cha
nge)
CI = 0.501 Prednisolone
BML + Pred
BML275
g
B cell
+Tam (Cre) 0.4
0.8
1.2
GFP
+ c
ells
(fol
d c
hang
e)
+Dox (Cebpa)
d
Glu
cose
up
take
(fol
d c
hang
e)
P <
0.0
001
1
2
3
4
P <
0.0
001
Day 1 Day 2 Day 1 Day 2
B cell B → myeloid
B → myeloid
c
2
4
6
ATP
leve
ls (f
old
cha
nge)
P <
0.0
001
P <
0.0
001
Myeloid (n = 4) B cell lineage (n = 4)
P < 0.0001
LKB1
AMPKα
β-actin
TXNIP
G6PD
CNR2
C/EBPα
HK2
NR3C1
PAX5
HK3
GLUT1 Ampka2fl/fl + Cre P < 0.0001
Lkb1fl/fl + Cre P < 0.0001
Ove
rall
surv
ival
(%)
20
0
40
60
80
100 Lkb1fl/fl + Cre P = 0.0002
Ampka2fl/fl + Cre P = 0.0011
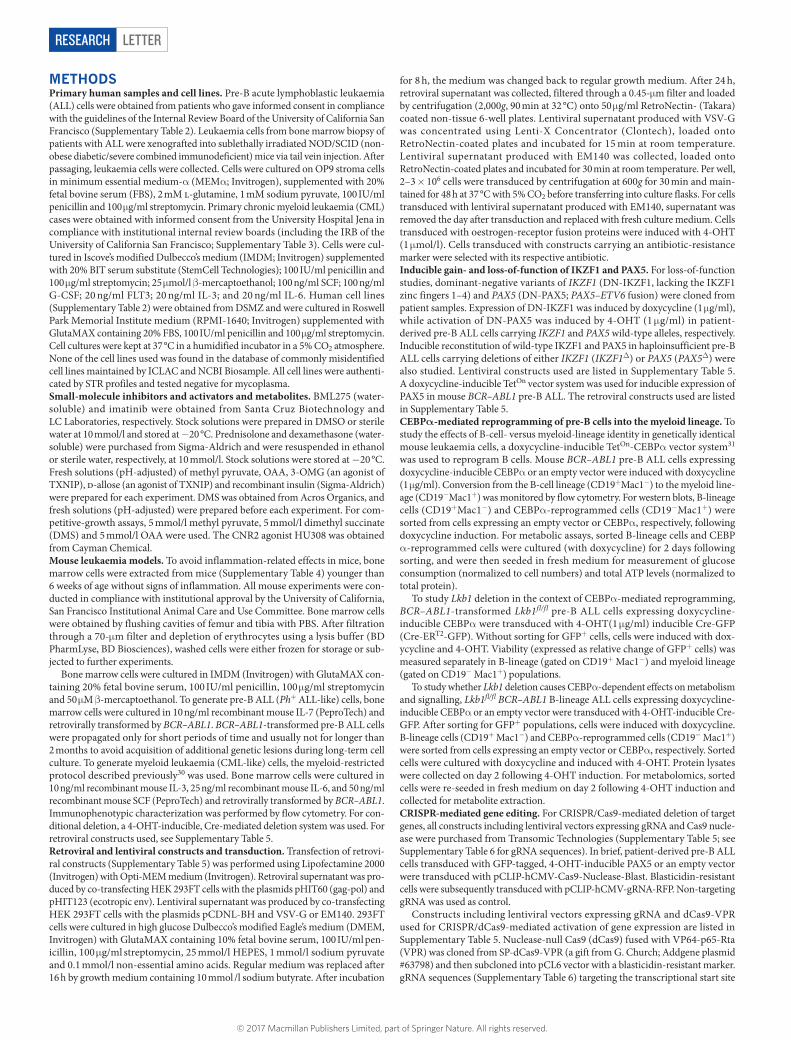
Figure 2 | LKB1–AMPK is required to balance glucose and energy metabolism in pre-B ALL. a, b, Heat map of metabolomics (n = 2 per group, each in triplicate; a) and western blots (n = 4; b) of patient-derived BCR–ABL1+ leukaemia samples. c, Glucose uptake and ATP levels during B-to-myeloid cell reprogramming in Lkb1fl/fl pre-B ALL cells in the absence of Lkb1 deletion (n = 4). d, Fold change of pre-B ALL cells carrying GFP-tagged Cre following Cre-mediated Lkb1 deletion upon reprogramming (n = 6). e, Viability of pre-B ALL cells following deletion of Lkb1 or Ampka2 (n = 3 independent experiments). f, Kaplan–Meier analysis (Mantel–Cox log-rank test) of recipient mice (n = 7 per group) injected with pre-B ALL cells following 24 hr treatment with 4-OHT to induce deletion of Lkb1 or Ampka2. g, Patient-derived pre-B ALL cells treated with BML275, prednisolone or a combination of the two (n = 3) as indicated, assessed by combination index (CI). Data are mean ± s.d. and assessed by two-tailed t-test (c) or two-way ANOVA (d, e). For gel source data, see Supplementary Fig. 1.
© 2017 Macmillan Publishers Limited, part of Springer Nature. All rights reserved.

Letter reSeArCH
2 3 f e b r u a r y 2 0 1 7 | V O L 5 4 2 | N a T u r e | 4 8 1
higher levels (approximately 10–13-fold and 6–11-fold, respectively) in patient-derived myeloid cells compared to B-lymphoid leukaemia cells. Myeloid leukaemia cells had abundant ATP reserves, whereas ATP levels in B-lineage leukaemia cells were low, indicating a state of chronic energy stress (Fig. 2a). Bioenergetic analyses revealed lower glycolytic reserves (approximately 5–14-fold) in B-lymphoid than in myeloid leukaemia cells. Basal and maximum respiration and mito-chondrial ATP levels were substantially lower in B-lineage leukaemia cells (Extended Data Fig. 3a), resulting in the constitutive activation of the LKB1–AMPK energy-stress-sensor pathway. Ph+ ALL cells expressed effectors of glucose utilization (GLUT1, HK2, HK3, G6PD) at more than 10-fold lower levels than myeloid leukaemia cells, whereas the expression of glucose transport inhibitors (NR3C1, TXNIP, CNR2; Fig. 2b) was substantially higher in B-lymphoid cells than in CML cells.
To examine the effects of B-cell- and myeloid-lineage identity in genetically identical mouse leukaemia cells, we studied the reprogram-ming of B-cells through the inducible overexpression of the myeloid transcription factor CEBPα . Studying changes in gene expression dur-ing B-to-myeloid cell reprogramming12, we observed the upregulation of Insr, Glut1, Glut6, Hk2, Hk3, G6PD and Pygl, effector molecules of glucose transport and utilization. B-to-myeloid cell reprogramming markedly increased glucose uptake and cellular ATP levels (Fig. 2c), resulting in decreased Lkb1–Ampk pathway activity (Extended Data Fig. 3). Mirroring these differences, the Cre-mediated deletion of Stk11 (also known as Lkb1) induced cell death in B-lineage ALL cells, but accelerated proliferation in B-to-myeloid reprogrammed cells (Fig. 2d).
For this reason, we studied the consequences of inducible ablation of Lkb1 and Prkaa2 (also known as Ampka2), expression levels of which were upregulated at the pre-B-cell stage compared to later stages of B-cell development (GEO accession number: GSE38463). The Cre-mediated 4-hydroxytamoxifen (4-OHT)-induced deletion of Lkb1 or Ampka2 led to rapid leukaemia cell death, prevented malignant trans-formation of pre-B cells and affected the development of leukaemia in vivo. Deletion of Lkb1 or Ampka2 significantly prolonged the over-all survival of mouse recipients (Fig. 2e, f and Extended Data Fig. 4).
The genotyping of leukaemias revealed that floxed alleles of Lkb1 and Ampka2 were retained in all cases (Extended Data Fig. 4i), indicating strong positive selection for the few clones that escaped Cre-mediated deletion.
A recent study showed that deletion of Prkaa1 (also known as Ampka1) induced acceleration of mature B-cell lymphoma17, which is seemingly at odds with our findings in pre-B ALL. Moreover, genetic lesions in PAX5, IKZF1, EBF1 and TCF3 are common in pre-B ALL but very rare in mature B-cell lymphomas (Extended Data Fig. 5).We therefore investigated whether LKB1–AMPK pathway function defines a stage-specific metabolic checkpoint during early B-cell development, when B-lymphoid transcription factors are most active. To this end, we crossed Lkb1fl/fl mice with Cre deleter strains for deletion of Lkb1 at early (Mb1) and late (Cd21) stages of B-cell development. Although loss of Lkb1 at the pre-B cell stage resulted in a complete block of B-cell development, deletion of Lkb1 in mature Cd21+ B-cells had no substantial effect on survival and proliferation (Extended Data Fig. 4a). These findings explain the apparent differences between pre-B ALL and mature B-cell lymphoma17, and also reveal a metabolic checkpoint function for Lkb1 at the pre-B-cell stage.
In both myeloid and B-lineage leukaemia cells, acute deletion of Lkb1 resulted in the loss of Ampk activity and inhibited phosphorylation of Ampk substrates (Extended Data Figs 6, 7). Although biochemi-cal changes in response to Lkb1 deletion were similar, the functional outcomes were markedly different in myeloid and B-lymphoid cells. Lkb1 deletion in myeloid leukaemia cells stimulated Akt signalling, induced proliferation and increased ATP levels, glucose uptake, glycolytic capacity and glycolytic reserve, whereas cell-cycle check-point molecules were downregulated. By contrast, deletion of Lkb1 or Ampka2 in B-lymphoid leukaemia cells decreased cell viability and cell numbers, and activated cell-cycle checkpoint proteins while decreasing glucose uptake, mitochondrial respiration and ATP levels (Extended Data Figs 6, 7). Similarly, the inducible deletion of Lkb1 in B-lymphoid ALL cells caused cell death and loss of colony-forming capacity and delayed the onset of leukaemia, as well as prolonging the
β-actin β-actin β-actin
NR3C1
NT g-11 g-53 g-95
g-92 g-50 g-08 + EV
g-92
g-08 + PAX5g-50
0.4
0.6
0.8
1.0
TXNIP
NT g-08 g-50 g-92 NT g-21 g-37 g-79
NT + PAX5
g-21 g-37 g-79 + EV
g-37g-21 g-79 + PAX5
1.0
0.8
0.6
0.4
NT + EV
NT + PAX5
NT + EV g-53 g-95 g-11 + EV
0 1 2 3 4 5 6
0.4
0.6
0.8
1.0
GFP
+ c
ells
(fol
d c
hang
e)
NT + PAX5
NT + EV
NR3C1 TXNIP CNR2
c 0 2 4
Days
Days0 1 2 3 4 5 6
Days0 1 2 3 4 5 6
Days
8 12 0 2 4 0 2 4 6 10Days Days
8 12 16
EV + EV
Cre + EV
Cre + PAX5
EV + PAX5
1.0
0.8
0.6
0.4
Rel
ativ
e vi
abili
ty (f
old
cha
nge)
b
Cnr2–/– + EVCnr2+/+ + EV
Cnr2–/– + PAX5
Cnr2+/+
+ PAX50.4
0.6
0.8
1.0
1.0
0.8
0.6
0.4
EV + EV Cre + EV
Cre + PAX5
EV + PAX5
g-53 g-95 g-11 + PAX5
0.8
1.0
1.2
1.4
1.6
1.8
2.0
0.8
1.0
1.2
1.4
1.6
1.8
2.0
1.0
1.4
1.8
2.2
0.8
1.0
1.2
1.4
1.6
1.8
0.8
1.0
1.2
1.4
1.6
Glu
cose
up
take
(fol
d c
hang
e)
Glu
cose
up
take
(fol
d c
hang
e)
Glu
cose
up
take
(fol
d c
hang
e)
P <
0.0
001
ATP
leve
ls (f
old
cha
nge)
ATP
leve
ls (f
old
cha
nge)
ATP
leve
ls (f
old
cha
nge)
P =
0.0
095
P <
0.0
001
P <
0.0
001
P =
0.0
001
EV Cre EV Cre EV Cre EV Cre +/+ –/– +/+ –/–
Nr3c1fl/fl pre-B ALL Txnipfl/fl pre-B ALL Cnr2+/+ and Cnr2–/– pre-B ALL
Nr3c1fl/fl pre-B ALL Txnipfl/fl pre-B ALL Cnr2+/+ and Cnr2–/– pre-B ALL
1.0
1.5
2.0
2.5
3.0
3.5
4.0
P <
0.0
001
a
P < 0.0001P < 0.0001
P < 0.0001
P < 0.0001 P < 0.0001 P < 0.0001
CNR2
Figure 3 | Mechanistic contribution of PAX5 targets to regulation of glucose and energy metabolism in pre-B ALL. a, Glucose uptake and ATP levels upon genetic loss of Nr3c1, Txnip or Cnr2 function. b, Viability upon inducible expression of Pax5 with or without loss of Nr3c1, Txnip or Cnr2 function. c, Fold change of GFP+ patient-derived pre-B ALL cells carrying Cas9 and guide RNAs (gRNAs) for deletion of NRC1 (left), TXNIP (middle) and CNR2 (right) upon induction of GFP-tagged PAX5. Western blots of NR3C1, TXNIP and CNR2 to verify deletion (no induction). Data are mean ± s.d. (n = 3 independent experiments) and assessed by two-tailed t-test (a) or two-way ANOVA (b, c). NT, non-targeting. For gel source data, see Supplementary Fig. 1.
© 2017 Macmillan Publishers Limited, part of Springer Nature. All rights reserved.

LetterreSeArCH
4 8 2 | N a T u r e | V O L 5 4 2 | 2 3 f e b r u a r y 2 0 1 7
survival of transplant-recipient mice in vivo (Extended Data Fig. 4). High expression levels of LKB1 and AMPK are associated with poor clinical outcome in patients with B-lymphoid but not myeloid leukae-mia (Extended Data Fig. 5).
Unlike mature B-cells or myeloid cells, patient-derived pre-B ALL cells were highly sensitive to BML275, a small-molecule inhibitor of AMPK18. BML275 abolished AMPK enzymatic activity and AKT sig-nalling, and induced cell death resulting from energy stress and AMP accumulation. BML275 treatment of patient-derived pre-B ALL cells obliterated glycolytic flux and mitochondrial respiration, but had no considerable effects on myeloid leukaemia or mature B-cell lymphoma cells (Extended Data Fig. 8). Given that both AMPK inhibition and glu-cocorticoid treatment reduced glucose uptake in pre-B ALL, we tested the pharmacological interactions of an AMPK inhibitor and glucocor-ticoids. BML275 and prednisolone demonstrated strong synergistic activity in patient-derived pre-B ALL cells, suggesting that inhibition of AMPK represents a previously unrecognized vulnerability in pre-B ALL that can be exploited in combination therapies with glucocorti-coids (Fig. 2g, Extended Data Fig. 10a and Supplementary Table 1).
To measure the mechanistic contribution of PAX5 target genes to PAX5-mediated tumour suppression, we performed a CRISPR-based genetic screen. For this screen, we utilized two approaches. First, we used transcriptional activation (CRISPR-a)19 to counteract repression by PAX5, which resulted in a survival advantage when some PAX5-target genes were activated, although the effects were relatively small. Second, we performed CRISPR/Cas9-mediated deletion of the PAX5 targets NR3C18, TXNIP9 and CNR210, which, by comparison, provided a strong survival advantage (Extended Data Fig. 9). Cre-mediated loss of function of Nr3c1, Txnip and Cnr2 (Extended Data Fig. 9d) signif-icantly improved glucose uptake and increased ATP levels (Fig. 3a). Although inducible Pax5 expression caused cell death in mouse pre-B ALL cells, the tumour-suppressive effect of Pax5 was mitigated upon genetic loss of Nr3c1, Txnip and Cnr2 (Fig. 3b). CRISPR/Cas9-mediated deletion of NR3C1, TXNIP and CNR2 in patient-derived pre-B ALL cells further corroborated the role of these negative regulators of
glucose transport in human disease and PAX5-mediated tumour sup-pression (Fig. 3c).
For the past five decades, glucocorticoids have been a central component of the therapy regimen for patients with pre-B ALL. Glucocorticoids are highly active in B-lymphoid ALL, but ineffective in the treatment of myeloid leukaemia20; however, the underlying reason for this difference had remained elusive. Studying patient- derived leukaemia samples, we found 6–20-fold higher levels of NR3C1 protein in B-lymphoid compared to myeloid leukaemia cells (Fig. 2b). Whereas IKZF1 and PAX5 positively regulated NR3C1 levels, DN-IKZF1, DN-PAX5 and B-to-myeloid cell reprogramming erased NR3C1 expression (Fig. 1 and Extended Data Fig. 3). We therefore tested whether B-lymphoid transcription factors set the threshold for glucocorticoid responses. Reconstitution of PAX5 and IKZF1 in pre-B ALL patient samples significantly shifted dose–response curves. Similarly, any response to dexamethasone was largely abolished upon induction of DN-IKZF1 and DN-PAX5 (Extended Data Fig. 9e). Loss of Cnr2 and Txnip rescued prednisolone-induced cell death in pre-B ALL cells (Extended Data Fig. 9c), suggesting that glucocorticoid responses are influenced by factors that affect glucose uptake. On this basis, we tested the drug interactions between glucocorticoids and the CNR2 agonist HU308 or the TXNIP agonists 3-O-methylglucose (3-OMG) and d-allose21,22. In patient-derived pre-B ALL cells, HU308, 3-OMG or d-allose worked in synergy with glucocorticoid treatment (Extended Data Fig. 10 and Supplementary Table 1), suggesting that CNR2 and TXNIP cooperate with NR3C1 to exacerbate B-cell-intrinsic ATP depletion.
Our results indicate that B-lymphoid transcription factors, including PAX5 and IKZF1, exert their tumour-suppressor function, at least in part, through the transcriptional repression of glucose transport and the restriction of metabolites that can fuel the tricarboxylic acid cycle. The restriction of the supply of glucose and energy that is imposed by B-lymphoid transcription factors is necessary to prevent the malig-nant transformation of pre-B cells. On the basis of this scenario, we predict that transport-independent glucose metabolites can bypass
Vehicle DMS, OAA
Bonemarrow
Spleen
CD
19
B220
3.98E-37.96E-3 1.31 91.2
0.466.99
7.12 86.7
0.965.18
11.2
0.014 0.071
21.2
CD19
e
Weeks
DMS, OAA
Ove
rall
surv
ival
(%)
Overt leukaemia
GLUT1 INSR
0.2
0.4
0.6
0.8
1.0
Vehicle
MPDMSOAA
DMS + OAADMS + OAA + MP
EV; Vehicle MP, DMS, OAA
0.40 1 2 3
Days4 5 0 1 2 3
Days4 56
0.5
0.6
0.7
0.8
0.9
1.0
PAX5
MP
DMSOAA
DMS + OAADMS + OAA + MP
EV; VehicleDMS, OAA, MP
a
BC
R–A
BL1
GFP
0.014 ± 0.01
Vehicle DMS, OAAb
P-Y (4G10)
BCR–ABL1-pY412
c-Abl
β-actin
Vehicle DMS, OAA
BCR–ABL1
c
f
d
AMP:ATP ratio: de�cit Energy reserve: exhausted
AMP:ATP ratio: balanced Energy reserve: balanced
AMP:ATP ratio: balanced Energy reserve: balanced
Normalpre-B cell
PAX5 IKZF1
Oncogene
TCF3
GLUT1 INSR
AMPK LKB1 NR3C
TXNIP
CNR2
PAX5 IKZF1
EBF1
TCF3
GLUT1 INSR
AMPK LKB1 NR3C
TXNIP
CNR2
PAX5 IKZF1
Oncogene
EBF1
TCF3
EBF1
Pre-leukaemic
AMPK LKB1 NR3C1
TXNIP
CNR2
1 ± 0.5 502 ± 79 P = 0.0004
0.95 ±0.12
P < 0.0001
P < 0.0001
P < 0.0001
P < 0.0001
P < 0.0001
P < 0.0001 P < 0.0001
P < 0.0001
P < 0.0001
P < 0.0001
P = 0.0015
Vehicle100
80
60
40
20
00 1 2 3 4 5 6 7 8 9
P = 0.0002
Vehicle
IKZF1
GFP
+ c
ells
(fol
d c
hang
e)
Figure 4 | Transcriptional restriction of glucose and energy supply prevents oncogenic signalling and pre-B cell transformation. a, Fold change of GFP+ patient-derived pre-B ALL cells carrying GFP-tagged PAX5 (left) or IKZF1 (right) upon treatment with methyl pyruvate (MP; 5 mM), DMS (5 mM) and OAA (5 mM; two-way ANOVA). b, c, Colony formation (b), GFP expression (b, two-tailed t-test), and western blots (c) of vehicle or OAA/DMS-treated mouse BCR–ABL1+ pre-B cells (n = 3, c). d, Kaplan–Meier analysis (log-rank test) of recipient mice injected with treated BCR–ABL1+ pre-B cells (n = 7 per group). e, Representative fluorescence-activated cell sorting (FACS) plots of bone marrow and spleens collected from mice in d. f, Scenario for B-lymphoid transcription factors as metabolic gatekeepers. Data are mean ± s.d. from three independent experiments (a, b). For gel source data, see Supplementary Fig. 1.
© 2017 Macmillan Publishers Limited, part of Springer Nature. All rights reserved.

Letter reSeArCH
2 3 f e b r u a r y 2 0 1 7 | V O L 5 4 2 | N a T u r e | 4 8 3
the gatekeeper function of PAX5 and IKZF1. Reconstitution of PAX5 and IKZF1 was induced in haploinsufficient patient-derived pre-B ALL cells cultured in the presence of vehicle, transport-independent lipophilic methyl pyruvate or the tricarboxylic-acid-cycle interme-diates dimethyl succinate (DMS) and oxaloacetate (OAA; Fig. 4a). Reconstitution of PAX5 and IKZF1 induced a survival disadvantage in competitive-growth assays in the presence of vehicle controls. However, dual (DMS and OAA) and triple (DMS, OAA and methyl pyruvate) combinations almost entirely prevented PAX5- and IKZF1-induced leukaemia cell death (Fig. 4a).
Conditional expression of GFP-tagged BCR–ABL1 from a recently developed conditional knock-in allele23 was insufficient to drive the malignant transformation of pre-B cells. BCR–ABL1+ pre-B cells from these mice remained in a pre-leukaemic state and did not give rise to overt disease. When cultured under control conditions, BCR–ABL1+ pre-B cells formed few colonies and exhibited low BCR–ABL1 kinase activity (Fig. 4b, c). However, when BCR–ABL1+ pre-B cells were incubated for 4 weeks with DMS and OAA, colony numbers increased (vehicle-treated, 1 ± 0.5; DMS/OAA-treated, 502 ± 79), as did BCR–ABL1 expression and activity (Fig. 4b, c). Notably, vehicle-treated BCR–ABL1+ pre-B cells failed to initiate leukaemia when injected into sub-lethally irradiated NSG (Non-obese diabetic/severe combined immunodeficient Il2rg-knockout) mouse recipients. However, six of the seven NSG recipients developed fatal disease within 5 weeks of injection when BCR–ABL1+ pre-B cells were cultured in the contin-uous presence of DMS and OAA (Fig. 4d, e). In the absence of DMS and OAA, only 0.014% of BCR–ABL1+ pre-B cells expressed the BCR–ABL1–GFP fusion protein at detectable levels. Even when treated with DMS and OAA, the fraction of cells expressing BCR–ABL1–GFP did not exceed 1% (Fig. 4b), suggesting that metabolite-induced transfor-mation is a rare event.
During early B-cell development, pre-B cells are under intense selective pressure. Collateral damage during V(D)J-recombination represents a main driver of malignant transformation24,25. We propose that B-lymphoid transcription factors function as metabolic gatekeepers, limiting the supply of glucose and energy to levels that are below the minimum requirements for malignant transformation (Fig. 4f). Pre-leukaemic B-cell clones carrying oncogenic lesions are frequently found in neonatal cord blood26,27. In addition, small fractions of nor-mal B cells in healthy adults carry silent oncogenes28,29. These findings indicate that pre-leukaemic B-cell clones frequently occur in healthy individuals, both during childhood and later in life. We conclude that B-lymphoid repression of glucose uptake and energy supply represents a previously unrecognized metabolic barrier against malignant pre-B-cell transformation and that TXNIP, CNR2 and AMPK are novel targets for the treatment of pre-B ALL.
Online Content Methods, along with any additional Extended Data display items and Source Data, are available in the online version of the paper; references unique to these sections appear only in the online paper.
received 3 October; accepted 21 December 2016.
Published online 13 February 2017.
1. Nutt, S. L., Heavey, B., Rolink, A. G. & Busslinger, M. Commitment to the B-lymphoid lineage depends on the transcription factor Pax5. Nature 401, 556–562 (1999).
2. Georgopoulos, K. et al. The Ikaros gene is required for the development of all lymphoid lineages. Cell 79, 143–156 (1994).
3. Mullighan, C. G. et al. Genome-wide analysis of genetic alterations in acute lymphoblastic leukaemia. Nature 446, 758–764 (2007).
4. Mullighan, C. G. et al. BCR–ABL1 lymphoblastic leukaemia is characterized by the deletion of Ikaros. Nature 453, 110–114 (2008).
5. Nakada, D., Saunders, T. L. & Morrison, S. J. Lkb1 regulates cell cycle and energy metabolism in haematopoietic stem cells. Nature 468, 653–658 (2010).
6. Gan, B. et al. Lkb1 regulates quiescence and metabolic homeostasis of haematopoietic stem cells. Nature 468, 701–704 (2010).
7. Gurumurthy, S. et al. The Lkb1 metabolic sensor maintains haematopoietic stem cell survival. Nature 468, 659–663 (2010).
8. Brennan-Speranza, T. C. et al. Osteoblasts mediate the adverse effects of glucocorticoids on fuel metabolism. J. Clin. Invest. 122, 4172–4189 (2012).
9. Wu, N. et al. AMPK-dependent degradation of TXNIP upon energy stress leads to enhanced glucose uptake via GLUT1. Mol. Cell 49, 1167–1175 (2013).
10. Nogueiras, R. et al. The endocannabinoid system: role in glucose and energy metabolism. Pharmacol. Res. 60, 93–98 (2009).
11. Medina, K. L. et al. Assembling a gene regulatory network for specification of the B cell fate. Dev. Cell 7, 607–617 (2004).
12. Di Tullio, A. et al. CCAAT/enhancer binding protein alpha (C/EBPα )-induced transdifferentiation of pre-B cells into macrophages involves no overt retrodifferentiation. Proc. Natl Acad. Sci. USA 108, 17016–17021 (2011).
13. Fretz, J. A. et al. Altered metabolism and lipodystrophy in the early B-cell factor 1-deficient mouse. Endocrinology 151, 1611–1621 (2010).
14. Wu, Z. et al. Cross-regulation of C/EBPα and PPARγ controls the transcriptional pathway of adipogenesis and insulin sensitivity. Mol. Cell 3, 151–158 (1999).
15. Shaw, R. J. et al. The tumor suppressor LKB1 kinase directly activates AMP-activated kinase and regulates apoptosis in response to energy stress. Proc. Natl Acad. Sci. USA 101, 3329–3335 (2004).
16. Martín-Lorenzo, A. et al. Infection exposure is a causal factor in B-cell precursor acute lymphoblastic leukemia as a result of Pax5-inherited susceptibility. Cancer Discov. 5, 1328–1343 (2015).
17. Faubert, B. et al. AMPK is a negative regulator of the Warburg effect and suppresses tumor growth in vivo. Cell Metab. 17, 113–124 (2013).
18. Zhou, G. et al. Role of AMP-activated protein kinase in mechanism of metformin action. J. Clin. Invest. 108, 1167–1174 (2001).
19. Gilbert, L. A. et al. Genome-scale CRISPR-mediated control of gene repression and activation. Cell 159, 647–661 (2014).
20. Pui, C. H. & Evans, W. E. Treatment of acute lymphoblastic leukemia. N. Engl. J. Med. 354, 166–178 (2006).
21. Hanus, L. et al. HU-308: a specific agonist for CB2, a peripheral cannabinoid receptor. Proc. Natl Acad. Sci. USA 96, 14228–14233 (1999).
22. Stoltzman, C. A., Kaadige, M. R., Peterson, C. W. & Ayer, D. E. MondoA senses non-glucose sugars: regulation of thioredoxin-interacting protein (TXNIP) and the hexose transport curb. J. Biol. Chem. 286, 38027–38034 (2011).
23. Foley, S. B. et al. Expression of BCR/ABL p210 from a knockin allele enhances bone marrow engraftment without inducing neoplasia. Cell Rep. 5, 51–60 (2013).
24. Papaemmanuil, E. et al. RAG-mediated recombination is the predominant driver of oncogenic rearrangement in ETV6–RUNX1 acute lymphoblastic leukemia. Nat. Genet. 46, 116–125 (2014).
25. Swaminathan, S. et al. Mechanisms of clonal evolution in childhood acute lymphoblastic leukemia. Nat. Immunol. 16, 766–774 (2015).
26. Cazzaniga, G. et al. Developmental origins and impact of BCR–ABL1 fusion and IKZF1 deletions in monozygotic twins with Ph+ acute lymphoblastic leukemia. Blood 118, 5559–5564 (2011).
27. Wiemels, J. L. et al. Prenatal origin of acute lymphoblastic leukaemia in children. Lancet 354, 1499–1503 (1999).
28. Bose, S., Deininger, M., Gora-Tybor, J., Goldman, J. M. & Melo, J. V. The presence of typical and atypical BCR–ABL fusion genes in leukocytes of normal individuals: biologic significance and implications for the assessment of minimal residual disease. Blood 92, 3362–3367 (1998).
29. Damm, F. et al. Acquired initiating mutations in early hematopoietic cells of CLL patients. Cancer Discov. 4, 1088–1101 (2014).
Supplementary Information is available in the online version of the paper.
Acknowledgements This work was supported by the NIH/NCI through Outstanding Investigator Award R35CA197628 (to M.M.), R01CA137060, R01CA157644 and R01CA172558 (to M.M.), a Wellcome Trust Senior Investigator Award and a Leukemia and Lymphoma Scholar award (to M.M.), the Howard Hughes Medical Institute HHMI-55108547 (to M.M.), the Alex’s Lemonade Stand Foundation for Childhood Cancer (to M.M.), the William Lawrence & Blanche Hughes Foundation for childhood cancer (to M.M.), the Norman and Sadie Lee Foundation (for Pediatric Cancer, to M.M.), the Falk Trust through a Falk Medical Research Trust Catalyst Award (to M.M.), Cancer Research Institute (CRI) through a Clinic and Laboratory Integration Program (CLIP) grant (to M.M.), the Melanoma Research Alliance Established Investigator Award (to T.G.G.), the German Bundesministerium für Bildung und Forschung, BMBF (to A.H.) and the German Carreras Foundation (DJCLS R13/26) (to A.B. and I.S.-G.). T.G.G. is an American Cancer Society Research Scholar. M.M. is a Howard Hughes Medical Institute (HHMI) Faculty Scholar.
Author Contributions M.M. conceived the study. L.N.C. and M.M. wrote the paper and designed experiments. L.N.C., Z.C., D.B., J.-W.L., G.X., K.N.C., C.H., S.S. and V.C. performed experiments and analysed data. S.M.K. performed functional proteomics. H.G. performed biostatistical analyses. T.A.M., T.E., A.H., M.K. and G.C. provided and characterized patient samples. I.S.-G., A.B., T.S.R., G.J.L. and R.A.D. provided mouse models. M.A.P., K.R.Y., G.J.L., R.A.D., I.S.-G., A.B., H.P.K. and H.S. provided specific expertise in NR3C1, PAX5 and IKZF1 function. D.B. and T.G.G. performed experimentation and provided analysis and expertise in metabolomics.
Author Information Reprints and permissions information is available at www.nature.com/reprints. The authors declare no competing financial interests. Readers are welcome to comment on the online version of the paper. Correspondence and requests for materials should be addressed to M.M. ([email protected]).
© 2017 Macmillan Publishers Limited, part of Springer Nature. All rights reserved.
LetterreSeArCH
MethODSPrimary human samples and cell lines. Pre-B acute lymphoblastic leukaemia (ALL) cells were obtained from patients who gave informed consent in compliance with the guidelines of the Internal Review Board of the University of California San Francisco (Supplementary Table 2). Leukaemia cells from bone marrow biopsy of patients with ALL were xenografted into sublethally irradiated NOD/SCID (non-obese diabetic/severe combined immunodeficient) mice via tail vein injection. After passaging, leukaemia cells were collected. Cells were cultured on OP9 stroma cells in minimum essential medium-α (MEMα ; Invitrogen), supplemented with 20% fetal bovine serum (FBS), 2 mM l-glutamine, 1 mM sodium pyruvate, 100 IU/ml penicillin and 100 μ g/ml streptomycin. Primary chronic myeloid leukaemia (CML) cases were obtained with informed consent from the University Hospital Jena in compliance with institutional internal review boards (including the IRB of the University of California San Francisco; Supplementary Table 3). Cells were cul-tured in Iscove’s modified Dulbecco’s medium (IMDM; Invitrogen) supplemented with 20% BIT serum substitute (StemCell Technologies); 100 IU/ml penicillin and 100 μ g/ml streptomycin; 25 μ mol/l β -mercaptoethanol; 100 ng/ml SCF; 100 ng/ml G-CSF; 20 ng/ml FLT3; 20 ng/ml IL-3; and 20 ng/ml IL-6. Human cell lines (Supplementary Table 2) were obtained from DSMZ and were cultured in Roswell Park Memorial Institute medium (RPMI-1640; Invitrogen) supplemented with GlutaMAX containing 20% FBS, 100 IU/ml penicillin and 100 μ g/ml streptomycin. Cell cultures were kept at 37 °C in a humidified incubator in a 5% CO2 atmosphere. None of the cell lines used was found in the database of commonly misidentified cell lines maintained by ICLAC and NCBI Biosample. All cell lines were authenti-cated by STR profiles and tested negative for mycoplasma.Small-molecule inhibitors and activators and metabolites. BML275 (water- soluble) and imatinib were obtained from Santa Cruz Biotechnology and LC Laboratories, respectively. Stock solutions were prepared in DMSO or sterile water at 10 mmol/l and stored at − 20 °C. Prednisolone and dexamethasone (water- soluble) were purchased from Sigma-Aldrich and were resuspended in ethanol or sterile water, respectively, at 10 mmol/l. Stock solutions were stored at − 20 °C. Fresh solutions (pH-adjusted) of methyl pyruvate, OAA, 3-OMG (an agonist of TXNIP), d-allose (an agonist of TXNIP) and recombinant insulin (Sigma-Aldrich) were prepared for each experiment. DMS was obtained from Acros Organics, and fresh solutions (pH-adjusted) were prepared before each experiment. For com-petitive-growth assays, 5 mmol/l methyl pyruvate, 5 mmol/l dimethyl succinate (DMS) and 5 mmol/l OAA were used. The CNR2 agonist HU308 was obtained from Cayman Chemical.Mouse leukaemia models. To avoid inflammation-related effects in mice, bone marrow cells were extracted from mice (Supplementary Table 4) younger than 6 weeks of age without signs of inflammation. All mouse experiments were con-ducted in compliance with institutional approval by the University of California, San Francisco Institutional Animal Care and Use Committee. Bone marrow cells were obtained by flushing cavities of femur and tibia with PBS. After filtration through a 70-μ m filter and depletion of erythrocytes using a lysis buffer (BD PharmLyse, BD Biosciences), washed cells were either frozen for storage or sub-jected to further experiments.
Bone marrow cells were cultured in IMDM (Invitrogen) with GlutaMAX con-taining 20% fetal bovine serum, 100 IU/ml penicillin, 100 μ g/ml streptomycin and 50 μ M β -mercaptoethanol. To generate pre-B ALL (Ph+ ALL-like) cells, bone marrow cells were cultured in 10 ng/ml recombinant mouse IL-7 (PeproTech) and retrovirally transformed by BCR–ABL1. BCR–ABL1-transformed pre-B ALL cells were propagated only for short periods of time and usually not for longer than 2 months to avoid acquisition of additional genetic lesions during long-term cell culture. To generate myeloid leukaemia (CML-like) cells, the myeloid-restricted protocol described previously30 was used. Bone marrow cells were cultured in 10 ng/ml recombinant mouse IL-3, 25 ng/ml recombinant mouse IL-6, and 50 ng/ml recombinant mouse SCF (PeproTech) and retrovirally transformed by BCR–ABL1. Immunophenotypic characterization was performed by flow cytometry. For con-ditional deletion, a 4-OHT-inducible, Cre-mediated deletion system was used. For retroviral constructs used, see Supplementary Table 5.Retroviral and lentiviral constructs and transduction. Transfection of retrovi-ral constructs (Supplementary Table 5) was performed using Lipofectamine 2000 (Invitrogen) with Opti-MEM medium (Invitrogen). Retroviral supernatant was pro-duced by co-transfecting HEK 293FT cells with the plasmids pHIT60 (gag-pol) and pHIT123 (ecotropic env). Lentiviral supernatant was produced by co-transfecting HEK 293FT cells with the plasmids pCDNL-BH and VSV-G or EM140. 293FT cells were cultured in high glucose Dulbecco’s modified Eagle’s medium (DMEM, Invitrogen) with GlutaMAX containing 10% fetal bovine serum, 100 IU/ml pen-icillin, 100 μ g/ml streptomycin, 25 mmol/l HEPES, 1 mmol/l sodium pyruvate and 0.1 mmol/l non-essential amino acids. Regular medium was replaced after 16 h by growth medium containing 10 mmol /l sodium butyrate. After incubation
for 8 h, the medium was changed back to regular growth medium. After 24 h, retroviral supernatant was collected, filtered through a 0.45-μ m filter and loaded by centrifugation (2,000g, 90 min at 32 °C) onto 50 μ g/ml RetroNectin- (Takara) coated non-tissue 6-well plates. Lentiviral supernatant produced with VSV-G was concentrated using Lenti-X Concentrator (Clontech), loaded onto RetroNectin-coated plates and incubated for 15 min at room temperature. Lentiviral supernatant produced with EM140 was collected, loaded onto RetroNectin-coated plates and incubated for 30 min at room temperature. Per well, 2–3 × 10⁶ cells were transduced by centrifugation at 600g for 30 min and main-tained for 48 h at 37 °C with 5% CO2 before transferring into culture flasks. For cells transduced with lentiviral supernatant produced with EM140, supernatant was removed the day after transduction and replaced with fresh culture medium. Cells transduced with oestrogen-receptor fusion proteins were induced with 4-OHT (1 μ mol/l). Cells transduced with constructs carrying an antibiotic-resistance marker were selected with its respective antibiotic.Inducible gain- and loss-of-function of IKZF1 and PAX5. For loss-of-function studies, dominant-negative variants of IKZF1 (DN-IKZF1, lacking the IKZF1 zinc fingers 1–4) and PAX5 (DN-PAX5; PAX5–ETV6 fusion) were cloned from patient samples. Expression of DN-IKZF1 was induced by doxycycline (1 μ g/ml), while activation of DN-PAX5 was induced by 4-OHT (1 μ g/ml) in patient- derived pre-B ALL cells carrying IKZF1 and PAX5 wild-type alleles, respectively. Inducible reconstitution of wild-type IKZF1 and PAX5 in haploinsufficient pre-B ALL cells carrying deletions of either IKZF1 (IKZF1Δ) or PAX5 (PAX5Δ) were also studied. Lentiviral constructs used are listed in Supplementary Table 5. A doxycycline-inducible TetOn vector system was used for inducible expression of PAX5 in mouse BCR–ABL1 pre-B ALL. The retroviral constructs used are listed in Supplementary Table 5.CEBPα-mediated reprogramming of pre-B cells into the myeloid lineage. To study the effects of B-cell- versus myeloid-lineage identity in genetically identical mouse leukaemia cells, a doxycycline-inducible TetOn-CEBPα vector system31 was used to reprogram B cells. Mouse BCR–ABL1 pre-B ALL cells expressing doxycycline-inducible CEBPα or an empty vector were induced with doxycycline (1 μ g/ml). Conversion from the B-cell lineage (CD19+Mac1−) to the myeloid line-age (CD19−Mac1+) was monitored by flow cytometry. For western blots, B-lineage cells (CD19+Mac1−) and CEBPα -reprogrammed cells (CD19−Mac1+) were sorted from cells expressing an empty vector or CEBPα , respectively, following doxycycline induction. For metabolic assays, sorted B-lineage cells and CEBP α -reprogrammed cells were cultured (with doxycycline) for 2 days following sorting, and were then seeded in fresh medium for measurement of glucose consumption (normalized to cell numbers) and total ATP levels (normalized to total protein).
To study Lkb1 deletion in the context of CEBPα -mediated reprogramming, BCR–ABL1-transformed Lkb1fl/fl pre-B ALL cells expressing doxycycline- inducible CEBPα were transduced with 4-OHT(1 μ g/ml) inducible Cre-GFP (Cre-ERT2-GFP). Without sorting for GFP+ cells, cells were induced with dox-ycycline and 4-OHT. Viability (expressed as relative change of GFP+ cells) was measured separately in B-lineage (gated on CD19+ Mac1−) and myeloid lineage (gated on CD19− Mac1+) populations.
To study whether Lkb1 deletion causes CEBPα -dependent effects on metabolism and signalling, Lkb1fl/fl BCR–ABL1 B-lineage ALL cells expressing doxycycline- inducible CEBPα or an empty vector were transduced with 4-OHT-inducible Cre-GFP. After sorting for GFP+ populations, cells were induced with doxycycline. B-lineage cells (CD19+ Mac1−) and CEBPα -reprogrammed cells (CD19− Mac1+) were sorted from cells expressing an empty vector or CEBPα , respectively. Sorted cells were cultured with doxycycline and induced with 4-OHT. Protein lysates were collected on day 2 following 4-OHT induction. For metabolomics, sorted cells were re-seeded in fresh medium on day 2 following 4-OHT induction and collected for metabolite extraction.CRISPR-mediated gene editing. For CRISPR/Cas9-mediated deletion of target genes, all constructs including lentiviral vectors expressing gRNA and Cas9 nucle-ase were purchased from Transomic Technologies (Supplementary Table 5; see Supplementary Table 6 for gRNA sequences). In brief, patient-derived pre-B ALL cells transduced with GFP-tagged, 4-OHT-inducible PAX5 or an empty vector were transduced with pCLIP-hCMV-Cas9-Nuclease-Blast. Blasticidin-resistant cells were subsequently transduced with pCLIP-hCMV-gRNA-RFP. Non-targeting gRNA was used as control.
Constructs including lentiviral vectors expressing gRNA and dCas9-VPR used for CRISPR/dCas9-mediated activation of gene expression are listed in Supplementary Table 5. Nuclease-null Cas9 (dCas9) fused with VP64-p65-Rta (VPR) was cloned from SP-dCas9-VPR (a gift from G. Church; Addgene plasmid #63798) and then subcloned into pCL6 vector with a blasticidin-resistant marker. gRNA sequences (Supplementary Table 6) targeting the transcriptional start site
© 2017 Macmillan Publishers Limited, part of Springer Nature. All rights reserved.

Letter reSeArCH
of each specific gene were obtained from public databases (http://sam.genome- engineering.org/ and http://www.genscript.com/gRNA-database.html)32. gBlocks Gene Fragments were used to generate single-guide RNAs (sgRNAs) and were purchased from Integrated DNA Technologies, Inc. Each gRNA was subcloned into pCL6 vector with a dsRed reporter. Patient-derived pre-B ALL cells transduced with either GFP-tagged inducible PAX5 or an empty vector were transduced with pCL6-hCMV-dCas9-VPR-Blast. Blasticidin-resistant cells were used for subse-quent transduction with pCL6-hCMV-gRNA-dsRed, and dsRed+ cells were further analysed by flow cytometry. For each target gene, 2–3 sgRNA clones were pooled together to generate lentiviruses. Non-targeting gRNA was used as control. To elucidate the mechanistic contribution of PAX5 targets, the percentage of GFP+ cells carrying gRNA(s) for each target gene was monitored by flow cytometry upon inducible activation of GFP-tagged PAX5 or an empty vector in patient-derived pre-B ALL cells in competitive-growth assays.Western blotting. Cells were lysed in CelLytic buffer (Sigma-Aldrich) supple-mented with a 1% protease inhibitor cocktail (Thermo Fisher Scientific). A total of 20 μ g of protein mixture per sample was separated on NuPAGE (Invitrogen) 4–12% Bis-Tris gradient gels or 4–20% Mini-PROTEAN TGX precast gels, and transferred onto nitrocellulose membranes (Bio-Rad). The primary antibodies used are listed in Supplementary Table 7. For protein detection, the WesternBreeze Immunodetection System (Invitrogen) was used, and light emission was detected by either film exposure or the BioSpectrum Imaging system (UPV).Flow cytometry. Approximately 106 cells per sample were resuspended in PBS blocked using Fc blocker for 10 min on ice, followed by staining with the appropri-ate dilution of the antibodies or their respective isotype controls for 15 min on ice. Cells were washed and resuspended in PBS with propidium iodide (0.2 μ g/ml) or DAPI (0.75 μ g/ml) as a dead-cell marker. The antibodies used for flow cytometry are listed in Supplementary Table 7. For competitive-growth assays, the percentage of GFP+ cells was monitored by flow cytometry. For annexin V staining, annexin V binding buffer (BD Bioscience) was used instead of PBS and 7-aminoactinomycin D (7AAD; BD Bioscience) instead of propidium iodide. Phycoerythrin-labelled annexin V was purchased from BD Bioscience. For BrdU staining, the BrdU Flow Kit was purchased from BD Bioscience and used according to the manufacturer’s protocol.Colony-forming assay. Methylcellulose colony-forming assays were performed with 10,000 BCR–ABL1 pre-B ALL cells. Cells were resuspended in mouse MethoCult medium (StemCell Technologies) and cultured on 3-cm dishes, with an extra water supply dish to prevent evaporation. Images were taken and colony numbers were counted after 14 days.Cell viability assay and determination of viable cell counts. Cell viability upon the genetic loss of function of target genes and/or inducible expression of PAX5 was monitored by flow cytometry using propidium iodide (0.2 μ g/ml) as a dead-cell marker. To study the effects of an AMPK inhibitor (BML275), glucocorticoids (dexamethasone and prednisolone), CNR2 agonist (HU308), or TXNIP agonists (3-OMG and d-allose), 40,000 human or mouse leukaemia cells were seeded in a volume of 80 μ l in complete growth medium on opaque-walled, white 96-well plates (BD Biosciences). Compounds were added at the indicated concentrations giving a total volume of 100 μ l per well. After culturing for 3 days, cells were sub-jected to CellTiter-Glo Luminescent Cell Viability Assay (Promega). Relative via-bility was calculated using baseline values of cells treated with vehicle control as a reference. Combination index (CI) was calculated using the CalcuSyn software to determine interaction (synergistic, CI < 1; additive, CI = 1; or antagonistic, CI > 1) between the two agents. Constant ratio combination design was used. Concentrations of BML275, d-allose, 3-OMG and HU308 used are indicated in the figures. Concentrations of Dex used were tenfold lower than those of BML275. Concentrations of prednisolone used were twofold lower than those of BML275. To determine the number of viable cells, the trypan blue exclusion method was applied, using the Vi-CELL Cell Counter (Beckman Coulter).Single-locus quantitative ChIP and ChIP–seq data. ChIP was performed as described previously33. Chromatin from fixed patient-derived Ph+ ALL cells (ICN1) was isolated and sonicated to 100–500-bp DNA fragments. Chromatin fragments were immunoprecipitated with either IgG (as a control) or anti-Pax5 antibody (see Supplementary Table 7). Following reversal of crosslinking by for-maldehyde, specific DNA sequences were analysed by quantitative real-time PCR (see Supplementary Table 8 for primers). Primers were designed according to ChIP–seq tracks for PAX5 antibodies in B lymphocytes (ENCODE, Encyclopedia of DNA Elements, GM12878). ChIP–seq tracks for PAX5, IKZF1, EBF1 and TCF3 antibodies in a normal B-cell sample (ENCODE GM12878, UCSC genome browser) on INSR, GLUT1, GLUT3, GLUT6, HK2, G6PD, NR3C1, TXNIP, CNR2 and LKB1 gene promoter regions are shown. CD19 and ACTA1 served as a positive and a negative control gene, respectively. The y axis represents the normalized number of reads per million reads for peak summit for each track. The ChIP–seq
peaks were called by the MACS peak-caller by comparing read density in the ChIP experiment relative to the input chromatin control reads, and are shown as bars under each wiggle track. Gene models are shown in UCSC genome browser hg19.Glucose and ATP measurements. Extracellular glucose levels were measured using the Amplex Red Glucose/Glucose Oxidase Assay Kit (Invitrogen), according to the manufacturer’s protocol. Glucose concentrations were measured in fresh and spent medium. Total ATP levels were measured using the ATP Bioluminescence Assay Kit CLS II (Roche) according to the manufacturer’s protocol. In fresh medium, 1 × 10⁶ cells per ml were seeded and treated as indicated in the figure legends. Relative levels of glucose consumed and total ATP are shown. All values were normalized to cell numbers (Figs 1b, c, 2c (glucose uptake), 3a and Extended Data Figs 2c, 4f, 6d) or total protein (Fig. 2c, ATP levels). Numbers of viable cells were determined by applying trypan blue dye exclusion, using the Vi-CELL Cell Counter (Beckman Coulter).Metabolic assays using the XFe24 Flux Analyzer. Oxygen consumption rate (OCR) and extracellular acidification rate (ECAR) were measured using a Seahorse XFe24 Flux Analyzer with an XF Cell Mito Stress Test Kit and XF Glycolysis Stress Test Kit (Seahorse Bioscience) according to the manufacturer’s instructions. All compounds and materials were obtained from Seahorse Bioscience. In brief, 1.5 × 10⁵ cells per well were plated using Cell-Tak (BD Biosciences). Following incubation in XF-Base medium supplemented with glucose and GlutaMAX for 1 h at 37 °C (non-CO2 incubator) for pH stabilization, OCR was measured at the rest-ing stage (basal respiration in XF Base medium supplemented with GlutaMax and glucose) and in response to oligomycin (1 μ mol/l; mitochondrial ATP production), mitochondrial uncoupler FCCP (5 μ mol/l; maximal respiration), and respiratory chain inhibitor antimycin and rotenone (1 μ mol/l). Spare respiratory capacity is the difference between maximal respiration and basal respiration. ECAR was meas-ured under specific conditions to generate glycolytic profiles. Following incubation in glucose-free XF Base medium supplemented with GlutaMAX for 1 h at 37 °C (non-CO2 incubator) for pH stabilization, basal ECAR was measured. Following measurement of the glucose-deprived, basal ECAR, changes in ECAR upon the sequential addition of glucose (10 mmol/l; glycolysis), oligomycin (1 μ mol/l; glycolytic capacity), and 2-deoxyglucose (0.1 mol/l) were measured. Glycolytic reserve was determined as the difference between oligomycin-stimulated glycolytic capacity and glucose-stimulated glycolysis. All values were normalized to cell num-bers (Extended Data Fig. 2c) or total protein (Extended Data Figs 3a, 7a, b, 8f) and are shown as the fold change relative to basal ECAR or OCR.Metabolite extraction and mass-spectrometry-based analysis. Metabolite extraction and mass-spectrometry-based analysis were performed as described previously34. Metabolites were extracted from 2 × 10⁵ cells per sample using the methanol/water/chloroform method. After incubation at 37 °C for the indicated time, cells were rinsed with 150 mM ammonium acetate (pH 7.3), and 400 μ l cold 100% methanol (Optima* LC/MS, Fisher) and then 400 μ l cold water (HPLC-Grade, Fisher) was added to cells. A total of 10 nmol norvaline (Sigma) was added as internal control, followed by 400 μ l cold chloroform (HPLC-Grade, Fisher). Samples were vortexed three times over 15 min and spun down at top speed for 5 min at 4 °C. The top layer (aqueous phase) was transferred to a new Eppendorf tube, and samples were dried on Vacufuge Plus (Eppendorf) at 30 °C. Extracted metabolites were stored at − 80 °C. For mass spectrometry-based analysis, the metabolites were resuspended in 70% acetonitrile and 5 μ l used for analysis with a mass spectrometer. The mass spectrometer (Q Exactive, Thermo Scientific) was coupled to an UltiMate3000 RSLCnano HPLC. The chromatography was per-formed with 5 mM NH4AcO (pH 9.9) and acetonitrile at a flow rate of 300 μ l/min starting at 85% acetonitrile, going to 5% acetonitrile at 18 min, followed by an isocratic step to 27 min and re-equilibration to 34 min. The separation was achieved on a Luna 3u NH2 100A (150 × 2 mm) (Phenomenex). The Q Exactive was run in polarity switching mode (+ 3 kV/− 2.25 kV). Metabolites were detected based on retention time (tR) and on accurate mass (± 3 p.p.m.). Metabolite quantification was performed as area-under-the-curve (AUC) with TraceFinder 3.1 (Thermo Scientific). Data analysis was performed in R (https://www.r-project.org/), and data were normalized to the number of cells. Relative amounts were log2-transformed, median-centred and are shown as a heat map.Oncogenic priming of Mb1-Cre; Bcr+/LSL-BCR/ABL B-cell precursor cells. To generate a model for pre-leukaemic B cell precursors expressing BCR–ABL1, BCR–ABL1 knock-in mice were crossed with Mb1-Cre deleter strain (Mb1-Cre; Bcr+/LSL-BCR/ABL) for excision of a stop-cassette in early pre-B cells. Bone marrow cells collected from Mb1-Cre; Bcr+/LSL-BCR/ABL mice cultured in the presence of IL-7 were primed with vehicle control or a combination of OAA (8 mmol/l), DMS (8 mmol/l) and insulin (210 pmol/l). Following a week of priming, cells were main-tained and expanded in the presence of IL-7, supplemented with vehicle control or a combination of OAA (0.8 mmol/l) and DMS (0.8 mmol/l) for 4 weeks. Pre-B cells from Mb1-Cre; Bcr+/LSL-BCR/ABL mice expressed low levels of BCR–ABL1 tagged
© 2017 Macmillan Publishers Limited, part of Springer Nature. All rights reserved.

LetterreSeArCH
to GFP, and were analysed by flow cytometry for surface expression of GFP and CD19. The methylcellulose colony-forming assays were performed with 10,000 cells treated with vehicle control or metabolites. Cells were resuspended in mouse MethoCult medium (StemCell Technologies) and cultured on 3-cm diameter dishes, with an extra water supply dish to prevent evaporation. Images were taken and colony numbers counted after 14 days.
For in vivo transplantation experiments, cells were treated with vehicle control or metabolites (OAA/DMS) for 6 weeks. One million cells were intravenously injected into sublethally irradiated (250 cGy) 6–8-week-old female NSG mice (n = 7 per group). Mice were randomly allocated into each group, and the mini-mal number of mice in each group was calculated by using the ‘cpower’ function in R/Hmisc package. No blinding was used. Each mouse was killed when it became terminally sick and showed signs of leukaemia burden (hunched back, weight loss and inability to move). The bone marrow and spleen were collected for flow cytometry analyses for leukaemia infiltration (CD19, B220). After 63 days, all remaining mice were killed and bone marrow and spleens from all mice were analysed by flow cytometry. Statistical analysis was performed using the Mantel–Cox log-rank test. All mouse experiments were in compliance with institutional approval by the University of California, San Francisco Institutional Animal Care and Use Committee.In vivo experiments. Following cytokine-independent proliferation, BCR–ABL1-transformed Lkb1fl/fl or AMPKa2fl/fl pre-B ALL cells were transduced with 4-OHT-inducible Cre or an empty vector control. For ex vivo deletion, deletion was induced 24 h before injection. For in vivo deletion, deletion was induced by 4-OHT (0.4 mg per mouse; intraperitoneal injection). Approximately 106 cells were injected into each sublethally irradiated (250 cGy) NOD/SCID mouse. Seven mice per group were injected via the tail vein.
We randomly allocated 6–8-week-old female NOD/SCID or NSG mice into each group. The minimal number of mice in each group was calculated using the ‘cpower’ function in R/Hmisc package. No blinding was used. When a mouse became terminally sick and showed signs of leukaemia burden (hunched back, weight loss and inability to move), it was killed and the bone marrow and/or spleen were collected for flow cytometry analyses for leukaemia infiltration. Statistical analysis was performed by Mantel–Cox log-rank test. In vivo expansion and leukaemia burden were monitored by luciferase bioimaging. Bioimaging of leukaemia progression in mice was performed at the indicated time points using an in vivo IVIS 100 bioluminescence/optical imaging system (Xenogen). d-luciferin (Promega) dissolved in PBS was injected intraperitoneally at a dose of 2.5 mg per mouse 15 min before measuring the luminescence signal. General anaesthesia was induced with 5% isoflurane and continued during the procedure with 2% isoflurane introduced through a nose cone. All mouse experiments were in com-pliance with institutional approval by the University of California, San Francisco Institutional Animal Care and Use Committee.Statistical analysis and reproducibility. Data are shown as mean ± s.d. unless stated. Statistical significance was analysed by using Grahpad Prism software or R software (https://www.r-project.org/) by using two-tailed t-test, two-way ANOVA, or log-rank test as indicated in figure legends. Significance was considered at P < 0.05. For in vitro experiments, no statistical methods were used to predetermine
the sample size. For in vivo transplantation experiments, the minimal number of mice in each group was calculated through use of the ‘cpower’ function in the R/Hmisc package. No animals were excluded. Overall survival and relapse-free sur-vival data were obtained from GEO accession number GSE11877 (refs 35, 36) and TCGA. Kaplan–Meier survival analysis was used to estimate overall survival and relapse-free survival. Patients with high risk pre-B ALL (COG clinical trial, P9906, n = 207; Supplementary Table 10) were segregated into two groups on the basis of high or low mRNA levels with respect to the median mRNA values of the probe sets for the gene of interest. A log-rank test was used to compare survival differ-ences between patient groups. R package ‘survival’ Version 2.35-8 was used for the survival analysis and Cox proportional hazards regression model in R package for the multivariate analysis (https://www.r-project.org/). The investigators were not blinded to allocation during experiments and outcome assessment. Experiments were repeated to ensure reproducibility of the observations.Data availability. Gel scans are provided in Supplementary Fig. 1. Gene expres-sion data were obtained from the GEO database accession numbers GSE32330 (ref. 12), GSE52870 (ref. 37), and GSE38463 (ref. 38). Patient-outcome data were derived from the National Cancer Institute TARGET Data Matrix of the Children’s Oncology Group (COG) Clinical Trial P9906 (GSE11877)35,36 and from TCGA (the Cancer Genome Atlas). GEO accession details are provided in Supplementary Tables 9 and 10. ChIP–seq tracks for PAX5, IKZF1, EBF1 and TCF3 antibodies in a normal B-cell sample (ENCODE GM12878, UCSC genome browser) on INSR, GLUT1, GLUT3, GLUT6, HK2, G6PD, NR3C1, TXNIP, CNR2 and LKB1 gene promoter regions are shown in UCSC genome browser hg19. All other data are available from the corresponding author upon reasonable request.
30. Li, S., Ilaria, R. L., Jr, Million, R. P., Daley, G. Q. & Van Etten, R. A. The P190, P210, and P230 forms of the BCR/ABL oncogene induce a similar chronic myeloid leukemia-like syndrome in mice but have different lymphoid leukemogenic activity. J. Exp. Med. 189, 1399–1412 (1999).
31. Xie, H., Ye, M., Feng, R. & Graf, T. Stepwise reprogramming of B cells into macrophages. Cell 117, 663–676 (2004).
32. Konermann, S. et al. Genome-scale transcriptional activation by an engineered CRISPR–Cas9 complex. Nature 517, 583–588 (2015).
33. Ochiai, K. et al. A self-reinforcing regulatory network triggered by limiting IL-7 activates pre-BCR signaling and differentiation. Nat. Immunol. 13, 300–307 (2012).
34. Thai, M. et al. Adenovirus E4ORF1-induced MYC activation promotes host cell anabolic glucose metabolism and virus replication. Cell Metab. 19, 694–701 (2014).
35. Harvey, R. C. et al. Identification of novel cluster groups in pediatric high-risk B-precursor acute lymphoblastic leukemia with gene expression profiling: correlation with genome-wide DNA copy number alterations, clinical characteristics, and outcome. Blood 116, 4874–4884 (2010).
36. Kang, H. et al. Gene expression classifiers for relapse-free survival and minimal residual disease improve risk classification and outcome prediction in pediatric B-precursor acute lymphoblastic leukemia. Blood 115, 1394–1405 (2010).
37. Liu, G. J. et al. Pax5 loss imposes a reversible differentiation block in B-progenitor acute lymphoblastic leukemia. Genes Dev. 28, 1337–1350 (2014).
38. Holmfeldt, L. et al. The genomic landscape of hypodiploid acute lymphoblastic leukemia. Nat. Genet. 45, 242–252 (2013).
© 2017 Macmillan Publishers Limited, part of Springer Nature. All rights reserved.

Letter reSeArCH
Extended Data Figure 1 | Frequent genetic lesions of B-lymphoid transcription factors in B-cell lineage leukaemia. a, Gene expression of B-lymphoid transcription factors (top) as well as positive (middle) and negative (bottom) regulators of glucose uptake and energy supply upon inducible restoration of Pax5 (GEO accession number: GSE52870)38 in haploinsufficient pre-B leukaemia cells. b, Lesions in PAX5, IKZF1, EBF1 and TCF3 were studied in clinical trials for B-lymphoid ALL in children (P9906; n = 187; top) and adults (MDACC; n = 92; bottom). Red and grey boxes denote patient samples with detected lesions. c, Protein expression of PAX5 and IKZF1 was examined by western blot in ten patient-derived
pre-B ALL samples. The control samples were CD19+ B cells from four healthy donors. d, ChIP–seq analysis for binding of B-lymphoid transcription factors in human B cells (ENCODE cell ID: GM12878) to promoter regions of molecules implicated in positive (INSR, GLUT1, GLUT3, GLUT6, HK2, G6PD, LKB1) and negative (NR3C1, TXNIP, CNR2) regulation of glucose uptake and utilization. e, Recruitment of PAX5 was confirmed by quantitative ChIP in patient-derived pre-B ALL cells. Data shown as mean ± s.d. from three independent experiments and assessed by two-tailed t-test. For gel source data, see Supplementary Fig. 1.
© 2017 Macmillan Publishers Limited, part of Springer Nature. All rights reserved.

LetterreSeArCH
Extended Data Figure 2 | The B-lymphoid transcription factor PAX5 functions as a metabolic gatekeeper. a, Protein levels of PAX5 and IKZF1 in haploinsufficient patient-derived pre-B ALL cells and pre-B ALL cells expressing functional PAX5 and IKZF1. b, Number of viable cells and cell viability upon inducible activation of PAX5 in haploinsufficient patient-derived pre-B ALL (PAX5Δ) cells. c, To test whether Pax5 functions as metabolic gatekeeper, BCR–ABL1-induced changes in glycolytic activity
and capacity (ECAR), glucose uptake, and ATP levels (normalized to cell numbers) were studied in Pax5 wild-type and Pax5 haploinsufficient pre-B cells in the presence or absence of a BCR–ABL1-transgene. Data shown as mean ± s.d. from three independent experiments and assessed by two-tailed t-test (b, left; c) or two-way ANOVA (b, right). For gel source data, see Supplementary Fig. 1.
© 2017 Macmillan Publishers Limited, part of Springer Nature. All rights reserved.

Letter reSeArCH
Extended Data Figure 3 | Divergent metabolic characteristics of myeloid and B-lineage leukaemia. a, Glycolytic reserve (ECAR) and mitochondrial functions (OCR) in patient-derived myeloid (CML) and B-lymphoid (Ph+ ALL) leukaemia samples (n = 5, each in triplicate). Values were normalized to total protein and are shown as mean ± s.d., assessed by two-tailed t-test. b, Mouse pre-B ALL cells were reprogrammed into myeloid differentiation using a doxycycline-inducible
TetOn-Cebpa vector system, and characterized by flow cytometry (representative results from three independent experiments). c, Heat map of gene expression of glucose uptake and metabolism regulators (GEO accession number: GSE32330)12. d, Western blots of mouse pre-B ALL cells upon B-to-myeloid cell reprogramming to verify gene expression changes. For gel source data, see Supplementary Fig. 1.
© 2017 Macmillan Publishers Limited, part of Springer Nature. All rights reserved.

LetterreSeArCH
Extended Data Figure 4 | See next page for caption.
© 2017 Macmillan Publishers Limited, part of Springer Nature. All rights reserved.

Letter reSeArCH
Extended Data Figure 4 | The energy stress sensor LKB1–AMPK plays a pro-survival role and modulates glucose uptake and energy supply in pre-B ALL. a, Lkb1fl/fl mice were crossed with Cre-deleter strains for deletion at early pre-B-cell stages (Mb1) and in fully mature B cells (Cd21). B-cell populations in bone marrow and spleen (n = 3 litter mates) were characterized by flow cytometry analysis. b, The catalytic subunit of Ampk has two isoforms, α 1 and α 2. Analysis of published gene expression data (GSE38463)38 revealed that expression of the α 1-form peaks at later stages of B-cell development, whereas expression of both Lkb1 and the α 2-form of Ampk peaks in pre-B cells. For this reason, we studied the consequences of inducible ablation of Lkb1 and Ampka2 in mouse models of BCR–ABL1-transformed pre-B ALL cells. Protein levels of Lkb1 and Ampkα 2 were verified by western blots. c, Viable cell counts upon Cre-mediated deletion of Lkb1 or Ampka2 or on treatment with an empty vector (EV). d, Apoptosis following Lkb1 deletion was monitored
by annexin V/ 7-aminoactinomycin D (7AAD) staining. e, Colony-forming ability was assessed by serial re-plating upon deletion of Lkb1 in pre-B ALL cells. f, Glucose uptake and ATP levels (normalized to cell numbers) were measured following Cre-mediated deletion of Ampka2. g, Luciferase bioimaging of transplant recipient mice injected with Lkb1fl/fl pre-B ALL cells transduced with 4-OHT-inducible Cre or an empty vector and treated with tamoxifen (0.4 mg per mouse; n = 7 per group). h, Overall survival was assessed by a Kaplan–Meier analysis (P value calculated by Mantel–Cox log-rank test). i, Leukaemia samples developed in recipient mice (Fig. 2d) were genotyped for the presence of either floxed or deleted Lkb1 and Ampka2 alleles (n = 3 mice). Representative FACS plots and images from three independent experiments are shown (a, d, e). Data shown as mean ± s.d. from three independent experiments and assessed by two-way ANOVA (c) or two-tailed t-test (e, f). For gel source data, see Supplementary Fig. 1.
© 2017 Macmillan Publishers Limited, part of Springer Nature. All rights reserved.

LetterreSeArCH
Extended Data Figure 5 | LKB1 and AMPK are independent predictors of poor clinical outcome for patients with pre-B ALL. a, b, Children with high-risk pre-B ALL (P9906, n = 207) were divided into two groups based on higher- or lower-than-median mRNA levels of LKB1 (a) or AMPKΑ2 (b). c, d, Adults with acute myeloid leukaemia (AML; The Cancer Genome Atlas, n = 184) were divided into two groups based on higher- or lower-than-median mRNA levels of LKB1 (c) or AMPKΑ2 (d). Overall survival of patients was assessed in the two groups by Kaplan–Meier analysis. A log-rank test was used to assess statistical significance (a–d).
e, Frequencies of somatic mutations in the coding regions of EBF1 (top, blue), IKZF1 (middle, grey) and PAX5 (bottom, red) from the Catalogue of Somatic Mutations in Cancer (COSMIC) database are plotted for pre-B ALL and various subtypes of mature B-cell lymphoma. Somatic mutations in the 5′ UTR regions of EBF1, IKZF1 and PAX5 frequently represent by-products of somatic hypermutation during normal B-cell development and are not included in this analysis. PCNL, primary central nervous system lymphoma.
© 2017 Macmillan Publishers Limited, part of Springer Nature. All rights reserved.

Letter reSeArCH
Extended Data Figure 6 | Divergent functions of Lkb1 in BCR–ABL1-driven pre-B ALL and myeloid leukaemia. a, Staining of Lkb1fl/fl BCR–ABL1 myeloid (CML-like) and B-lineage (Ph+ ALL-like) leukaemia cells with (Cre) or without (empty vector (EV)) deletion of Lkb1 for the surface markers CD19, B220 (B-lymphoid), Sca-1 and CD13 (myeloid). b, Phosphorylation of AMPKα -T172, AKT-S473 and S6-S235 and protein levels of cell-cycle checkpoint molecules Arf, p53 and p27 following Lkb1-deletion. c, Viable cell counts upon deletion of Lkb1. d, Glucose uptake and ATP levels (normalized to cell numbers) in myeloid and B-lymphoid
leukaemia cells upon Lkb1-deletion (n = 6). Data are shown as mean ± s.d. e, Cell-cycle analyses were performed by measuring BrdU incorporation in combination with 7AAD staining. Percentages of cells in G0/1, S, and G2/M phases are shown. Viability following Lkb1 deletion was monitored by annexin V/7AAD staining. Representative FACS plots from three independent experiments are shown (a, e). Data shown as mean ± s.d. from three independent experiments (c, e), assessed by two-tailed t-test (c–e). For gel source data, see Supplementary Fig. 1.
© 2017 Macmillan Publishers Limited, part of Springer Nature. All rights reserved.

LetterreSeArCH
Extended Data Figure 7 | Activity of the energy-stress sensor LKB1 represents a specific vulnerability of B-lymphoid leukaemia. a, b, Glycolytic profiles (ECAR; a) and mitochondrial functions (OCR; b) upon Lkb1-deletion in B-lymphoid leukaemia cells with (left) or without (right) B-to-myeloid cell reprogramming. Values were normalized to total protein (n = 6). c, AMP levels in sorted B-lymphoid and B-to-myeloid reprogrammed cells are shown as log2-transformed relative amounts
(the amount in Lkb1-deleted cells divided by the average amount in control samples), and data were baseline-centred (the baseline is equal to the average amount in control samples; n = 3). d, Phosphorylation of Ampkα -T172, Ulk-S555, Raptor-S792 and Acc-S79 was assessed by western blots. Data shown as mean ± s.d. and assessed by two-tailed t-test (a–c). For gel source data, see Supplementary Fig. 1.
© 2017 Macmillan Publishers Limited, part of Springer Nature. All rights reserved.

Letter reSeArCH
Extended Data Figure 8 | See next page for caption.
© 2017 Macmillan Publishers Limited, part of Springer Nature. All rights reserved.

LetterreSeArCH
Extended Data Figure 8 | Small molecule inhibition of AMPK in human pre-B ALL. a, Human leukaemia and lymphoma cells (n = 4 biological replicates for B-cell lymphoma and pre-B ALL; n = 3 biological replicates for CML; each in triplicate) were treated with BML275 (72 h), and relative viability was assessed. b, Apoptosis was examined by annexin V/7AAD staining in patient-derived pre-B ALL samples (n = 3) upon treatment with BML275 (10 μ mol/l). c, Phospho-ACC-S79 in patient-derived pre-B ALL samples (n = 5) following overnight treatment with control (− ) or BML275 (+ , 10 μ mol/l) was assessed. d, Phosphorylation of S6-S235/236 and Akt-S473 in patient-derived pre-B ALL samples (n = 6) following overnight treatment with control (− ) or BML275 (+ , 10 μ mol/l) was assessed. e, Levels of AMP (normalized to cell numbers) in patient-derived
CML (CML5 and CML6) and Ph+ ALL (ICN1 and PDX2) cells following treatment with control or BML275 (10 μ mol/l for 12 h). Plotted are log2-transformed average relative amounts (amount in cells treated with BML275 divided by the average amount of that in control cells; two cases per group; each in triplicate); data were median-centred. Median-centring was performed separately for CML5, CML6, ICN1 and PDX2 samples. f, Patient-derived CML (left) and pre-B ALL (middle) cells as well as MYC-driven B-cell lymphoma cell lines (right) were treated with BML275 (10 μ mol/l) or vehicle control for 6 h. Glycolytic profiles (ECAR) and mitochondrial functions (OCR) were measured (normalized to total protein; n = 6; f). Data shown as mean ± s.d. and assessed by two-tailed t-test (e, f).
© 2017 Macmillan Publishers Limited, part of Springer Nature. All rights reserved.

Letter reSeArCH
Extended Data Figure 9 | See next page for caption.
© 2017 Macmillan Publishers Limited, part of Springer Nature. All rights reserved.

LetterreSeArCH
Extended Data Figure 9 | Mechanistic contribution of PAX5 targets. a, b, Representative FACS plots from CRISPR-based gene editing experiments (a). CRISPR complexes were delivered to patient-derived PAX5-haploinsufficient pre-B ALL cells along with RFP-tagged gRNAs to direct dCas9 (CRISPR-mediated gene activation) or Cas9 (CRISPR-mediated gene deletion) to specific PAX5 target genes (for example, NR3C1; left). Upon inducible activation of GFP-tagged PAX5 or an empty vector (EV) in patient-derived pre-B ALL cells, enrichment or depletion of GFP+ cells carrying RFP-tagged gRNAs (RFP+) was monitored by flow cytometry (right; NT, non-targeting; g-53, gRNA clone 53 for deletion of NR3C1). Changes in percentage of GFP+ cells carrying the indicated gRNAs following induction, as compared to cells carrying the non-targeting gRNA (b). c, d, In mouse pre-B ALL models for genetic
loss of Nr3c1, Cnr2, and Txnip function, responses to prednisolone (Pred) were measured (c) and protein levels of Nr3c1, Txnip and Cnr2 were examined (d). e, In a patient-derived PAX5-haploinsufficient pre-B ALL sample (PAX5Δ; left), dexamethasone responses upon inducible activation of PAX5 or empty vector were measured. In a patient-derived PAX5 wild-type pre-B ALL sample (PAX5WT; right), effects of DN-PAX5 on dexamethasone responses were measured. Likewise, dose–response curves for dexamethasone were measured in two patient-derived pre-B ALL samples carrying either wild-type or deleted IKZF1 upon induction of DN-IKZF1 or IKZF1 expression, respectively. Data shown as mean ± s.d. from three independent experiments and assessed by two-tailed t-test (b) or two-way ANOVA (c, e).
© 2017 Macmillan Publishers Limited, part of Springer Nature. All rights reserved.

Letter reSeArCH
Extended Data Figure 10 | Targeting AMPK, CNR2 and TXNIP in combination with glucocorticoids. a, Three different patient-derived pre-B ALL samples were treated with the AMPK inhibitor BML275, prednisolone or a combination of the two for 72 h. b, Three different patient-derived pre-B ALL samples were treated with the CNR2 agonist HU308, prednisolone (Pred), or a combination of the two for 72 h.
c, d, Three different patient-derived pre-B ALL samples were treated with the TXNIP agonist 3-OMG (c) or d-allose (d), prednisolone, or a combination of the two for 72 h. Relative viability was assessed (a–d). Combination index (CI) values at ED50 are shown. Prednisolone concentrations used were twofold higher than those of BML275. All data shown as mean ± s.d. (n = 3 independent experiments).
© 2017 Macmillan Publishers Limited, part of Springer Nature. All rights reserved.