METABOLIC ADAPTATION p File Copy NUTRITION
151
METABOLIC ADAPTATION File Copy p Frica Sanita NUTRITION loan AmericanS Library PAN AMERICAN HEALTH ORGANIZATION Pan Amercan Sanitary Bureau o Regional Office of the WORLD HEALTH ORGANIZATION 1971
Transcript of METABOLIC ADAPTATION p File Copy NUTRITION

METABOLIC ADAPTATIONFile Copyp Frica Sanita NUTRITIONloan AmericanSLibrary
PAN AMERICAN HEALTH ORGANIZATION
Pan Amercan Sanitary Bureau o Regional Office of the
WORLD HEALTH ORGANIZATION
1971

METABOLIC ADAPTATION AND NUTRITION
Proceedings of the Special Sessionheld during the Ninth Meeting
of thePAHO Advisory Committee on Medical Research
16 June 1970
Scientific Publication No. 222
PAN AMERICAN HEALTH ORGANIZATIONPan American Sanitary Bureau, Regional Office of the
WORLD HEALTH ORGANIZATION525 Twenty-third Street, N.W.
Washington, D.C. 20037, U.S.A.
1971

NOTE
At each meeting of the Pan American Health Organization AdvisoryCommittee on Medical Research, a special session is held on a topicchosen by the Committee as being of particular interest. At the NinthMeeting, which convened in June 1970 in Washington, D. C., the sessionfocused on the problem of nutrition and metabolic adaptation with anemphasis on new concepts and experimental approaches for future re-search in the field of human nutrition. In an eflort to improve com-munication among biomedical scientists, and extend the usefulness ofthe meeting beyond those who attended, the Department of ResearchDevelopment and Coordination has published this volume which con-tains the papers presented and the ensuing discussions.

PAHO ADVISORY COMMITTEE ON MEDICAL RESEARCH
Dr. Hernán AlessandriEx-Decano, Facultad de MedicinaUniversidad de ChileSantiago, Chile
Dr. Otto G. BierDirector, PAHO/WHO Immunology
Research and Training CenterInstituto ButantanSao Paulo, Brazil
Dr. Philip P. CohenChairman, Department of
Physiological ChemistryThe University of WisconsinMadison, Wisconsin, USA
Dr. René DubosMember and ProfessorThe Rockefeller UniversityNew York, New York, USA
Dr. Hernando GrootJefe, Sección de InvestigaciónInstituto Nacional para Programas
Especiales de SaludBogotá, Colombia
Dr. Herman E. HilleboeDirector, Division of Public Health PracticeSchool of Public Health and Administrative
MedicineColumbia UniversityNew York, New York, USA
Dr. Bernardo A. HoussayDirector, Instituto de Biología y Medicina
ExperimentalBuenos Aires, Argentina
Dr. Robert Q. MarstonDirector, National Institutes of HealthBethesda, Maryland, USA
Dr. Walsh McDermottChairman, Department of Public HealthCornell University Medical CollegeNew York, New York, USA
Dr. James V. NeelChairman, Department of Human GeneticsUniversity of Michigan Medical SchoolAnn Arbor, Michigan, USA
Dr. Roger RevelleCenter for Population StudiesHarvard UniversityCambridge, Massachusetts, USA
Dr. Marcel RochePresidente, Consejo Nacional de Investigaciones
Científicas y TecnológicasCarcacas, Venezuela
Dr. John C. Waterlow (Chairman)Director, Tropical Metabolism Research UnitUniversity of the West IndiesKingston, Jamaica
Dr. Abel WolmanEmeritus Professor of Sanitary Engineering and
Water ResourcesThe Johns Hopkins UniversityBaltimore, Maryland, USA
Dr. Salvador ZubiránDirector, Instituto Nacional de la NutriciónMéxico, D.F., México
Dr. M. Martins da Silva, SecretaryChief, Department of Research
Development and CoordinationPan American Health OrganizationWashington, D.C., USA
PAN AMERICAN HEALTH ORGANIZATIONPan American Sanitary Bureau
Dr. Abraham Horwitz, Director
iii

Special Session on
METABOLIC ADAPTATION AND NUTRITION
Chairmen: Dr. Philip P. Cohen and Dr. John C. Waterlow
PARTICIPANTS
Dr. Guillermo ArroyaveInstitute of Nutrition of Central
America and Panama (INCAP)Guatemala City, Guatemala
Dr. Philip P. Cohen, ChairmanDepartment of Physiological ChemistryThe University of WisconsinMadison, Wisconsin, USA
Dr. Alfred E. HarperDepartment of BiochemistryThe University of WisconsinMadison, Wisconsin, USA
Dr. Raymond HoffenbergMedical Research CouncilClinical Research CenterHarrow, England
Dr. Jean MayerDepartment of NutritionHarvard University School ofBoston, Massachusetts, USA
Public Health
Dr. Van R. PotterMcArdle LaboratoryThe University of Wisconsin
Medical SchoolMadison, Wisconsin, USA
Dr. Arnold E. SchaeferU.S. Department of Health, Education,
and WelfareRegional Medical Programs ServiceBethesda, Maryland, USA
Dr. Robert T. SchimkeDepartment of Pharmacology and
BiologyStanford University School of MedicineStanford, California, USA
Dr. Guillermo SoberónDepartamento de Biología MolecularInstituto de Investigaciones BiomédicasUniversidad Nacional Autónoma
de MéxicoMéxico, D.F., México
Dr. Fernando M¿nckeberg B.Laboratorio de Investigaciones PediátricasEscue!a de MedicinaUniversidad de ChileSantiago, Chile
Dr. Hermann NiemeyerDepartamento de BioquímicaFacultad de MedicinaUniversidad de ChileSantiago, Chile
Dr. John C. Waterlow, ChairmanDirector, Tropical Metabolism
Research UnitUniversity of the West IndiesKingston, Jamaica
Dr. Alan H. WatersDepartment of HaematologySt. Bartholomew's Hospital and
Medical CollegeLondon, England
Dr. M. Martins da Silva, SecretaryDepartment of Research Development
and CoordinationPan American Health OrganizationWashington, D.C., USA
iv
CONTENTS
PageParticipants ............ ......................................................... iv
Opening Statement-Morning Philip P. Cohen, Chairman .......................... 1
Physiological Adaptation: The Test of NutritionVan R. Potter and David F. Scott .......................................... 3
Adaptability and Amino Acid Requirements A. E. Harper .......................... 8
Enzyme Synthesis and Degradation: Effects of Nutritional Status Robert T. Schimke.. 21
Discussion ........................................ 31
Dietary and Hormonal Effects on Liver Glucokinase Hermann Niemeyer ............ 36
The Physiological Significance of Tissue Enzyme Activitiesas Affected by Diet Guillermo Soberón .................................... 45
Discussion ........................................ 73
Opening Statement-Afternoon John C. Waterlow, Chairman ...................... 75
The Concept of "Normal" in Nutrition John C. Waterlow ........................ 76
Discussion ......................................... 81
Physiological and Social Adaptation in Famine Jean Mayer ........................ 83
Standards for the Diagnosis of Vitamin Deficiency in Man Guillermo Arroyave ...... 88
Discussion ........................................ 101
Anemia and Normality A. H. Waters .............................. ' ............ 105
Endocrine Mechanisms in Nutritional Adaptation Fernando Monckeberg B........... 121
Homeostatic Mechanisms in the Regulation of Serum AlbuminLevels R. Hogenberg ...................................... ..... .... 132
Discussion ........................................ 138
Summary John C. Waterlow and Philip P. Cohen ................................. 139
Appendix Philip P. Cohen ............ ............................ 141
y

OPENING STATEMENT-Morning
Philip P. Cohen, Chairman
In a presentation at the Eighth Meeting of the Advisory Committeeon Medical Research, Pan American Health Organization, last year,a position supporting the need for a more molecular approach wasoutlined as a basis for advancing our understanding of human biologyin health and disease (See Appendix). Particular reference was madeto the need for new concepts and experimental approaches in the areaof nutrition. The position presented was essentially as follows: Thecurrent status of nutritional research indicates that we have today allthe basic knowledge needed regarding essential nutrients but what welack is the effective means for application of this knowledge in theprevention or treatment of primary nutritional disorders. In additionwe lack a meaningful definition of health and what constitutes adeparture from good health. While there is uncertainty as to thequantitative requirement for one or more nutrients in one situationor other, this search for a magic number seems not likely to yieldanything more than a series of quantitative limits which are at bestguidelines for the requirement of a given individual, but are of limitedvalue as an index of nutritional adequacy-or of good health.
The area of nutritional research which remains to be explored in anydepth has to do with that of regulation of cell function. It is obviousthat in any overall process there will be a rate-limiting requirementfor any essential ingredient of that process, and any level below thatrate-limiting requirement will affect, perhaps in an all-or-none manner,the operation of that process. What we need to know are the conse-quences of regulatory failure or inadequacy of any of the multiplicityof regulatory processes which result from dietary restrictions. At thesame time, we have to know what degree of adaptability exists andthe limits of this adaptability in the regulatory process affected bydietary restriction. The means of regulation of cell function are com-plex and finely controlled; the limits of adaptability in any given dietarysituation are yet to be defined and are not well understood. The kindof information needed will result not from the perpetuation of tra-ditional experiments in human nutrition, but rather from experimentsdesigned on the basis of the newer concepts of molecular biology and
1

cell regulation. It is thus likely that well designed animal model systemswill be needed to exploit these newer concepts before suitable experi-ments can be developed for use with the human.
It is the purpose of the present session on Metabolic Adaptation andNutrition to explore this area with the hope that new approaches in thediagnosis and treatment of nutritional diseases will emerge.
2

PHYSIOLOGICAL ADAPTATION: THE TEST OF NUTRITION'
Van R. Potter and David F. Scott2
Introduction
Metabolic adaptation is a subject that shouldbe of major interest to nutritionists. It repre-sents a common ground where nutritionists,endocrinologists, physiologists, pharmacologists,and now molecular biologists can mect anddiscuss problems of mutual interest. Metabolicadaptation may also begin to involve the so-ciologists since cultural adaptation to newdietary practices is part of the total picture. Inan earlier paper (Potter 5), Geertz's interestingconcepts defining a culture as a set of societalmechanisms for controlling or programmingindividual human behavior were discussed. Inthat paper, the possibility of defining an opti-mum environment was presented, and the con-cept that optimum health or normality couldbe attained by providing individuals with anenvironment that required no adaptive re-sponses was questioned. On the contrary, inproposing a list of seven points to consider indefining such an environment, it was empha-sized that: "The culture should prepare us forand expect of each individual adaptive responses,continually from birth to death...." In thisconnection it was stressed that we are, in fact,quite ignorant of how to assist in the evolutionof our culture toward better concepts of positivehealth. The contention was that individuals
1 Supported in part by grants from the NationalCancer Institute, United States Public Health Service(USPHS), CA-07175 and CRTY-5002.
2 USPHS Post-doctoral Fellow IFO2 CA-32836, 1968-1970.
show a wide variation in their tendency to seekphysiological challenges, and the question wasraised as to how individuals could be motivatedby society to seek their own optimum degreeof positive health while maintaining their iden-tity as free individuals. In a later paper (Potter6), tracing the concept of homeostasis from theera of Claude Bernard and Walter Cannon tothe present, it was emphasized that homeostasisin the milieu intérieur is achieved by ratherheroic variations in certain enzymatic com-ponents that contribute small molecules to thecommon aqueous environment. The two publi-cations already referred to provide backgroundfor the present report. Many of the ideas ex-pressed are in harmony with papers presentedat this conference by Harper, Waterlow, Mayer,Waters, and others.
In the above-cited papers (5, 6), the conceptof physiological cost is coupled with the conceptof physiological adaptation. The issue is espe-cially applicable in the case of the drug me-tabolizing enzymes that increase adaptively inresponse to pesticides or other foreign chemicalsin the environment.
Controlled feeding schedules in the study ofmetabolic adaptation
As a result of our studies, it is believed thatmuch of the literature on enzyme levels in thetissues of experimental animals is very inade-quate because of a failure to specify adequatelynot only the composition of the diet, but alsothe lighting conditions, the time of day, the
3

period of food availability, and the duration ofthe regimen, in addition to all the usual specifi-cations of age, sex, strain, and so on. Theauthors have moved from a practice of adlibitum feeding with controlled lighting andkilling times to a position of advocating notonly controlled lighting, but also controlledfeeding schedules and an actual opposition tothe practice of ad libitum feeding in experi-ments that emphasize biochemical parametersin contrast to behavioral parameters (1, 5-15).If behavioral studies involving the eating habitsof rats are to be combined with biochemicalmeasurements, they can be interpreted morereadily in the light of data from experimentsin which the feeding schedule was controlled.Elsewhere, the details of protocols have beensummarized, and five objectives that may befurthered by the use of controlled feeding regi-mens have been listed (8).
Enzyme changes in metabolic transitions
In 1961 Potter and Ono reported their firstexplorations in the realm of controlled feedingexperiments (9). A metabolic transition wasdefined as "the period during which an orga-nism is changing its pattern of enzyme activityand enzyme amount in response to a changein its environment." Later, it was emphasizedthat "the living animal is adapting during everymoment of life," and particularly in connectionwith the diurnal changes in light and darkness(5). In 1961 experiments were patterned afterthose of Tepperman and Tepperman in whichanimals were refed after fasting two or threedays. Data on glycogen and glucose-6-phosphatedehydrogenase were provided ((9) Figures 1and 2, and Chart 1). It was established that theadaptive increase in the dehydrogenase couldnot be accomplished during the first 12 hoursof refeeding even with an optimum diet andcould not be accomplished in the first 48 hoursof refeeding with diets containing too littlecarbohydrate (91 per cent protein) or too littleprotein (2 per cent). Optimum responses wereobtained with 20 to 60 per cent protein in the
presence of 71 to 31 per cent glucose ((9),Figure 4). However, the dehydrogenase activitydid increase on the high-protein diet by days4 and 6 of refeeding after a failure to respondduring two days of refeeding ((9), Figure 5).This delay during the high-protein diet wasprobably caused by the delay in certain com-ponents of the gluconeogenic system, possiblyincluding some of the amino acid catabolizingenzymes. In 1961, a delay in the threoninedehydrase induction was reported, and in 1968a delay in the serine dehydratase (possibly thesame enzyme) response, but no delay was re-corded in the tyrosine transaminase response(12).
Studies on benzpyrene hydroxylase
Benzpyrene hydroxylase is an adaptive en-zyme that increases rapidly in the livers of ani-mals exposed to a variety of foreign agents in-cluding pesticides, tranquilizers, hydrocarbons,and others (2, 3, 5, 6, 13). In terms of the con-cept of physiological cost (5, 6), it has beenclearly established by Conney et al. (3) that thedrug-hydroxylases also act on a variety of steroidhormones. These workers also urged that"further studies should be carried out to deter-mine whether the chronic environmental ex-posure of humans to pesticides is sufficient toalter their metabolism of drugs and steroids..."since enhanced drug and steroid metabolism inman has already been demonstrated to occur inboth man and animals after administration ofknown drugs (3).
Benzpyrene hydroxylase is present at lowlevels in the liver of male rats and at levelsnear zero in the liver of female rats. It israpidly induced to high levels in both malesand females after a single injection of methyl-cholanthrene ((13), Chart 1), in confirmationof earLier experiments by Conney, Miller, andMiller (cited in 13). Experiments were thencarried out to determine if the metabolic adap-tation in question was influenced by the levelof protein in the diet or the feeding regimenand it was found that, in fact, it appeared to
4

be quite independent of these influences ((13),Chart 2), in contrast to an earlier experiencewith glucose-6-phosphate dehydrogenase (9) orwith tyrosine aminotransferase.
Studies on tyrosine aminotransferase (TAT)
Tyrosine aminotransferase (abbreviated asTAT, also known as tyrosine transaminase, andalso EC 2.6.1.5) is an enzyme with a very shorthalf-life. It is induced by a variety of dietaryand hormonal manipulations that enable one todemonstrate the modulation of gene expression(Figure 1).
Experiments in the induction of TAT undercarefully controlled conditions and correlatingenzyme levels with the activity of the aminoacid transport system have been of primaryinterest to the authors in recent years. In 1967,simultaneous measurements of the daily varia-tion in rat liver glycogen, serine dehydratase,and TAT in comparison with plasma corticos-terone in rats on 60 percent protein and an8+16 regimen were reported ((10), Figure3). These comparisons are of interest becausethey show that under the reported conditions,induction of this enzyme is not simply a feed-ing response: the increase in liver glycogen con-tinues for at least six hours after the activity oftyrosine amino transferase starts to fall. Thedata also reveal an important clue to later ex-periments: the increase in TAT occurs at thetime of a sharp metabolic transition, when
HYDROCORTISOME'STIMULATES
GLUCAGON AND/ORTHEOPHYLLINE
,STIMULATE
\PLASMA/ AMINO
ACIDS
("AIB PUMP":14C- -AMINOISOBUTYRIC
ACID)
Figure 1. Schematic indication of variables and oscillat-ing parameters studied in liver and plasma of rats oncontrolled feeding schedules. The sites of action for thehormones and for theophylline are still not fully estab-lished although theophylline is known to inhibit cyclicadenosine monophosphate (AMP) diesterase.
light turns to darkness, food is suddenly avail-able, hyperactivity occurs, glucagon, epine-phrine, and insulin may be involved and gly-cogen levels are falling even as the animals areingesting food. This observation has been ob-served repeatedly in the laboratory and reportedin connection with other observations wheneverthe observed time points included the first oneor two hours after the onset of feeding anddarkness (12). Moreover, when experimentswere carried out with rats on a 12 percent pro-tein diet, which does not induce tyrosine transa-minase, administration of tryptophan, 5-OHtryptophan, or serotonin, decreased liver glyco-gen but induced TAT. Shortly after these ex-periments were completed, a study of tyrosineaminotransferase in relation to amino acid trans-port was undertaken.
Induction of the amino acid transport system(TS)
The induction of tyrosine aminotransferaseis closely correlated to the induction of theamino acid transport system (TS) and this, inturn, is correlated with cyclic adenosine mono-phosphate (AMP) as suggested in Figure 2.However, at this time the exact sites of actionand mechanisms remain to be established;multiple targets for various stimulating factorsshould be considered and seem obligatory froma theoretical standpoint.
It was established that tyrosine aminotrans-ferase shows a daily oscillation in which theamplitude is determined by the protein level inthe diet. Serine dehydratase levels are also de-termined by dietary protein, but instead ofresponding immediately they require severaldays to establish. The presence of the adrenalsis not a requirement for these adaptations (12).
Since amino acid input was obviously ofimportance, study of the amino acid transportsystem and effects of various hormones on thisparameter were undertaken, using both amino-iso-butyric acid (AIB) (1), and amino-cyclopen-tane-carboxylic acid (ACPC or cycloleucine)(8).
5

PITUITARYACTH /
1 GLUCAGON<-z
ADRENAL CORTEX-ADENYL CYCLASE CYCLIC DIESTERASE
THEOPHYLLINE\ VER, / _ BLOCK
LIVER-ADENYLCYCLASE I/
LIVER-TAT-DNA- ISOCISTRONS GAT cANkPAAAM P
HYDROCORTISONE[ | || YPERGLYCEMIA
1 I INSULINTAT-mRNA(S) ( ')
T INACTIVE AIB PUMP--ACTIVE AIB PUMP
LIVER AA ' BLOOD AA
TAT (TYROSINE AMINOTRANSFERASE [S] )-4INACTIVE TAT P *
DIETARY PROTEIN12%, 30%, 60%
Figure 2. Schematic indication of possible sites of action for the systems mentionedin Figure 1. The same limitations apply.
Subsequent to the above reports, studies byFuller and Snoddy ((4), and personal com-munication) in which theophylline and epine-phrine-induced TAT in rat liver were noted.Meanwhile, Wicks et al. (16) published studiesshowing induction of TAT by theophylline,glucagon, and cyclic AMP. These investigatorshad not carried out any studies that includedthe amino acid transport system, so it was de-cided to coordinate studies on the two systemsin the same animals using controlled feedingschedules. Under controlled conditions theo-phylline alone gave responses with close co-ordination in both TAT and TS that had notbeen seen previously ((7), preliminary data).Further studies are still in progress (11). It isshown that time after administration anddosages are critical (11), but that at all dosagesand times there is a close correlation between
TAT and TS (11). When AIB or ACPC istransported into liver, TAT rises phenomenally,but the plasma level changes relatively little,and the AIB or ACPC appear not to be comingfrom muscle or intestinal mucosa (11).
Conclusion
Reference is again made to Figure 2 to indi-cate the parameters under study and their pos-sible relationships, and to emphasize the thoughtthat nutrition cannot ignore the fields of en-docrinology and the molecular events thatunderlie metabolic adaptations. But the realimpact on the field of nutrition must lie in the
practical applications of the changing concepts
of normality, adaptability, and positive health,
whether or not investigators are involved instudies at the molecular level.
REFERENCES
1. BARIL, E. F., V. R. POTTER, and H. P. MORRIS.
Amino acid transport in rat liver and Morris hepa-tomas: Effect of protein diet and hormlones on tileuptake of a-aminoisobutyric acid-14 C. Cancer Res29: 2101-2115, 1969.
2. BURNS, J. J. Interaction of environmental agents
and drugs. Environ Res 2: 352-359, 1969.
3. CONNEY, A. H., R. M. WELCH, R. KUNTZMAN,
and J. J. BURNS. Pesticide effects on drug and
6

steroid metabolism: A review. Clin PharmacolTherap 8: 2-10, 1967.
4. FULLER, R. W., and H. D. SNODDY. Inductionof tyrosine aminotransferase in rat liver by epineph-rine and theophylline. Biochem Pharm 19: 1518-1521, 1970.
5. POTTER, V. R. How is an optimum environ-ment defined? Environ Res 2: 476-487, 1969.
6. POTTER, V. R. Intracellular responses to en-vironmental change: The quest for optimum en-vironment. Environ Res 3: 176-186, 1970.
7. POTTER, V. R. Environmentally induced meta-bolic oscillations as a challenge to tumor autonomy.Miami Winter Symposia 2: 291-313, 1970.
8. POTTER, V. R., E. F. BARIL, M. WATANABE, andE. D. WHITTLE. Systematic oscillations in metabolicfunctions in liver from rats adapted to controlledfeeding schedules. Fed Proc 27: 1238-1245, 1968.
9. POTTER, V. R., and T. ONO. Enzyme patternsin rat liver and Morris hepatoma 5123 during meta-bolic transitions. Cold Spring Harbor Symp QuantBiol 26: 355-362, 1961.
10. POTTER, V. R., M. WATANABE, JOYCE E. BECKER,and H. C. PITOT. Hormonal effects on enzyme ac-tivities in tissue culture and in whole animals. Ad-vances Enzyme Regulat 5: 303-316, 1967.
11. SCOTT, D. F., F. R. BUTCHER, R. D. REYNOLDS,and V. R. POTTER. Induction of the hepatic arfino
acid transport system and tyrosine aminotransferasein rats on controlled 'feeding schedules. In I. A.Bernstein (ed.) Biochemical Responses to Environ-mental Stress. New York, Plenum, 1970, pp. 51-65.
12. WATANABE, M., V. R. POTTER, and H. C. PITOT.Systematic oscillations in tyrosine transaminase andother metabolic functions in liver of normal andadrenalectomized rats on controlled feeding sched-ules. Nutr. 95: 207-227, 1968.
13. WATANABE, M., V. R. POTTER, and H. P.MORRIS. Benzpyrene hydroxylase activity and its in-duction by methylcholanthrene in Morris hepatomas,in host livers, in adult livers, and in rat liver duringdevelopment. Cancer Res 30: 263-273, 1970.
14. WATANABE, M., V. R. POTTER, H. C. PITOT,and H. P. MORRIS. Systematic oscillations in met-abolic activity in rat liver and hepatomas. Effectof hydrocortisone, glucagon, and adrenalectomy ondiploid and other hepatoma lines. Cancer Res 29:2085-2100, 1969.
15. WHITTLE, E. D., and V. R. POTTER. Systematicoscillations in the metabolism of orotic acid in therat adapted to a controlled feeding schedule. 1 Nutr95: 238-246, 1968.
16. WICKS, W. D., F. T. KENNEY, and K.-L. LEE.Induction of hepatic enzyme synthesis in vivo byadenosine 3'-5'-monophosphate. 1 Biol Chem 244:6008-6013, 1969.
7

ADAPTABILITY AND AMINO ACID REQUIREMENTS
A. E. Harper
Concept of homeostasis
Claude Bernard (5) prior to 1878, concludedthat homothermic organisms were little in-fluenced by fluctuations in the external environ-ment because they actually lived in their ownmilieu intérieur. He recognized that thisfreedom from the influence of a hostile andfluctuating external environment was accom-plished, not by the organism being separatedfrom it, but because it was highly responsiveto changes therein, and could continuously anddelicately compensate for changes that mightotherwise affect it adversely. Among his ex-amples he included the ability of higher orga-nisms to tolerate a wide range of nutritionalconditions.
In his classic studies of blood and bodyfluids, L. J. Henderson (23) was struck by therelative constancy of fasting concentrations ofblood constituents despite the fluctuations thatoccurred under other conditions. His interest inthe ability of the body to restore the blood toits standard state led him to recognize thephenomenon of adaptability as a basic biologicalphenomenon. He also recognized that if theexternal influence were too great, the bodymight be unable to restore the standard stateand might have to compromise at somethingless than the ideal. He further realized thatfailure of the adaptive mechanisms would leadto inability of the organism to survive.
"The law of adaptation," Henderson stated"... seems to be quite as well established as
the Second Law of Thermodynamics andalmost equally serviceable ... adaptation isrelative. It involves a question, not of what isbest, but of what is efficient under certain con-ditions, of what promotes survival in a par-ticular environment...."
The concept of the body as an open systemin a steady state was developed by W. B.Cannon (9, 10). He was concerned with themechanisms involved in the integrated responsesrequired to restore the body fluids toward thestandard state after disturbances of varioustypes, especially the role of the nervous andendocrine systems. Cannon coined the term"homeostasis" (from similar and condition)which he defined as "the coordinated physio-logical reactions which maintain most of thesteady states of the body."
The concept of homeostasis was examinedin detail, especially from an evolutionary view-pointj hy Joseph Barcroft (3) was led tothe conclusion that, as one ascended the evolu-tionary ladder, the accuracy of regulatorymechanisms increased, leading to increasingstability of the internal environment. He con-cluded that this high degree of stability wasessential for development of higher mentalactivity, and for intellectual development thatpermits the greatest freedom from the restric-tions of a fluctuating external environment.
Today, as concern with metabolic regulationhas developed, there is renewed interest in theconcept of homeostasis. Understanding of theregulatory mechanisms underlying homeostasis
8

has increased greatly as knowledge of enzy-matic mechanisms and biochemical regulationhas accrued (32). Also, the requirements forstability of such regulatory mechanisms hasbecome better understood as knowledge of therequirements for stable electronic feedbacksystems has progressed (42). Nevertheless, weare still far from being able to assess quantita-tively the significance of homeostatic mecha-nisms in relation to nutritional requirements,and, in particular, to recognize the limits be-yond which such mechanisms cannot preventsome permanent impairment of the organismexposed to nutritional deprivation.
Amino acids as essential nutrients
The nutritional essentiality of specific aminoacids was demonstrated by Willcock and Hop-kins (46) and Osborne and Mendel (30) dur-ing the first two decades of this century. Shortlyafter their discovery of threonine in 1935, Roseand his associates (34) demonstrated that adultman required protein as a source of eight indis-pensable amino acids, and as a source of addi-tional nitrogen which could be provided in avariety of reduced forms. They then set about
determining amino acid requirements quanti-tatively as did others.
Most of the quantitative studies of humanamino acid requirements have been done onadults. The basic information available (15)
is summarized in Table 1. It is striking howsmall the individual amino acid requirementsare.
The sum of the amounts of indispensable
amino acids required is only 6.35 gm for menand 4.35 gm for women. Whether this differ-
ence is a sex difference or merely a reflectionof the different bases for estimation of mini-
mum requirements is problematic (15). In anyevent, assuming that these amino acids, togetherwith cystine and tyrosine, which are semi-
indispensable, represent about half of the amino
acids in high quality proteins, they would beprovided in the required amounts by only from
Table I
Minimal daily amino acid requirements of man
Adult
Infant Male Female
mg/kg/day mg/day mg/day
Histidine 32 -Isoleucine 90 700 450Leucine 150 1100 620Lysine 105 800 500Total sulfur A.A. 85 1100 550Total aromatic A.A. 90 1100 1120Threonine 60 500 305Tryptophan 22 250 157Valine 93 800 650
Total 727 6350 4352
From NRC Publication 711 (15).
9 to 12 gm per day of a protein with a netprotein value (NPV) of 100.
If, on the other hand, requirements are cal-culated on the basis of obligatory nitrogen lossesthat must be replaced, as shown in Table 2, avalue of 26.5 gm of protein is obtained (12).This is over double the amount of protein ofhigh nutritional value needed to meet the esti-mated requirements for the indispensable aminoacids determined individually. Since the indis-pensable amino acid pattern of total body pro-teins resembles quite closely that of the aminoacid requirements (47), it is evident that theobligatory losses of nitrogen cannot comeequally from dispensable and indispensable
Table 2
Calculated minimum daily nitrogen requirements ofadult men a
mg N/day
Endogenous urinary loss (2.0 mg N/kcal) 3,200Metabolic fecal loss (0.57 mg N/kcal) 912Daily skin loss (0.08 mg N/kcal) 128
4,240
a Minimum daily protein requirement= (4.24 X 6.25) = 26.5 gm
Based on Recommended Intakes of Nutrients jorthe United Kingdom (12).
9

amino acids arising from body protein break-down, unless the values for individual aminoacid requirements determined by use of highlypurified diets differ greatly from those esti-mated from minimal protein intake to maintainnitrogen equilibrium.
Measurements of the amounts of food pro-teins required to maintain adult man in nitro-gen equilibrium are in general agreement withthe values estimated from obligatory nitrogenlosses. Bricker, et al. (7) concluded that theaverage daily protein requirement of a groupof college women consuming a diet in which70 percent of the protein was from cereals was31.7 gm. Thus, if requirements for indispens-able amino acids are estimated from theamounts of natural proteins required to main-tain adult man in nitrogen equilibrium, thevalues are considerably higher than those ob-tained in experimental studies in which theminimum requirements have been determinedusing amino acid diets. It may be importantthat the minimum requirements for individualindispensable amino acids have been determinedwith diets containing an amount of nitrogen,largely from glycine and diammonium citratethat would be provided by 38 gm (25), andusually closer to 60 to 65 gm of protein (26, 34),more than is provided by diets composed offoodstuffs that will maintain man in nitrogenequilibrium.
These two types of observations raise a ques-tion concerning the relationship between theindispensable amino acid requirements and thetotal nitrogen requirement of the adult. Theyimply that the total requirement for indispens-able amino acids represents a much smallerproportion of the total nitrogen requirement forthe adult than for the young growing organism,and that the indispensable amino acid require-ments fall proportionately more than the totalnitrogen requirement with maturation, or thatindispensable amino acids are well-conserved byadult man, at least under the conditions thathave been used for the determination of mini-mum amino acid requirements, that is, with
very low intake of the amino acid under studyand a relatively high nitrogen intake.
Romo and Linkswiler (33) and Clark et al.(11) indicate that in mature human subjects onrelatively low nitrogen intakes (about 6.0 gmof nitrogen daily), nitrogen balance improvesas the proportion of indispensable amino acidsin the diet is increased (Figure 1). Theseobservations, taken together with those on esti-mated minimum amino acid requirements,imply that to maintain individuals in nitrogenequilibrium on quantities of indispensableamino acids approaching those determined in-dividually as the minimum requirements, totalnitrogen intake must exceed that needed whenthe quantities of indispensable amino acidsexceed the estimated minimum requirements.This means that requirements of adult subjectsfor indispensable amino acids increase as nitro-gen intake falls. Observations by Scrimshawet al. (40) on nitrogen retention of young menfed a diet providing from four to five gm ofnitrogen per day, largely from whole egg, tendto support this view as their subjects were innegative nitrogen balance, even though theamounts of indispensable amino acids in the
+1.
j+l.no +O
z
oz
-2
PERCENT NITROGEN FROM ESSENTIAL AMINO ACIDS
13 26 39 52 65
20 40 60 80 100PERCENT NITROGEN FROM ESSENTIAL AND
SEMI-ESSENTIAL AMINO ACIDS
Figure 1. Effect of substituting indispensable amino acidsfor dispensable amino acids on nitrogen retention ofyoung men consuming 6.3 gm of nitrogen daily fromamino acids patterned as in maize. From Romo andLinkswiler (33).
10
.2
.0. .2
)J.5 /@
0 '4 ,
.5 *1
.5 '
.0
I .- . .
C r w ·

diet exceeded the estimated minimum require-ments. Interestingly, nitrogen balance of theirsubjects did not become appreciably more nega-tive when part of the protein was replaced byglycine and diammonium citrate.
The infant and young growing subject re-quire amino acids for the synthesis of newtissue as well as for maintenance, as illustratedin Figure 2 from Hegsted (22). If protein in-take were inadequate, conservation of indis-pensable amino acids could permit redistribu-tion within tissues and could increase efficiencyof utilization of the available amino acids, butsince about half of the amino acids in tissueproteins cannot be synthesized by higher ani-mals, they must be provided in the diet, assuch, if growth is to continue.
The rapidity with which growth failureoccurs in animals or human subjects fed aminoacid-deficient or low-protein diets, and therapidity with which negative nitrogen balanceoccurs in adult subjects under such conditions,indicates that amino acids cannot be stored asreserves comparable to energy stores and thatwhatever increase in efficiency of utilization mayoccur when amino acid intake is low is limited.Further evidence for the lack of amino acidstores comes from studies of delayed amino acidsupplementation in which all of the dietary
BOYS, 90 PERCENTILE
e - --------- OWTH
,TOTAL REQUIREMENT(gm/kg)
MAINTENANCE
o i a $ 5 ? 9 is Is 17AGE(y.ars)
Figure 2. Estimates of protein required per kilogram ofbody weight per day for larger boys. From Hegsted (22).
components, except for one amino acid, are fedtogether in a single meal, with the missingamino acid being fed separately later (13, 18).A delay of a few hours in the provision of themissing amino acid results in growth failure,indicating that a surplus of amino acids iscleared rapidly from body fluids, and withina short time is no longer available for proteinsynthesis. There are differences among aminoacids in this regard. As illustrated in Figure3, lysine administered twice daily with alysine-deficient diet fed ad libitum supports con-siderable growth, whereas isoleucine similarlyadministered is much less efficiently used (43).
The rapidity of clearance of amino acids thatcannot be used for protein synthesis is illustratedby some observations of Haider and Tarver(19), reminiscent of earlier observations byBorsook (6), as shown in Figure 4. The sur-vival time of 1"C-labeled amino acid injectedintraperitoneally is very short indeed.
If there are not readily available reserves ofindispensable amino acids, what is the situationregarding the so-called protein reserves-proteinsfrom which amino acids can be redistributedto maintain essential structures during periodsof amino acid deprivation. These appear notto be reserves in the usual sense of that term,but rather a reflection of the metabolic state ofthe organism, and to consist of functional bodyproteins that can be mobilized at different ratesdepending upon the nutritional needs of theorganism (21). During starvation, when theprimary need is for energy and glucose, manyof the enzymes of amino acid degradation andgluconeogenesis increase in activity, despite thelack of a dietary source of protein, as illustratedfor glutamate-alanine amino transferase (Figure5) from a study by Rosen et al. (35). Yet, underconditions of simple protein deprivation, whenglucose and energy are provided, but aminoacids are lacking, and the primary need is forconservation of indispensable amino acids andnitrogen, many of these same enzymes fall tovery low levels of activity. Thus, under onecondition of protein deprivation this group of
11

56 53,12.1 020
£loCD 7.8±2.2
z 32 4 27.D26 8 0 Z3 D6 g 1
1 DAYS 5 PD.Ay NS5(4z ).
¡6 2u A
2 4 DAYS lO ,l 3 6 9 12
Figure 3. 1. Effect of lysine odministered with the diet, or injected twice daily ongrowth of rats fed ad libitum a lysine-deficient diet. (1) 30 per cent wheat gluten(11) 30 per cent wheat gluten +0.4 per cent L.lysine-HCL; (111) 30 per cent wheotgluten +0.4 per cent L-lysine injected intraperitoneally; (IV) as for (1), but injectedsubcutaneously. 2. Effect of isoleucine ond voline odministered with the diet or injectedtwice daily on growth of rats fed ad libitum o diet deficient in isoleucine and valine.(1) Amino acid diet with quantities of amino acids in 9 per cent cosein; (II) os for (1),but isoleucine and valine reduced by one-third; (III) os for (II) but isoleucine and volineequivolent fo that consumed by (1) injected subcutoneously. From Spolter and Harper(43).
proteins represents part of the so-called proteinreserves whereas, under another, they do not.Studies of muscle proteins, which appear to bedispensable under both of these conditions, donot reveal this distinction, but then the indi-vidual components of muscle have receivedmuch less attention than those of liver.
An excessive intake of protein appears topose little problem for the healthy, well-fedorganism. Substrate concentrations for aminoacid-degrading enzymes are high when proteinintake is high. Food intake may fall if theintake of amino acids exceeds the capacity ofthese enzymes to clear amino acids. But adap-tive responses occur-the activities of aminoacid-degrading enzymes rise (2, 38), as shownin Figure 6, for enzymes of histidine catabolism(39), and within a short time food intake isrestored and the organism has achieved homeo-stasis at a higher level of nitrogen metabolismand functions well (1).
Dietary deprivation of amino acids is a moreserious problem. There is no reserve of aminoacids that can be mobilized to support thegrowth of the young organism subjected tosevere deprivation. Even in the adult, despitesuch mechanisms of amino acid conservationas exist, there is an obligatory minimum nitro-gen ioss that must be repiaced to prevent tissuewastage.
It would appear from the studies on aminoacid and nitrogen needs of man discussedearlier, that a high intake of indispensableamino acids would be beneficial when nitrogenintake is low. But most low-protein diets areof plant origin, and these characteristically havea low ratio of indispensable to dispensableamino acids and therefore provide propor-tionately less indispensable amino acids thandiets that contain high quality animal proteins(20). Also, ingestion of low protein diets isfrequently accompanied by caloric inadequacy,
12

z9
8ELU
o 7
5 6
z 3cu
2
g ,elt ,-
10 20 30 40 50 60' 120
TIME (MINUTES)
Figure 4. Disappearance of rodioactivity from the liverafter injection of lC-Iabeled lysine into mature rats.-O- laboratory diet -@- low protein -x- high protein-0m-protein-free. From Haider and Tarver (19).
which results in utilization of a portion of theamino acids as a source of energy (8). More-over, such diets tend to be high in carbohydrate,and an excess of carbohydrate in relation to
IaJ Ir FOO0 WITHHELD-I3 0---0 CONTROL
30
O 20
WJ
1 2 3 0 4 5TIME IN DAYS
Figure 5. Effect of withholding food from rats on theactivity of glutamate-alanine transaminase in liver. FromRosen et al. (35).
well-balanced protein contributes to the adverseeffects of a low protein diet (31), probably bystimulating fat synthesis in the liver (49) ata time when the capacity for fat transport tothe periphery is limited (14). There is, thus, agreat need for adaptive responses that will con-tribute to survival by increasing amino acidretention under conditions of limited proteinintake.
One might suppose that a substantial reduc-tion in protein turnover, with inhibition ofdegradation of tissue protein breakdown,
DAYS ON 80% CASEIN DIET
Figure 6. Changes in activities of histidine-degrading enzymes in liver with time afterfeeding rats a high protein diet. From Schirmer and Harper (39).
13

would provide such a mechanism. However,the phenomenon of protein turnover providesthe organism with great adaptability, especiallyduring periods of deprivation, permitting break-down of less important tissue and organ pro-teins to provide amino acids for the maintenanceof the essential ones-a mechanism with greatsurvival value. Although there is evidence thatturnover of some proteins may be slowed (38),general inhibition of this process would leadto rigidity of the system and lessen its abilityto respond to changes in the external environ-ment. Hormones and digestive enzymes, forexample, must be synthesized continuously. Itwould, therefore, seem most appropriate for thebody to depend upon increased efficiency ofconservation of the indispensable amino acidsarising from tissue protein degradation as themajor form of adaptation when the dietarysupply of these amino acids is inadequate, andto depend upon inhibition of protein turnover,with the restrictions this would impose, onlyas a last resort.
Adaptive (homeostatic) responses tolow protein intake
A very early result of a low intake of anindispensable amino acid is a drop in the con-centration of that amino acid in body pools.With low substrate concentrations for aminoacid-degrading enzymes, the minimum obliga-tory oxidation of amino acids would be expectedto fail. Observations by McLaughian et al.(27) in Figure 7 illustrate the relationshipbetween intake and plasma concentration forseveral amino acids. Since the Michaelis con-stants of amino acid-degrading enzymes aremuch above those for amino acid-activatingenzymes, this should greatly favor incorporationof amino acids into proteins over oxidation.
The distribution of amino acid-degradingenzymes, although not altered by dietary altera-tions, would appear to be an evolutionary adap-tation contributing to amino acid conservation.Most of the enzymes for degradation of theindispensable amino acids are confined to the
liver and, therefore, have limited distribution.This is illustrated in Table 3 by observationsof Miller (28), which provide a comparison ofthe capacity of the perfused liver and of theeviscerated rat carcass to oxidize individualamino acids. With this type of distribution,little degradation of most of the indispensableamino acids would occur in the periphery-afurther factor that would favor conservationand reutilization of amino acids released as aresult of tissue protein degradation.
Interestingly, the branched-chain amino acidsare exceptions. However, even for these, onlythe aminotransferase for the first step in deg-radation is distributed in the peripheral tissueswith the oxidase being confined almost ex-clusively to liver and kidney (48). Thus, con-servation of these could also occur with the ketoacids being readily reaminated in the peripheraltissues, as long as amino donors are available.
Further, in animals fed a low-protein diet,the activities of the enzymes for degradation ofindispensable amino acids fall to very lowactivities. This is illustrated for threonine de-hydratase (37), in Figure 8. Also the oxidasefor the branched-chain amino acids falls sharplyin animals fed a low protein diet (48) as shownby Figure 9.
With prolonged ingestion of a low-proteindiet, enzymes for activation of amino acids rise
Table 3
Oxidation of `1C-labeled amino acids by the perfusedliver and by the eviscerated carcass
% administered x'C expired as 'CO0
Eviscerated Isolatedsurviving rat perfused liver
L-phenylalanine 0.14 25.5L-histidine 0.44 30.0DL-tryptophan 1.7 9.1L-lysine 2.4 34.5L-isoleucine 7.7 5.2L-leucine 12.0 5.4Glycine 7.1 19L-glutamic acid 46.0 32
After Miller (28).
14

AMINO ACID REQUIREMENTS
160 AA120 -
80FAST ING
LEVEL40
0.4 0.6 0.8 1.0LYSINE IN DIET <%)
40 -
20 FASTINGLEVEL
0.3 0.4 0.5 0.6THREONINE IN DIET (%)
30
20
10
wz
u)-i
ovi
0.6 0.8 1.0LEUCINE IN DIET (°/o)
TRYPTOPHAN IN DIET (%)
HISTIDINE IN DIET (%)
0.4 0.5 0.6ISOLEUCINE IN DIET (%)
Figure 7. Plasma concentrations of amino acids in relation to the concentrations inthe diet. From McLaughlan and Morrison (27).
(16), a further adaptation that should favor
trapping and reutilization of available aminoacids.
A low-protein intake, as was mentioned, isusually accompanied by a high-carbohydrateintake which would tend to stimulate insulin
secretion. Munro (29) has shown that a pro.tein-free diet stimulates tissue uptake of aminoacids, probably by this mechanism. At the sametime, enzymes for gluconeogenesis tend to fallwhen carbohydrate intake is high; hence, bothof these responses would also tend to contributeto increased efficiency of utilization of availableamino acids for tissue synthesis.
Lastly, although protein turnover contributesgreatly to the ability of the organism to adaptto a changing external environment, as proteindeficiency is prolonged, some flexibility mayhave to be sacrificed to prolong survival. Obser-vations by Waterlow and his associates (45)indicate that protein synthesis in muscle is de-pressed within a short time in rats fed a pro-tein-deficient diet, whereas that in liver is de-pressed only after more prolonged deficiency(Table 4). However, they also obtained evi-dence of substantial reutilization of amino acidsreleased from tissues for serum and liver pro-tein synthesis (Table 5). The high values for
15

1
,l
lk',
5 7.5 / /5 20 25
/~RorTEN CRNYarNT oYr o./l (2 )
Figure 8. Effect of protein content of the diet of rats onserine-threonine dehydratase activity in liver. FromSando (37).
apparent half-lives of proteins in this study arethe result of reutilization of amino acids. Evi-dence from isotopic studies of plasma albumin
synthesis and catabolism in recovered and mal-nourished children indicate that the rate of
synthesis of plasma albumin falls within a shorttime after protein intake falls and that after afew days the catabolic rate falls as well. Initially
albumin was apparently transferred from theextravascular to the intravascular pool, then theconcentration was maintained with a lower
turnover rate-a highly effective adaptation asWaterlow (45) points out.
20 40 60% CASEIN IN DIET
Figure 9. Effect of protein content of the diet of rats onbranched-chain keto acid dehydrogenase activity in liver.From Wohlhueter and Harper (48).
Table 4
Synthesis rates of liver and muscle proteins in male ratsunder different dietary conditions measured bycontinuous intravenous infusion of 5'C-lysine
Synthesis-rate (% of control)
Condition Liver Muscle
Starved 2 days 105 69Protein-free 3 days 113 65Low protein 3 days 110 50Low protein 10 days 125 48Low protein 10 days + insulin 165Low protein 5 weeks 80 56
70 From Waterlow (45).
Significance of adaptability in relation toamino acid requirements
It has long been recognized that human sub-jects can maintain nitrogen equilibrium with awide range of nitrogen intakes and that if
nitrogen intake is reduced gradually after abrief period of nitrogen loss, equilibrium isattained again at the lower intake (29). Inother words, after a period of adjustmenthomeostasis is achieved with a reduced rate of
nitrogen metabolism, the lowest nitrogen orprotein intake at which equilibrium can be
maintained being taken as a measure of the
minimum requirement.Evidence that this involves adaptation comes
from observations that the capacity for aminoacid degradation falls as nitrogen intake falls,and that in the protein-deficient organism this
Table 5
Half-lives of serum and liver proteins in the rat,measured with 14C-arginine
Half-life (T 12 ) in days
True Apparent
Mixed serum-proteins:Control 2.0 2.7Protein-depleted 3.3 5.5
Liver proteins:Control 1.9 5.5Protein-depleted 2.3 9.2
From Waterlow (45).
16
_- _ _ _
-
a...-1 _ _ _

is accompanied by increased efficiency of re-utilization of indispensable amino acids andreduced rates of turnover of some proteins, asdiscussed earlier. Experiments discussed earlieralso indicated the capacity for conservation ofamino acids is not uniform. Further, Bender(4) found that the net protein utilization(NPU) of several amino acid mixtures, devoidof one amino acid, was not zero, as would bepredicted (Figure 10), and Said and Hegsted(36) observed that the utilization of lysine-deficient proteins was greater than the pre-dicted value when they were fed at low levels.It would therefore appear that the minimumamount of protein required to maintain nitro-gen equilibrium would depend, not only uponthe amount of the limiting amino acid presentin the protein, but also, which amino acid islimiting, in view of the differential capacityof the organism to adapt to deficits of the dif-ferent amino acids.
Questions raised regularly regarding esti-mates of minimum protein requirements neededto maintain nitrogen equilibrium in the adult,or normal growth of the young are, "Does thisminimum deviate appreciably from the opti-mum?", and "Does a higher intake improve
Proteins limitedby lysine
try, thr, his, phe,and leu + ileu
_Proteins limited byvoline ond met + cys
0 20 40 60 80
CHEMICAL SCORE
Figure 10. Relationship between chemical score and netprotein utilization (NPU) of diets containing amino acidmixtures limiting in a single amino acid. From Bender (4).
nutritional status?" There are still differencesof opinion about these, as there have been fordecades, but there is little concrete evidencethat extra protein, over and above requirementsdetermined by these methods, confers additionalbenefit (17). This suggests that adaptivemechanisms function efficiently in enablinghigher organisms to adjust from a high to alow-protein intake.
Nevertheless, despite the amazing adapta-bility of higher organisms to a reduced proteinintake, reutilization of amino acids and nitrogenis never complete, and for maintenance of theadult, there are always minimum obligatorylosses that must be replaced. In the younggrowing subject, the problem is more critical.Even if reutilization were complete, the require-ments for growth would still remain. The im-mediate response of the growing organism toa shortage of protein is retardation of growth.This is obviously an adaptation with survivalvalue, as Waterlow (45) has pointed out. Butthe question is, "Up to what point can growthretardation be considered an adaptation com-patible with normal function, and beyond whatpoint must it be considered an inability ofhomeostatic mechanisms to compensate for thenutritional deprivation?" This is also a criticalproblem in assessing the relationship betweenadaptability and requirements, for it is impor-tant to distinguish clearly between (1) a lowprotein intake which, with effective function-ing of homeostatic mechanisms, will supportnot only survival but also a satisfactory rateof growth and efficient performance of theorganism, and (2) protein deficiency, whichrepresents a nutritional state in which the ca-pacity of homeostatic mechanisms has beenexceeded and deterioration of the organismprogresses to a point of irreversibility (44, 45).It is a distinction that is and will undoubtedlyremain difficult to define in view of the varietyof factors that influence nitrogen and aminoacid utilization and requirements.
Among problems that have been touched onin relation to this are the low values for amino
17
· · · · ·

acid requirements determined individually inadult man with diets containing considerablesurpluses of nitrogen and other amino acids.It seems quite possible that the amino acid inshortest supply is used particularly efficientlyunder these conditions as a result of a massaction effect, and hence the values obtainedfor minimum requirements with this procedureare unusually low. There is evidence thatnitrogen retention of adult subjects, with lownitrogen intakes, improved as indispensableamino acids were substituted in increasingamounts for dispensable nitrogenous substancesin the diet. However, there is also evidencefrom studies with both children (41) and adults(24) that retention of nitrogen by subjects withlow nitrogen intakes can be improved by sup-plements of. dispensable nitrogenous com-pounds. Unfortunately, information on this isquite limited, and there appears to have beenno comparison, in a single experiment, of theeffectiveness of these two procedures for im-proving a low-protein diet. Nevertheless, it istempting to speculate that the minimum valuesreported for amino acid requirements are areflection of experimental conditions that leadto highly efficient trapping of the amino acidthat is limiting; that as total nitrogen intakefalls, requirements for indispensable aminoacids increase; and that as total nitrogen intakeis increased, adaptive mechanisms come intoplay to increase efficiency of conservation of
indispensable amino acids. This would implythat at the point where the capacity of adaptivemechanisms for conservation of amino acids isclose to maximum, nitrogen retention could beimproved either by increasing the indispensableamino acid content of the diet without increas-ing the total nitrogen content or by increasingthe total nitrogen content without increasingthe indispensable amino acid content.
It is not very satisfying to conclude withoutclarifying the relationship between adaptabilityand amino acid requirements, so I should liketo close with the thought that, although effortsto assess minimum amino acid requirementsunder particular conditions have intrinsicvalue, it is time to focus more directly on suchquestions as, "What are the mechanisms ofadaptation to a low protein intake?" "To whatextent are the requirements for indispensableamino acids altered by adaptations?" "How canthe line of demarkation between adaptation andbreakdown be distinguished clearly?" Values forquantitative requirements for amino acids willbecome more meaningful when we have moreadequate answers to such questions.
If the science of nutrition requires a chal-lenge, investigation of mechanisms of adapta-tion to nutrient deprivation, of the limits of suchadaptations, and of ways of supplementing suchadaptive mechanisms as exist when they reachthe limit of their capacity should provide chal-lenges sufficient for a healthy future in the field.
REFERENCES
1. ANDERSON, H. L., N. J. BENEVENGA, and A. E.HARPER. Associations among food and protein in-take, serine dehydratase and plasma amino acids.Amer 1 Physiol 214: 1008-1013, 1968.
2. ASHIDA, K., and A. E. HARPER. Metabolic adap-tations in higher animals. 6. Liver arginase activityduring adaptation to high protein diet. Proc SocExp Biol Med 107: 151-156, 1961.
3. BARCROFT, J. La fixité du milieu intérieur estla condition de la vie libre. Biol Rev 7: 24, 1932.
4. BENDER, A. E. The balancing of amino acidmixtures and proteins. Proc Nutr Soc 24: 190-196,1965.
5. BERNARD, C. Lefons sur les phénomenes de lavie. Paris, Bailliere, 1878. 2 vol.
6. BORSooK, H. Protein turnover and incorpora-tion of labeled amino acids into tissue proteins invivo and in vitro. Physiol Rev 30: 206, 1950.
7. BRICKER, M., H. H. MITCHELL, and G. M. KINS-MAN. The protein requirements of adult human sub-jects in terms of the protein contained in individualfoods and food combinations. 1 Nutr 31: 13-21, 1946.
8. CALLOWAY, D. H., and H. SPECTOR. Nitrogenbalance as related to caloric and protein intake inactive young men. Amer 1 Clin Nutr 2: 405, 1954.
18

9. CANNON, W. B. Organization for physiologicalhomeostasis. Physiol Rev 9: 399, 1929.
10. CANNON, W. B. The wisdom of the body.New York, W. W. Norton, 1932.
11. CLARK, H. E., K. FUGATE, and P. E. ALLEN.Effect of four multiples of a basic mixture of essen-tial amino acids on nitrogen retention of adult hu-man subjects. Amer I Clin Nutr 3: 233-242, 1967.
12. Department of Health and Social Security.United Kingdom. Recommended Intakes of Nu-trients for the United Kingdom. (Reports of PublicHealth and Medical Subjects No. 120, 1969).
13. ELMAN, R. Time factor in retention of nitro-gen after intravenous injection of a mixture ofamino-acids. Proc Soc Exp Biol Med 40: 484-487,1939.
14. FLORES, H., W. SIERRALTA, and F. MÓNCKE-BERG. Triglyceride transport in protein-depletedrats. 1 Nutr 100: 375-379, 1970.
15. Food and Nutrition Board. National ResearchCouncil. Evaluation of Protein Nutrition. (NationalResearch Council, Publication 711, 1959).
16. GAETANI, S., A. M. PAOLUCCI, M. A. SPADONI,and G. TOMASSI. Activity of amino acid-activatingenzymes in tissues from protein-depleted rats. 1 Nutr84: 173-178, 1964.
17. GARROW, J. S. Protein nutrition and woundhealing. Biochem 1 113: 3P-4P, 1969.
18. GEIGER, E. The role of the time factor in feed-ing supplementary proteins. ¡ Nutr 36: 813-819,1948.
19. HAIDER, M., and H. TARVER. Effect of diet onprotein synthesis and nucleic acid levels in rat liver.1 Nutr 99: 433-445, 1969.
20. HARPER, A. E., and U. S. KUMTA. Amino acidbalance and protein requirement. Fed Proc 18:1136-1142, 1959.
21. HARPER, A. E. Effect of variations in proteinintake on enzymes of amino acid metabolism. Canad1 Biochem 43: 1589-1603, 1965.
22. HEGSTED, D. M. Theoretical estimates of theprotein requirements of childlren. 1 Amer DietAss 33: 225-232, 1957.
23. HENDERSON, L. J. Blood: A study in generalphysiology. New Haven, Yale University Press,1928.
24. KIES, C., E. WILLIAMS, and H. M. Fox. Deter-mination of first limiting nitrogenous factor in cornprotein for nitrogen retention in human adults. 1Nutr 86: 350-356, 1965.
25. LEVERTON, RUTH M., and M. R. GRAM. Thequantitative amino acid requirements of youngwomen. 1. Threonine. 1 Nutr 58: 59-81, 1956.
26. LEVERTON, RUTH M., and M. R. GRAM. Thequantitative amino acid requirements of young
women. 4. Phenylalanine, with or without tyrosine.1 Nutr 58: 341-353, 1956.
27. McLAuGHLAN, J. M., and A. B. MORRISON.Dietary factors affecting plasma amino acid concen-trations. In J. H. Leathem (ed.), Protein Nutritionand Free Amino Acid Patterns. New Brunswick,(N. J.), Rutgers University Press, 1968, pp. 3-18.
28. MILLER, L. L. The role of the liver and thenon-hepatic tissues in the regulation of free aminoacid levels in the blood. In J. T. Holden (ed.),Amino Acid Pools. New York, Elsevier, 1962,pp. 708-721.
29. MUNRO, H. N. General aspects of the regula-tion of protein metabolism by diet and by hormones.In H. N. Munro and J. B. Allison (eds.), Mamma-lian Protein Metabolism. New York, AcademicPress, 1964, pp. 381-481.
30. OSBORNE, T. B., and L. B. MENDEL. Aminoacids in nutrition and growth. 1. Biol Chem 17: 325-349, 1914.
31. PLATT, B. S., C. R. C. HEARD, and R. J. C.STEWART. Experimental protein-calorie deficiency.In H. N. Munro and J. B. Allison (eds.), Mamma-lian Protein Metabolism. New York, Academic Press,1964, pp. 445-521.
32. POTTER, V. R. Intracellular responses to en-vironmental change: the quest for optimum envir-onment. Environ Res 3: 176-186, 1970.
33. ROMO, G. S., and H. LINKSWILER. Effect oflevel and pattern of essential amino acids on nitro-gen retention of adult man. J Nutr 97: 147-153,1969.
34. RosE, W. C. The amino acid requirements ofadult man. Nutr Abstr Rev 27: 631-647, 1957.
35. ROSEN, F., N. R. ROBERTS, and C. A. NICHOL.Glucocorticosteroids and transaminase activity. 1. In-creased activity of glutamic-pyruvic transaminase infour conditions associated with gluconeogenesis. 1Biol Chem 234: 476-480, 1959.
36. SAID, A. K., and D. M. HEGSTED. Evaluationof dietary protein quality in adult rats. ! Nutr 99:474-480, 1969.
37. SANDO, G. Investigation of effects of high pro-tein intake on adaptive response of serine dehydra-tase in the rat. M. S. Thesis, University of Wiscon-sin, 1968.
38. SCHIMKE, R. T. The importance of both syn-thesis and degradation in the control of arginaselevels in rat liver. 1 Biol Chem 239: 3808-3817, 1964.
39. SCHIRMER, M. D., and A. E. HARPER. Adaptiveresponses of mammalian histidine-degrading en-zymes. 1 Biol Chem 245: 1204-1211, 1970.
40. SCRIMSHAW, N. S., V. R. YOUNG, R. SCHWARTZ,
M. L. PICHÉ, and J. B. DAS. Minimum dietary essen-tial amino acid-to-total nitrogen ratio for whole eggprotein fed to young men. 1 Nutr 89: 9-18, 1966.
19

41. SNYDERMAN, S. E., L. EMMETT HOLT, JR., J.DANCIS, E. ROITMAN, A. BOYER, and M. E. BALIS.Unessential nitrogen: A limiting factor for humangrowth. / Nutr 78: 57-72, 1962.
42. Society for Experimental Biology. Homeosta-sis and Feedback Mechanisms. Cambridge, HarvardUniversity Press, 1964. (Symposium no. 18).
43. SPOLTER, P. D., and A. E. HARPER. Utilizationof injected and orally administered amino acids bythe rat. Proc Soc Exp Biol Med 106: 184-189, 1961.
44. voN MURALT, A. Protein-calorie malnutritionviewed as a challenge for homeostasis. In A. vonMuralt (ed.), Protein-Calorie Malnutrition. Berlin,Springer-Verlag, 1969, pp. 1-9.
45. WATERLOW, J. C. Observations on the mecha-nism of adaptation to low protein intakes. Lancet 2:1091-1097, 1968.
46. WILLCOCK, E. G., and F. G. HOPKINS. Theimportance of individual amino acids in metabo.lism; observations on the effect of adding trypto-phane to a diet in which zein is the sole nitrogenousconstituent. J Physiol (London) 35: 88-102, 1906.
47. WILLIAMS, H. H., L. V. CURTIN, J. ABRAHAM,J. K. LOOSLI, and L. A. MAYNARD. Estimation ofgrowth requirements for amino acids by assay of thecarcass. 1 Biol Chem 208: 277-286, 1954.
48. WOHLHUETER, R. M., and A. E. HARPER. Coin-duction of rat liver branched-chain o-keto acid de-hydrogenase activities. J Biol Chem 245: 2391-2401,1970.
49. YOSHIDA, A., and A. E. HARPER. Effect ofthreonine and choline deficiencies on the metabo-lism of C14-labeled acetate and palmitate in the in-tact rat. 1 Biol Chem 235: 2586-2589, 1960.
20

ENZYME SYNTHESIS AND DEGRADATION: EFFECTS OFNUTRITIONAL STATUS
Robert T. Schimke
There is an increasing wealth of examples ofadaptation to alterations in the physiologicaland nutritional state of an animal, which in-volves striking changes in the levels of a num-ber of enzymes in the liver (11, 24). Suchchanges do not reflect simply activation andinactivation of the enzyme protein, since agentsthat inhibit protein synthesis can prevent theincreases in enzyme activity (7). More con-vincing are studies using combined immuno-logic and radioisotopic techniques in demon-strating both increased content of immunologi-cally reactive protein, and an active, net uptakeof isotopic amino acids into specific enzymeproteins (8, 9, 22, 25).
Most important, and central to an understand-ing of the dynamics of enzyme regulation inmammalian tissues, is the fact that changes inenzyme levels take place against a backgroundof continual synthesis and degradation of pro-tein, that is, turnover, as documented so ele-gantly by Schoenheimer and his co-workers(26) in the early 1940's, and studied morerecently in other laboratories (3, 30). We mayconsider the continual degradation of proteinas an answer to the problem of how to removeenzymes when no longer needed as part of anadaptive response to altered nutritional states.In a rapidly growing bacterium, an unneededenzyme can be diluted by subsequent cell di-vision. In the generally non-growing cell of ananimal, intracellular degradation becomes in-
creasingly important for this removal processand hence for controlling enzyme levels. It isof interest that the tissue with the most rapidmean rate of protein turnover is the liver, thetissue whose metabolic machinery, that is, en-zymes, undergoes the greatest changes in re-sponse to dietary changes as part of its role inmaintaining the internal milieu of the animal.
Properties of protein turnover in rat liver
Since regulation of enzyme levels takes placeagainst a background of continual synthesis anddegradation, certain properties of this overallprocess are presented as a basis for subsequentpresentations.
Studies from various laboratories have shownthat replacement of liver protein is rapid andextensive. One such experiment designed toanswer questions about the rate and extent ofturnover of total liver protein and one specificenzyme, arginase, is shown in Figure 1 (22).Rats were fed an amino acid diet containing14C-L-lysine of constant specific activity for upto 20 days. The rate and extent of protein turn-over were determined from how rapidly andto what extent total cellular protein and argi-nase were replaced from the dietary source. Thefree lysine pool (counts soluble after trichloro-acetic acid precipitation of protein) approachedmaximal labeling in 24 to 36 hours (Figure 1).Lysine incorporation into total liver protein
21

(CPMl/mg protein) was initially rapid andthen slowed markedly after five to six days.Incorporation of lysine into arginase (total CPMin enzyme precipitated with a specific anti-arginase antibody) was slower.
A measure of the extent to which the cellularproteins are replaced can be obtained by com-paring the specific activity of the lysine in pro-tein with that of the dietary source as shownin Table 1. The specific activity of the lysineisolated from the original diet was 1105 CPM/pmole. After 20 days of labeling, about 76 per-cent of the lysine residues of total liver hadbeen replaced, that is, the specific activity ofprotein lysine was 829 CPM//tmole. In addi-tion, virtually all of the lysine of arginase hadbeen replaced in this time. From this experi-ment we can conclude:
(1) The replacement of protein in rat liveris extensive and rapid. At least 50 per cent ofthe protein is replaced in four to five days.Similar conclusions have been made by Swick(30) and Buchanan (3).
(2) The majority of protein degradation isintracellular rather than involving the death of
1 Counts per minute.
Table 1
Specific activity of 14 C-L-lysine isolated from total liverprotein and arginase following 20 days of continuous
administration of 14 C-L-lysine diet
'% Re-Radio- place-activity Lysine ment
recovered specific ofSource of lysine as lysine activity lysine
% (CPM//amole)Diet 98 1105 -Total liver protein 95 829 75Arginase 66 1106 91
The liver from three rats maintained on a 14C-L-lysinediet for 20 days as described in Figure 2 was pooledand arginase purified as outlined elsewhere (22). 14 C-L-lysine of the purified arginase and a sample of all dis-carded protein (total liver protein), as well as of the ini-tial ' 4C-L-lysine amino acid mixture, was isolated follow-ing hydrolysis 6 N HC1 by chromatography on AmberliteCG-50 (NH 4 + form) columns.
entire cells. The life span of cells in liver isfrom 160 to 400 days (3, 13). It follows thenthat since most of the protein is replaced within20 days, the degradation that occurs must belargely intracellular.
(3) There is a marked heterogeneity of deg-radation rate constants of different cell orga-nelles and individual intracellular enzymes.This is already evident from the experiment ofFigure 1. Thus, arginase is replaced moreslowly than a large portion of the total protein.The data summarized in Table 2 emphasizethe heterogeneity of rate constants even more.Among cell fractions as defined by differentialcentrifugation, of particular interest is the find-ing that the proteins of the membrane fractions,smooth and rough endoplasmic reticulum, andthe plasma (cell surface) membranes are inthe greatest state of flux with a mean half-lifeof about two days (1). There is an even moremarked heterogeneity of degradation rate con-stants among individual enzymes. There is nocorrelation between the intracellular localizationof an enzyme and its half-life. Thus 8-amino-levulinate synthetase has a half-life of only onehour, but is localized in mitochondria (half-life=6 to 7 days). Likewise half-lives of solu-ble proteins range from 1.5 hours (tyrosinetransaminase) to 16 days (lactic dehydrogenaseisoenzyme 5).
Theoretical formulation of changing enzymelevels 1
In view of the fact that there is a continualsynthesis and degradation of essentially all pro-teins of liver, any description of changing en-zyme levels must consider both synthesis anddegradation. Thus, a change of an enzyme levelcan be expressed by:
(1) dE/dt=ks-kdE
where E is the content of enzyme (units Xmass-1), k, is a zero-order rate constant of
1 See Berlin and Schimke (2) for a more detaileddevelopment of this formulation.
22

300r
200o
100 o
Z
o-
u
OL
1200 6
Liver protein
800 TCA extract o 4800 -
400 2C
O l l l l l l l I / O0o 2 4 6 8 l0 2 14 16 28
O0
40
20
DAYS ON 14C-LYSINE DIET
Figure 1. Incorporation of continuously administered 1'C-L-lysine into total protein,arginase, and trichloroacetic acid (TCA) soluble extracts of rat liver. Osborne-Mendelrats, weighing 250 to 275 gm each, were maintained for 7 days on a diet consistingof 25 per cent complete amino acid mixture. Following a 12-hour period withoutfood, they were placed on a diet containing "C-L-lysine (specific activity, 1100 CPMper /zmole). At the intervals specified, one rat was killed; the liver was then removedand divided into two weighed portions. One sample was made into acetone powderfrom which arginase was isolated by immunological techniques; the other wastreated with 10 per cent TCA and divided into protein and supernatant fractions. Radio.activity of the trichloroacetic acid soluble counts is expressed as CPM per extractfrom 1 gm of liver, wet weight (O-O). Counts in total liver protein are expressedas CPM per mg of protein (@-*). Counts in the arginase represent the total num-ber of counts precipitated (A- A). From Schimke (22).
Table 2
Half-life estimates of subcellular fractions andspecific enzymes of rat liver
Meanhalf-life,
Fractions days Reference
Nuclear 5.1
Mitochondrial 6.8
Supernatant 5.1 (1)
Smooth endoplasmic reticulum 2.1
Rough endoplasmic reticulum 2.0
Plasma membrane 1.8
Enzymes Localization
b-Aminolevulinate synthetase 0.04 Mitochondrial (15)
Alanine aminotransferase 0.7 -1.0 Mitochondrial (31)
Catalase 1.4 Peroxisomal (18)
Tyrosine aminotransferase 0.06 Soluble (10)
Tryptophan oxygenase 0.10 Soluble (5)
Glucokinase 1.25 Soluble (16)
Arginase 3) (-5 Soluble (22)
Glutamic-alanine transaminase 2 ) (-3 Soluble (27)
Lactate dehydrogenase 5 16 Soluble (6)
23
o221u

synthesis 2 (units X time- x mass-1), and kd isa first-order rate constant for degradation3(time-'). In general, there is little if anychange in total mass of a tissue, for example,liver, during an experimental time period, andconsequently an expression for a change intotal tissue mass is not included.
In the steady state, that is, when dE/dt=0,then
(2) k, = kdE, and
(3) E = k-
Thus, in the steady state, the amount of enzymeis a function both of the rate of synthesis andthe rate of degradation. An alteration in eitherrate can affect the level of E. The significanceof this generalization as affected by nutritionalvariables will be the subject of the remainderof this paper.
Nutritional control of arginase levels in rat liver
In studying the mechanisms involved inchanges of enzyme levels, the first question tobe answered is whether the differences in assay-able enzyme activity result from differences incontent of enzyme protein. Once this has beenestablished, the question of whether the rateof synthesis, the rate constant of degradation,or both have been altered, can be answered. Wehave attempted to answer these questions as
-htic ate of synitesis of a specific protein is deter-
mined by a number of factors, including the numberof ribosomes, amount of messenger ribonudeic acid(mRNA), levels of amino acids and transfer ribonucleicacid (tRNA), availability of initiation and transfer fac-tors, etc. In this simplified model, the separate rolesof such variables have not been factored, since they arelargely unknown in mammalian tissues. Hence, all suchvariables have been included under a general notationof a rate of enzyme synthesis.
3 The rate of degradation of a protein is expressedin terms of a first-order rate constant because in allcases studied in liver, the degradation of specific in-tracellular proteins has followed first-order kinetics.Rate constants of degradation are often expressed in
ln2terms of a half-life where half-life ='
kd
directly as possible by isolating the specificenzyme protein in question. Generally thishas involved the use of immunologic tech-niques as adjuncts to isolation and purificationof the protein.
Steady-state conditions
As is the case with many liver enzymes thatare involved in the catabolism of amino acids(12), a direct relationship exists between thelevels of such enzymes and the caloric intakeprovided in the form of protein. Among suchenzymes are those of the urea cycle, that is,carbamyl phosphate synthetase, ornithine trans-carbamylase, arginino succinate synthetase, argi-nino succinase, and arginase (21). We havestudied arginase, particularly, because it can bepurified readily to a homogeneous state andis capable of eliciting precipitating antibodieswhen administered to rabbits. As shown inTable 3, there is a two- to three-fold differencein the specific activity of liver arginase betweenanimals maintained 14 days on a diet containingeither 8 per cent or 70 per cent protein byweight. That this difference in activity resultsfrom a difference in the amount of enzymeprotein is supported by studies using an anti-body specific for arginase. The arginase usedto immunize rabbits was purified to the pointof homogeneity as indicated by sedimentation-velocity studies in an analytical ultracentrifugeand by the presence of a single protein bandon acrylamide gel eiectrophoresis. The anti-
Table 3
Effect of diet on steady-state levels, synthesis anddegradation of rat liver arginase a
Diet Activity Half-lifeb kd k.
Lmoles/gm Units/gmwet weight /day X
X 10-a Days Day-` 104
8% casein 20.2 - 1.0 5.2 0.13 2.630%o casein 36.7 ± 1.3 4.8 0.14 5.270% casein 56.1 ± 1.1 4.6 0.15 8.4
a From Schimke (22).b See Figure 2.
24

serum obtained specifically precipitates onlyarginase.
Figure 2 shows a typical immunotitration ofthe antiserum with highly purified enzyme(5580 units/mg), as well as with crude liverextracts with specific activities varying by 4-fold (10 and 39 units/mg protein). Thesecrude extracts were from livers of animals main-tained on 8 per cent or 70 per cent dietaryprotein, respectively. The amount of enzymeactivity neutralized (precipitated) by a constant
amount of antiserum was the same, despite the
fact that the total amount of protein added,varied over a 500-fold range in the three argi-nase preparations. Furthermore, as indicatedby the amount of protein precipitated, the pre-cipitation reactions were quantitatively similar
with the highly purified enzyme and with thecrude extracts of differing specific activities.These results, then, demonstrate that the dif-ferences in the amount of assayable enzyme
activity in livers of animals maintained on diets
Ii
n:
2
4
o
47
d,
2 4ARGINASE UNITS X 10-2 ADDED
E
m
rz
X
x2<
c
2
o-1z-í
Figure 2. Quantitative precipitin reactions of purifiedarginase and liver extracts. Arginase preparations wereof three sources: (a) purified arginase (specific activity,5580 units per mg), A- A; (b) a crude arginasepreparation from animalis maintained on 8 per cent di-etary casein (specific activity, 10 units per mg), A-A;(c) a crude arginase from animals maintained on 70per cent dietary casein (specific activity, 39 units permg of protein), -@ 0. Volumes and protein con-centrations were made constant by equalizing the specificactivity of all preparations by addition of suitableamounts of bovine serum albumin. From Schimke, (22).See same for details.
with differing protein contents represent dif-ferences in the amount of enzyme protein asdetermined immunologically.
The next question to be answered, then, iswhether the difference in enzyme content re-sulting from maintaining the animals on dietswith differing proportions of protein resultsfrom a more rapid rate of synthesis or a lessrapid rate of degradation; that is, in Equation(3) above, is k, or kd altered? This questionwas answered by determining the values forkd at three different steady-state levels of argi-nase. In this experiment, the details of whichare given in the legend to Figure 3, animalswere pulse-labeled with guanidino-14C-arginine,and thereafter the decay of radioactivity oflabeled total protein and arginase was deter-mined with time. The degradation rate constantof arginase, here indicated by a half-life value,is essentially the same in the three steady states,that is, t/ 2 =5 days. The calculations of Table3 indicate that variations in dietary proteincontent affect the rate of enzyme synthesisrather than the rate of degradation. It is ofinterest that Rechcigl (19), Rowe andWyngaarden (20), and Majerus and Kilburn(14) have also found that differences in ratesof synthesis determine steady-state levels ofcatalase, xanthine oxidase, and acetyl coenzymeA carboxylase, respectively, when rats are main-tained on diets which affect steady-state enzymelevels.
Conditions of changing enzyme levels
During abrupt and extensive changes in nu-tritional status, differences in degradative ratesalso occur. Two experiments were performed:(1) The effect of starvation on arginase levelsin rats that had previously been maintained onan 8 per cent protein diet; (2) The effect ofchange of animals maintained on 70 per centdietary protein to a diet containing 8 per centprotein on arginase levels. Thus, during star-vation after maintenance on an 8 per cent pro-tein diet, there is a net increase of total arginase(Figure 4). This increase results from con-
25

8% CASEIN
TURNOVER OF ARGINASE30% CASEIN
40 ¿ /VER PROTE/N-IO .P9OTI/N/3.0 , '. I:
2' ) 2 4 6 8- 1)2 4 6 8DAYS AFTER GUANIDO-'4C-ARGININE
-ARGINASE
iO!0
70% CASEIN
.T PROTE/a /-' 26'.
50 2 4 68
INJECTION
Figure 3. Turnover of total liver protein and arginase determined by the decayof radioactivity after single administration of 14C-guanidino-L-arginine. Followingmaintenance of 20 rats for 14 days on each of three diets containing 8, 30, or 70per cent casein, each rat was given a single intraperitoneal inIection of 25 pc of'4C-guanidino-L-arginine. One hour later, and at two-dacly intervals, four animalsfrom each dietary group were killed and the four pooled livers were subjected topurification of arginase. The protein fractions discarded during the arginasepurifications were pooled to constitute total liver protein. Results are expressedas CPM per mg of protein, 0 - 0, total liver protein; 0 - , arginase. SeeSchimke (22) for details.
tinued enzyme synthesis in the absence of anybreakdown. Experimentally, this conclusion isbased on the finding that there is no loss oftotal labeled arginase during subsequent star-vation as opposed to the decay that occurs inthe steady state. The stabilization of arginaseoccurs at a time when there is an extensivedegradation of total liver protein. Duringchange from a high-protein to a low-proteindiet, there is a rapid decrease in total arginaseover a nine-day period. This decrease resultsfrom altered rates of both synthesis and de-gradation (Figure 4). During the first threedays of diet shift, there is a decreased rate ofenzyme synthesis and an accelerated rate ofdegradation. Enzyme synthesis virtually ceasesduring the second three-day period whereasdegradation continues. During the third three-day period, the rates of synthesis and degrada-tion approach those characteristic of the newsteady state of animals maintained on 8 per centprotein.
Nutritional control of acetyl coenzyme Acarboxylase
The pattern of independent regulation of therates of synthesis and degradation of specific
enzymes is further illustrated by recent studiesby Majerus and Kilburn. Fatty acid synthesisis inhibited by starvation and is acceleratedwhen rats are placed on fat-free diets. Numaet al. (17) have shown that the first enzyme inthe fatty acid synthesis pathway, acetyl co-enzyme A carboxylase, is rate-limiting, and itsactivity as measured by in vitro assays fluctuatesduring fasting and refeeding. Majerus andKilburn (14) have extended these studies bycombined use of radioisotopic and immunologictechniques similar to those used for studies ofarginase described above to assess the relativecontributions of altered rates of synthesis anddegradation in producing the altered enzymelevels. These results are summarized in Table4 and Figure 5.4 When rats are fed a fat-freediet for 48 hours, the hepatic activity of acetylCoA carboxylase is 14.0 milliunits/mg liverprotein, whereas the corresponding value forrats maintained on a high-fat diet containing45 per cent vegetable oil (not shown in Table4) is 0.6 milliunits/mg protein. Maintenanceon Purina rat chow results in 6.0 milliunits/mgprotein, and animals fasted after maintenance
41 am indebted to Dr. Philip Majerus for his per-mission to describe his results in this paper.
26
,
-
C.

CHANGEFROM 70% TO 8% CASEIN
DAYS DAYS
Figure 4. Rates of synthesis and degradation of ratliver arginase during fasting (left) and change from 70to 8 per cent casein diet (right). Animals were main-tained on diets containing 8 per cent (starvation) or 70per cent casein for 14 days prior to the experimentalperiod. The animais were given single administrations of'C-guanidino-L-arginine cae hour prior to change indietary status. The loss of isotope, both total andspecific activity, from arginase was followed with time.The upper set of bars indicates the total milligrams ofarginase in the pooled sample of four livers (starvation)or three livers (change from 70 to 8 per cent dietaryprotein). The lower set of bars shows the rates ofsynthesis and degradation expressed as milligrams ofarginase synthesized and degraded per gram liver perobservational period. The loss of total radioactivity inarginase is a measure of degradation. The decrease inspecific radioactivity is a measure of the rate of synthesis.The basis for these calculations, as well as experimentaldetails, are given in Schimke (22).
on a fat-free diet for 60 hours show 0.9 milli-units of acetyl CoA carboxylase activity/mgprotein.
The rates of enzyme synthesis were markedlyaffected by the diet. Thus, animals maintainedon the fat-free diet synthesized acetyl CoAcarboxylase at a rate 10 times greater thananimals starved for 48 hours relative to totalliver protein (Table 4). However, the precipi-tous decline in enzyme activity that occursduring fasting is due not only to a decrease inthe rate of enzyme synthesis, but also to anacceleration in the rate of enzyme degradation.Thus, as shown in Figure 5, pre-labeled enzymedecays with a half-life of 48 hours in the fat-
Table 4
Synthesis and degradation in nutritional control ofacetyl CoA carboxylasea
Enzymeactivity
(milliu/mg Relative b
Nutritional status protein) ko Half-lifec
Fat-free diet 14.0 3.0 48 hrsPurina rat chow 6.0 (1.3)d 48 hrsChange from fat-free 1.9 0.3 18 hrs
diet to fasting-48hours
a Data from Majerus and Kilburn (14).b Relative rate of synthesis = total CPM precipitated
by specific antiacetyl CoA carboxylase antibody/CPM/mgtotal protein. 3H-leucine was injected intraperitoneallyand animals were killed after 40 minutes.
e Half-lives determined as described in Figure 3.d Relative Ks calculated from known enzyme level
and Kd as per Equation (3).
free dietary state, whereas during starvationthe enzyme is inactivated far more rapidly(half-life of 18 hours). The difference in levelof enzyme between fat-free diet and Purinarat chow under steady-state conditions (14.0versus 6.0 milliunits/mg protein), in contrast,would appear to be related only to an effecton enzyme synthesis, since Majerus and Kil-burn found in experiments comparable to Fig-ure 5 that the half-life of the enzyme is thesame (48 to 50 hours) with both the Purinachow and fat-free diets. Hence the difference inenzyme level must be related to the rate of en-zyme synthesis from Equation (3), (page 24).
Discussion
The pattern that emerges from these studiesis one of continual change in which the rateat which the steady-state complement of specificmolecules of a particular enzyme is replacedvaries from several hours to many days. Thisfact leads to a remarkable ability to alter selec-tively the amount of particular protein by alter-ing the rate of synthesis or degradation or both.That these rates undergo marked changes inresponse to nutritional conditions is shown by theresults reviewed in this paper. In the case of
27
STARVATION

Ti o 18 hour\
> -
1 \2 I I 72 6 120
TlME(hr) AFTER 3H LEUCINE
Figure 5. Acetyl CoA carboxylase turnoweighing 150 to 170 gm were used in these e.Rats fed a fat-free diet for 48 hours were gperitoneal injections of 250 uCi of 3H-leucine,subsequently killed in groups of three, 40 miinjection (zero time), and at the subsequendicated. In a second experiment, rats fastecwere given intraperitoneal injections of 5('H-leucine; the rats were killed in groups of ftimes indicated. Acetyl CoA carboxylase won diethylaminoethyl (DEAE)-cellulose columnsradioactivity incorporated into the enzymemined by precipitation with a specific antiresults are reported as the total radioactporated into acetyl CoA carboxylase in each cMajerus and Kilburn (14) for details.
both arginase and acetyl CoA caisteady-state enzyme levels as affectedwere determined by rates of synthesisthe stimulus is different, since withit is the protein content of the diet,with acetyl CoA carboxylase, it is the f,
that is variable. During starvation thalso marked differences in both enz
tents, but in opposite directions and by
mechanisms. Thus arginase activity
increased, a result of continued enzyrr
sis, but with a decreased rate of del
With acetyl CoA carboxylase, enzym
fell rapidly, and resulted from both a
rate of synthesis and an increased rate of deg-radation.
These results, then, show that regulatorymechanisms are carefully poised to maintainenzyme activities appropriate to the nutritionalcondition of the animal. Thus we can lookupon the increased levels of arginase and otherurea cycle enzymes (21) and an entire host ofenzymes involved in amino acid catabolism(12) that result from high-protein diet as adap-tive responses to high-protein diet and the re-quirement for conversion of amino acids tosources of energy. Likewise the effects of faton acetyl CoA carboxylase (14, 17) and ofdietary carbohydrate on levels of liver glucoki-nase (16, 28, 29) are other examples of such
144 168 adaptation.Such results raise two types of fundamental
ver. Rats questions at a symposium of this kind. Onexperiments. is the scientific question of the intimate molecu-jiven intra- lar mechanisms involved in regulating the rates
and werenutes after of synthesis and rates of degradation of specifict times in- enzymes. Unfortunately, an understanding of
48 Ihours mechanisms in the depth and clarity known for10 uCi offour at the microbial systems is not available at presentas purified for animal tissues. This is in large part due tos, and the difficulties in using intact animals as experi-was deter-body. The mental systems, difficulties which include theivity incor- differences in cell population, the complex in-group. See terrelationships between nutritional variables
and multiple hormones, and the lack of suitable
mutants. Many of the possible mechanisms have
rboxyiase, been discussed in two recent reviews (23, 2)
I by diet to which the interested reader is referred.
Clearly The other question that is raised by these
arginase, studies, and one which is particularly importantwhereas to nutritionists, involves why a continual degra-
at content dation of protein is necessary in higher organ-
here were isms. Unfortunately again, there is no answer
yme con- to this nor to the contention that continual
different protein degradation is wasteful of energy. My
actually own speculations on this stem from an evolu-ne synthe- tionary argument concerning possible needs
gradation. and mechanisms for the breakdown of proteins:
e activity thus, during starvation, where massive protein
decreased degradation must occur, some mechanism is
28
(

required for relatively indiscriminate degrada-tion which can be turned on and off rapidly.Out of such a requirement might have devel-oped the lyosomal system (4). However, suchcomparatively indiscriminate degradation of cellconstituents would not be appropriate for thatprotein degradation associated with selectiveand relatively specific removal of enzymes nolonger required. Several "solutions" to selec-tive protein degradation are possible. Specificitycould have evolved through the elaboration ofproteins specific for the removal of each protein.Such specific inactivating proteins may well ex-ist in certain cases. However, such a solutionwould be "expensive" in a genetic and evolu-tionary sense, since it would require the exis-tence of a large number of specific inactivatingproteins as well as the regulatory apparatus re-quired to recognize when such proteins wereto be synthesized. An alternative solution isthat specificity for degradation exists in theenzyme itself or in its interaction with ligands.
Only a few non-specific degrading enzymeswould be required. We can conceive, then, thatduring evolution it became necessary to providean ability for some proteins to fluctuate in con-tent more rapidly than others. Thus, for thoseproteins whose levels need not change, muta-tions in peptide sequence leading to increasedstability in vivo would be selected. Conversely,for those proteins whose levels must change,mutations leading to an increased susceptibilityto degradation would have been selected. Thus,although the solution involving the continualsynthesis and degradation of proteins is waste-ful, this solution would appear to have beenthe predominant one to emerge in the mammal.
Obviously, if we could prevent the continualdegradation of protein by suitable nutritionalmanipulations or drugs, the saving of proteinfoodstuffs would be enormous in terms of totalworld food requirements. Clearly this is an areathat deserves far more research and attention.
REFERENCES
1. ARIAS, I. M., D. DOYLE, and R. T. SCHIMKE.Studies on the synthesis and degradation of proteinsof the endoplasmic reticulum of rat liver. 1 BiolChem 244: 3303, 1969.
2. BERLIN, C. M., and R. T. SCHIMKE. Influence ofturnover rates on the response of enzymes to corti-sone. Mol Pharmacol 1: 149, 1965.
3. BUCHANAN, D. L. Total carbon turnover mea-sured by feeding a uniformly labeled diet. ArchBiochem 94: 500, 1961.
4. DE DUVE, C., and R. WATTIAUX. Functions of
lysosomes. Ann Rev Physiol 28: 435, 1966.5. FEIGELSON, P., T. DASHMAN, and F. MARGOLIS.
Arch Biochem 85: 478, 1959.6. FRITZ, P. J., E. S. VESELL, E. L. WHITE, and
K. M. PRUITT. The roles of synthesis and degrada-tion in determining tissue concentrations of lactatedehydrogenase-5. Proc Nat Acad Sci USA 62: 558,1969.
7. GREENGARD, O., M. A. SMITH, and G. Acs. Rela-tion of cortisone and synthesis of ribonucleic acid toinduced and developmental enzyme formation. ]Biol Chenm 238: 1548, 1963.
8. JOST, J. P., E. A. KHAIRALLAH, and H. C. PITOT.Studies on the induction and repression of enzymesin rat liver. 5. Regulation of the rate of synthesis
and degradation of serine dehydratase by dietaryamino acids and glucose. [ Biol Chem 243: 3057,1968.
9. KENNEY, F. T. Induction of tyrosine-a-ketoglu-tarate transaminase in rat liver. l Biol Chem 237:1610, 1962.
10. KENNEY, F. T. Turnover of rat liver tyrosinetransaminase: Stabilization after inhibition of pro-tein synthesis. Science 156: 525, 1967.
11. KNOX, W. E., V. H. AUERBACH, and E. C. C.LIN. Enzymatic and metabolic adaptations in ani-mals. Physiol Rev 36: 164, 1956.
12. KNOX, W. E., and O. GREENGARD. The regula-tion of some enzymes of nitrogen metabolism; an in-troduction to enzyme physiology. Advances EnzymRegulat 3: 247, 1965.
13. MAcDoNALD, R. A. "Lifespan" of liver cells.Arch Intern Med (Chicago) 107: 335, 1961.
14. MAJERUS, P. W., and E. KILBURN. Acetyl coen-zyme A carboxylase: The roles of synthesis anddegradation in regulation of enzyme levels in ratliver. / Biol Chem 244: 6254, 1969.
15. MARVER, H. S., A. COLLINS, D. P. TSCHUDY,and M. RECHCIGL, JR. I-Aminolevulinic acid syn-thetase. 2. Induction in rat liver. 1 Biol Chem 241:4323, 1966.
29

16. NIEMEYER, H. Regulation of glucose-phos-phorylating enzymes. Nat Cancer Inst Monogr 27:29, 1966.
17. NUMA, S., M. MATSUHASHI, and F. LYNEN. Ondisorders of fatty acid synthesis in hunger and allox-an diabetes. 1. Fatty acid synthesis in the liver ofnormal and fasting rats. Biochem Z 334: 203-217,1961 (Ger).
18. PRICE, V. E., W. R. STERLING, V. A. TARAN-TOLA, R. W. HARTLEY, JR., and M. RECHCIGL, JR.
The kinetics of catalase synthesis and destruction invivo. 1 Biol Chem 237: 3468, 1962.
19. RECHCIGL. M., JR. In vivo turnover and its role
in the metabolic regulation of enzyme levels. Enzy-mologia 34: 23, 1968.
20. RowE, P. W., and J. B. WYNGAARDEN. Themechanism of dietary alterations in rat hepaticxanthine oxidase levels. I Biol Chem 241: 5571,1966.
21. SCHIMKE, R. T. Adaptive characteristics ofurea cycle enzymes in the rat. 1 Biol Chem 237:459, 1962.
22. SCHIMKE, R. T. The importance of both syn-thesis and degradation in the control of arginaselevels in rat liver. 1 Biol Chem 239: 3808, 1964.
23. SCHIMKE, R. T. Regulation of protein turn-over in mammalian tissues. In H. N. Munro (ed.),Mammalian Protein Metabolism. 4. New York, Aca-demic Press, 1970, p. 178.
24. SCHIMKE, R. T., and T. DOYLE. Regulationof enzyme levels in mammalian tissues. Ann RevBiochem 39: 929, 1970.
25. SCHIMKE, R. T., E. W. SWEENEY, and C. M.
BERLIN. The roles of synthesis and degradation inthe control of rat liver tryptophan pyrrolase. 1 BiolChem 240: 322, 1965.
26. SCHOENHEIMER, R. The Dynamic State o]
Body Constituents. Cambridge, Harvard UniversityPress, 1942.
27. SEGAL, H. L., and Y. S. KIM. Glucocorticoidstimulation of the biosynthesis of glutamic-alaninetransaminase. Proc Nat Acad Sci USA 50: 912,1963.
28. SHARMA, C., R. MANJESHWAR, and S. WEIN-
HOUSE. Effects of diet and insulin on glucose-adeno-sine triphosphate phosphotransferases of rat liver. 1Biol Chem 238: 3840, 1963.
29. SOLS, A., A. SILLERO, and J. SALOS. Insulin-
dependent synthesis of glucokinase. 1 Cell CompPhysiol (Suppl. 1) 66: 23, 1965.
30. SWICK, R. W. Measurement of protein turn-over in rat liver. 1 Biol Chem 231: 751, 1958.
31. SWICK, R. W., A. K. REXROTH, and J. L.STANGE. The metabolism of mitochondrial proteins.3. The dynamic state of rat liver mitochondria. 1Biol Chem 243: 3581, 1968.
30

DISCUSSION
Chairman Cohen: What has been revealedthis morning is that the liver in particular, andthe whole organism to one degree or another,are constantly undergoing change, and that thisstate of continuing change is very responsive todietary influences.
Soberón: I have a question for Dr. Potter inregard to the rhythm of tyrosine transaminase.It has been proposed that the cyclic variation ofpolysome aggregation might have something todo with the cyclic variation of tyrosine trans-aminase. However, I well remember that inDr. Potter's 8+40 schedule there are two dis-tinct peaks in tyrosine transaminase, and 1 donot know how to reconcile the observations byMunro of the polysome aggregation and theenzyme activity of tyrosine transaminase de-scribed by Dr. Potter.
Potter: Dr. Soberón is referring to the factthat in the animals on the 8 plus 40 regimen,where they are fed for eight hours and fastedfor forty hours, there is a peak of second syn-thesis which occurs when there is no food in-take. About the only thing that I can say toyour question is that we know that the secondpeak is dependent upon the status of the ad-renals. It requires the intact adrenal glands,whereas the first rise does not. The first risewill occur equally well in the absence of theadrenal gland. We think that it is due to the fluxof amino acid, so we believe that we can sepa-rate the effect of the amino acid flux from thestatus of the adrenal. We have not personallystudied the polysome pattern at this point.
Neel: I should like first to compliment thethree speakers on the excellence of their presen-tations. I noted that one of Dr. Potter's slideswas headed "We can influence gene activity,"a heading that doesn't seem to have carriedover into the material reproduced for the Sym-
posium. It is true that we can influence geneactivity, but I wonder if we could have a fewcomments on the extent to which, on the otherhand, genetic differences are setting individuallimits to the activities that we wish to influence.More specifically, I missed the basis for thecurves we saw, such as the numbers of animalsinvolved, and to what extent inbred strainswere used.
Some of the presentations attached errors tothe points on the curve. Were these standarderrors or standard deviations? If some of themwere standard errors of the means they imply,the standard deviations must have been verylarge indeed.
We do have knowledge of some extremecases of individual differences in this field:the inability to metabolize phenylalanine thatwe recognize as phenylketonuria or vitamin Dresistant rickets, which can be overcome withdoses of vitamin D about 100 times the normalintake. But what do we begin to know aboutlesser, but possibly meaningful individual vari-ations in the emerging field we have been dis-cussing this morning?
Potter: With regard to the caption on theslide, and not in the text, it was not any kindof a retreat from a position, but it is a fact thatthe text has a legend with it, and so the captionwould be redundant.
The implied question, however, is whetherwe are or are not limited by the inheritedgenome. On that point I am sure that there isnot any difference between us. We certainlyrecognize that we can only modulate gene ac-tivity within limits. In other words, the genomeprovides the potential for the individual and wecan only modulate within the potential whichthe genome contains, but we recognize, as youdo, that individuals may vary in the genes that
31

regulate the response of other genes, and notjust in those regulating the enzymes we study.Actually, I am most concerned with the ques-tion of achieving the optimum for any indi-vidual genome. That is what we should all bestriving for, and not merely what is the mini-mum nutritional requirement for a hypotheticalaverage man.
Now, with regard to the question about thestandard error: it is indeed the standard errorand not standard deviation. The variation isvery great because, in general, most experimentsinvolved only three animals per point, so thestandard error is a very rough kind of a figure(since n-1 =2). However, we believe that thestraight statistical analysis of a situation in termsof the variance at a given point has to be lookedat in relation to all of the other data in theexperiment, so that if you have a time curve,or a curve expressed as a function of per centprotein in the diet, the average of three animalsor four animals does not stand by itself alone,but is buttressed by the three animals to theleft of it, and the three animals to the rightof it on the curve. In some of our curves whichyou saw, we had standard errors in both direc-tions so that it is buttressed in two dimensions.The places where you see the large brackets arefrequently at transition points. It gets too com-plicated on a graph of this kind to show all theindividual animals.
Now, with respect to your question aboutthe inbred strains. We have been using theCharles River rats for a great many of ourexperiments. We have also used Buffalo ratswhich are inbred. We used the Holtzman ratswhich are not strictly inbred, but we have madecomparisons between Buffalo rats and Holtz-man rats and we got quite similar responses.Perhaps Dr. Neel's questions regarding indi-vidual variability could be answered by a moredetailed discussion of the data involving twoparameters. We have strong indications thatthe variations are not experimental error alone,but truly represent individuality in the animals.This can be seen when we attempt to correlateone parameter with another.
Waterlow: I would like to comment on someof the last remarks of Dr. Schimke. He gaveus details about turnover of liver protein andliver enzymes and indicated in his final re-marks that he attached particular importanceto the turnover of enzymes in the liver as apart of the regulatory mechanism. 1 am surethat this is true because, after all, the liver isthe first to receive the amino acids. On theother hand, from the point of view of the nu-trition of the whole animal, we must recognizethat the turnover of other proteins, particularlythose of muscle, is quantitatively very impor-tant. Recent results from our unit (Millward,in press) show that in the rat the turnoverrate of the myofibrillar protein has a half-life ofabout eight days-only four times as long asthe average liver protein. This is the highlyorganized structural muscle protein. Quantita-tively there is so much of it that it accounts foras much turnover as the total protein of theliver, if not more. Furthermore, it is extremelysensitive to dietary changes. Fasting willrapidly increase its catabolic rate and reduce itssynthetic rate. What seems to me very mys-terious is how the muscle knows what to do.How does this information get to it? Is it insome way controlled by the liver?
From the point of view of the whole animal,the flux of amino acids from internal turnoverrepresents a very large supply of substrates forenergy production, and, therefore, a vulnerableone when there is a shortage of food. Dr.Potter's slide showed that in the rat, after foodis removed, liver glycogen fell from about 50mg per gm to nearly zero. In a 100 gm rat,this would correspond to about 250 mg glyco-gen. The turnover rate of adipose tissue in therat is said to be about 10 per cent per day,equivalent to about 1 gm fat per 100 gm rat.The turnover of protein is about 2.5 gm per100 gm body weight per day (Waterlow, 1968).Thus the amounts of energy available frominternal turnover in the post-absorptive statewould be roughly: From liver glycogen 1 kcal(muscle glycogen is much less reduced thanthat of liver, and, therefore, I have ignored it);
32

from fat 9 kcals; from protein 10 kcals, or halfthe total. If one supposes that the body tendsto use whatever fuel is most readily availablefor energy production, then the rapid responseof the catabolic enzymes, such as the tyrosinetransaminase described by Dr. Potter, is ex-tremely important for the amino acid economyof the animal. In this respect, I am inclinedto think that the main problem is not so muchthe conservation of amino-N as the conserva-tion of the carbon skeletons of the essentialamino acids.
Schimke: Perhaps I could go back for amoment to Dr. Neel's comments. He mentionedinbred rats. We have explored in the lastseveral years the use of inbred mouse strainsfor various studies, not so much on nutrition,but on regulation of enzyme levels in animaltissues. Although the rat has been the standardanimal for any number of studies, I thinkinbred mouse strains represent a tremendoussource of material for this type of study becauseof the potential interplay of nutritional aspectswith genetics. As I am sure many of youknow, there are a number of genetic defectsthat can be explored in inbred mouse strains.
I would also like to know about the mecha-nisms and control, in general, of the breakdownof proteins. I did not want to give the impres-sion in my presentation that the only proteinbreakdown of significance takes place in theliver, because, obviously, muscle is where themajor breakdown occurs. How breakdown isregulated is very difficult to study, and T do notthink, even now, that it is exactly clear whatthe normal process for breakdown of proteinis. Is it simply a hydrolytic cleavage of thepeptide bond? Does it occur only in lysosomes?Is there any conservation of the energy in theform, for example, of amino acyl-t-RNA beingan intermediate? These are some of the ques-tions that arise. Exactly how a muscle knowswhen to break down proteins is again part ofthe general question of what regulates proteinbreakdown. My own feeling would be that itis not unlikely that there is a hormonal in-
fluence here just as there is in any number ofinteractions of different tissues, but exactlywhat, I would not know.
Neel: I did not refer to the use of inbred rator mice strains with any great approbation butmerely as a question of fact. In using theseinbred strains one, of course, has sacrificed agreat deal of the variability within inbredstrains. It is very interesting to speculate onhow much greater the variability might be ifone used crossbreeding strains.
Chairman Cohen: One point relevant to thewhole purpose of this discussion has emergedand that is the considerable variation of enzymelevels in individual animals. This deservesemphasis since one has a considerable degreeof control of the selection and condition of theexperimental animals and the conditions underwhich assays are carried out. On the other hand,there is a popular impression, widely acceptedin some areas, that a fixed set of values fornutritional standards for humans exists, whichcan be used to determine whether individualsor groups are "well" or "malnourished."
Potter: I am addressing myself to Dr. Neelagain with regard to the liver. Of course, mymain interest is the cancer problem, and wehave a whole series of what you might callinbred strains of hepatomas, which are seriallytransplanted and supplied to us by Dr. H. P.Morris. They are almost like mutant livers,without commenting on the connotations ofthat remark. However, the fact is that we havehepatoma lines, which are permanently set ata high level of amino acid transport and at ahigh level of tyrosine aminotransferase. Wehave another series of hepatoma lines at theother end of the spectrum and we have awhole series in between. We can take a hepa-toma that is at the low end of the spectrum-almost zero, with respect to the enzyme tyrosineaminotransferase, and at a very low level ofamino acid transport. It does not respond to a60 per cent protein diet. It does not respondto hydrocortisone. We recently published apaper on "the induction of a previously non-
33

inducible enzyme" in this hepatoma line bystimulating it with glucagon under certainconditions. We can turn on the "pump" andturn on the synthesis of the enzyme, so thisgets back to the question of individual varia-tions in animals: How much is due to built-inlevels of repression due to action of regulatorysystems? There are animals set at a lower level,such as we saw in the hepatoma, that havegreater need, shall we say, for more glucagonor the like.
Hoffenberg: Dr. Schimke has shown that allthe urea cycle enzymes are reduced in relationto low protein diets. Now my question is,"Does he have any information about the timesequence of these enzyme reductions?" I askthis because a primary reduction in carbamylphosphate synthetase, for example, might resultin less available substrate for later enzyme ac-tion, so that reduction of late urea cycle activitymight be seen as a secondary effect. Conversely,if one has a primary effect on later enzymes, onemight expect build-up of earlier substrates andinduction of their enzymes. Is there any ev-idence of time change?
Schimke: The sequence of change is that thefirst four enzymes change in about the samefashion, so the major change occurs in threedays. Thus, it is not as if CPS increases in aday, or two, and the others change three orfour days later. Arginase, the fifth, and lastenzyme of the urea cycle, changes the least ofthe enzymes, and changes the most slowly Iwould guess, although we have not done anyexperiments, that this might be related to thefact that arginase is turning over less rapidlythan the other urea cycle enzymes.
Chairman Cohen: We have found that thehalf-life in a different animal system is of theorder of 60 hours for carbamyl phosphate syn-thetase (CPS) and 90 hours for ornithine trans-carbamylase. We are now in the midst ofstudies to determine the half-life of the otherenzymes of the ornithine-urea cycle in tadpoleliver. The point that needs to be made is thatthe rate-limiting concentrations of enzymes for
the overall process of urea biosynthesis are de-termined by the concentrations of CPS andarginino succinate synthetase. The other en-zymes are present in relative excess and there-fore their variations, within rather wide limits,are going to have a lesser effect on the overallprocess than the levels of these two enzymes.
Waters: In one of Dr. Harper's slides, heindicated increased levels of the liver enzymeurocanase associated with increased proteinintake. We (Waters, Mollin, and Dawson, un-published observations) have noticed a markedincrease in the urinary excretion of urocanic acidafter oral doses of histidine in women with theclinical syndrome of Anorexia Nervosa, whichis a self-imposed dietary restriction. As youknow, this also occurs in patients with kwashior-kor, and in some patients following partial gas-trectomy with a kwashiorkor-type syndrome.Does this indicate a fall in the level of urocanasein the liver of such patients? and secondly, HasDr. Harper had the opportunity to measure thelevel of urocanase in the liver under theseconditions?
Harper: We haven't had an opportunity tomeasure the levels of these in human tissues.Under conditions of starvation, as I remember,they are not as responsive as some of the otherenzymes of amino acid degradation.
Turning to the problem raised earlier, oneshould recognize that people studying nutritiondo take note of individual variation. Even inthe early studies of amino acid requirements,Rose noted that, although the average trypto-phan requirement was about 150 milligramsper day, one individual appeared to require250 milligrams. Moreover, studies at Cornellby Nesheim on strains of chickens have shownquite substantial differences in the arginine re-quirement of two strains of chickens; thesechickens also respond differently to an antago-nism between lysine and arginine.
Finally, in relation to Dr. Waterlow's com-ment about the relatively high total amount ofenergy that could become available from turn-over of amino acids, the question is: To what
34

extent do the amino acids that are turning overrapidly serve as a source of energy, and to whatextent are they merely reincorporated into theproteins without escaping from the cell?
Waterlow: I think that the extent to whichthey serve as a source of energy depends on thelevel of protein intake and, of course, on therest of the diet. Our evidence with N-15 aminoacids in humans shows that of the total amountof amino acid entering the pool-mainly frominternal turnover-the proportion which is oxi-dized varies from about five per cent on amaintenance level to about 30 per cent on ahigh protein intake.
As regards the second point, the scanty dataavailable suggest that in the rat, on a normalprotein intake, about 50 per cent of the aminoacids liberated by catabolism in the liver isimmediately reutilized, probably in the samecell (Aub, M. R., and J. C. Waterlow. 1 TheorBiol 26: 243-250, 1970). In muscle, this figureis about 10 or 20 per cent less. The difficultyis that at the moment I do not think it is reallypossible-I am sure Dr. Schimke would agreewith this-to distinguish exactly between reuti-lization in the same cell of amino acid, whichhas not yet penetrated into the general circula-tion, and reutilization of amino acid which hascirculated from one tissue to another. Theformer is calculated by us on the assumptionthat the amino acid pool in the cell is homog-eneous; this assumption is undoubtedly wrong,but how wrong, is anybody's guess.
Schimke: It appears that in HeLa cells onefinds as much as 80 per cent reutilization ofamino acids; this would be in a situation wherethe amino acid is not getting outside the cell,so that reutilization can be extremely extensivewithin the same cell.
Arroyave: To return to the question of indi-
vidual variability, there is a difference betweenanimal and human experiments. In the firstinstance, investigators can largely control con-ditions, such as light and dark, and breedingstrains. With human subjects, it is much moredifficult to standardize a sample. Dr. Harpermentioned the work of Rose on amino acidrequirements, and it is a good example. Re-cently, we have tried to estimate protein require-ments of children between two and three yearsof age. The studies involved four normal chil-dren who were completely free of obviousclinical pathology. In a longitudinal design,we put the children in a metabolic ward ondiets of differing amounts of egg protein, andunder very standardized conditions, as onewould when performing a rat experiment.After three months, we found a large varia-bility in the estimated protein intake requiredto maintain normality in certain biochemicalparameters and growth. In examining some ofthe "hidden" data that had been registered, itwas discovered that those children who hadmore repeated infections during the study werethe ones who also needed more nitrogen, that is,more protein, to meet their protein requirement,judging from the variables measured. This wassomething we could not control. Again, two ofthe children were sick more often than theother two under the same conditions of met-abolic unit care and this greatly increased thevariability. Although some variability may begenetic, there was obviously a very large un-controllable environmental component in theexperiment. An additional problem in humanexperiments is that they usually involve a verysmall number of individuals-two or three ineach group-which makes the standard sta-tistical estimates of variability more difficult tointerpret.
35

DIETARY AND HORMONAL EFFECTS ON LIVER GLUCOKINASE1
Hermann Niemeyer
The general concept that the enzyme patternof rat liver is modified by changing the natureand the amount of food offered to the animalseems to be well-founded. Normal activities ofseveral enzymes, for example, depend on theappropriate supply of either protein, carbohy-drate, or both. This observation derives in partfrom experiments performed in our laboratory,in which only one nutrient was given at a time,or two nutrients were fed in different propor-tions to adult rats during a constant six-dayperiod (27). All the experimental diets con-tained the same amounts of salts and vitaminsper calculated 100 calories. Intakes were re-stricted to approximately isocaloric values bygiving 50 kcal of the diet daily.
From these studies, adenosine triphosphate(ATP): hexose phosphotransferase appears tobe a very sensitive enzyme with regard to thesupply of carbohydrate, inasmuch as maximalactivities are observed only when this nutrientis present in the diet (27, 39) (Figure la).When proteins are the sole source of calories,a marked reduction in enzyme activity is ob-served. If fat substitutes for protein in varyingproportions, a more accentuated diminution isattained (27). The enzyme activities are interms of 100 gm of body weight, and the bodyweight selected for reference is that of theanimals in the last common condition, that is,
1 The work reported in this paper was supported inpart by research grants from the University of Chile,the Rockefeller Foundation, and the United StatesPublic Health Service.
when they start the experimental diet. Thereis a very good correlation between the specificactivities of the phosphotransferase (units pergram of liver protein) and the proportions ofcarbohydrate in the diet (Figure lb). In fact,the specific activities are about the same whethercarbohydrate is replaced either by protein or byfat, in spite of the great difference in total liverproteins under these two dietary conditions.
a-Glucan phosphorylase follows the same pat-tern as hexose phosphotransferase (23, 27).Other enzymes whose levels appear to dependon carbohydrate supply, such as uridine diphos-phate glucose (UDPG), glucan transglucosylase(19), and pyruvate kinase (14), and perhapsphosphofructokinase, could most probably beincluded in the same group.
Phosphoglucomutase is an example of anenzyme that requires a certain amount of pro-ten in the diet in order to be maintained atnormal levels (27). If carbohydrate or fat sub-stitute for up to 80 per cent of the calories con-tributed by protein, the same levels of activityas in the livers of rats fed the 100 per centprotein diet are observed (Figure 2a). The spe-cific activities remain approximately the sameunder the various dietary conditions (Figure2b). This behavior has been considered to bethe result of a nonspecific effect of dietary pro-teins (27), since enzymes closely follow thetotal liver proteins, which increase when theamount of dietary protein augments (16, 27).The effect may result from a general activation
36

ATP: hexose phosphotransferoses
8é
a
oo
X
o
u,
cC
o-r
a>o,
u
OX
bI I I I I~~~~~~~~~~~~
20 50
) 80 50
Per cent of
80 l00
20 0
calories
o
6
5
4
3
2
Carbohydr. OProtein oFat ·
b1 1 1 1 I
20 50
80 50
Per cent of
80 100
20 0
caloriesFigures la and lb. ATP: hexose phosphotransferase ac-tivities in liver as function of diet. Rats were fed forsix days isocaloric diets with variable proportions ofprotein, carbohydrate, fat, and constant amounts ofvitamins and minerais. From Pérez, Clark-Turri, Rabajille,and Niemeyer (27).
of protein biosynthesis depending on the cellamino acid pool. Glucose-6-phosphatase andfew other enzymes so far studied behave simi-larly (16, 27).
The specific activities of a rather large groupof enzymes concerned with the metabolism ofamino acids increase markedly as the protein inthe diet increases (16, 27, 33, 35), and appearto be the result of a specific effect of dietary
Figures 2a and 2b. Phosphoglucomutase activities inliver as function of diet. The same animais as in Figuresla and lb were used. From Pérez, Clark-Turri, Rabajille,and Niemeyer (27).
proteins (27). Several oxidoreductases followthe same pattern (15, 16, 40).
Glucose-6-phosphate dehydrogenase and phos-phogluconic dehydrogenase are also dependenton the protein supply (27). However, carbo-hydrates represent a valuable complement, inas-much as the maximal activities are obtainedwith a diet composed of both protein and carbo-hydrate (Figure 3a). When fat substitutes foreither protein or carbohydrate, the enzyme
37
oo
u,
c
6
4
2
I
o
40
c.
2 20o
5-
> I0
C1
51-.
Carbohydr. OProtein oFat ·
I I I I I
Phosphoglucomutase

Glucose 6-phosphate
I T24b
3:-d
00
16
8
n 1
30C
o-0
Q.
a)
C~(.u,e:D,
20-
I10-
Carbohydr. 0 20Protein OFat · 0
Per cenFigures 30 and 3b. Glucose-6-o
activities as function of diet. 1Figures la and lb were used.Rabajille, and Niemeyer (27).
activities reach very low 1especific activities of bothmented as the protein concreases to 80 per cent of tlcomplementary nutrient is (3b). We are not aware offollow the same pattern.
The total content of se,zymes (per 100 gm of bodnificantly altered by chang
dehydrogenase the diet, as is the case of glucosephosphate iso-merase (27), and probably as is the case in the
a sequence of enzymes responsible for the con-version of 3-phosphoglycerate into pyruvate(39).
A method that appears to fulfill the requisitesfor the detection of specific effects of dietarycompounds is the administration of a singlefood (or a combination of two or more in dif-ferent proportions) to animals that have beenstabilized on another diet not containing thatparticular substance, or simply to animals fastedfor several days. This approach seems to be
___ ___ -f , especially adequate when enzyme activitieschange rather abruptly. With this procedure it
b has been demonstrated very clearly that onlyglucose is required for glucokinase (17, 21, 27)and phosphorylase (23) induction after a carbo-hydrate-free diet or after fasting, whereas bothprotein and carbohydrate are necessary for theinduction of glucose-6-phosphate dehydrogenaseafter fasting (27, 32). The participation ofamino acids in the induction of serine dehydra-tase after protein depletion has also been studiedby this procedure (29). For the sake of sim-plicity, the term induction will be used to indi-cate a selective increase in enzyme activity that
I _L L--- I appears associated with a de novo synthesis of50 80 100 protein, and that may result from changes in
50 20 0 the relative rates of synthesis and degradationof the enzyme.t of calories Actually several mechanisms responsible for
hosphate dehydrogenase the maintenance of the various enzyme levelsThe same animals as in
From Pérez, Clark-Turr, may be superimposed, making the interpreta-tion of the effect of dietary constituents onenzyme activities difficult. In fact, the actual
evels. However, the mechanisms of enzyme regulation in mammalsenzymes are aug- are poorly understood at present. As recognized
itent of the diet in- very early in our excursion into this subjecthe calories when the (17), an outstanding complication is introducedcarbohydrate (Figure in multicellular organisms by the existence of
other enzymes that the endocrine glands. Changes in the diet evokealterations in the balance of the endocrine sys-
veral other liver en- tem, promoting the secretion of some hormonesy weight) is not sig- and blocking the secretion of others. It is nowges in the nature of established, on the other hand, that disturbances
38

of the endocrine balance bring about changesin the enzyme content of the liver. In addition,the presence of an endocrine gland is necessarysometimes to permit changes in the enzymepattern to occur after the administration of anutrient. In other cases, however, the effect ofthe nutrient appears to be rather independentof the endocrine system. The participation ofthe endocrine system appears complicated bythe fact that very often more than one hormoneacts as an inducer of a particular enzyme, prob-ably through the operation of different mecha-nisms and other hormones act antagonistically.
The following discussion will be concentratedon the interactions of hormones and dietaryglucose in the induction of glucokinase in ratliver. Glucokinase is one of four isoenzymesthat catalyze the phosphorylation of glucose inthe liver (7, 8, 13) and appears to be the singleone affected by modifications in the diet (8, 34,36, 41). Carbohydrate deprivation causes arather slow fall in glucokinase activity that isquickly reversed by glucose (18, 21) and to alesser extent by other carbohydrates (20, 30,36). Changes in the supply of carbohydratelead to disturbances in the endocrine balance.Thus, glucose stimulates insulin release (3, 9,12) and, in fact, not only glucose, but alsoinsulin is essential to maintain glucokinaseactivity and to initiate the induction of theenzyme (2, 6, 22, 34, 36, 37, 41). The crucialproblem that emerges is to have unequivocalevidence of whether the agent that causes themodification in the enzyme content is thenutrient or is the hormone. Glucose and insulinseem to act together at the transcriptional level,since neither the substrate nor the hormonealone appear to permit the accumulation of apostulated messenger ribonucleic acid (RNA)(18). This can be deduced from the followingobservations made in alloxan diabetic rats(Figure 4): Actinomycin D elicits a completeblock of glucokinase induction when adminis-tered to the animals at the initiation of theinduction promoted by the simultaneous supplyof carbohydrate and insulin; however, the anti-
biotic inhibits only slightly the rate of inductionwhen injected after several hours of induction(Figure 4a). The same type of response hasbeen observed in normal rats when given carbo-hydrate after a carbohydrate-free diet (20). Theinjection of actinomycin after four hours of theseparate action of glucose or insulin blockedcompletely the subsequent induction of gluco-kinase by insulin or glucose, respectively (Fig-ures 4b, 4c). These experiments seem thus toindicate that during the interval of several hoursof separate action of either glucose or insulin,there was no accumulation of messenger RNA,which could be active at the second period whenboth agents, substrate and hormone, werepresent. If glucose or insulin had acted alone asinducer at the transcriptional level, and the com-plementary agent only at the translational level,one would expect that actinomycin did not blockthe induction completely when insulin or glu-cose were given after a previous treatment withthese two, respectively.
Interrelations between glucose and insulineffects may explain peculiarities of the kineticsof glucokinase induction by glucose in normalanimals. When glucokinase induction is elicited
8 Insulin Insulin Insulin, 4
Glucose Glucose Glucose
0 4 8 0 4 8 0 4 8
Time (hr)
treated only with carbohydrte = anma treated on
o-
O 4 80 4 8O 4 8
Time (hr)
Figures 4a, 4b, 4c. Effect of separate or simultaneoustreatment with carbohydrate and insulin on glucokinaseinduction in liver of alloxan-diabetic rats fed a carbo-hydrate-free diet. Influence of actinomycin D injectedintraperitoneally at times indicated by arrow A.'r-controls without glucose and insulin; O-ratstreated only with carbohydrate; * - animals treated onlywith insulin; Q - animals that received both insulin andcarbohydrate. From Niemeyer, Pérez, and Rabajille (18).
39

by a load of concentrated carbohydrate solutionrepeatedly given by stomach tube, a detailedstudy of the kinetics of the induction showsthat after several hours of enzyme increasethere is a detention for a few hours (5). There-after, the induction continues until the finalsteady state is reached (Figure 5). This inter-ruption of the induction is interpreted as theconsequence of a transient exhaustion of thepancreas 8-cells caused by the load of carbo-hydrate. The enzyme induction would reassumewhen newly synthesized insulin was available.In support of this interpretation is the fact thatthe transient detention of glucokinase increaseis prevented by the administration of exogenousinsulin together with the carbohydrate (Figure5). The assay of blood and pancreas insulin iscertainly needed to place this hypothesis on amore rigorous basis.
Glucocorticoids and perhaps other hormonesmodulate the rate of glucokinase induction.Thus adrenal glands are not required for theinduction (20, 41), but the rate of enzyme in-crease is lower in adrenalectomized than insham-operated rats (20), and can be broughtto normal values by the administration ofcortisol (Figure 6). The importance of gluco-
15
0'
o -
9 ~ bg High fat dietI
Time (hr)
Figure 5. Kinetics of glucose-mediated glucokinase in-duction and effect of exogenous insulin. O = ratsfed a carbohydrate-free diet for six days were given a 20per cent glucose and 30 per cent dextrin solution bystomach tube every four hours. = In addition, ratssimilarly treated received crystalline insulin intra-peritoneally. From Chamorro and Schillkrut (5).
-4
c:
0
None Cortisol None Cortisol
Figure 6. Effect of adrenalectomy and administration ofcortisol on glucokinase induction. The animais were feda balanced diet for six days after surgical operation anda carbohydrate-free diet for a subsequent period of fourdays. Some rats were injected with cortisol during thelast period. Carbohydrate was given by stomach tubethree and six hours before the rats were killed. FromNiemeyer, Clark-Turri, Pérez, and Rabajille (20).
corticoids in the modulation of the adaptive re-sponse of several liver enzymes to diet has beenrecently pointed out (25, 26). After hypophy-sectomy, a decrease of liver glucokinase isobserved compared to sham-operated animals(1), and it has been briefly reported that theadaptive increase in glucokinase after glucosefeeding does not occur in hypophysectomizedrats (28). When physiological doses of cortisol,thyroxin, and testosterone are given in order tocompensate for the atrophy of the respectivesecreting glands due to hypophysectomy, normalvalues of glucokinase are, however, maintained.Animals so treated show a decreased gluco-kinase activity after being fed a carbohydrate-free diet, as occurs in intact animals or in thesham-operated controls, and glucokinase induc-tion can be elicited by administration of glucose(Figure 7). Although the final levels of gluco-kinase in the hypophysectomized rats (supplied
40

15F1 7
Carbohydrote 3
6 k
4
0 4 8 12Time (hr)
16 20 24
Figure 7. Effect of hypophysectomy on glucokinase in-duction. Hypophysectomized and sham-operated ratswere kept on a stock diet for four days after surgicaloperation, and then fed a corbohydrate-free diet for sixdays. The hypophysectomized rciats received physiologicaldoses of cortisol, thyroxin, and testosterone daily. Gluco-kinase induction was elicited by the administration of acarbohydrate solution every four hours. From Niemeyer,Pérez, Zamorano, and Rabajille (unpublished).
with cortisol, thyroxin, and testosterone) arenormal, the rate of induction is slower than inthe sham-operated animals (Figure 7), suggest-ing that somatotrophin is another modulatinghormone for glucokinase induction.
Glucagon and catecholamines (epinephrine,norepinephrine, isoproterenol) inhibit glucoki-nase induction (24, 30, 38). This inhibition iscomplete when the hormones are administeredat the initiation of induction, but not if givenwhen induction is already in progress whenonly a slight decrease in enzyme increase isobserved (Figure 8). The effects mimic thoseof actinomycin D referred to above. Theseresults may be interpreted as hormonal effectsat the transcriptional level of protein synthesis.The effects of glucagon and catecholamines aremost probably mediated through cyclic AMP,since the dibutyryl derivative of the nucleotideprevents the induction of glucokinase (28, 38)(Figure 9). From the work of several investi-
oo
u)
c
0,u,o
o2
(D
5
4
3 t
2 -
o
7
t6 8
to 2 4
Time (hr)
Figure 8. Effect of epinephrine on glucokinase induction.Rats fed for six days with a carbohydrate-free dietreceived carbohydrate by stomach tube every four hours.O = rats treated with epinephrine subcutaneously,starting at the initiation or after four hours of induction.From Ureta, Radojkovic, and Niemeyer (38).
gators, it can be seen that glucagon and cate-cholamines, as well as cyclic AMP can act asinducers of several enzymes in addition to theirrole in regulating enzyme activity (42, 43). Theinhibition of glucose-mediated glucokinase in-duction constitutes, perhaps, the first exampleof the selective repression of enzymes by thoseagents.
Glucagon and catecholamines can be con-sidered to act antagonistically to insulin, andit is reasonable at present to accept the fact thatthis antagonism in the metabolism of the targetcells may be exerted through the participationof cyclic AMP. In the case of the regulationof enzyme synthesis, there appears also to existan antagonism between insulin, on one hand,and glucagon and catecholamines on the other.
41
o,oo
'E,
5
(-
j
I . .i i
I

I00
80 -
o
o
IL
60 j
40 -
20 -
o i i , . . . 2 001 .
0o 50 o00 200
Cyclic AMP (mcq/Kg body weight)
Figure 9. Inhibition by various doses of dibutyryl cyclicAMP of glucose-mediated glucokinase induction. Ratsfed for six days with a carbohydrate-free diet weregiven a carbohydrate solution every four hours andkilled eight hours after initiation of this treatment. Someof the animals were injected with a single dose of thecyclic AMP derivative by the intraperitoneal route. FromUreta, Radojkovic, and Niemeyer (38).
Thus glucagon, catecholamines, and cyclic AMP(or the dibutyryl derivative) act as inducers ofphosphoenol pyruvate carboxykinase, and in-sulin blocks their actions acting as a repressor(42, 43). Their effects are the opposite in thecase of glucokinase. There is one exception,and that is liver tyrosine aminotransferase, whichis induced, probably through different mecha-nisms, by glucagon, epinephrine, and cyclicAMP, as well as by insulin (10, 11, 42).
The mechanis.m of the interplay of the threehormones in the case of glucokinase inductionis complicated in the intact animal by the factthat there are interactions of the hormones inthe liver cells as well as in the pancreas ,f-cells.The secretion of insulin is under the control ofblood concentrations of glucose, epinephrine,and glucagon (3, 9, 12, 31). Under normal con-ditions, epinephrine inhibits insulin secretionacting via a-receptor interaction, its effect beingprevented by a-adrenergic blocking agents (31).On the other hand, glucagon, the activation offB-receptors, and various experimental conditionsthat lead to an increase in the intracellular con-
centration of cyclic AMP, prompt insulin se-cretion (12, 31). As insulin is an obligatoryrequirement for glucokinase induction, it couldbe postulated that part of the repressive effectof catecholamines is mediated through a mecha-nism involving a blockade of insulin secretion(38). Insulin counteracts about 50 per cent ofthe inhibition by epinephrine of glucokinaseinduction (38). On the other hand, the inhibi-tion caused by glucagon (24), or by dibutyrylcyclic AMP (38) is not reversed by insulin. Ifcatecholamines and glucagon, on one side, andinsulin on the other, interact in the liver cellto regulate the synthesis of specific proteinsthrough modifications in the concentration ofcyclic AMP, it is puzzling that insulin does notcounteract the inhibition of glucokinase induc-tion by glucagon and does not reverse com-pletely the inhibition by epinephrine. The factthat the inhibition caused by dibutyryl cyclicAMP is not counteracted by insulin would bein line with the idea that there is no neutraliza-tion of the nucleotide action by insulin or byany substance produced under the hormone in-fluence, as has been postulated to explain otherobservations (4).
In view of the extreme complexity of thewhole animal that makes the interpretation ofseveral observations very difficult, it appearshighly desirable to test hormones and substratein a more simple system, such as the isolated,perfused liver, or cells in culture. Unfortunatelyour efforts, as well as those of others in thefield, have been unsuccessfui until now in de-veloping in vitro systems capable of inducingglucokinase.
Several years ago, studies of the adaptationof animals to variable diets at the enzyme levelwere begun, and attempts to understand theunderlying mechanisms have involved us inthe interaction of hormones in the regulationof enzyme synthesis.
Acknowledgments
The work reported in this paper was madepossible by the cooperation of many persons
42

who are co-authors of various cited reports, Miss Elsa Rivera for the drawing of the illustra-published and unpublished. The author thanks tions.
REFERENCES
1. BORREBAEK, B., S. ABRAHAM, and I. L. .CHAI-KOFF. Glucokinase activities and glycogen content oflivers of normal and hypophysectomized X-irradi-ated rats subjected to different nutritional treat-ments. Biochim Biophys Acta 90: 451-463, 1964.
2. BLUMENTHAL, M. D., S. ABRAHAM, and I. L.CHAIKOFF. Adaptative behaviour of hepatic gluco-kinase in the alloxan-diabetic rat. Arch BiochemBiophys 104: 225-230, 1964.
3. COORE, H. G., and P. J. RANDLE. Regulation ofinsulin secretion studied with pieces of rabbit pan-creas incubated in vitro. Biochem 1 93: 66-78, 1964.
4. CHAMBAUT, A-M., D. EEOuÉ-BoNIS, J. HANOUNE,and H. CLAUSER. Antagonistic actions between di-butyryl adenosine 3'-5'-cyclic monophosphate andinsulin on the metabolism of the surviving rat dia-phragm. Biochem Biophys Res Commun 34: 283-290, 1969.
5. CHAMORRO, G., and R. SCHILLKRUT. Cinéticade la inducción y degradación de glucoquinasa enhígado de rata. Algunos factores que influyen en elproceso. Thesis, University of Chile, 1969.
6. DIPIETRO, D. L., and S. WEINHOUSE. Hepaticglucokinase in the fed, fasted and alloxan-diabeticrat. 1 Biol Chem 235: 2542-2545, 1960.
7. GONZÁLEZ, C., T. URETA, J. BABUL, E. RABA-JILLE, and H. NIEMEYER. Characterization of isoen-zymes of adenosine triphosphate: D-hexose 6-phos-photransferase from rat liver. Biochemistry 6: 460-468, 1967.
8. GONZÁLEZ, C., T. URETA, R. SANCHEZ, and H.NIEMEYER. Multiple molecular forms of ATP:hexose 6-phosphotransferase from rat liver. BiochemBiophys Res Commun 16: 347-352, 1964.
9. GRODSKY, G. M., A. A. BATTS, L. L. BENNETT,
C. VCELLA, N. B. MCWILLIAMS, and D. F. SMITH. Ef-fects of carbohydrates on secretion of insulin fromisolated rat pancreas. Amer 1 Physiol 205: 638-644,1963.
10. HAGER, C. B., and F. T. KENNEY. Regulationof tyrosine a ketoglutarate transaminase in rat liver.7. Hormonal effects on synthesis in the isolated, per-fused liver. 1 Biol Chem 243: 3296-3300, 1968.
11. HOLTEN, D., and F. T. KENNEY. Regulationof tyrosine a-ketoglutarate transaminase in rat liver.1 Biol Chem 242: 4372-4377, 1967.
12. KARAM, 1. H., S. G. GRAssO, L. C. WEGIENKA,G. M. GRODSKY, and P. H. FORSHAM. Effect of se-lected hexoses, of epinephrine and of glucagon oninsulin secretion in man. Diabetes 15: 571-578, 1966.
13. KATZEN, H. M., D. D. SODERMAN, and H. M.NITOWSKY. Kinetic and electrophoretic evidencefor multiple forms of glucose-ATP phosphotrans-ferase activity from human cell cultures and rat liver.Biochem Biophys Res Commun 19: 377-382, 1965.
14. KREBS, H. A., and L. V. EGGLESTON. The roleof pyruvate kinase in the regulation of gluconeogene-sis. Biochem 1 94: 3c-4c, 1965.
15. LITWACK, G., J. N. WILLIAMS, JR., P. FEIGEL-SON, and C. A. ELVEHJEM. Xanthine oxidase andliver nitrogen variation with dietary protein. 1 BiolChem 187: 606-611, 1950.
16. MURAMATSU, K., and K. ASHIDA. Effect ofdietary protein level on growth and liver enzymeactivities of rats. 1 Nutr 76: 143-150, 1962.
17. NIEMEYER, H. The influence of diet on theenzyme content of animal tissues. Acta Physiol LatAmer 12: 173-187, 1962.
18. NIEMEYER, H. Regulation of glucose-phos-phorylating enzymes. Nat Cancer Inst Monogr 27:29-40, 1967.
19. NIEMEYER, H., L. CLARK-TusRI, E. GARCÉS,and F. E. VERGARA. Selective response of liver en-zymes to the administration of different diets afterfasting. Arch Biochem 98: 77-85, 1962.
20. NIEMEYER, H., L. CLARK-TuRRI, N. PÉREz, andE. RABAJILLE. Studies of factors affecting the induc-tion of ATP: D-hexose 6-phosphotransferase in ratliver. Arch Biochem 109: 634-645, 1965.
21. NIEMEYER, H., L. CLARK-TuRRI, and E. RABA-JILLE. Induction of glucokinase by glucose in ratliver. Nature (London) 198: 1096-1097, 1963.
22. NIEMEYER, H., N. PÉREz, and R. CODocEo.Liver glucokinase induction in acute and chronicinsulin insufficiency in rats. 1 Biol Chem 242: 860-864, 1967.
23. NIEMEYER, H., N. PÉREZ, J. RADOJKOVIC, andT. URETA. The influence of diet on liver phosphoryl-ase. 2. Effect of different proportions of carbohy-drates, proteins, and fats. Arch Biochem 96: 662-669, 1962.
24. NIEMEYER, H., N. PiREz, and E. RABAJILLE.Interrelation of actions of glucose, insulin, and glu-cagon on induction of adenosine triphosphate D-hexose phosphotransferase in rat liver. / Biol Chem241: 4055-4059, 1966.
25. PERAINO, C. Interactions of diet and cortisonein the regulation of adaptive enzymes in rat liver.1 Biol Chem 242: 3860-3867, 1967.
26. PERAINO, C. Regulatory effects of glucocorti-
43

coids on ornithine aminotransferase and serine de-hydratase in rat liver. Biochim Biophys Acta 165:108-112, 1968.
27. PÉREz, N., L. CLARK-TuRRI, E. RABAJILLE, andH. NIEMEYER. Regulation of rat liver enzymes bynatural components of the diet. 1 Biol Chem 239:2420-2426, 1964.
28. PILKIS, S. J., and M. E. KRAHL. Glucokinaseand glycogen synthesis under hormonal regulation.Fed Proc 28: 888, 1969.
29. PITOT, H. C., and C. PERAINO. Studies on theinduction and repression of enzymes in rat liver.¡ Biol Chem 239: 1783-1788, 1964.
30. PITOT, H. C., C. PERAINO, N. PRIES, and A. L.KENNAN. Glucose repression and induction of en-zyme synthesis in rat liver. Advances Enzym Regu-lat 2: 237-247, 1964.
31. PORTE, D., JR. Beta-adrenergic stimulation ofinsulin release in man. Diabetes 16: 150-155, 1967.
32. POTTER, V. R., and T. ONO. Enzyme patternsin rat liver and Morris hepatoma 5123 during meta-bolic transitions. Cold Spring Harbor Symp QuantBiol 26: 355-362, 1961.
33. ROSEN, F., N. R. ROBERTS, and C. A. NICHOLS.Glucorticosteroids and transaminase activity. 1. In-creased activity of glutamic-pyruvic transaminase infour conditions associated with gluconeogenesis. 1Biol Chem 234: 476-480, 1959.
34. SALAS, M., E. VIÑiUELA, and A. SOLs. Insulin-dependent synthesis of liver glucokinase in the rat.1 Biol Chem 238: 3535-3538, 1963.
35. SCHIMKE, R. T. Adaptive characteristics ofurea cycle enzymes in the rat. 1 Biol Chem 237: 459-468, 1962.
36. SHARMA, C., R. MANJESHWAR, and S. WEIN-HOUSE. Effects of diet and insulin on glucose-adeno-sine triphosphate phosphotransferases of rat liver. 1Biol Chem 238: 3840-3845, 1963.
37. SOLS, A., A. SILLERO, and J. SALAS. Insulin de-pendent synthesis of glucokinase. 1 Cell CompPhysiol 66: Supplement 1, 23-28, 1965.
38. URETA, T., J. RADOJKOVIé, and H. NIEMEYER.Inhibition by catecholamines of the induction of ratliver glucokinase. 1 Biol Chem 245: 4819-4824, 1970.
39. VAUGHAN, D. A., J. P. HANNON, and L. N.VAUGHAN. Effect of diet on selected glycolytic en-zymes of the rat. Am ¡ Physiol 199: 1041-1044,1960.
40. WAINIO, W. W., B. EICHEL, H. J. EICHEL, P.PERSON, F. L. ESTES, and J. B. ALLISON. Oxidativeenzymes of the liver in protein depletion. 1 Nutr49: 465-483, 1953.
41. WALKER, D. G., and S. RAO. The role of glu-cokinase in the phosphorylation of glucose by ratliver. Biochem 1 90: 360-368, 1964.
42. WIcKs, W. D. Induction of hepatic enzymesby adenosine 3'-5'-monophosphate in organ culture.1 Biol Chem 244: 3941-3950, 1969.
43. YEUNG, D., and I. T. OLIVER. Induction ofphosphopyruvate carboxylase in neonatal rat liverby adenosine 3'-5'-cyclic monophosphate. Biochem-istry (Wash) 7: 3231-3239, 1968.
44

THE PHYSIOLOGICAL SIGNIFICANCE OF TISSUE ENZYMEACTIVITIES AS AFFECTED BY DIET
Guillermo Soberón
Introduction
Living organisms take substances from theenvironment and submit them to sequentialtransformations through chemical reactions cata-lyzed by enzymes. The products of the trans-formation are eventually excreted into the sur-rounding medium. As a result of such a process-intermediary metabolism-the energy con-tained in chemical bonds is released and par-tially trapped by specific mechanisms, thus be-coming available for use when required by thebiological system. In addition, some of the me-tabolites formed serve as the building blocksused by the organisms to construct their ownmaterial. Hence, nutrients taken from the out-side have great importance for the growth, func-tioning, reproduction, and survival of livingorganisms.
A given chemical reaction takes place in abiological system depending on the presenceof a specific enzyme. The enzyme, in turn,can be produced by the system if it possessesthe corresponding information in its genome,and if this can be expressed. Thus, the geneticinformation indicates a potentiality to carryout certain chemical reactions, but does not, byany means, imply that such reactions will beperformed. This possibility is under the com-mand of mechanisms belonging to the processknown as metabolic regulation. The processinvolves, in addition to the transcription of thegenetic information, other levels of control
where a key role is played by metabolites andnutrients that give rise to them. Metabolic regu-lation is mandatory for a biological system tofunction efficiently and harmoniously.
During the past two decades, many outstand-ing contributions have been made which areadvancing our understanding of how biologicalsystems operate. Some basic concepts pertainingto metabolic regulation have been worked outemploying microorganisms. These have beenutilized in view of their relative simplicity com-pared to higher organisms. However, there hasbeen an all too frequent tendency to extrapolateindiscriminately concepts developed from micro-organisms to explain adjustments in the highlycomplicated machinery for the regulation ofthe intermediary metabolism of higher orga-nisms.
Schimke (12), among others, has repeatedlyintroduced a note of caution in this respect. Hehas objected to the careless use of terms suchas induction and repression to indicate increasesand decreases of enzyme activity, without beingsure, in many cases, that they obey mecha-nisms well-established in bacterial physiology.There are, for example, significant differencesbetween the prokariot and eukariot organisms.Prokariots have their naked genome in directcontact with the cytoplasm; during their ex-ponential growth, proteins do not turn over,they are synthesized, and the "excesses" arediluted by the increasing cell mass and numbers;
45

the messenger ribonucleic acids (mRNAs) aregenerally short lived; in many instances thegenes responsible for the synthesis of enzymesparticipating in a given metabolic path areclustered in the genome. In contrast, eukariotshave their genome mainly confined to thenucleus (functioning deoxyribonucleic acid(DNA) has been localized in other subcellularparticles); their protein turnover and excessesare disposed of by catabolic breakdown; theribonucleic acids (RNAs) generally have a longlife, and clusters of genes linked in metabolicpaths are not frequent. In animal cells there isa rapid turnover of intranuclear RNA andDNA has become redundant to a great extent.Cell differentiation has brought about homeo-stasis, therefore, it has been necessary to putinto operation supracellular mechanisms of met-abolic regulation, namely, the central nervous,and the endocrine systems. It suffices to say, inconnection with the matter being discussed, thatthe increasing complexity built up by biologicalevolution has made it mandatory for higherorganisms to resort to other levels of regulationand organization than those found in simplemicroorganisms. Hence, even though the infor-mation obtained from these cannot be directlyextrapolated from the former, it can providesolid grounds for a starting point for a betterknowledge of mechanisms involved in theirmetabolic control.
There is another difference between micro-organisms and nigher organisms that it is im-portant to point out. Microorganisms take upnutrients from an environment to which theyare constantly exposed, while higher organismshave developed a pattern of intermittent feed-ing. Thus, they have to cope with the stress ofa load of nutrients to which they are periodicallysubjected.
The changes in enzyme activities of livingorganisms provoked by influences originatingin the environment are referred to as metabolicadaptation. It is well-substantiated that thequality and quantity of ingested food produceschanges in the enzyme activities of different
tissues and organs. It is beyond the aim of thispaper to review them extensively. Instead,consideration will be given to some aspects ofthe variations of tissue enzyme activities, bear-ing more on their physiological significance, andon the limitations of interpretation of in vitrostudies toward an understanding of the functionof the intact animal. It should be kept in mindthat the effects of a lack of or an excess ofnutrients and composition of diet are intimatelyinterconnected with influences exerted by neuraland hormonal factors and these are difficult todistinguish. The direct participation of neuralfactors in the regulation of tissue enzyme activi-ties is proved by the work of Shimazu andFukuda (119), who found that the stimulationof the sympathetic system caused an increasein the activities of hepatic phosphorylase andglucose-6-phosphatase, while the excitation ofthe parasympathetic system increased the activityof glycogen synthetase. Both systems counteracteach other with respect to the effects produced.The indirect participation of the central nervoussystem, through its connection with the endo-crine system, is an obvious one, since hormonesare effective agents in the control of enzymeactivities. We will have more to say regardinghormonal influences, particularly in so far asthey might affect a given dietary action; how-ever, we will restrict ourselves fundamentally tothe effects of the quality and quantity of thediet on enzyme activities.
The review made in 1956 by Knox, Auerbach,and Lin (55) brought together informationavailable at that time and caused a great dealof interest in the subject. Again, Knox andGreengard (56) made another thorough re-vision of the matter in 1965. Very recentlySchimke (112) collected information relevant tothe control of enzyme levels in animal tissues,thus bringing into sharp focus the problemsfaced at the present time. These three papersconstitute an excellent reference for those whowish to learn more on the topic.
46

Dietary stimulus capable of producing changesin enzyme activities
Modifications in the composition of the dietby increasing or decreasing its constituents causealteration in some enzyme activities. Anotherexperimental model that has been extensivelystudied is the effect of starvation followed byrefeeding. Some changes observed under theseparticular conditions will be described beforeconsidering the effects of variations in dietaryprotein, carbohydrate and fat, vitamins andminerals.
Starvation and refeeding
When an animal is starved or fed with aprotein-free diet, there is a small fraction of thetotal body protein that is rapidly lost and rapidlyregained when fed with an adequate diet. Sucha fraction has been called labile body protein(77). It has been recognized that liver, pan-creas, and intestinal mucosa are important sitesof labile protein deposition, while other organssuch as muscle do not respond as readily toprotein deprivation, and still others, such asbrain, are almost unaffected (77). Liver isdirectly exposed to the flow of nutrients ab-sorbed from the intestine, therefore it is sub-jected to more stimulus than other tissues andhas a greater need of metabolic adjustments.Since it has been more extensively studied thanother sites, reference will be made mainly tohepatic changes.
Fasting causes a rapid mobilization of liverprotein content which tends to level off after 24hours (124), perhaps at a time that coincideswith the adjustment of urinary nitrogen outputto the endogenous level established when dietaryprotein is completely withdrawn (77). Thereis another period of rapid loss of protein justprior to the death of an animal that inevitablyensues if food is not allowed (124).
The mobilization of protein is accompaniedby a removal of RNA and phospholipids; endo-plasmic reticulum becomes less abundant. Thesechanges can be seen a few hours after the initia-
tion of fasting, and they are, moreover, restoredquite rapidly in relation to the elevated intra-cellular concentration of amino acids and othernutrients after food consumption (77).
Catalytic proteins should be part of the labileprotein, since enzyme activities decrease sharplyduring starvation and a protein-free diet. Morecareful analysis has shown that during fasting,not all enzyme activities decrease at the samerate: some seem to be spared and others are, infact, augmented (11, 124). By the same token,when an animal is refed, not all enzyme activi-ties are restored at the same rate; some do notincrease, but, in fact, decrease during the re-feeding period (11, 124). Of note is the caseof glucose-6-phosphate dehydrogenase, whoseactivity upon refeeding reaches levels muchgreater than those seen in a normal animal(15, 134, 135, 136, 137).
No attempt will be made to mention everyenzyme whose variation in activity has beendetected during starvation and refeeding. Afew changes that seem to follow from the par-ticular metabolic condition introduced by thestress of starvation and refeeding will be men-tioned. For instance, those enzymes whoseactivity has been considered as determining theflow of metabolites from glucose to pyruvate(glucokinase, phosphofructose kinase, and pyr-uvic kinase) diminish during fasting and in-crease upon refeeding, while the activities ofenzymes involved in shifting the flow of me-tabolites from pyruvate to glucose (pyruviccarboxylase, phosphoenol pyruvic carboxylase,fructose-1-6-diphosphatase, and glucose-6-phos-phatase) increase by fasting. These changes arein accordance with the predominance of gluco-neogenesis and diminution of glycolysis duringfasting, and the reversal of this situation is notedwhen the animal is refed (104, 117, 145, 146).
Enzymes intervening in lipogenesis alsochange in a similar fashion, that is to say, theydecrease during fasting and recover upon re-feeding. In addition to the change in glucose-6-phosphate dehydrogenase already mentioned,a similar variation has been noted in 6-phospho-
47

gluconic dehydrogenase, citric acid cleavage en-zyme, acetyl CoA carboxylase, fatty acid synthe-tase and long-chain fatty acid desaturase (2, 35).The driving force in lipogenesis of nicotinamideadenine dinucleotide phosphate (NADPH)generation by the two first enzymes has beenemphasized (136, 137). Concomitant with thechanges described, it is found that there islipid deposition in the livers of animals refedafter a starvation period (124). Similarly, itshould be mentioned that hepatoma 7794-Adoes not respond to the stimulus of fasting andrefeeding with respect to the increase in glu-cose-6-phosphate dehydrogenase seen in normalliver (145).
Starvation causes an increased protein andamino acid catabolism. Correspondingly, thereis an augmentation in the activities of carbamylphosphate synthetase, ornithine transcarbamyl-ase, arginino succinic synthetase, arginino suc-cinase and arginase-enzymes that participate inurea biosynthesis (108, 109). There also is anaugmentation in the activity of glutamic oxalo-acetic transaminase (124, 141) and glutamicpyruvic transaminase (79, 101, 124)-enzymesancillary to the urea cycle. The feeding ofcasein hydrolysate to the starved rat greatlyincreases the activity of serine dehydratase (89).Glutamic dehydrogenase changes in a mannerparallel to the change in liver weight (42).
The recovery of enzyme activities that occurswhen the starved animal is refed has beenijudged, in many instances to be due to de novoprotein synthesis, because inhibitors of thisprocess prevent the observed increase in enzymeactivity. The use of actinomycin D, puromycinand ethionine, as well as the reversal of theeffect of the latter by methionine, have beenwidely used (27, 34, 35, 104, 117, 136, 147).
First, the quality of the dietary protein usedto feed the fasted animal is of great importancein determining the pattern of recovery of theenzymes affected. Secondly, the nutritionalstatus of the animal is fundamental for a de-ficient diet to have an effect on the recovery ofenzymes under conditions of rapid liver growth.
These two statements are substantiated by astudy carried out in our laboratory where theactivity of eight hepatic enzymes was followedunder two different anabolic conditions: rapidliver growth obtained when a previously starvedanimal is refed (124), and liver regenerationafter partial hepatectomy (105). In both situa-tions, the effect of feeding zein, a protein of lowbiological value, deficient in tryptophan andlysine, was explored in comparison with the feed-ing of casein, a good protein. In the depletion-repletion system it was found that all enzymeactivities recovered in relation to protein con-tent. Thus, although the total activity was lowerin animals fed with the deficient diet, the spe-cific activity expressed as given units per milli-gram of protein, was the same in both groups.The deficient diet prevented the liver lipid de-position seen with the casein diet. No differencewhatsoever was detected in the regeneratinglivers of the animals fed either diet. It wasnecessary for the animals to be fed the deficientdiet prior to hepatectomy in order to see dif-ferences. These findings indicate that in theevent of limiting amino acids, hepatic enzymeactivities recover to about the same extent, inrelationship to one another, as they do underconditions where amino acids are not limiting.It is likely that the amino acids missing in thediet can be made available to the liver from thecatabolism of proteins from other tissues. In-deed, it has been demonstrated that protein isredistributed among different tissues dependingon the prevailing metabolic situation. Mobiliza-tion of muscle labile protein, with a flow ofamino acids toward the liver and consequentdeposition of labile hepatic protein, follows theadministration of catabolic hormones (thyroxinand corticoids) while the reverse flow is favoredby anabolic hormones (growth hormone andandrogens) (77).
Other tissue that readily responds to the stressof fasting is adipose tissue. Under this condi-tion the incorporation of labeled acetate intofatty acids is diminished and there is a decreasein RNA synthesis-refeeding restores both ca-
48

pacities to normal values (34). Jejunal glycolyticenzymes change during starvation in the sameway that the corresponding liver activitieschange (127).
Variations in dietary protein, carbohydrate, fat,vitamins, and minerals
Protein-free diet mobilizes labile protein,therefore, the changes in enzyme activities re-semble somehow those seen in starvation,although they are less pronounced. The ad-ministration of carbohydrate, however, has adefinite specific effect on protein tissue redistri-bution, mediated probably through the releaseof insulin, hence, the flow goes from liver tomuscle (77). A decrease in urea biosynthesisenzymes is observed after the administration ofa protein-free diet (30, 109, 110); glutamic de-hydrogenase and glutamine synthetase alsodiminish (30). The effect of lack of protein inthe diet is very striking on xanthine oxidasewhich reaches very low levels of activity (73). Alow-protein diet (containing 2 per cent casein)increases the activity of 3-phosphoglycerate de-hydrogenase and phosphoserine phosphatase(enzymes involved in the phosphorylated pathof serine formation), while decreasing the ac-tivity of serine dehydratase (23, 24).
A high-protein diet produces an augmentationof digestive proteolitic enzymes (40, 67) withlittle or no effect on lipase and amilase, whichhas been attributed to increased synthesis andsecretion by the pancreas (67).
A high-protein diet also produces an increasein several activities involved in amino acidcatabolism: serine dehydratase (23, 43, 87, 88),glutamic oxaloacetic transaminase (65, 79, 87),glutamic pyruvic transaminase (43, 65, 79),tyrosine transaminase (65, 85, 87, 88), trypto-phan pyrrolase (88), ornithine transaminase(46, 85, 88, 130), carbamyl phosphate synthetase(110, 111), ornithine transcarbamylase (108,110, 111), arginino succinic synthetase, argininosuccinase, and arginase (109, 110, 111), histidinepyruvate transaminase, histidase, and uricase(114). There is also indirect evidence that the
increased resistance to ammonia intoxication ofrats fed with a high-protein diet might be dueto an increase in amino acid catabolic enzymes(154). Other enzymes related to carbohydratemetabolism like glucose-6-phosphatase, fructose-1-6-diphosphatase, malic dehydrogenase andsorbitol dehydrogenase, although less responsivethan the above-mentioned, still increase afterfeeding the animal with a high-protein diet(43).
Some individual amino acids have specificeffects: tryptophan increases the activities oftryptophan pyrrolase and tyrosine transaminase(53, 112). Tryptophan analogues and otherindol compounds have the same effect (39, 57,100). Serine increases the activity of serine de-hydratase (128), an effect more readily seen em-ploying a mixture of amino acids from caseinhydrolysate (86, 88, 90, 91). Serine and glycinediminish the activity of 3-phosphoglycerate de-hydrogenase (128). Ornithine increases the ac-tivity of ornithine transaminase (12). Creatine,a nitrogenous compound derived from aminoacid metabolism, decreases the activity of gly-cine transaminase (142).
A high-carbohydrate diet increases pancreaticamilase activity while it decreases the proteolyticactivity, but it does not have any effect on lipase(40). Such a diet increases the activities of liverpyruvic kinase (59, 133), glucose-6-phosphatedehydrogenase (136), and citrate cleavage en-zyme in previously fasted rats (58). Effects ofspecific sugars have also been noted. The ad-ministration of glucose causes an augmentationof glucokinase and of fructose-1-6-diphosphatase(80, 90, 104), and increases the incorporationof leucine C14 into tissue beta plus pre beta lipo-proteins, with a corresponding change of theelectrophoretic pattern of plasma lipoproteins(21, 22). The feeding of sucrose or fructoseand of glycerol increases the activity of hepaticpyruvate kinase, glucose-6-phosphatase, andfructose-1-6-diphosphatase while decreasing theactivity of glucokinase and phosphofructokinase(121, 122, 147). Glucose, fructose, or sucrose in-crease glucose-6-phosphate dehydrogenase in the
49

starved animal (15). Glucose interferes with theenhancing effect of casein hydrolyzate on serinedehydratase in the starving animal (88, 90).
Individual sugars in the diet also have specificeffects on certain jejunal glycolytic enzymes:fructose increases fructokinase and glucose in-creases glucokinase and hexokinase (102, 127).
The administration of a fat-free diet to starvedrats increases the activity of fatty acid synthetase(10) and acetyl CoA carboxylase (72). A high-fat dietary content causes a lowering of theactivities of pancreatic amilase and lipase butproteolytic activity is not affected (40). Thefeeding of cholesterol (123) or ubiquinone (60)greatly decreases the synthesis of this compoundby interfering in the conversion of ,B-hydroxy-fl-methylglutaryl-CoA to mevalonic acid.
It has been noted that vitamin-deficient dietshave definite effects on the corresponding en-zymes. Pyridoxin deficiency causes a diminutionof the activities of threonine dehydrase (38),glutamic pyruvic transaminase, glutamic tyrosinetransaminase (79, 100), cysteine sulfinate de-carboxylase, cystathionase and aromatic decar-boxylase (56). Riboflavin deficiency produces adecrease in xanthine oxidase and D-amino acidoxidase (9) and flavokinase (25). Biotin-de-ficient rats have a decreased content of carcasscholesterol, but not liver cholesterol; esterifiedfatty acids are also lowered, particularly inadipose tissue, and in the carcass (17). The ef-fect of vitamin K deficiency on the synthesis ofprothrombine and other clotting enzymes is wellsubstantiated (81, 82). It is well recognizedthat a given vitamin deficiency affects differentlyenzymes that function with the correspondingcoenzyme derived from that vitamin.
The administration of pyridoxin causes adoubling of`tyrosine transaminase (39), nicotin-amide increases the tissue content of pyridinenucleotides, but the activities of glutamic dehy-drogenase, lactic dehydrogenase and glucose-6-phosphate dehydrogenase are not affected (42).
A dietary deficiency of Mn++ lowers arginaseactivity which is not restored by the addition ofthe metal in vitro (5).
Iron deficiency causes an increase in the cop-per tissue concentration and a decrease in mono-amide oxidase (131).
Efect of the feeding schedule
After digestion of the ingested food and ab-sorption of the nutrients from the gut, thesebecome metabolites that flow through the or-ganism. Changes in the metabolic machineryrender it able to cope with the transient load ofnutrients which, by means of complex homeo-static mechanisms, are returned to the concen-trations prevailing in the steady state of thepostabsorptive period. Adjustment to new meta-bolic conditions applies, of course, to enzymeactivities, the entities responsible for transform-ing the metabolites.
Therefore, it is easy to understand that foodingested periodically by animals should producedifferences in tissue enzyme activity as comparedwith animlas fed ad libitum. Studies carriedout in the laboratory of Potter (92, 93, 94, 95)clearly show that such is the case. Rats keptunder very careful conditions of constant tem-perature and well-timed alternate periods oflight and dark are trained to feed according todifferent schedules: 8 hours and 16 hours, 12hours and 36 hours, or 8 hours and 40 hours,respectively, for alternate periods of feeding andfasting. Under these conditions, variation inseveral enzyme activities and other biochemicalparameters has been shown. However, theoscillations are not necessarily coincident as onemight be led to believe as though they weredependent on the same factor. To make thispoint clear, it is worth describing the findingsof the 8+40 schedule. Stomach weight (in-cluding content), liver weight, and glycogendeposition show increases correlated with foodintake; influx to and aflux from the liver of cy-cloleucine (probably an indication of variationsin the amino acid pool), tyrosine transaminaseactivity, and the concentration of plasma corti-costerone are related to each other, but notclearly to food intake; serine dehydratase, glu-cose-6-phosphate dehydrogenase, and citrate
50

cleavage enzyme oscillate similarly among them-selves, but differently in relation to the otherparameters described; synthesis of RNA andof its precursors seems to be related to the pat-tern of food intake. By feeding training it hasbeen possible to shift the peak of maximal activ-ity of certain enzymes (143).
The daily variations of tyrosine transaminasehave attracted the interest of several researchgroups. The enzyme activity cycle is clearly seenin the animals fed ad libitum (33); it persistsin constant darkness with unchanged amplitude(4), but a rhythm with reduced amplitude re-mains after exposure to one week of constantlight (4). The peak of activity persists after 10hours of fasting in rats fed ad libitum (4), how-ever, in the 8+40 feeding schedule of Potter(92), there are two peaks of activity, one clearlycorresponding to the fasting period. It is ofinterest that no rise in activity appears if theperiod without food is extended. Protein-freediet prevents the cyclic variation of tyrosinetransaminase, and apparently tryptophan is in-volved, since the feeding of an amino acid mix-ture devoid of tryptophan also suppresses therhythm of enzyme activity (159). It has beensuggested that the oscillation of the enzymeactivity corresponds to a daily cycle of increaseof polysome aggregation which depends onamino acid influx, principally tryptophan (29).This proposition is difficult to reconcile with thesecond peak of activity during the fasting periodof 8+40 feeding schedule of Potter (92). Therehas been a great deal of discussion concerningthe "true circadian" nature of tyrosine transami-nase cyclic variations. In this respect, Potter(92) has stated, "The shifts in tyrosine transa-minase activity can only be looked upon as aresponse to an ordered succession of cyclicchanges in the levels of amino acids, cortico-sterone, glucagon and insulin, and possiblyepinephrine and norepinephrine, associated withbehavioral responses to the light-dark cycle. Itseems likely that the circadian rhythms in actuallife are a blend of internal and external factors."
Another experimental model has been studied
which clearly shows the type of metabolic ad-justments produced by intermittent feeding, thatis, the meal-fed rats, whereby the animals aretrained to ingest food for one or two hours daily(64, 132). Infrequent feeding develops hyper-phagia, that is to say, the ability to consumelarge amounts of food within a short time in-terval (6). Other changes that follow are:hypertrophy of the digestive tract which ac-counts for greater digestive capability and en-hanced intestinal absorption (63), high res-piratory quotient after carbohydrate ingestion(6), and increased ability of hepatic and adiposetissue to synthesize fatty acids in vitro (6, 62).The hyperlipogenesis is accompanied by an in-creased activity of many enzymes involved inthe conversion of glucose to fatty acid andglycerophosphate (13). Rats fed two hours dailyor refed after fasting have more lipocytes inadipose tissue; the DNA content of these cells isgreater, and they incorporate more thymidine2C14. There is an increased sensitivity of adi-pose tissue to insulin and epinephrine, and theadenyl cyclase activity of lipocyte ghosts is aug-mented (6). Meal-fed rats also have a greatercapacity to accumulate glycogen in muscle andin adipose tissue than nibbling animals which isreflected in the activity of the glycogen-syn-thesizing enzymes in both tissues (158).
Some factors influencing the effect of dieton tissue enzyme activities
In studying the changes in enzyme activitiesprovoked by dietary variations, it is necessary totake into account some factors that may alter theresponse. It would seem to be desirable to men-tion them at this point.
Endocrine nutritional interactions
It has been previously stated that the endo-crine system plays a very important role in themetabolic regulation of higher organisms. Someof the changes described previously are alsounder the command of hormones, thereforedietary stimulus might depend on the endocrinestatus, and conversely a given effect caused by
51

a hormone might depend on the nutritionalconditions.
Glucocorticoid increases the amount of argi-nase (3), glutamic pyruvic transaminase (115),tryptophan pyrrolase (11, 57), tyrosine trans-aminase (48, 49), ornithine transaminase (85,130), glucose-6-phosphatase, fructose-l-6-di-phosphatase, phosphoenol pyruvic carboxylase,and pyruvic carboxylase (146). Insulin increasesthe activities of uridine diphosphate glucose(UDPG)-glycogen synthetase (139), glucoki.nase (80, 104), phosphofructokinase, and pyr-uvic kinase (146), tyrosine transaminase (49),and glucose-6-phosphate dehydrogenase (135).Glucagon increases the activities of serine dehy-dratase (44), tyrosine transaminase (49), adenylcyclase, hence through cyclic adenosine mon-ophosphate (AMP) formation, it increases phos-phorylase (129). Adrenalin acts similarly onthe latter system (129). Thyroid hormone in-creases the activity of L-glycerophosphate dehy-drogenase, and malate dehydrogenase (61).
The endocrine-nutritional interactions are il-lustrated by the work of Freedland: the effectof glucocorticoids on amino acid metabolizingenzymes and a few others depends on the diet-ary protein (43). Conversely, in general, ad-renalectomy and hypophysectomy diminish theamplitude of the response of enzymes that nor-mally increase or decrease with the feeding ofa high-protein diet (31). Other enzymes thatnormally do not vary with the high-protein diethave rather erratic responses after endocrinec-tomy (31).
Liver malate dehydrogenase (decarboxylat-ing) increases more and is more sensitive tothyroxin in rats previously fed with a high-carbohydrate diet than in those fed with ahigh-fat diet (41). The fall in enzyme activitiesas a result of starvation is more striking inhypophysectomized rats (146). Similarly, thefasting of diabetic rats has a more pronouncedeffect on ribonucleic acid (RNA) synthesis, andlipogenesis (34), and on those enzyme activitiesdirectly committed to gluconeogenesis (153).The effect of cortisol and starvation on tyrosinetransaminase depends on the basal activity of
the enzyme which, in turn, is related to theprevious dietary experience. The basal activityis high when the animal is fed with a high-protein diet and does not increase after cortisol.Starvation produces a decline in the enzymeactivity of rats previously fed a high-protein diet,but produces an augmentation in those previ-ously fed a high-carbohydrate diet (75).
Glutamic pyruvic transaminase requires ad-equate stores of pyridoxal phosphate in vivo toobtain maximal response when increased by cor-tisol, however tyrosine transaminase has normallevels and can be increased readily in rats se-verely depleted of pyridoxin (79, 100). Tyrosinetransaminase increases by exposing the fastedanimal to the cold, but it does not increase byapplying the same stimulus to the recently fedanimal (27).
Glucose alone increases glucokinase, citratecleaving enzyme, and glucose-6-phosphate dehy-drogenase in the intact animal, but glucose andinsulin are required to produce the samechange in the diabetic animal (88).
Adrenalectomy prevents the effect of refeed-ing by the increase of glucose-6-phosphate dehy-drogenase in the fasted animal (94).
Species and strain
Taking labile body protein as representativeof the type of response that can be obtained bychallenging the animal with a dietary stress(starvation or a protein-free diet), the followingconsiderations made by Munro (77) are per-tinent to emphasize the diverse results thatmight be observed in different species: "Therelative importance of labile body protein inrelation to other aspects of protein metabolismis likely to differ in species of different bodysize . . . it was concluded that the proportionof body protein which is labile is about the samein the rat as in man. The evidence we shall nowconsider shows that the intensity of total proteinmetabolism in the rat is five times greater thanin man. Consequently, labile body protein willassume greater importance in the economy ofprotein metabolism in man than in the rat."
52

To illustrate the point of species differences,it can be said that the administration of xan-thine to mice causes an increase of 70 per centin xanthine oxidase activity, but rats respondrather poorly to the same stimulus (19). Thereare also differences due to the strain of theexperimental animals used. The administrationof a diet containing 25 per cent cooked, driedegg produces kidney damage, esteatosis, hyper-lipemia, and hypercholestoremia in the BHErats but not in the Wistar rats.
Age of the experimental animal
The level of enzyme activities varies with age,so does their responsiveness to change under theinfluence of different stimuli. For instance, tryp-tophan pyrrolase increases in the mature rat sothat at 400 days of age the activity has doubledin comparison to the activity found in animals38 days old (65). The fasting levels of livertyrosine transaminase are lower in senescentmice than in young ones. The same enzymeincreases after the feeding of a diet containingfive per cent tyrosine in rats of seven weeks ofage, but mature animals of 15 weeks of age donot respond at all (53).
The importance of tissue enzyme activities asthey change with age in relation to longevityhas been emphasized in a recent study by Ross(103). He determined the pattern of change offour enzymes: Alkaline phosphatase, histidase,ATPase, and catalase in relation to age from25 to 995 days. A correlation was found betweenthe activities on one side and life expectancyand the incidence of disease on the other. Veryimportantly, when the activity of the enzymeswas varied by dietary means so that they ap-proached the pattern seen in the young rat, asignificant increase in life expectancy was alsoobserved.
Organ difierences
It is well known that starvation and protein-deficient diets have a differential effect; whereasgreat changes are produced in liver (124), brainis less influenced (140). Starvation and diabetes
cause inhibition of fatty acid synthesis in liverbut do not affect the heart. Neither have anyeffect on the nicotinamide adenine dinudeotide/NAD (NADH/NAD) ratio that regulatesheart lipogenesis, nor on the products of theprocess. Hence the heart mitochondrial systemthat accounts for 90 per cent of fatty acid syn-thesis is regulated by different mechanisms andis insulated from nutritional and metabolicconditions which profoundly influence overalllipogenesis in the whole animal (156).
Liver, brain, and kidney contain 3-phospho-glycerate dehydrogenase and the other enzymesfor the phosphorylated path of serine produc-tion. D-Glycerate dehydrogenase, the enzyme ofthe non-phosphorylated path, is present only inliver and kidney. The elevation in 3-phospho-glycerate dehydrogenase obtained by feeding adiet containing 2 per cent protein is seen onlyin liver and corresponds to a diminution in thecysteine, methionine, and taurine content thatappears only in liver. Supplementation withmethionine or cysteine removes the change (24).
It has been found that the ratio of aldolases,the one acting on fructose-l-6-diphosphate tothat using fructose-1-phosphate as substrate, re-mains close to one in the liver of animals sub-jected to different experimental conditions,whereas in jejunum, the ratio can be changed tobe less than one by dietary means (127). Ubiq-uinone inhibits sterol synthesis by affecting thereduction of 3-hydroxy-P-methylglutaryl CoAof the liver, but has no effect on kidney or in-testine (60). Liver glucokinase and pyruvatekinase differ in physical, kinetic, and regulatoryproperties from that found in other tissues(112). The rate of degradation of lactic dehy-drogenase isozyme-5 varies in liver, skeletalmuscle, and heart muscle (32).
Although many more examples of organ dif-ferences may be given (61), those mentionedabove should suffice to illustrate the point thatdifferent tissues may contain different isozymes,and also that the same protein in different sur-roundings may be subjected to different regula-tory mechanisms.
53

Mechanisms of changes in enzymeactivities caused by diet
Higher organisms have the peculiarity thattheir proteins turn over. Thus, a variation in agiven enzyme activity may be a consequence ofa change in the steady-state concentration of thespecific protein being considered to a differentsteady-state concentration. The shift may be theresult of a modification in the rate of synthesis,or in the rate of degradation, or a combinationof both (112). The variation of activity mightalso be due to other factors, such as the con-centration of activators, inhibitors, and coen-zymes which affect the catalytic action (124).Redistribution of enzymes among subcellularfractions should also be considered (18, 124).
The relation of enzyme synthesis and deg-radation to the nutritional status will be dealtwith here, but rather briefly, because the subjecthas been covered thoroughly by Dr. Schimke.It is conceivable that diet may alter enzymeactivities in several ways.
Non-specific effects on protein synthesis
Amino acids supplied in the diet may serveas building blocks for the synthesis of protein.Although many of the 20 species that participatein protein synthesis can be readily produced byintermediary metabolism, there are several, theindispensable amino acids, that have to be pro-vided by the ingested food. Under certain cir-cumstances, the amino acid pool becomes limitedwh-cn certain enzymes are increased by theadministration of hydrocortisone (43), as sug-gested by the increasing effect on the activityof higher dietary protein content. Protein syn-thesis is a highly endergonic process, thereforeit should be hampered by a shortage of calories.
Muno (78) has shown that a flow of an ade-quate mixture of amino acids to the liver isdeterminant in preserving the protein biosyn-thetic machinery in working condition. Thefeeding of a deficient mixture causes a loss ofheavier polysomes with accumulation of oligo-somes and also of ribosome subunits. Thesesmaller particles are more suitable to the action
of ribonuclease, which, though remaining latentin the intact particles, becomes activated upondisintegration. The administration of a com-plete amino acid mixture causes aggregationsof ribosome sub-units and of oligosomes to pro-duce polysomes. It has been further demon-strated that the deficiency of tryptophan is fund-amental for causing polysome disaggregation(78). However, Shaw and Fillios (118) havenoted that soon after the administration of afree- or low-protein diet one perceives an in-creased incorporation of labeled amino acids intoprotein as well as an augmented activity ofRNA polymerase Mg++ dependent, while theMn++ dependent remains unchanged. Further-more, a shift in the ribosomal profile char-acterized by the aggregation of monosomes toproduce polysomes, and an increased incorpora-tion of labeled orotic acid into RNA was noted.This type of response was rather transient, sinceat a later time the situation was found to besimilar to that referred to above (78). At anyrate, in both cases, a correlation between aminoacid incorporation and the status of polysomeaggregation was found.
Specific effects on protein synthesisand degradation
When a change of enzyme activity is detected,the first question is whether the variation cor-responds to an alteration in the amount of a spe-cific protein. In answer, it can be shown bydirect proof that more specific protein has beensynthesized. Purification of the specific proteinpermits its quantification. Alternatively, purifi-cation of protein allows the preparation of aspecific antibody for the isolation of the antigenantibody complex and by this means the quan-tification of the given protein. In both casesit is possible to determine the incorporation oflabeled amino acids into the specific protein incomparison with the general incorporation inall proteins, information that is also relevantto the specificity of given changes.
It has been demonstrated that among theenzymes that are changed by dietary stimulus,
54

increases in the activities of arginase (108, 111),ornithine transcarbamylase (108), acetyl CoAcarboxylase (72), tyrosine transaminase (48,100), glutamic alanine transaminase (116), tryp-tophan pyrrolase (26, 113), serine dehydratase(44), and glucose-6-phosphate dehydrogenase(161) correspond to increases in the absoluteamount of the corresponding proteins.
An increase in the amount of a given proteincan be a consequence of either an increase inthe rate of its synthesis or a decrease in the rateof its degradation (112, 115). Indeed, it hasbeen found that both levels are operative inanimal tissues. For instance, the increase inarginase activity induced by a high-protein dietis due to an augmented rate of synthesis, butthe increase caused by starvation is induced by adrop in the rate of degradation to essentiallyzero (112). The shift from a high- to a low-protein diet lowers the amount of arginase bythe combination of both a decreased rate ofsynthesis and an increased rate of degradation(112). Similarly the difference of acetyl CoAcarboxylase in animals fed a fat-free diet orstarved is due to a combination of both factors;increased rate of synthesis in the former andincreased rate of degradation in the fastedwithout any apparent connection between them(72). The case of tryptophan pyrrolase has beenclarified in different laboratories (3, 26, 39, 54,113, 126). The increase observed after gluco-corticoid administration is the result of an in-creased rate of synthesis, but the augmentationproduced by the administration of tryptophanis caused by a decreased rate of degradation.Knox (54) has proposed the following schemefor the regulation of the enzyme. The associa-tion of L-tryptophan with the apoenzyme rendersit more suitable to combine with hematin. In-terestingly enough, there appears to be a recipro-cal control in the synthesis of the tryptophanpyrrolase and heme. The increased synthesis ofL-amino levulinic acid synthetase (which en-hances heme formation) by the administrationof allylisopropyl acetamide produces an in-crease in the tryptophan pyrrolase apoenzyme.
Conversely, concomitant with the increase inapoenzyme that follows tryptophan administra-tion, there is an increase in the activity ofL-amino levulinic acid synthetase (74).
The effect of glucocorticoids on tyrosine trans-aminase and glutamic pyruvic transaminase ap-pears to be limited only to the rate of theirsynthesis (49, 50, 51).
The increase of serine dehydratase that fol-lows the intubation of casein hydrolysate inprotein-depleted rats is due to an augmentationof the rate of synthesis (44). The suppressoreffect of glucose results from the avoidance ofthe amino acid effect on the rate of synthesis,and also from an increased rate of degradationof existing serine hydratase (44). Glucagon alsoenhances the enzyme activity by increasing therate of synthesis, an effect that is probablymediated by cyclic AMP (45). A similar actionof glucagon on tyrosine transaminase has beendescribed (157).
The decreased activities of glycine trans-aminase after the feeding of creatine (142), andthe prevention of the conversion of /-hydroxy-,8-methylglutaryl CoA to mevalonic acid bycholesterol (123) or ubiquinone (60) representstwo instances of control of a metabolic path bya final product in higher organisms. To ourknowledge, no others have been described.However, the operating mechanisms have notbeen elucidated yet, although it has been sug-gested that the synthesis of the enzyme ishampered.
It has been inferred, from the effect of inhib-itors of protein synthesis that the change ofmany other enzyme activities are due to denovo protein synthesis. Actinomycin-D andpuromycin have been greatly favored, since itis known that they act respectively at the levelsof transcription and translation of the geneticinformation. These ideas follow the concept ofthe model proposed by Jacob and Monod, whichhas been found to operate in microorganisms.However, the interpretation of experimentswhere these inhibitors are employed should belooked upon very cautiously considering, first
55

of all, that they have toxic effects, and, there-fore, other extraneous factors might come intoplay (112). In addition, the behavior of somesystems where inducing agents and protein syn-thesis inhibitors have been employed cannot beeasily understood in terms of the Jacob-Monodmodel. Hence, it is necessary to look for alter-nate explanations. Tomkins et al. (138) haveproposed a model where the control is exertedby a post-transcriptional repressor, which bycombining with mRNA prevents its translationand renders it susceptible to degradation.
One of the main features derived from theJacob-Monod model is that of the coordinatedvariation of the enzymes clustered in the sameoperon. In higher organisms, coordinated varia-tion has been found in several groups of en-zymes connected metabolically. A clear exampleof such is that of the urea biosynthesis enzymes.Schimke (108) found that by varying theamount of protein in the diet, the activities of
CARBAMYL PHOSPHATE
óI§ flSYNTHETASE ,
6 -__/
= 0 2 4 6 8 10
o
w
U,4,1
86
42
r ARGININOSUCCII
0
carbamyl phosphate synthetase, ornithine trans-carbamylase, arginino succinic synthetase, andarginase varied in a coordinated form. In factthe variation of arginase, although following thesame trend, did not quite change in the sameproportion as the other enzymes did (Figure 1).The same type of coordinated variation in star-vation has been found in feeding rats with adiet containing zein, and during liver regenera-tion after partial hepatectomy (30). The sametype of coordinated variation in urea biosyn-thesis enzymes was found in our laboratory (76)in the steady-state concentration of animal spe-cies with a wide variety of nitrogen excretorypatterns (Figure 2). Again, a very good correla-tion was found among the relative variations ofcarbamyl phosphate synthetase, ornithine trans-carbamylase, and the arginine synthetase system(arginino succinic synthetase and arginino suc-cinase assayed together); arginase, following thesame tendency, somehow varied in a different
40 RANSCARBAMYLASE SYNTHETASEui40 - _ '3< 324 - 024 - 2T
_ _
0 2 4 6 8 10 0 2 4 6 8 10DAILY PROTEIN INTAKE GM PER DAY
NATE rARGINASECLEAVAGE h,ENZYME
w- ;/ t
F-3,z1 1 1- -1 - - - j =~r
2 4 6
5 14
32
In
6 8 10 -O 2 4 6DAILY PROTEIN INTAKE GM PER DAY
8 10
Figure 1. Relationships of total liver content of urea cycle enzymes to daily protein consumption. Protein intakein grams per day is plotted against enzyme content in units per liver. Brackets indicate -+ 4 standard errors. Thecircles represent animais initially weighing 50 to 60 gm each, and the squares indicate animals weighing 140 to 150gm each at the start of the experiment. Triangles indicate a separate group of rats weighing 140 to 150 gm each,which were initially assayed only for arginino-succinate synthetase. From Schimke (108).
56
_AR.lkNIn cZll INATFDMilTUIklC
,r
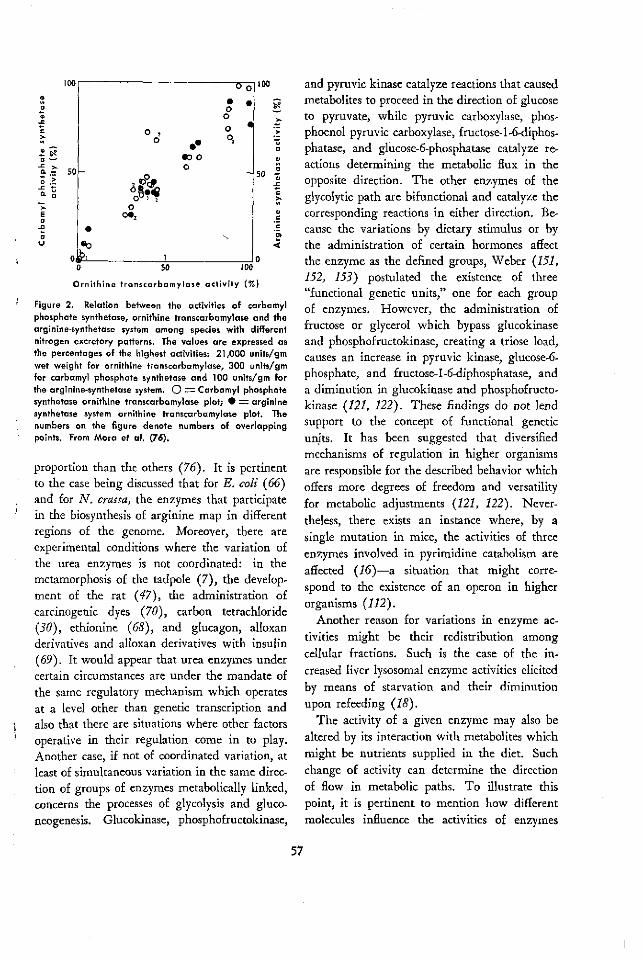
lool OoIíM
o11
_! 9D -7
Eoo'
-u>
rJ
00o
otOo
so50
0
Oe2
eob,o
es
0
50
Ornithine transcarbamylase activity (%)
Figure 2. Relation between the activities of carbamylphosphate synthetase, ornithine transcarbamylase and thearginine-synthetase system among species with differentnitrogen excretory patterns. The values are expressed asthe percentages of the highest activities: 21,000 units/gmwet weight for ornithine transcarbamylase, 300 units/gmfor carbamyl phosphate synthetase and 100 units/gm forthe arginine-synthetase system. O = Carbamyl phosphatesynthetase ornithine transcarbamylase plot; * = argininesynthetase system ornithine transcarbamylase plot. Thenumbers on the figure denote numbers of overlappingpoints. From Mora et al. (76).
proportion than the others (76). It is pertinentto the case being discussed that for E. coli (66)and for N. crassa, the enzymes that participatein the biosynthesis of arginine map in differentregions of the genome. Moreover, there areexperimental conditions where the variation ofthe urea enzymes is not coordinated: in themetamorphosis of the tadpole (7), the develop-ment of the rat (47), the administration ofcarcinogenic dyes (70), carbon tetrachloride(30), ethionine (68), and glucagon, alloxanderivatives and alloxan derivatives with insulin(69). It would appear that urea enzymes undercertain circumstances are under the mandate of
the same regulatory mechanism which operatesat a level other than genetic transcription andalso that there are situations where other factorsoperative in their regulation come in to play.Another case, if not of coordinated variation, atleast of simultaneous variation in the same direc-tion of groups of enzymes metabolically linked,concerns the processes of glycolysis and gluco-neogenesis. Glucokinase, phosphofructokinase,
and pyruvic kinase catalyze reactions that causedmetabolites to proceed in the direction of glucoseto pyruvate, while pyruvic carboxylase, phos-phoenol pyruvic carboxylase, fructose-1-6-diphos-phatase, and glucose-6-phosphatase catalyze re-actions determining the metabolic flux in theopposite direction. The other enzymes of theglycolytic path are bifunctional and catalyze thecorresponding reactions in either direction. Be-cause the variations by dietary stimulus or bythe administration of certain hormones affectthe enzyme as the defined groups, Weber (151,152, 153) postulated the existence of three"functional genetic units," one for each groupof enzymes. However, the administration offructose or glycerol which bypass glucokinaseand phosphofructokinase, creating a triose load,causes an increase in pyruvic kinase, glucose-6-phosphate, and fructose-l-6-diphosphatase, anda diminution in glucokinase and phosphofructo-kinase (121, 122). These findings do not lendsupport to the concept of functional geneticunits. It has been suggested that diversifiedmechanisms of regulation in higher organismsare responsible for the described behavior whichoffers more degrees of freedom and versatilityfor metabolic adjustments (121, 122). Never-theless, there exists an instance where, by asingle mutation in mice, the activities of threeenzymes involved in pyrimidine catabolism areaffected (16)-a situation that might corre-spond to the existence of an operon in higherorganisms (112).
Another reason for variations in enzyme ac-tivities might be their redistribution amongcellular fractions. Such is the case of the in-creased liver lysosomal enzyme activities elicitedby means of starvation and their diminutionupon refeeding (18).
The activity of a given enzyme may also bealtered by its interaction with metabolites whichmight be nutrients supplied in the diet. Suchchange of activity can determine the directionof flow in metabolic paths. To illustrate thispoint, it is pertinent to mention how differentmolecules influence the activities of enzymes
57
u/ _ . .

engaged in glycolysis and gluconeogenesis. Thesituation is presented in Table 1.
The conversion into each other of certainmetabolites is catalyzed by two different en-zymes which may be regulated by the presenceof important metabolites (Table 1). For in-stance, acetyl CoA activates pyruvic carboxylaseand inhibits pyruvic kinase; guanosine mono-phosphate (GMP) activates phosphoenol pyr-uvic carboxylase and inhibits pyruvic kinase.AMP inhibits F-1-6-diphosphatase (DPase) andactivates phosphofructokinase. Some of the me-tabolites produced by the glycolytic path feedback by inhibiting enzymes pushing the flow inthe direction of their formation: free fatty acidsinhibit glucokinase, phosphofructokinase, andpyruvic kinase; acetyl CoA inhibits glucokinase,and pyruvic kinase; phosphoenol pyruvic in-hibits glucokinase, and NADH inhibits phos-phofructokinase, and pyruvic kinase. Othermetabolites at the beginning of the glycolyticpath signal ahead favoring the flow in this direc-tion: glucose-6-phosphate, fructose-1-6-diphos-
phate, and glyceraldehyde-3-phosphate increasethe activity of pyruvic kinase. Some amino acidsinhibit pyruvic kinase, and hence glycolysis.Several nucleotide diphosphates act as acceptorsof pyruvic kinase, and the corresponding nucleo-tide triphosphate, product of the reaction, in-hibits the enzyme.
Then, by a complicated interplay of inhibitionand activation exerted by metabolites, glycolysis,and gluconeogenesis might function alterna-tively, in an on and off way, avoiding unneces-sary recycling (147, 150).
It is easy to understand that the concentrationof coenzymes and metals directly affects theenzyme activities. It has been mentioned abovethat the deficiency of vitamins as well as min-erals causes a decrease in the enzyme activitywhich is not always restored by the addition ofthe missing factor to the assay mixture, whichmeans that the amount of apoenzyme is affectedby the concentration of the coenzyme or metal.Moreover, it has also been noted that the re-sponse to hormonal stimulus in some cases is af-
Table 1
Effect of different metabolites on the activity of enzymes of carbohydrate metabolism
Glycolytic enzymes
MetaboliteFree fatty acidsAcetyl CoAADPATPCTPI, UTP, TTPAMPGTPG6PF-1-6-DPg3PNADHL-AlanineL-0-alaninePEP
GK
1PFK
1
1
·1
Gluconeogenic enzymes
PK G6Pase Fl-6DPase PEPCase PCase
$
1
1
·1 ·111
·1
Abbreviations: GK: glucokinase; PFK: phosphofructokinase; PK: pyruvic kinase;G6Pase: glucose-6-phosphatase; F1-6DPase: fructose-1-6-diphosphatase; PEPCase:phosphoenol pyruvic carboxylase; PCase: pyruvic carboxylase; g3P: glyceraldehyde-3-phosphate; other abbreviations corresponding to metabolites are of standard useor are implied in those used for the enzymes. Upward arrows mean activation;downward arrows mean inhibition. From data obtained by Weber et al. (144, 151).
58
-

fected by the concentration of coenzymes (114)and that the regulation of the biosynthesis ofheme influences the biosynthesis of apotrypto-phan pyrrolase (74).
Adjustment in the metabolic machinery canbe effected by altering the enzyme activity with-out modifying the amount of the enzyme, thatis, by means of metabolic effectors which, oninteracting with the specific protein, thus canaffect its catalytic properties. Accordingly, it hasbeen proposed that this particular type of controlconstitutes a sort of acute adaptation since itrapidly comes into play, while the change in theamount of the specific protein may be consid-ered a chronic adaptation because protein syn-thesis should take place and the process cannotbe adjusted as immediately (153). The firsttype of regulation cannot be evidenced, in manyinstances, by the in vitro assays of enzyme activi-ties because the incubation system usually putsthe enzymes in the so-called optimal condi-tions, whereby substrate, coenzymes, metals, andknown activators are included in non-limitingconcentrations. In addition the pH of the sys-tem corresponds to sites at which the catalyticactivity is higher. These conditions, of course,may hide the fact that in vivo a given metaboliceffector (activator or inhibitor) was operating.The situation could be better estimated by de-termining the efficiency of a metabolic fluxwhere the enzyme involved participates. An-other important consideration is that the condi-tions of an in vitro assay can sometimes be farremoved from those prevailing in vivo. Whatis the effective substrate concentration in theproximity of the active site of a given enzyme?What is the pH at interphases affecting the dis-sociation constants of functional groups at theactive, inhibitor, and allosteric sites? Finally,how is the conformation with other macromole-cules changed from what it is in vivo? Withoutanswering these questions, it can at least be saidthat caution should be exerted in extrapolatingfrom in vit.o assays to in vivo functioning.
The physiological significance of changes inenzyme activities
From the above, it is clear that tissue enzymeactivities do change under the influence of die-tary variations. Henceforth, changes in enzymeactivities as produced by alteration in the amountof the specific protein will be noted, and it willbe assumed that although the relation betweenactivity and amount of protein has been provendirectly in only a few cases, this relationshipoften holds. Several questions can be raised re-garding the meaning of those changes withrespect to the specific functions of the organismthat are related to the corresponding enzymes.
Urea biosynthesis enzymes will be used when-ever possible to illustrate questions that will beconsidered, since having worked with severalaspects of their regulation and functioning overthe past ten years, we are more familiar withthem. In addition, urea biosynthesis constitutesa very interesting model for gaining insight intothe nature of an adaptive device. Indeed, ureabiosynthesis allowed living organisms to adapt toterrestrial life, and urea cycle enzymes readilychange under conditions demanding increasedremoval of ammonia from body fluids (125).Ammonia is highly toxic for higher organisms,hence it must be kept at very low concentrationsin tissues and biological fluids. Animals livingin an aquatic environment can readily excreteammonia, but land animals had to develop othermechanisms to dispose of it, namely, ureotelismand uricotelism. Urea biosynthesis also operatesas an osmoregulatory device in some sea waterfishes (8). Interestingly enough, the ureotelicRana cancrivora that lives in the brackish watersof tropical mangrove in Southeast Asia had todevelop a kind of "superureotelism" in order tocope with the salinity of the environment (36).Urea cycle enzymes, as already stated, readilyrespond to the stimulus of starvation and changeproportionally to the protein content of the diet(108).
59

Are the changes in enzyme activities that occurin higher organisms adaptive?
By "adaptive" is understood those changesthat make sense in coping with altered environ-mental conditions able to produce metabolicdisturbances in the organism. For instance, thefeeding of the animal with a high-protein dietbrings about an increased protein and aminoacid catabolism. This situation, as already ex-plained, is accompanied by an increase in severalenzyme activities that participate in amino acidcatabolism, in gluconeogenesis, and in the con-version of ammonia into urea.
The "purpose," on the other hand, of in-creased lipogenesis observed in the refed animalafter a period of starvation is not very clear. Theaffected process, in fact, rebounds to such anextent that it causes liver lipid deposition, anobviously abnormal condition.
It might be argued that a change in enzymeactivity might be responsible for or is a conse-quence of a particular metabolic disturbance.One may wonder, for instance, what is the caseregarding the increase in glutamic oxaloaceticand glutamic pyruvic transaminases seen afterhigh-protein diet, starvation, alloxan diabetes,and administration of cortisone or adenocortico-trophic hormone (ACTH), conditions all char-acterized by enhanced gluconeogenesis, increasedprotein catabolism, and the elevated amino acidpool in the liver (56). It has been postulatedthat in each case elevated enzyme activitiesmight be the response to some primary changein a physiological state of the tissues, or rather,the cause of some of the secondary physiologicalchanges (56). Thus, according to Knox andGreengard (56), "The functional inter-related-ness between cause and effect may present aproblem; for example, does the increase in cer-tain enzymes cause the increased protein catab-olism, or does the increased catabolism causethe enzyme increases? Biologists generally re-frain from asking such questions because theanswer may involve them with the problem ofpurpose: that the final result can 'cause' theeffect. With our present familiarity with feed-
back mechanisms, this problem is no longer oneof metaphysics, but one of information transfer.Before we can even discuss the chemical mech-anisms of control, we must identify the systemswhich control."
It may also happen that a change in a givenenzyme activity is not related directly to thevariations introduced by a metabolic disturb-ance, but rather by a reflex of new metabolicevents taking place and thus could hardly becounted as a truly adaptive change since thevariation of activity is not directed to the preser-vation of homeostasis. Thus, serum alkalinephosphatase is an entity composed of isozymesoriginating from different sources: bone, liver,kidney, leukocytes, and placenta, the first twomaking the greatest contribution. They can bedistinguished by their different heat stability.It has been demonstrated that the decreasedserum alkaline phosphatase activity observed inchronic human protein malnutrition is at theexpense of the osteal enzyme and also that itis related to the cessation of growth, evidencedby X-ray diagnosis.
Enzymatic changes corresponding to meta-bolic adaptations should be reversible, that is tosay, once the environmental stimulus causingthe change has ceased, the original situation isrestored. Mechanistically, it could be said thatthe steady-state concentration of an enzyme canbe adjusted to the prevailing metabolic condi-tions, as already noted, by altering its rates ofsynthesis or degradation under the influence ofthe concentration of metabolic effectors.
Nevertheless, it might well be that at timesthe changes in enzyme activity are not of anadaptive nature but rather an expression of"damage" caused by faulty nutrition. Indeed,the methemoglobin reductase, glutathion reduc-tase and adenosine triphosphatase (ATPase) ofthe rat erythrocyte are affected by fasting theanimal and are not reestablished by refeeding,which is in accordance with the lack of biosyn-thetic capacity of these cells. Glucose-6-phos-phate dehydrogenase and acetyl cholinesterase
60

are not affected by the treatment mentioned(106, 107).
Is it necessary to change all activities involvedin a metabolic path to produce an increased out-put of the metabolic flux?
The functioning of a group of enzymes linkedin a metabolic path defines the steady-state con-centration of the metabolites being converted.It has been repeatedly said that enzyme activi-ties, by and large, are in excess in relation tothe existing concentrations of substrates, thatis to say, substrate concentrations are usuallywell below the K,, values of the enzymes trans-forming them (120). It would appear, then,that the enzyme machinery is apt to cope withloads of metabolites several times the concentra-tion found in the steady-state condition. In otherwords, the rate of conversion of metabolites ina metabolic path can be increased just by increas-ing the concentration of substrates. However,the rate would also be increased by elevating theenzyme activities whether or not these are farfrom being saturated. The fact remains thatthe latter type of response seems to be wide-spread, and thus it appears that higher orga-nisms favor handling their metabolites in a con-dition of "excess" of enzymes.
Siebert, Pfaender, and Kesselring (120) fol-lowed a kinetic approach to relate enzyme ratesto the flow of metabolites in metabolic paths.They reasoned that the extrapolation of the ratesof enzymes competing for a common substrate,as determined in vitro, would allow definingthe rates and flows of metabolites in branchingpoints of metabolic sequences. Their approachtook into consideration the expected velocity
corresponding to the sizes of the metabolic pools,the K. of each enzyme, and its intracellularlocation. They fully recognized that the predic-
tions that can be made necessarily introducedmany assumptions and met almost insurmount-able difficulties. Indeed, as previously stated, in
vitro assays cannot deal with factors inherentto the cell organization which undoubtedly in-
fluences enzyme activities. Among such factors
should be mentioned compartmentalization of
substrates, supramacromolecular structure, chan-neling, and others already considered, such as theeffective substrate, metabolic effectors and hydro-gen ion concentrations, that is to say, their con-
centration in the immediate surroundings ofthe functional sites at the enzyme surface. To
illustrate the point being discussed it may be
recalled that axolotl liver arginase is very un-stable when the tissue is homogenized, thereforea system containing citrulline, aspartate, adeno-sine triphosphate (ATP), Mg++, and liver ho-mogenate accumulates arginine, and no urea isformed if the homogenate is preincubated. How-ever in the presence of Mn++ and some otherdivalent cations, arginase is greatly preservedand urea is produced. Moreover, if the flow ofconversion of citrulline to urea is allowed, atleast some arginase keeps functioning, since ureais efficiently produced (84).
Another example of the importance of cellorganization is the metabolic fate of the guani-dino group of arginine in higher vertebrates.Figure 3 illustrates the situation. The amidinogroup is transferred and the same C-N bond issplit during the catalytic action of the two en-zymes. When arginase intervenes, water is theacceptor molecule and urea is formed; whenglycine transamidinase participates, glycine isthe acceptor molecule, and glycocyamine is pro-duced. In both cases ornithine is the product ofthe reaction. Although in many species the twoenzymes are present in different organs, humanliver contains both. In a free competition of thetwo enzymes by the common substrate arginine,glycine transamidinase would be at great dis-advantage because of the high arginase activityand the fact that ornithine is an inhibitor of theformer. Therefore, the only possibility for theircoexistence and functioning is compartmentaliza-tion so the competition cannot take place.
That changes in enzyme activities reallydetermine the metabolic flux can be substanti-ated by the variations in key enzymes involvedin the conversion of glucose to pyruvate and
61

H20 NH2-C -NHz
NH2 -C -NH -CH2 -CH 2 -CH 2-CH -COOH NH2 - CH 2-CH 2-CHi-CH -COOH
NH NH 2 NH2
o
NH£CH 2 -COOH CH2 -C -NHC H2-COOH
NH
Figure 3. Fate of the guanidino group of arginine: (1) denotes the activity ofarginase; (2) denotes the activity of glycine transamidinase.
vice versa. Glucokinase, phosphofructokinase,and pyruvic kinase activities push the flow inthe direction of glycolysis whereas pyruvic car-boxylase, phosphoenol pyruvic carboxylase, fruc-tose-1-6-diphosphatase, and glucose-6-phospha-tase determine gluconeogenesis.
The glycolytic flux is regulated through theactivity of three enzymes, the gluconeogenicflux by means of the activity of four enzymes.There are other enzymes (hexose isomerase,aldolase, triose isomerase, glyceraldehyde-3-phos-phate dehydrogenase, phosphoglycerate kinase,phosphoglyceromutase, and enolase) that do notchange the direction of the flux in either wayand usually are not affected by dietary or hor-monal influences that favor glycolysis or gluco-neogenesis.
However, in many other cases all enzymesinvolved in the metabolic path change under theinfluence of metabolic disturbances that claim agreater output of the metabolic flux. Such isthe case with the urea cycle enzymes when theanimal is fasted or fed with a high-protein diet.Therefore, the question that immediately arisesis whether the change in all enzymes was nec-essary or would it have sufficed to change theactivity of one of them to achieve the same in-crease in urea production.
To gain insight into this problem, it is perti-nent to recall the activities of the enzymes in-volved in the livers of different ureotelic species(Table 2).
It can be readily seen that while the activitiesof carbamyl phosphate synthetase, arginino suc-cinic synthetase, and arginino succinase are low,those of ornithine transcarbamylase and argi-nase are rather high. Moreover, it has beenrepeatedly stated that arginino succinic synthe-tase, having the lowest activity, constitutes thepacemaker of the urea biosynthesis path. Whatis the meaning of this statement? Again, it isdifficult to predict from in vitro enzyme assayshow the enzyme acts when it is a part of ahighly organized metabolic machinery. The factremains that the advent of ureotelism may cor-respond to an augmentation of all urea cycleenzymes (metamorphosis of the tadpole), toan increase in carbamyl phosphate synthetase(Xenopus laevis in hypertonic medium or dur-ing estivation), to an increase in arginino suc-cinic synthetase (birth of the rat), to an elevatedratio of glutamic oxaloacetic transaminase to glu-tamic pyruvic transaminase (estivation of thelung fish), or it may even occur without anyapparent change in the enzyme activities (meta-morphosis of the Mexican axolotl) (Table 3),
62

Tabla 2
Activities of the enzymes in the livers of ureotelic species
Carbamyl Ornithine Arginine-Common Binominal phosphate trans- synthetase Arginase
name name synthetase carbamylase system
Rat Rattus norvegicus 260 18000 72-0 56400275 21600 78'0 50400247 18000 72-0 46800
Mouse (Ajax Mus musculus 180 14500 66-0 79000DBA strain) 180 14500 67-0 76800
165 13000 60-0 68500Frog Rana montezumae 225 18000 90'0 80000
237 18000 90'0 96000211 9450 42'0 51000211 9450 42'0 51000
Semi-aquatic Pseudemys scriptae 140 7570 46-0 45600turtle 144 8100 43 0 60000
120 7500 43'0 5500095 6500 40 0 50000
Semi-aquatic Kinosternon hirtipes 133 8900 45-0 37800turtle 128 6850 35'0 38000
139 8750 - -124 7500 - -292 20200 90 57600
From Mora et al. (76).
Table 3
Enzyme activities
System Observations Reference
Earthworm during fasting Increase of incorporation of HCO-3 into urea. In- Bishop and Campbell (7)crease 2-4 fold in activity of the enzymes of the cycle.
Metamorphosis of Tadpole Natural and induced by thyroid hormones. Increase Cohen (22)of Rana catesbeiana 8-30 fold in activity of the enzymes of the cycle; de
novo synthesis demonstrated for CPS aXenopus laevis during Increase 6-fold in activity of CPS. Reversible. Balinsky et al. (4)
estivationXenopus laevis in hypertonic Increase 5-fold in activity of CPS. Reversible. Janssens and Cohen (41)
mediumMetamorphosis of the Induced by thyroid hormones. No increment in en- Soberón et al. (78)
Mexican axolotl zymes of the cycle.Coupling of Arginase? Decrease in NH3 diffusion?
Lung fish during estivation Synthesis of urea from HCO- a. Decrease in NH3 Janssens and Cohen (41)excretion. Increase 10-fold in the ratio GOT/GPT b
Birth of the rat Increase in the enzymes of the cycle, especially of Raiha and Suihkonen (69)arginino succinate synthetase. Depends on hormonalcontrol.
a CPS (carbamyl phosphate synthetase)b GOT (glutamic oxaloacetic transaminase)/GPT (glutamic pyruvic transaminase)From Soberón et al. (125).
63

(125). This situation suggests that the possibili-ties for the regulation of the enzyme cycle arerather versatile and different biological systemsmay utilize one or another. Furthermore, themetabolic flux can be directed by a change injust one of the enzymes of the metabolic path.
However, all urea cycle enzymes vary in rela-tion to the protein content of the diet. In addi-tion, a good correlation has been found betweenarginase activity and urea excreted (154).
Does this mean that the increase of arginaseactivity is required to augment the output ofthe cycle? Let us review some facts relevant tothe physiological role of arginase. A high ac-tivity is found in the liver of ureotelic animalswhich has led to the conclusion that there isan excess of arginase. When labeled citrullineis administered to a rat, kidney protein argininebecomes labeled, but not liver protein arginine;however, if labeled arginine is administered, itis incorporated into liver proteins (98). In thisrespect it should be recalled that the K, ofarginase and the arginyl RNA synthetase areof different orders of magnitude, 10-3M (37)and 10- 6M (1), respectively. It has recently beendemonstrated that liver arginase hydrolyzes pref-erentially endogenous arginine, the one origi-nating from citrulline and aspartic acid overthat artificially generated by the hydrolysis ofhippuryll-l-arginine (83). This evidence, to-gether with the low concentration of argininefound in the liver of ureotelic animals, has ledusto palat +that a -, paA ys ca.y inte-
grated with the arginine forming sites (125).Because it is possible to diminish the arginaseactivity to 2 per cent of the original, and stillarginine is converted efficiently to urea, it islikely that not all arginase molecules present inliver tissue are integrated with the arginineforming sites. A logical inference is that anincrease in the arginase molecule would not berequired for a greater output of urea. There-fore, we may reach the conclusion that thechange in arginase activity is rather a conse-quence of the action of a regulatory mechanismthat affects all urea cycle enzymes.
Is there a direct relation between enzyme activi-ties and output of the corresponding metabolicpath?
It has been said before that even though theenzyme activities are in excess in relation to thesubstrate concentrations, an increase in enzymeactivity will produce an augmentation of themetabolic flux where they participate. There isan increased rate of conversion of C'4 uracil toradioactive CO2 observed in a mutant of micecharacterized by the elevated activity of threeenzymes involved in pyrimidine metabolism(16). There is an increased lipogenesis andglycogen deposition in conditions where theactivities of the enzymes participating in thoseprocesses are elevated (158). The same maybe inferred from the work of Wergedal, Ku,and Harper (154), who found an elevatedtoxicity of amino acids administered to ratspreviously fed a high-protein diet for severaldays. The animals also had an elevated am-monia concentration in the blood. These find-ings were interpreted as indicative of anaugmented amino acid catabolism in due corres-pondence to an elevated activity of the interven-ing enzymes as assayed in vitro, which supportedthe concept that these increased activities repre-sent an adaptive response of physiological sig-nificance in vivo.
The relation between increased enzyme ac-tivity and function is not as clear in other cases.The administration of L-methyl tryptophan,which increased the activity of tryptophan pyrrol-ase produced a higher conversion of 2C14 L-tryptophan (ring-labeled) to radioactive CO 2(71, 160). However, the administration ofcortisone that also elevates the same enzymeactivity did not produce augmentation in theconversion of labeled side-chain tryptophan toradioactive CO2 in the perfused rat liver (52).In the latter study, greater velocity of conversionof labeled tyrosine to radioactive CO2, in spiteof the fact that the hormone administrationcauses an elevation of tyrosine transaminaseactivity, was also not observed (52). By thesame token there is evidence that glycogen depo-
64

sition is not related to the increased activity ofgluconeogenic enzymes (96).
The converse situation, namely, the effect onthe output of a metabolic path when the inter-vening enzymes have a diminished activity alsodeserves great attention. To gain insight intothe problem posed, a study was made on thecapacity of the urea cycle enzymes to clear invivo an ammonia load under various experi-mental conditions. First of all, it was necessaryto determine the distribution of the ammoniaload in the normal rat (99). It was found thatthe following sequence of events seemed to be
70
operative: initially, the ammonia was rapidlyremoved from the circulation by muscle uptake,then glutamine synthesis took place, mainly inliver and brain, and finally, urea synthesis tookover utilizing the ammonia gradually releasedfrom muscle, and from the enzymatic hydrolysisof glutamine. The results obtained are in ac-cordance with the findings of Duda and Handler(20), who followed the metabolic fate of N15
ammonia administered to the rat. The ureacycle enzymes, and glutamine synthetase, andglutamic dehydrogenase that were also studied,were decreased by dietary means (protein-free
CPS OTC AS Arg GD.t GS
Figure 4. The left side illustrates the ammonia uptake in animals starved for fourdays (1), fed a protein-free diet (<), and fed a diet that contained only zein as asource of protein (e). At zero time, 500 ,¿moles of ammonium chloride were admin-istered by injection into the porta. At the indicated times after injection, blood wasremoved from a hepatic vein for ammonia determination. Vertical bars representstandard error of the mean. The broken line indicates uptoke of ammonia by thenormal animal. The right side illustrates the enzyme activities in the liver of ratsstarved for four days (upper), fed with a protein-free diet (middle), and fed with adiet that contains zein as a source of protein (lower). The activities of the enzymesstudied represent relative values compared to the activities found in the normalanimal (taken as 100 per cent, and indicated by the gross horizontal line). Theresults are expressed as total activity (units for total liver). One unit of enzyme isdefined as the amount of enzyme that converts one micromole of substrate in oneminute under the conditions of each assay. Broken lines indicate values that wouldbe expected if the livers had the same weight as the normal ones. Vertical barsrepresent standard error of the mean corbamyl phosphate synthetase (CPS); ornithinetranscarbamylase (OTC); arginine synthetase (AS); arginase (ARG); glutamic dehydro-genase (GDH); glutamine synthetase (GS). From Flores et al. (30).
65

diet or zein-containing diet), by surgical re-moval of the liver and by the administration ofCCI4. It was found that only the rats treatedwith the hepatotoxic agent were hyperammo-nemic to begin with. The rats fed with deficientdiets or partially hepatectomized, although show-ing an impaired capacity to clear the ammoniaload in comparison to the normal controls, stillretained enough capacity to return the bloodammonia concentration to near normal values inabout 20 minutes. The rats treated with CC14had the lowest enzyme activities and could notclear the ammonia load (Figures 4, 5, and 6).
Interestingly enough, anoxic animals failedcompletely to clear the ammonia load, whichcould be explained by a drop of 90 per cent inthe ATP liver content. These results suggestthat a diminished enzyme activity could stillsuffice to cope with the main physiological taskof the path where they intervene-ammonia de-toxification in the case presented-and that onlywhen metabolic disturbances impose more stress-ing conditions upon them does the diminishedcapacity become apparent. The following factssupport this concept. It is possible to decrease
the activity of glucose-6-phosphatase even to20 per cent of the normal value without anyimpairment of its main function, namely, themaintenance of glycemia (144, 148, 149). Xan-thine oxidase can reach very low values by thefeeding of protein-deficient diets without anydiminution in the excretion of allantoin anduric acid (155). Even though the feeding ofa cooked dried egg to BHE rats caused a de-crease in hepatic glucose-6-phosphate dehydro-genase, the CO 2 production from the first car-bon of glucose was augmented. With respectto the last, the suggestion was made that theenzyme of other organs of the intact animalmight be responsible for the discrepancy (14).
In conclusion, the changes in enzyme activi-ties provoked by dietary means constitute oneaspect of the very complex problem of metabolicregulation in higher organisms-a field that isbeginning to be understood and awaits impor-tant contributions in the years to come. Withrespect to the physiological significance of suchchanges, the data now available permits specu-lation more than anything else.
cPS OTC
TOTALACTIVITY
ASAI~ HU
Figure 5. The left part represents the ammonia uptake in animals acutely («),and chronically (C) intoxicated with CCI 4. The right side represents the enzymeactivities in the same groups of animais. (Upper, acute intoxication; lower, chronicintoxication). See Figure 4 for other indications. From Flores et ol. (30).
66
AS Arg GDH GS

U
60
50
40
30
20
10
r-i~~~~-
,~-i I i-r-i C-M4 - r - --15 l1 15 20 CPS OTC AS Arg GDH G S
Figure 6. The left part represents the ammonia uptake of partially hepatectomizedanimals 12 ~(), 18 (0J), and 48 (0) hours after surgery. The right side representsthe enzyme activities found in the liver remnant after partial hepatectomy, 12 (upper),and 24 (lower) hours after surgery. See Figure 4 for other indications. From Floreset al. (30).
REFERENCES
1. ALLENDE, C. C., and J. E. ALLENDE. Purificationand substrate specificity of arginylribonucleic acidsynthetase from rat liver. ¡ Biol Chem 239: 1102-1106, 1964.
2. ANGIELSKI, S., and A. SzuTowIcz. Tissue con-tent of citrate and citrate cleavage enzyme activityduring starvation and refeeding. Nature 213: 1252-1253, 1967.
3. BERLIN, C. M., and R. T. SCHIMKE. Influence ofturnover rates on the responses of enzymes to corti-sone. Molec Pharmacol 1: 149-156, 1965.
4. BLACK, I. B., and J. AXELROD. Regulation of thedaily rhythm in tyrosine transaminase activity byenvironmental factors. Proc Nat Acad Sci USA 61:1287-1291, 1968.
5. BOYER, P. D., J. H. SHAW, and P. H. PHILLIPS.Studies on manganese deficiency in the rat. [ BiolChem 143: 417-425, 1942.
6. BRAUN, T., and P. FABRY. Adaptation to thepattern of food intake-changes in adipose tissue. Ad-vances Enzym Regulat 7: 49-55, 1969.
7. BROWN, G. W., W. R. BROWN, and P. P. COHEN.Comparative biochemistry of urea synthesis. 2. Lev-els of urea cycle enzymes in metamorphosing ranacatesbeiana tadpoles. 1 Biol Chem 234: 1775-1780,1959.
8. BROWN, G. W. JR., and P. P. COHEN. Compara-tive biochemistry of urea synthesis. 3. Levels of
urea-cycle enzymes in various higher and lower ver-tebrates. Biochem 1 75: 82-91, 1960.
9. BURCH, H. B., O. H. LOWRY, A. M. PADILLA,
and A. M. COMBS. Effects of riboflavin deficiencyand realimentation of flavin enzymes of tissues. ]Biol Chem 223: 29-45, 1956.
10. BURTON, D. N., J. M. COLLINS, A. L. KENNAN,
and J. W. PORTER. The effects of nutritional andhormonal factors on the fatty acid synthetase levelof rat liver. 1 Biol Chem 244: 4510-4516, 1969.
11. CAMUS, J., M. C. VANDERMEERS-PIRET, C.WODEN, and J. CHRISTOPHE. Activité de treize en-zymes du métabolisme intermédiaire, dans le foiedu jeune rat qui récupere d'une malnutritionprotidique. Europ 1 Biochem 11: 225-233, 1969.
12. CIVEN, M., C. B. BROWN, and B. M. TRIMMER.Regulation of arginine and ornithine metabolism atthe enzymatic level in rat liver and kidney. ArchBiochem 120: 352-358, 1967.
13. CHAKRABARTY, K., and G. A. LEVEILLE. In-fluence of periodicity of eating on the activity of va-rious enzymes in adipose tissue, liver and muscle ofthe rat. ¡ Nutr 96: 76-83, 1968.
14. CHANG, M. L. W., E. M. SCHUSTER, J. A. LEE,C. SNODGRASS, and D. A. BENTON. Effect of diet,dietary regimens and strain differences on someenzyme activities in rat tissues. 1 Nutr 96: 368-374,1968.
67
M N UTES
TOTAL ACTIVITY
1'~ ' :
1--l ~ ~ ~ ~ ~ ,--
mh riSi ' ri-id· i· ........
i l li l l I
· . . ..... 1
7nra
E
z 1n r
o'

15. CONNOR, J. B., and H. F. SASSON. Studies onthe induction of liver glucose-6-phosphate dehydro-genase in the rat. Advances Enzym Regulat 5: 93-106, 1967.
16. DAGG, C. P., D. L. COLEMAN, and G. M.FRASER. A gene affecting the rate of pyrimidinedegradation in mice. Genetics 49: 979-989, 1964.
17. DAKSHINAMURTI, K., and P. DESJARDINS. Lipo-genesis in biotin deficiency. Canad 1 Biochem 46:1261-1267, 1968.
18. DESAI, I. Regulation of lyososomal enzymes.1. Adaptive changes in enzyme activities during star-vation and refeeding. Canad 1 Biochem 47: 785-790,1969.
19. DIETRICH, L. S. Factors affecting the induc-tion of xanthine oxidase of mouse liver. J Biol Chem211: 79-85, 1954.
20. DUDA, G. D., and P. HANDLER. Kinetics of am-monia metabolism in vivo. J Biol Chem 232: 303-314, 1958.
21. EATON, R. P., and D. M. KIPNIS. Effect of glu-cose feeding on lipoprotein synthesis in the rat. Amer[ Physiol 217: 1153-1159, 1969.
22. EATON, R. P., and D. M. KIPNIS. Effects ofhigh carbohydrate diets on lipid and carbohydratemetabolism in the rat. Amer 1 Physiol 217: 1160-1168, 1969.
23. FALLON, H. J. Regulatory phenomena inmammalian serine metabolism. Advances EnzymRegulat 5: 107-120, 1967.
24. FALLON, H. J., J. L. DAVIS, and R. A. GOYER.Effect of protein intake on tissue amino acid levelsand the enzymes of serine biosynthesis in the rat. ]Nutr 96: 220-226, 1968.
25. FAss, S., and R. S. RIVLIN. Regulation of ribo-flavin-metabolizing enzymes in riboflavin deficiency.Amer 1 Physiol 217: 988-991, 1969.
26. FEIGELSON, P., and O. GREENGARD. Immuno-
chemical evidence for increased titers of liver tryp-tophnn pyrrnlase during substrate and hormonal en-
zyme induction. 1 Biol Chem 237: 3714-3717, 1963.27. FINCH, C. A., H. S. HUBERMAN, and A. E.
MIRSKY. Regulation of liver tyrosine aminotrans-ferase by endogenous factor in the mouse. 1 GenPhysiol 54: 675-689, 1969.
28. FINCH, C. E., J. R. FOSTER, and A. E. MIRSKY.Aging and the regulation of cell activities during ex-posure to cold. 1 Gen Physiol 54: 690-712, 1969.
29. FISHMAN, B., R. J. WURTMAN, and H. N.MUNRO. Daily rhythms in hepatic polysome profilesand tyrosine transaminase activity: Role of dietaryprotein. Proc Nat Acad Sci USA 64: 677-682, 1969.
30. FLORES, G., A. ROSADO, J. TORRES, and G.SOBERÓN. Liver enzyme activities in ammonia fixa-tion by the rat. Amer 1 Physiol 203: 43-48, 1962.
31. FREEDLAND, R. A. Effect of adrenalectomy and
hypophysectioning on responses of rat liver enzymesto high-protein diet. Canad 1 Biochem 46: 1253-1260, 1968.
32. FRITZ, P. J., E. S. VESELLE, and E. L. WHITE,et al. The roles of synthesis and degradation in de-termining tissue concentrations of lactate dehydro-genase-5. Proc Nat Acad Sci USA 62: 558-565, 1969.
33. FULLER, R. W., and H. D. SNODDY. Feedingschedule alteration of daily rhythm in tyrosine alpha-ketoglutarate transaminase of rat liver. Science 159:738-741, 1968.
34. GELLHORN, A., and W. BENJAMIN. Fatty acidbiosynthesis and RNA function in fasting, aging anddiabetes. Advances Enzym Regulat 4: 19-41, 1966.
35. GIBSON, O. M, S. E. HICKs, and D. W.ALLMAN. Adaptive enzyme formation during hyper-lipogenesis. Advances Enzym Regulat 4: 239-246,1966.
36. GORDON, M. S., K. SCHMIDT-NIELSEN, andH. M. KELLY. Osmotic regulation in the crab eatingfrog (Rana cancrivora). 1 Exp Biol 38: 659-678,1961.
37. GREENBERG, D. M., and H. HIRSCH-KOLB. Mole-cular characteristics of rat liver arginase. 1 BiolChem 243: 6123-6129, 1968.
38. GREENGARD, O. The role of coenzyme, corti-sone and RNA in the control of liver enzyme levels.Advances Enzym Regulat 1: 61-76, 1963.
39. GREENGARD, O. The regulation of apoenzymelevels by coenzymes and hormones. AdvancesEnzym Regulat 2: 277-288, 1964.
40. GROSSMAN, M. I., H. GREENGARD, and A. C.IvY. Effect of dietary composition on pancreatic en-zymes. Amer 1 Physiol 138: 676-682, 1943.
41. HEMON, P., and B. BERBEY. Changes of en-zyme activities with diet and thyroxin during post-natal development of the rat. Biochim Biophys Acta170: 235-243, 1968.
42. HINCHBERG, E., D. V. SNIDER, and M. OsNos.Effect of charlges in hormonal ard dietary status ofrats and mice on the activity of their liver glutamicdehydrogenases. Advances Enzym Regulat 2: 301-310, 1964.
43. HURWITZ, A. I., and R. A. FREEDLAND. Influ-ence of dietary protein on hydrocortisone mediatedadaptive enzymatic changes in rat liver. Arch Bio-chem 127: 548-555, 1968.
44. JosT, J. P., E. A. KHAIRALLAH, and H. C. PITOT.Studies on the induction and repression of enzymesin rat liver. 5. Regulation of the rate of synthesisand degradation of serine dehydratase by dietaryamino acids and glucose. J Biol Chem 243: 3057-3066, 1968.
45. JosT, J. P., A. HSIE, S. D. HUGIHES, and G.RYAN. 1 Biol Chem In press.
46. KATUNUMA, N., M. OKADA, and Y. NISHH.
68

Regulation of the urea cycle and TCA cycle by am-monia. Advances Enzym Regulat 4: 317-335, 1966.
47. KENNAN, A. L., and P. P. COHEN. Biochemicalstudies of the developing mammalian fetus. 1. Ureacycle enzymes. Develop Biol 1: 511-525, 1959.
48. KENNEY, F. T. Induction of tyrosine-ao-keto-glutarate transaminase in rat liver. 3. Immuno-chemical analysis. J Biol Chem 237: 1611-1614, 1962.
49. KENNEY, F. T. Induction of tyrosine-a-keto-glutarate transaminase in rat liver. 4. Evidence foran increase in the rate of enzyme synthesis. 1 BiolChem 237: 3495-3498, 1962.
50. KENNEY, F. T., J. R. REEL, C. B. HAGER, andJ. L. WITTLIFF. In A. San Pietro, M. R. Lamborg,and F. T. Kenney (eds.). In Regulatory Mechanismsfor Protein Synthesis in Mammalian Cells. NewYork, Academic Press, 1968, p. 119.
51. KIM, Y. S. The half-life of alanine aminotrans-ferase and of total soluble protein in livers of normaland glucocorticoid-treated rats. Molec Pharmacol 5:105-108, 1969.
52. KIM, J. H., and L. L. MILLER. The functionalsignificance of changes in activity of the enzymestryptophan pyrrolase and tyrosine transaminase afterinduction in intact rats and in the isolated perfusedrat liver. I Biol Chem 244: 1410-1416, 1969.
53. KNox, W. E. Substrate-type induction of tyro-sine transaminase illustrating a general adaptivemechanism in animals. Advances Enzym Regulat 2:311-318, 1964.
54. KNOX, W. E. The regulation of tryptophanpyrrolase activity by tryptophan. Advances EnzymRegulat 4: 287-297, 1966.
55. KNOX, W. E., V. H. AUERBACH, and E. C. C.LIN. Enzymatic and metabolic adaptations in ani-mals. Physiol Rev 36: 164-254, 1956.
56. KNOX, W. E., and O. GREENGARD. The regula-tion of some enzymes of nitrogen metabolism. Anintroduction to enzyme physiology. Advances En-zym Regulat 3: 247-313, 1965.
57. KNOX, W. E., and M. M. PIRAs. Tryptophanpyrrolase of liver. 3. Conjugation in vivo during co-factor induction by tryptophan analogues. 1 BiolChem 242: 2959-2965, 1967.
58. KORNACKER, M. S., and J. M. LOWENSTEIN.Citrate and the conversion of carbohydrate into fat.The activities of citrate cleavage enzyme and acetatethiokinase in livers of starved and refed rats. Bio-chem 1 94: 209-215, 1965.
59. KREBS, H. A., and L. V. EGGLESTON. The roleof pyruvate kinase in the regulation of gluconeogene-sis. Biochem / 94: 3c-4c, 1965.
60. KRISHNAIAH, R. V., and T. RAMASARMA. Regu-lation of hepatic cholesterolgenesis by ubiquinone.Biochim Biophys Acta 202: 332-342, 1970.
61. LEE, Y. P., and H. A. LARDY. Influence of thy-
roid hormones on L-glycerophosphate dehydrogen-ases and other dehydrogenases in various organs ofthe rat. 1 Biol Chem 240: 1427-1436, 1965.
62. LEVEILLE, G. A. In vivo fatty acid synthesis inadipose tissue and liver of meal-fed rats. Proc SocExp Biol Med 125: 85-89, 1967.
63. LEVEILLE, G. A., and K. CHAKRABARTY. Ab-sorption and utilization of glucose by meal-fed andnibbling rats. 1 Nutr 96: 69-75, 1968.
64. LEVEILLE, G. A., and K. CHAKRABARTY. Invivo and in vitro studies of gluconeogenesis in meal-fed and nibbling rats. 1 Nutr 96: 397-402, 1968.
65. LIN, E. C. C., R. S. RIVLIN, and W. E. KNOX.Effect of body weight and sex on activity of enzymesinvolved in amino acid metabolism. In press.
66. MAAS, W. K. Studies on repression of argininebiosynthesis in Escherichia coli. Sympos Quant Biol26: 183-191, 1961.
67. MA'AYANI, S., and R. G. KULKA. Amylaseprocarboxypeptidase and chymotypsinogen in pan-creas of chicks fed raw or heated soybean diet. 1Nutr 96: 363-367, 1968.
68. MACLEAN, P. Effect of ethionine treatment onthe activity on enzymes concerned with urea syn-thesis in rat liver. Biochem 1 99: 776-779, 1966.
69. MACLEAN, P., and F. NOVELO. Influence ofpancreatic hormones on enzymes concerned withurea synthesis in rat liver. Biochem 1 94: 410-422,1965.
70. MACLEAN, P., E. U. REID, and M. W. GURNEY.Effect of azodye carcinogenesis on enzymes con-cerned with urea synthesis in rat liver. Biochem 191: 469-473, 1964.
71. MADRAS, B. K., and T. L. SOURKES. Formationof respiratory 14 CO2 from variously labeled forms oftryptophan- 14C in intact and adrenalectomized rats.Arch Biochem 125: 829-836, 1968.
72. MAJERUS, P. W., and E. KILBURN. Acetyl co-enzyme A carboxylase. The roles of synthesis anddegradation in regulation of enzyme levels in ratliver. 1 Biol Chem 244: 6254-6259, 1969.
73. MANGONI, A., V. PENNETTI, and M. A. SPADONI.Aumento adattivo di xantinossidasi in topini alimen-tati con diete a diverso contenuto proteico. Boll SocItal Biol Sper 31: 1397-1399, 1955.
74. MARVER, H. S., D. P. TSCHUDY, M. G. PERLOTH,
and A. COLLINS. Coordinate synthesis of heme andapoenzyme in the formation of tryptophan pyrrolase.Science 154: 501-503, 1966.
75. MAVRIDES, C., and E. A. LANE. Analysis ofhormonal-dietary interactions and the role of gluco-neogenesis in the regulation of tyrosine amino trans-ferase in rats. Canad 1 Biochem 47: 1053-1061, 1969.
76. MORA, J., J. MARTUSCELLI, J. ORTIZ PINEDA, andG. SOBERÓN. The regulation of urea biosynthesis en-zymes in vertebrates. Biochem 1 96: 28-35, 1965.
69

77. MUNRO, H. N. General aspects of the regula-tion of protein metabolism by diet and by hormones.In H. N. Munro and J. B. Allison (eds.), Mamma-lian Protein Metabolism. New York, AcademicPress, 1964, pp. 381-481.
78. MUNRO, H. N. Role of amino acid supply inregulating ribosome function. Fed Proc 27: 1231-1237, 1968.
79. NICHOL, C. A., and F. ROSEN. Changes in ala-nine transaminase activity related to corticosteroidtreatment or capacity for growth. Advances EnzymRegulat 1: 341-361, 1963.
80. NIEMEYER, H. Regulation of glucose-phos-phorylating enzymes. Nat Cancer Inst Monogr 27:29-40, 1966.
81. OLSON, R. E., A. PHILIPPs, and N. WONG. Theregulatory action of Vitamin K. Advances EnzymRegulat 6: 213-225, 1968.
82. OLSON, X. E. Studies on the mode of actionof Vitamin K. Advances Enzym Regulat 4: 181-196, 1966.
83. PALACIOS, R., C. HUITRON, and G. SOBERÓN.Preferential hydrolysis of endogenous arginine byrat liver arginase. Biochem Biophys Res Comm 38:438-443, 1970.
84. PALACIOS, R., R. TARRAB, and G. SOBER6N.Studies on the advent of ureotelism. Factors thatrender the hepatic arginase of the Mexican axolotlable to hydrolyse endogenous arginine. Biochem ¡110: 425-433, 1968.
85. PERAINO, C. Interactions of diet and cortisonein the regulation of adaptive enzymes in rat liver. 1Biol Chem 242: 3860-3867, 1967.
86. PERAINO, C., C. LAMAR JR., and H. C. PrTOT.Studies on the mechanisms of carbohydrate repres-sion in rat liver. Advances Enzym Regulat 4: 199-217, 1966.
87. PESTAÑA, A. Dietary and hormonal control ofenzymes of amino acid catabolism in liver. Europ 1Biorhem !!: 400-44, 1969.
88. PITOT, H. C. The role of hormones in glucoserepression in rat liver. Advances Enzym Regulat 7:171-182, 1969.
89. PITOT, H. C., and C. PERAINO. Studies on theinduction and repression of enzymes in rat liver.1. Induction of threonine dehydrase and ornithinetransaminase by oral intubation of casein hydroly-sate. I Biol Chem 239: 1783-1788, 1964.
90. PITOT, H. C., C. PERAINO, N. PRIES, and A. L.KENNAN. Glucose repression and induction of en-zyme synthesis in rat liver. Advances Enzym Regu-lat 2: 237-247, 1964.
91. PITOT, H. C., C. PERAINO, N. PRIES, and A. L.KENNAN. Template stability in liver and hepatoma.Advances Enzym Regulat 3: 359-368, 1965.
92. POTTER, V. R., E. F. BARIL, M. WATANABE, and
E. D. WHITTE. Systematic oscillations in metabolicfunctions in liver from rats adapted to controlledfeeding schedule. Fed Proc 27: 1238-1245, 1968.
93. POTTER, V. R., R. S. GEBERT, and H. C. PITOT.Enzyme levels in rats adapted to 36-hour fasting.Advances Enzym Regulat 4: 247-265, 1966.
94. POTTER, V. R., and T. ONO. Enzyme patternsin rat liver and Morris Hepatoma 5123 during meta-bolic transitions. Cold Spring Harbor Symp QuantBiol 26: 355-362, 1961.
95. POTTER, V. R., M. WATANABE, J. E. BECKER,and H. C. PITOT. Hormonal effects on enzyme ac-tivities in tissue culture and in whole animals. Ad-vances Enzym Regulat 5: 303-316, 1967.
96. RAY, P. D., D. O. FOSTER, and A. LARDY. Modeof action of glucocorticoids. 1. Stimulation of glu-coneogenesis independent of synthesis de novo of en-zymes. 1 Biol Chem 239: 3396-3400, 1964.
97. RECHCIGL, M. JR. Studies on regulatory as-pects of nutrition at molecular level. 1. Enzyme turn-over during fasting. Arch Int Physiol 76: 693-706,1968.
98. ROGERS, Q. R., and R. A. FREEDLAND. Arginineand citrulline metabolism in rats fed low and highprotein diets. Fed Proc 27: 257, 1968.
99. ROSADO, A., G. FLORES, J. MORA, and G.SOBERÓN. Distribution of an ammonia load in thenormal rat. Amer 1 Physiol 203: 37-42, 1962.
100. ROSEN, F., and C. A. NICHOL. Studies on thenature and specificity of the induction of severaladaptive enzymes responsive to cortisol. AdvancesEnzym Regulat 2: 115-135, 1964.
101. ROSEN, F., N. ROBERTS, and C. A. NICHOL.Glucocorticosteroids and transaminase activity. 1. In-crease of glutamicpyruvic transaminase in four con-ditions associated with gluconeogenesis. 1 Biol Chem234: 476-480, 1959.
102. ROSENSWEIG, N. S., F. B. STIFEL, R. H. HER-MAN, and D. ZAKIM. The dietary regulation of theglycolitic enzymes. 2. Adaptive changes in humanjejunum. Biochim Biophys Acta 170: 228-234, 1968.
103. Ross, M. H. Aging nutrition and hepatic en-zyme activity patterns in the rat. 1 Nutr 97: 565-601, 1969 (Supplement 1, Part 2).
104. SALAS, M., E. V. VIÑUELA, and A. SOLs. In-sulin dependent synthesis of liver glucokinase in therat. 1 Biol Chem 238: 3535-3538, 1963.
105. SÁNCHEZ, E. S., G. SOBERÓN, P. PALACIOS, E.LEE, and G. KURI. Changes in effective enzymeconcentration in the growing rat liver. 2. Liver re-generation after partial hepatectomy. 1 Biol Chem236: 1607-1610, 1961.
106. SÁNCHEZ DE JIMÉNEZ, E., J. TORRES, V. E.VALLES, J. SOLIS, and G. SOBERÓN. Studies on theoxidation reduction systems of the erythrocyte. Bio-chem 1 97: 887-889, 1965.
70

107. SÁNCHEZ DE JIMÉNEZ, E., V. E. VALLES, M. P.LEÓN, and G. SOBERÓN. Active transport and en-zymes of the erythrocyte membrane under proteindeprivation. Biochem 1 97: 892-896, 1965.
108. SCHIMKE, R. T. Adaptive characteristics ofurea cycle enzymes in the rat. 1 Biol Chem 237: 459-468, 1962.
109. SCHIMKE, R. T. Differential effects of fastingand protein-free diets in levels of urea cycle enzymesin rat liver. 1 Biol Chem 237: 1921-1924, 1962.
110. SCHIMKE, R. T. Studies in factors affectingthe levels of urea cycle enzyme in rat liver. 1 BiolChem 238: 1012-1018, 1963.
111. SCHIMKE, R. T. The importance of both syn-thesis and degradation in the control of arginase lev-els in rat liver. 1 Biol Chem 239: 3808-3817, 1964.
112. SCHIIMKE, R. T., and D. DOYLE. Control ofenzyme levels in animal tissues. Ann Rev BiochemIn press.
113. SCHIMKE, R. T., E. W. SWEENEY, and C. M.
BERLIN. The roles of synthesis and degradation incontrol of rat liver tryptophan pyrrolase. 1 BiolChem 240: 322-331, 1965.
114. SCHIRMER, M. D. and A. E. HARPER. 1 BiolChem In press.
115. SEGAL, H. L., and Y. S. KIM. Environmentalcontrol of enzyme synthesis and degradation. 1 CellComp Physiol 66: (Suppl. 1) 11-22, 1965.
116. SEGAL, H. L., R. G. Rosso, S. HOPPER, andM. M. WEBER. Preliminary communications. Directevidence for an increase in enzyme level as the basisfor the glucocorticoid-induced increase in glutamic-alanine transaminase activity in rat liver. 1 BiolChem 237: PC 3303-3306, 1962.
117. SHARMA, C., R. MANJESHWAR, and S. WEIN-
HOUSE. Hormonal and dietary regulation of hepaticglucokinase. Advances Enzym Regulat 2: 189-200,1964.
118. SHAW, C., and L. C. FILLos. RNA poly-merase activities and other aspects of hepatic proteinsynthesis during early protein depletion in the rat. JNutr 96: 327-336, 1968.
119. SHIMAZU, T., and A. FUKUDA. Increased ac-tivities of glycogenolytic enzymes in liver after splan-chnic nerve stimulation. Science 150: 1607-1608,1965.
120. SIEBERT, G., P. PFAENDER, and K. KESSELRING.Competition of several enzymes for a common sub-strate, a possible model of cellular events. AdvancesEnzym Regulat 7: 131-148, 1969.
121. SILLERO, M. A. G., A. SILLERO, and A. SOLS.Enzymes involved in fructose metabolism in liver
and the glyceraldehyde metabolic crossroad. Europ
1 Biochem 10: 345-350, 1969.122. SILLERO, A., M. A. G. SILLERO, and A. SOLs.
Regulation of the level of key enzymes of glycolysis
and gluconeogenesis in liver. Europ 1 Biochem 10:351-354, 1969.
123. SIPERSTEIN, M. D. and V. M. FAGAN. Feed-back control of mevalonate synthesis by dietary cho-lesterol. 1 Biol Chem 241: 602-609, 1966.
124. SOBERÓN, G., and E. SÁNCHEZ Q. Changes ineffective enzyme concentration in the growing ratliver. 1. Effects of fasting followed by repletion. 1Biol Chem 236: 1602-1606, 1961.
125. SOBER6N, G., R. TARRAB, and R. PALACIOS.Urea biosynthesis. An experimental model for thestudy of the integration of a metabolic cycle duringbiological evolution. A review. Bol Estud Med Biol26: 15-33, 1969.
126. STAIB, R., R. THIENHAUS, U. AMMEDICK, andW. STAIB. Uber die Substrat-und Hormoninduktionder Tryptophan-Oxygenase in der isoliert perfun-dierten Rattenleber. Europ 1 Biochem 11: 213-217,1969.
127. STIFEL, F. B., N. S. ROSENSWEIG, D. ZAKIMand R. H. HERMAN. Dietary regulation of glycolyticenzymes. 1. Adaptive changes in rat jejunum. Bio-chim Biophys Acta 170: 221-227, 1968.
128. SUDA, M. A view of the comparison of theregulation of enzymes in mammalian and microbialsystems. Advances Enzym Regulat 5: 181-187, 1967.
129. SUTHERLAND, E. W., and T. W. RALL. Therelation of adenosine-3'-5'-phosphate and phosphory-lase to the actions of catecholamines and other hor-mones. Pharmacol Rev 12: 265-299, 1969.
130. SWICK, R. W., A. K. REXROTH, and J. L.STANGE. The metabolism of mitochondrial proteins.3. The dynamic state of rat liver mitochondria. 1Biol Chem 243: 3581-3587, 1968.
131. SYMES, A. C., T. L. SOURKES, M. B. H.YOUDIN, G. GROGORIADIS, and H. BIRNBAUM. De-creased monoamine oxidase activity in liver of iron-deficient rats. Canad 1 Biochem 47: 999-1002, 1969.
132. SZEPESI, B., and R. A. FREEDLAND. Dietary ef-fects on rat liver enzymes in meal-fed rat. 1 Nutr96: 382-390, 1968.
133. TANAKA, T., Y. HARANO, F. SUE, and H.MORIMURA. Crystallization, characterization and me-tabolic regulation of two types of pyruvate kinaseisolated from rat tissues. 1. Biochem (Tokyo) 62: 71-91, 1967.
134. TEPPERMAN, H. M., and J. TEPPERMAN. The
hexose monophosphate shunt and adaptive hyper-lipogenesis. Diabetes 7: 478-485, 1958.
135. TEPPERMAN, H. M., and J. TEPPERMAN. Roleof hormones in glucose-6-phosphate dehydrogenaseactivity of rat liver. Amer 1 Physiol 202: 401-406,1962.
.136. TEPPERMAN, H. M., and J. TEPPERMAN. Onthe response of hepatic glucose-6-phosphate dehydro-genase activity to changes in diet composition and
71

food intake pattern. Advances Enzym Regulat 1:121-136, 1963.
137. TEPPERMAN, J., and H. M. TEPPERMAN. Ef-fects of antecedent food intake pattern on hepaticlipogenesis. Amer 1 Physiol 193: 55-64, 1958.
138. TOMKINS, G. M., T. D. GELEHRTER, D. GRAN-NER, D. MARLIN JR., H. H. SAMUELS, and E. B.THOMPSON. Control of specific gene expression inhigher organisms. Science 166: 1474-1480, 1969.
139. VILLAR PALASI, C., and J. LARNER. Insulintreatment and increased UDPG-glycogen transglu-cosylase activity in muscle. Arch Biochem 94: 436-442, 1961.
140. WAINIO, W. W., J. B. ALLISON, L. T. KREMZ-NER, E. BERNSTEIN, and M. ARONOFF. Enzymes inprotein depletion. 3. Enzymes of brain, kidney, ske-letal muscle and spleen. ¡ Nutr 67: 197-204, 1959.
141. WALDORF, M. A., M. C. KIRK, H. LINKSWILER,and A. E. HARPER. Metabolic adaptations in higheranimals. 7. Responses of glutamate-oxaloacetate andglutamate pyruvate transaminases to diet. Proc SocExp Biol Med 112: 764-768, 1963.
142. WALKER, J. B. End-product repression in thecreatine pathway of the developing chick embryo.Advances Enzym Regulat 1: 151-168, 1963.
143. WATANABE, M., V. R. POTTER, and H. C.PITOT. Systematic oscillations in tyrosine transami-nase and other metabolic functions in liver of nor-mal and adrenalectomized rats on controlled feedingschedules. 1 Nutr 95: 207-227, 1968.
144. WEBER, G. Pathology of glucose-6-phosphatemetabolism. A study in enzyme pathology. RevCanad Biol 18: 245-282, 1959.
145. WEBER, G. Behavior and regulation of en-zyme systems in normal liver and in hepatomas ofdifferent growth rates. Advances Enzym Regulat 1:321-340, 1963.
146. WEBER, G. Study and evaluation of regula-tion of enzyme activity and synthesis in mammalianliver. Advances Enzym Regulat 1: 1-35, 1963.
147. WEBER, G. Regulation of pyruvate kinase.Advance Enzym Regulat 7: 15-40, 1969.
148. WEBER, G., and A. CANTERO. Studies on hor-monal factors influencing hepatic glucose-6-phos-phate. Endocrinology 61: 701-712, 1957.
149. WEBER, G., and A. CANTERO. Fructose-1-6-diphosphatase and lactic dehydrogenase activity inhepatoma and in control human and animal tissues.Cancer Res 19: 763-768, 1959.
150. WEBER, G., M. A. LEA, and N. B. STAMM. Se-quential feedback inhibition and regulation of livercarbohydrate metabolism through control of enzymeactivity. Advances Enzym Regulat 6: 101-123, 1968.
151. WEBER, G., R. L. SINGHAL, and S. K. SRIVAS-TAVA. Action of glucocorticoid as inducer and insulinas suppressor of biosynthesis of hepatic gluconeo-genic enzymes. Advances Enzym Regulat 3: 43-75,1965.
152. WEBER, G., R. L. SINGHAL, N. B. STAMM,E. A. FISHER, and M. A. MENTENDIEK. Regulationof enzymes involved in gluconeogenesis. AdvancesEnzym Regulat 2: 1-38, 1964.
153. WEBER, G., R. L. SINGHAL, N. B. STAMM,M. A. LEA, and E. A. FISHER. Synchronous behaviorpattern of key glycolytic enzymes, glucokinase, phos-phofructokinase and pyruvate kinase. AdvancesEnzym Regulat 4: 59-81, 1966.
154. WERGEDAL, J. E., Y. Ku, and A. E. HARPER.Influence of protein intake on the catabolism ofammonia and glycine in vivo. Advances EnzymRegulat 2: 289-299, 1964.
155. WESTERFELD, W. W., and D. A. RICHERT.The xanthine oxidase factor (molybdenum). AnnNY Acad Sci 57: 896-904, 1954.
156. WHEREAT, A. F., and M. W. DRISHIMO.Effects of fasting and diabetes on fatty acid synthesisby heart mitochondria. Amer 1 Physiol 217: 998-1003, 1969.
157. WICKS, W. D. Induction of hepatic enzymesby adenosine 3'-5'-monophosphate in organ culture.¡ Biol Chem 244: 3941-3950, 1969.
158. WILEY, J. H., and G. A. LEVEILLE. Influenceof periodicity of eating on the activity of adiposetissue and muscle glycogen synthesizing enzymes inthe rat. 1 Nutr 100: 85-93, 1970.
159. WURTMAN, R. J. Time-dependent variationsin amino acid metabolism: Mechanism of the tyro-sine transaminase rhythms in rat liver. AdvancesEnzym Regulat 7: 57-67, 1969.
160. YAMAGUCHI, K., M. SHIMAYAMA, and R. K.GHOLSON. Measurements of tryptophan pyrrolasein vivo: Induction and feedback inhibition. Bio-chim Biophys Acta 146: 102-110, 1967.
161. YOSHIDA, A., G. STAMATOYANNOPOULOS, and
A. G. MOTULSKY. Negro variant of glucose-6-phos-phate dehydrogenase deficiency (A-) in man.Science 155: 97-99, 1967.
72
4

DISCUSSION
Potter: I was very much interested in the firstquestion raised by Dr. Soberón. Are the changesin enzyme activities which occur in higher or-ganisms of an adaptive nature? From a philo-sophical standpoint, as well as from a physio-logical standpoint, we could answer that ques-tion by saying, "it makes adaptive sense if theorganism is in the environment in which thespecies evolved to its present state." A greatmany responses are occurring under conditionsin which the species never found itself duringits evolution, and if we interpret the non-adaptive responses in those terms, they beginto be understandable. In other words, shouldthe individual member of the species be in asituation which is totally abnormal or strange-one in which the species didn't evolve-thensome response which is detrimental to the ani-mal might occur.
Soberón: I agree with the position taken byDr. Potter. However, it is difficult to interpretall changes occurring under the stress of varia-tions in the environment in terms of homeostaticadjustments. There are some cases wherechanges do occur without it being possible tocorrelate them with the activity of the enzymethat is changing.
Chairman Cohen: I think Dr. Potter raiseda very important point and one might ask thequestion whether man, who has become adaptedto a relatively constant environment over a pe-riod of 100,000 years, or so, is now faced withthe dilemma that his environment is changingfar too rapidly for him to be able to adapt to it.
Harper: It seems clear, as Dr. Soberón pointedout, that for many, perhaps even most of theenzymes in tissues, the activities are considerablyhigher than the organism ordinarily needs tohandle its metabolic load.
In any adequately functioning system, it is
important to have a capacity well beyond whatthe normal load is in order to contend withunexpected emergencies, and one can look atthe influx of individual meals as such emergen-cies. Many animals eat once a day, twice a day,or three times a day, so there can be large in-fluxes in relatively short periods of time whenextra enzymes may be beneficial. Many of theadaptations that we measure would seem torepresent mainly an increase in the safety factoras we approach conditions in which the ca-pacity of the system is in danger of being ex-ceeded. The animal can handle a large loadwithout adaptation, but after adaptation, thetotal capacity of the system has so increased thatan emergency load that would have exceededthe capacity of the original system can now behandled.
Chairman Cohen: What has been emphasizedis that there are regulatory factors, not only interms of what Dr. Potter alluded to earlier, suchas the access of nutrients into a particular cellby transport mechanisms, but also the hormonalfactors Dr. Niemeyer, in particular, stressed andwhich Dr. Monckeberg will later talk about inrelation to a more complex situation. While therate-limiting factor properly focuses on the cata-lytic capacity of enzymes, the other regulatoryfactors that the cell and the organism utilize,relating to flux rates of metabolites into cells,have fixed limits which must be of importancein defining the limits of adaptation.
The factors that determine the rates at whichcertain nutrients will become available, the ratesat which they will be transported, and the ratesat which they will be metabolized, need morequantitative investigation.
Potter: 1 am particularly interested in thedata by Dr. Niemeyer as it relates to our ownwork. Dr. Waterlow earlier this morning made
73

reference to the small amount of fuel reservesrepresented by the glycogen store. I suggest thatthe young growing animal does not have verymuch margin in his enzyme capacity or in hisfat reserves. We have studied the size of thefat pads in the young growing animal, and wehave studied what happens when you changethe feeding pattern from daily food intake tothe 8+40 regimen. What happens to theseyoung growing animals that have never fastedbefore? The fact is that they burn themselvesout. They kill themselves running if they haveaccess to an exercise cage. They die with a totaldepletion of all of their fat pads because theysimply do not have the capacity to store enoughfat to get them through a 40-hour period offasting. As they get just a little bit older, how-ever, they can develop that capacity.
Now what is very important in the ability todevelop the capacity to store fat? It is glucose-6-phosphate dehydrogenase, among other things,because this is an enzyme that generates reducedtriphosphopyridine nucleotide (TPN) which isneeded for fat synthesis.
We have shown that the animals adapted tothe experience of fasting function with aboutsix times as much glucose-6-phosphate dehydro-genase as the non-adapted animal, so that, inaddition to the enzyme patterns that Dr. Nie-meyer sees with changing ratios of protein,carbohydrate, and fat, we see tremendous varia-tions in the levels of enzymes simply with thesame diet, but under situations where carbohy-drate storage doesn't solve the problem. Theyhave to have fat storage.
49
74

OPENING STATEMENT-Afternoon
John C. Waterlow, Chairman
Dietary and hematological surveys are a necessary part of any publichealth program. Their aim is to detect groups or individuals who maybe classified as "deficient" or "anemic." Today, more and more relianceis being placed on biochemical and hematological measurements to pro-vide evidence of marginal or subclinical states of deficiency. The after-noon meeting is concerned with the general problem of how suchmeasurements should be interpreted. Does the concept of subclinicaldeficiency have any meaning? If many biochemical fúnctions showadaptive changes, how can one define the range of adaptation com-patible with normal function? Are there any logical criteria for dis-tinguishing between normal and abnormal? These are questions offundamental importance for preventive medicine, where we are dealingnot with the sick, but with the potentially sick. The papers in theafternoon session will be directed towards this general problem, dis-cussing it from different aspects, and with examples from differentfields of study.
75

THE CONCEPT OF "NORMAL" IN NUTRITION
John C. Waterlow
The word "adaptation" presupposes thatpeople may be exposed to different situations,stresses, or environmental factors. Obviouslythere would be no question of adaptation if theconditions of life were identical for everyoneand never varied. Adaptation, then, means thepreservation of normal bodily function in theface of these differences. Although this definitiontells us nothing that was not said long ago byClaude Bernard, Walter Cannon, or L. J. Hen-derson, it serves to bring out the first point Iwish to make: the concept of adaptation andthe concept of normal levels are two aspects ofthe same thing. The problem, then, is to definethe range for any parameter within which adap-tation has occurred and beyond which it hasbroken down. This is not a new problem, butit becomes increasingly important as medicineceases to be preoccupied mainly with the cureof disease and is concerned more and more withthe maintenance of health. We study the nor-mal ranges of various systems in order to detectimpending disease. It is a classical approach inhematology and in nutrition to try to identifyby chemical measurements individuals or groupswho are risks because they fall outside the so-called "range" of normal.
There seem to be four ways of approachingthis problem of defining normal ranges or rangesof adaptation.
The statistical approach
This is the method comtmonly used in clinicalchemistry. Measurements are made on a large
group of apparently healthy people, and thenormal range is taken as the mean -+2 standarddeviations (6). The solution, however, is notas simple as this. Figure 1 shows the distribu-tion of hematocrit in healthy women. Garbyand Killander (3), from whose paper this figureis taken, comment as follows on this distributioncurve: "The data can answer the question ofthe probability of observing a hematocrit valueof a given magnitude, provided that we have ahealthy female individual .... It is important
o Oo o
/ 0
o/ \0´o o\n
32 3/4 36 38 40 42 44 46 PCV
Figure 1. Distribution of packed cell volume (PCV) inhealthy women from the combined data of Wintrobe,Scott, and Pritchard. From Garby and Killander (3) bypermission of Almqvist and Wiksells, Uppsala.
76
1
,W

to note, however, that this is not the questionthat we want to ask. The question that we wantto ask is completely different: namely, Whatis the probability that a given hematocrit valueis optimal given a randomly chosen female indi-vidual? This information is not contained inthe data." For instance, a woman whose nor-mal hematocrit was 43 per cent might reason-ably be regarded as anemic if it fell to 37 percent, yet this value is well within the range of95 per cent of the observations.
This figure was chosen for another reason-its symmetry. It represents a statistically "nor-mal" distribution. Here we are using the sameword in two quite different senses-statisticallynormal and biologically normal. This causesgreat confusion, which can be avoided by usingthe proper term "Gaussian" for a distributionof the kind shown in Figure 1. There is atendency to think that in a healthy group ofpeople all parameters should have a "normal"distribution. This is quite fallacious. An excel-lent example of a highly skewed distribution ina clinically normal group is given by Cook,Layrisse, and Finch (1) in their paper on ironabsorption (Figure 2).
This kind of situation greatly increases thedifficulty of interpreting a group of results, sincea mathematical transformation as proposed byCook and co-workers may not always meet thecase. A practical example of such a difficulty isshown in Figure 3. This represents the distribu-tion of values for serum alkaline phosphatasein children in day nurseries in London (8). Atfirst sight this looks like a Gaussian distributionwith a tail of "abnormal" values to the right.In fact, however, one cannot say on statisticalgrounds alone that these results do not all comefrom the same population. If one were to acceptthe commonly used standard that a value forserum alkaline phosphatase of more than 25units is biochemical evidence of rickets, dearlya substantial proportion of children would be atrisk. In fact, however, they were all receivingsupplementary vitamin D. The only way inwhich one can find out the meaning of the high
60-
40-
20-
30-
20-
o10.
O0o·
20 4b 60 8s0 100
0 20 40 60 80 100Iron obsorption !% of dose)
Figure 2. Frequency distribution of iron absorption, ex-pressed as per cent of administered dose. The upper figurerelates to Swedish subjects, the lower to subjects inCaracas, Venezuela. From Cook, Layrisse, and Finch (1)by permission of the Editors of Blood.
values is by further biological measurements, forexample, by determining whether or not theyrepresent bone phosphatase.
Another example of the pitfalls in interpretingdistribution curves is shown in Figure 4, taken
zu
-J
uU.o
u
z
J00
.200
o00
oy
u c m N «) s 1 4 O
KING-ARMSTRONG UNITS 1969
Figure 3. Distribution of plasma alkaline phosphatase in583 children in day nurseries in Britain. From Stephen andStephenson (8).
77
1

80 100 120 140 160 180 200 220 240 260Red celt acid phosphcitrse cctivity
Figure 4. Distribution of red cell acid phosphataseactivities in the general population (top line) and in theseparate phenotypes. Phosphatase activity expressed in,amoles p-nitrophenol liberated per gm hemoglobin in 30minutes at 370C. From Harris et al. (4), by permission ofGrune and Stratton.
from Harris et al. (4). Here an apparentlyGaussian distribution of red cell acid phospha-tase is in fact the sum of the distributions of fivedifferent phenotypes.
Statistical methods, therefore, describe therange of variation between individuals, and theprobability that groups belong or do not belongto the same population, but they cannot providevalue judgments of what is normal or abnormal.This is an elementary fact, which I think isoften overlooked for the simple reason that weare often biased in our approach to these mat-ters. As L. J. Henderson emphasized, adapta-tion is relative. It is natural to take the posi-tion that I am normal, and that you, if youare different, are at best "adapted,". at worst"abnormal."
Associations and long-term consequences
This is essentially the approach of the clini-cian, who knows by long experience that acertain level of blood sugar indicates impendingdiabetes, or a certain level of blood pressure,impending hypertensive disease. When in nu-trition we use a biochemical measurement, forexample, of serum vitamin A or alkaline phos-phatase, to indicate so-called subclinical disease,two things may be implied. The first is that, ifthe same conditions continue, the subjects will
become clinically ill. This can only be provedby long-term studies, such as those made by theBritish Medical Research Council during WorldWar II on volunteers receiving very low intakesof vitamins A or C. I am not aware of anystudies of this kind on people under natural con-ditions. 1 do not know whether it has ever beenshown that a person whose serum vitamin Aconcentration puts him in the category of defi-cient by accepted standards will, in fact, if un-treated, develop signs of avitaminosis A. Dr.Arroyave will deal with this topic in more detail.
The other implication is that a person who isgraded biochemically as being deficient may bein a steady state in which he is not obviouslyill but is functioning in a suboptimal way. Hemay be so near the margin that the slighteststress will precipitate him into illness. These, itseems to me, are the only possible meanings ofthe unfortunate term "subclinical deficiency."
Measurements of function and performance
If an adaptation means a response whichmaintains normal function, the best test ofadaptation is through appropriate measurementsof function or performance.
Since anemia is considered to be one of themost widespread deficiency diseases, I havechosen an example from this field, which willbe covered in more detail by Dr. Waters. Theexample comes from the work of Elwood andhis colleagues (2), who have surveyed the hemo-globin concentrations of a large population ofwomen in South Wales. In a recent paper,Elwood and co-workers report that women withHb concentrations of less than 10.5 gm/100 mlhad significantly lower blood cholesterol levelsthan those with Hb of more than 10.5 gm/100ml. They go on to say: "It is therefore difficultto escape the conclusion that mild anaemia hasa beneficial effect. .... Furthermore, to the pos-sible benefit of a lower serum-cholesterol inanaemia should be added the protective effect ofthe greatly increased number of anastomoses inthe coronary circulation which has been demon-strated in anaemic subjects and may have devel-
78
1
4
/

oped because of anaemia. On the other handthere is remarkably little evidence that levels ofcirculating Hb down to about 8 gm/100 ml areassociated with any harmful effects, or thattreatment with iron has any beneficial effect onmorbidity or on function."
It may well be, therefore, that a reduction inHb concentration is a beneficent adaptation tothe sedentary conditions of modern existence,in which there is no great demand on the oxy-gen transport mechanism. Could one speculatefurther and suppose that women are less liablethan men to cardiovascular disease because theyhave on the average lower hemoglobin concen-trations than men?
Analysis of the physiological and biochemicalmechanisms of adaptation
I believe that in the long run the best wayto define the limits of an adaptive process isthrough a better understanding of its mechan-ism. It is this approach that brings together thetwo parts of our symposium.
The classical example of the practical valueof a physiological analysis is provided by dis-turbances of acid-base and electrolyte balance.Our ideas of what is "normal" rest on an under-standing of the homeostatic mechanisms derivedfrom the work of L. J. Henderson, Gamble,Darrow, and others. These ideas are put to thepractical test in the treatment of patients.
In going back to the teachings of ClaudeBernard, it must be recognized that in an adap-tive process, there are some functions that arefixed within narrow limits and others that areallowed to vary rather widely. It is importantfor understanding the mechanisms of adapta-tion to identify and distinguish functions ac-cording to their range of variation. Figure 5 isan example from a paper published several yearsago by Dr. Hoffenberg and his colleagues (5).It shows a linear relation between the serumalbumin level and the catabolic rate of serumalbumin in healthy subjects fed low-proteindiets. The point it brings out is that albuminconcentration is relatively fixed; when it falls
g4
y-5.0£X*20B
2
o aas0 0./Oarnoeirr¿zFr g/kg/day
0/5 0200, /5 0.20
Figure 5. Albumin turnover rate plotted against plasmaalbumin concentration in healthy adults on diets ofvarying protein content. From Hoffenberg et al. (5), bypermission of Springer Verlag, Berlin.
by 25 per cent, the catabolic rate is reduced by75 per cent. It is reasonable to conclude, asHoffenberg and all others who work on thissubject have done, that a change in catabolicrate is an adaptation to low-protein intakeswhich helps to maintain a constant albuminconcentration.
A priori, it seems likely that a function that isclosely fixed under a variety of conditions mustbe physiologically important. Table 1 showsanother example from the field of protein me-tabolism-the total rate of protein synthesis ininfants at different levels of protein intake (7).It would be reasonable to conclude that the over-all rate of protein synthesis is a function thatmust operate at a certain level, and that adap-tive mechanisms come into play to maintainthis level. The next step in considering thebody's reaction to changes in protein intake is
Table 1
Rates of protein synthesis and catabolism in infantsat different levels of protein intake, measured by intra-
gastric infusion of 1'N-glycinea
High Lowprotein protein
No. of infants 6 5Taken in (gm protein/kg/day) 5.2 1.2Synthesized (gm protein/kg/day) 6.5 6.2Catabolized (gm protein/kg/day) 4.2 5.5Fraction of 15N excreted 24.3% 3.4%
a From Picou and Taylor-Roberts (7).
79
-

to identify the mechanisms of homeostasis. Ihave considered this problem in more detailelsewhere (9).
To summarize, the concept of adaptation andthe concept of a normal range of variation aretwo aspects of the same thing. A statistical ap-proach is essential for describing and summariz-
ing data and for establishing differences betweengroups, but "normal" and "abnormal" can onlybe distinguished by biological methods. These,I suggest, are of three kinds: long-term experi-ence of consequences; functional tests; andanalysis of the basic mechanisms of any adap-tive process.
REFERENCES
1. CooK, J. D., M. LAYRISSE, and C. A. FINCH.The measurement of iron absorption. Blood 33:421-429, 1969.
2. ELWOOD, P. C., R. MAHLER, P. SWEETNAM, F.MOORE, and E. WELSBY. Association between circu-lating haemoglobin level, serum-cholesterol andblood-pressure. Lancet 1: 589-590, 1970.
3. GARBY, L., and A. KILLANDER. Definition ofanaemia. In G. Blix (ed.), Occurrence, Causes andPrevention of Nutritional Anaemias, Uppsala, Alm-qvist & Wiksells, 1968, pp. 9-18.
4. HARRIS, H., D. A. HOPIINSON, J. E. LUFFMAN,and S. RAPLEY. Electrophoretic variation in eryth-rocyte enzymes. In E. Beutler (ed.), HereditaryDisorders of Erythrocyte Metabolism. New York,Grune & Stratton, 1968, pp. 1-20.
5. HOFFENBERG, R., S. SAUNDERS, G. C. LINDER,E. BLACK, and J. F. BROCK. I131 albumin metabo-
lism in human adults after experimental proteindepletion and repletion. In F. Gross (ed.), ProteinMetabolism: Influence of Growth, Hormone, Ana-bolic Steroids and Nutrition in Health and Disease.Berlin, Springer-Verlag, 1962, pp. 314-325.
6. O'KELL, R. T., and J. R. ELLIOT. Developmentof normal values for use in multitest biochemicalscreening of sera. Clin Chem 16: 161-165, 1970.
7. Plcou, D., and T. TAYLOR-ROBERTS. The mea-surement of total protein synthesis and catabolismand nitrogen turnover in infants in different nutri-tional states and receiving different amounts ofdietary protein. Clin Sci 36: 283-296, 1969.
8. STEPHEN, J. M. L., and P. STEPHENSON. To bepublished.
9. WATERLOW, J. C. Observations on the mecha-nism of adaptation to low protein intakes. Lancet2: 1091-1097, 1968.
a
80
a

DISCUSSION
Hilleboe: Dr. Waterlow, you said the statisti-cal approach leaves much to be desired, yet youused it throughout your discussion. Is this notinconsistent? I should like to point out, and Ispeak as an epidemiologist, that in making astatistical comparison, two critical points mustalways be considered-one, time, and the other,place. Therefore, the fact that there are differ-ences in a frequency distribution in May as com-pared to November, does not decrease the sig-nificance of the variations at a particular time.Furthermore, the fact that the cholesterol levelsin the United States are quite different fromthose in the Netherlands does not mean that
statistically they are not sound within the con-text of each place. Consequently, unless a better
substitute for statistical analysis than statisticalanalysis itself is found, I cannot accept the pre-mise that it is not a good approach. Indeed,
statistics are indispensable for describing fre-quency distributions, for describing variations,and, particularly, for describing the role ofchance in some of the various relationships inhuman physiology and medicine. If one is to
develop valid statistical associations, one needs
to use the statistical method as epidemiologists
do in their critical evaluations of quantitativemeasurements. If one could not use quantita-
tive methods in applying molecular biology to
nutrition and other factors in human ecology,we would have to stop doing research.
From the standpoint of administration, I must
always consider what I am going to do-in
terms of application-with the facts or newinformation that researchers give me. Unless I
can see some use for the output, I do not see
any benefit toward the improvement or main-
tenance of the health of the people. Standards
must be used, no matter how arbitrary or crude
they may be. It is a little bit like our procedure
for planning, programming, and budgeting.We use statistical standards to give administra-tors some data upon which to base a decision orsolve a problem. Both descriptive and analyticalstatistics are essential in planning and executinghealth programs. Give us indices of health withvarying ranges, under varying conditions, es-pecially time and place, and we then will deter-mine levels of plausibility in the use of theseindices in health programs. Health administra-tors are interpreters as well as implementers.
Chairman Waterlow: I certainly do not denythe value of statistics for many reasons, andespecially the two you mentioned. First, theydescribe a population, and this description weneed. Secondly, they help us to establish associa-tions. However, the point 1 was trying to makewas that a description of populations does nothelp to identify one or another as being "nor-
mal" or "abnormal." When you said you wouldgive the statistics to the administrator and lethim make of them what he may, I would give
you my example of the alkaline phosphatasemeasurements. No administrator can answer
the question, "What really does this mean?"
Only the biologist can answer that question. We
had to have these figures, but figures alone do
not answer the question. I hope I get my mes-
sage across. I do not deny at all what you say.
Potter: In listing your four approaches, I
wondered why you did not mention a fifth ap-proach, which would be a linear time record of
the individual. By correlating that record withfunctional tests, and thereby knowing what the
individual's record shows when he is healthy,
one would have more information when he is
ill. This linear record of the individual would
contribute to functional tests and physiologicalmechanisms as well. This would be particularlyhelpful, not only for measuring a single factor,
81

such as alkaline phosphatase, but several factors,to see which parameters were correlated.
Chairman Waterlow: I really meant to in-clude those factors under the heading "associa-tions and long-term consequences." I entirelyagree that it should be combined with functionalmeasurements.
Arroyave: I would like to support Dr.Hilleboe's words. When a statement about thecharacteristics of a population is made-onnutritional status, for example-a statement ofprobability is being made. That is statistical.We cannot get away from it. Moreover, whena physician, who is more apt to look at the in-dividual case, makes a statement about the char-acteristics of a patient, he is also making a state-ment of probability on the basis of knowledgeacquired through examination, no matter whator how many parameters he uses. Presumably,he does this with a certain degree of uncertainty,or probability of being wrong. We must re-member, furthermore, that even the subject that
we are characterizing is in itself a population-a population of cells.
Neel: In the unaccustomed role of peace-maker, 1 would take a position somewhat inter-mediate between the two that have been ex-pressed.
Yes, statistics are useful in providing descrip-tions of populations, but the slide which Dr.Potter showed is extremely important. I believethe slide had reference to dissecting a populationcurve of acid phosphate levels into subcurves,based on the different genetic types. With onegenotype for this system, one will be in thelow end of that descriptive curve based on thepopulation no matter what one eats or how onesleeps, but with another set of alleles, one will bein the upper end and nothing can change that.
Statistics improperly used can conceal theheterogeneity, which it is important to under-stand, if we are going to understand popula-tions.
4
82
1
4

PHYSIOLOGICAL AND SOCIAL ADAPTATION IN FAMINE
Jean Mayer
There are at least four different categoriesrelating to physiological and behavioral adapta-tion to famine, and there has been a risk ofconfusing them though they are, in fact, quitedifferent. The first category is individual varia-tion, the second, seasonal variation. Both ofthese parameters lend themselves to descriptionby classical statistical methods, and althoughthey have to be accommodated in any elabora-tion of requirements for a population on ayearly basis, they do not, properly speaking, fallwithin the concept of adaptation.
The third category in question is adaptationwithout loss of function, and there are, ofcourse, examples in nutrition of this. People canfunction quite well on a great variety of dietsif these provide adequate amounts of the re-quired nutrients. It has been my good fortuneto be the nutritionist for the United StatesOlympic team, and as such I have observedyoung people with the most extraordinary va-riety of diets either self-prescribed, or prescribedby coaches who are more enthusiatic than liter-ate in the field of nutrition. As long as the dietsare not deficient, it does not matter very much(at least in the short run) what curious com-binations of foods they eat. If they have enoughwater, calories, and nutrients, they can eat yeast,molasses, or wheat germ oil a gogo. If theytrain hard enough and are determined enough,they will do very well.
It is not always known what the loss of func-tion may be if an odd diet is adhered to for avery long time. Those of us who have been
involved, however tangentially, with the nutri-tional aspects of the space programs havealways recommended making the range of adap-tation or the need for adaptation as small aspossible, at least for trips of a month or more.If the trip is further prolonged, the range ofadaptation will certainly be very small as regardsoxygen and water and may not be too great asregards food.
There may be situations, one may add, wherea loss of function in one respect and an improve-ment in another may be observed. In any situa-tion where calories are inadequate, for instance,one usually finds a decrease in cardiovascularcatastrophies, but an increase in the prevalenceof tuberculosis, particularly among adolescents.
Finally, we come to the fourth category-adaptation with loss of function. The loss offunction may be less obvious, but eventuallyequally grave when it is delayed. This may becalled adaptation with a long-range cost. Ex-amples abound in developed countries. For hun-dreds of thousands of years man has spent mostof his time roaming around the forest or thedesert clubbing deer or running away fromtigers. Only for the past ten or fifteen thousandyears has he been engaged in agriculture, and itis only in the past generation that most peoplehave become sedentary. The present generationis really the first that spends most of its timesitting down.
Man has inherited an organism which is notadapted to such a life. Two examples of long-range costs from living under conditions to
83

which the organism is not adapted by naturalselection are obesity and atherosclerosis. Inas-much as most of the conditions that follow fromthis inactivity occur after the reproducing age,it is quite possible that basically there is no wayto adapt through classical methods of evolutionto conditions brought about by modern life.
There are genetically determined differencesbetween individuals in the way they can adaptto new conditions. It has been shown, for in-stance, that with regard to regulation of foodintake no individual is really adapted to zeroactivity. In this respect man is in the same posi-tion as the caged animal. Our appetite mech-anism which functions quite well in adjustingintake to output at moderate activity levels doesnot function at zero activity. But it functionsbetter for some individuals than for others.Those individuals who are characterized byanthropologists as ectomorphs seem to be betteradapted to very low levels of activity in termsof not being likely to become obese. They alsoappear to have a lower expectancy of coronariesthan mesomorphs or endomorphs. Thus, onecan say that ectomorphs are better adapted tonew conditions that in this case are broughtabout by social changes.
This last point leads me to the social dimen-sion of nutrition. If the human race has not yetprogressed to a real consideration of the implica-tions of being a family-and a crowded familyat that-traveling in a small spaceship in anextremely empty and hostile universe, at least itis becoming more conscious of the sociologicalmatrix in which nutrition takes place.
Social factors determine first of all how manypeople there are. Man is a social animal, he livesin communities, and nutrition is a social andeconomic activity as much as an individual one.Hence, at some point, social factors in adapta-tion should be discussed if we wish to be realis-tic and constructive.
It is sometimes very difficult to differentiate inpractice between individual physiological andbehavioral adaptation and the reaction of societyas a whole to a particular nutritional situation.Famine provides a very good illustration of the
interaction between individual and social phe-nomena in what is, after all, the most extremeand the most disastrous of all nutritional situa-tions.
I have had the very doubtful fortune of seeingseveral famines in my life, and further, of beinginvolved in relief in a number of them. Thelast was in Biafra in the spring of 1969. I havebeen fairly continuously involved in relief workin that country through the slow recovery periodof the past few months.
One all too striking fact about famine is howreproducible the situations are in terms of whathappens, not only to individuals, but to society.It is very saddening to see how little the experi-ence of one famine is applied to the next. Every-thing has to be reinvented every time when, infact, what happens is depressingly similar.
Famines occur by and large in the same areasperiodically. They are caused, in large measure,by widespread crop failures because of lack ofwater. Droughts are followed by dust stormsand loss of seed. Some of the causes of recurrentfamines have been made worse over the years,and in the areas of periodic crop failure erosionhas made famines more likely.
Other famines are due to destruction of cropsby various diseases or by pests (fungus andlocusts, for example), by disruption of farmingoperations caused by wars and civil disturbances,or to a combination of factors affecting bothcrops and farmers as a result of great naturaldisturbances such as floods and earthquakes.
Many authors, Ancel Keys in particular, havecounted the known famines over the centuries,and observed that there has been at least oneserious famine somewhere every year through-out recorded history.
Social inequality, which is a characteristic ofunderdeveloped countries even more so than itis of developed countries, makes the socialaspects of famine considerably worse. By andlarge, the ruling groups tend to escape thecatastrophe, and therefore, they are slow to reactto the problems.
Concretely, what physiological changes in theindividual occur in a famine? First, there is a
84
4q

wasting of fat deposits starting with the sub-cutaneous adipose tissue, with the deeper fatpads being affected as well. Then the abdominaland thoracic organs are affected; liver size, forexample, drastically diminishes. Reduction oforgan size is in part a reflection of the bodyburning what is available. This process has anadaptive value in that, to a certain extent, itpermits lower maintenance at that particularlevel.
Following these changes, the intestinal mu-cosa becomes thin and smooth, hence it losessome of its absorptive capacity and diarrhearesults. Gastric achlorhydria too is generallypresent. These changes mean that what littlefood is available is poorly utilized. Far frombeing adaptation, these occurrences represent avicious circle which accelerates further decay:this involves brown atrophy of the heart socharacteristic of starvation, the fall in bloodpressure-with the systolic pressure in somecases becoming difficult to estimate, and thediastolic pressure dropping perhaps as low as 75millimeters of mercury-and finally, a drop inthe pulse rate. Edema then occurs. This is dueto possible disruption of osmotic tension, lack ofelasticity of the skin, renal and endocrine dis-turbances, and the like.
Allow me to stress that none of the abovehas any perceptible adaptive value. They repre-sent distinct pathology which eventually maybecome irreversible. Certainly, other symptoms-growth of lanugo hair and finally cancrumoris-are straight pathology.
The behavioral aspects of malnutrition areambivalent. Though they may have some adap-tive effects or benefits for the individual, inmany cases they are very dangerous to societyas a group. The individual becomes obsessedwith food, mentally restless, physically apathetic.This means that his energy expenditure is re-duced. In turn, there is a depressed requirementfor food because of the decreased body weight,
decreased metabolic rate, and decreased activity.These factors eventually cause a plateauing ofbody weight if the famine is not too acute.
If this is adaptation, then one could say thatmost adaptation to starvation is behavioralrather than physiological, and one could also saythat this form of adaptation, although it mayprotect the individual, may, in many cases, bedangerous to the survival of society and there-fore, in the long run, not particularly helpfulto the individual.
The disorganization of society which takesplace in such situations means that infection ismuch mpre likely to become rampant, familiesbecome disorganized, children get lost, and ado-lescents classically form gangs and are driven tobandit-like practices.
Unless society as a group organizes itself, oris organized from the outside, by the creationof small famine hospitals, by spreading itsmedical personnel, by keeping good records sothat whatever supplies are available can bedirected into the areas which are most in need,famine, as a social problem, is not going to bedealt with.
In summary, there are situations, as exempli-fied by famine, where society itself has toadapt to cope with problems. This is especiallythe case where individual adaptation may notnecessarily function in accordance with the bestinterests of social adaptation.
Although famine is the most dramatic ex-ample of failure to adapt, others come to mind.When one considers the enormous mortalityrate from cardiovascular diseases, especiallyatherosclerosis, it becomes obvious that socialadaptation to the new conditions in which man isliving is a sine qua non. In our own society, thismeans planning cities, which are pleasant towalk in rather than simply convenient to parkin and, in general, creating a mode of life forour children different from the one the presentgeneration has drifted into.
85

DISCUSSION
Hoffenberg: Could Dr. Mayer say anythingabout possible long-term effects of famine? Oneknows, for example, that there are reportedeffects on brain size and intellectual capacityafter infantile protein malnutrition, and Iwonder whether there are any known long-termeffects on survivors from famines of the sort youdescribe? °
Mayer: When you are in the middle of afamine as acute as the recent one in EasternNigeria, it is difficult to believe that those chil-dren who have survived, have survived un-scathed. I have been in villages where basicallyall the children under six were dead. Inciden-tally, it is only when you start doing epidemi-ological studies that you realize how bad thesituation is. The casual observer walking inthe village may think that everything is inreasonably good shape, and it is only when youstart doing age group distributions that you fullyrealize the problem. Those few children whosurvived would seem to be candidates for theusual sequelae of acute starvation. To myknowledge, no one has every really undertakena study of the sequelae of famine. As a matterof fact, the amount of epidemiological informa-tion that we do not have is enormous. In the
Biafra famine, the mortality from measles, forinstance, was between 25 and 50 per cent. Ihave no data for comparison, however, on thenumber of irreversible complications frommeasles following starvation compared to thosein normal children. There have been a numberof theories. One concerns liver cancer and thepossibility that periodic starvation may be oneof the factors in predisposition to primary cancerof the liver. I think none of these have receivedany verification. Perhaps our Chairman wouldknow more about it than I do. Nonetheless, Ibelieve the information is very, very poor.
Zubirán: Those of us who have closelyviewed malnourished populations have seen theconsequences of which Dr. Mayer spoke amoment ago. Our children in many of therural villages in Latin America, and I referspecifically to those of Mexico, live under con-ditions of food shortage similar to those of acutefamines, but they live it daily throughout theyear. Many of these children reach adulthoodwith chronic aftereffects, which still retain mostof the characteristics of the acute state. Thosechildren who continue to live on an inadequatediet are shorter in stature, lower in weight thannormal, have a lower mental capacity, and con-sequently, throughout their lives, have a re-duced ability to adapt to environmental stress.
Tourists invariably take pictures of Mexicansdozing with crossed arms under a big sombrero.This posture takes less effort socially, and is, infact, an adaptation of a malnourished people.These consequences from malnutrition are trans-lated into a reduced work capacity, an inabilityto maintain sustained effort, and also, no doubt,give rise to social retardation. Such people donot share in the development of their countrybecause of their physical incapacity and becauseof their need to adapt to an inadequate diet.
Another result also pointed out by Dr. Mayeris an insufficient defense against disease. Onefinds a higher mortality, irrespective of thedisease, but particularly from measles. Here thehuman has undergone adaptation, both clinicaland social, in order to survive under centuriesof insufficient dietary conditions.
Chairman Watedrow: Dr. Mayer, would youlike to reply to these remarks? You asked mewhether I could give any information about thelong-term effects of famine. The answer is 1do not have the information any more than you.
86
A
4.
,T

Mayer: It is very likely that acute starvation,or continuous malnutrition, as Dr. Zubirándealt with, is responsible for many of the phe-nomena that we observe-decreased stature,greater susceptibility to this or that disease,greater prevalence of congenital malformations,and greater prevalence of children with lowIQ's. One can say in a few cases that there isa clear cause and effect relationship betweenmalnutrition and the above deficiencies. Inmany cases, however, this relationship can onlybe inferred through fairly constant epidemiologi-cal association. All of this means that we haveto consider the cost of adaptation. It is notenough to say that some individuals seem tofunction very well with almost no detectablevitamin A level in their blood. First, we donot know whether all of them would. Secondly,to get back to Dr. Hilleboe's question, if youare cast in the position of an administrator,there are chances you are willing to take andchances you are not willing to take.
Although adaptation is an obvious fact, itmay not apply to all nutrients. In terms of thefirst law of thermodynamics, adaptation to lowcalories has to be at the cost of size, or at thecost of activity. Size may not by itself be agreat benefit. One may say that in a crowdedworld maybe we should strive to make peoplesmaller and smaller so that we could accommo-date the population explosion for one moregeneration. But whatever the theoretical argu-ments, there is not very much we can do aboutthe fact that people want larger children, par-ticularly larger boys. If activity is decreased bysocial factors, as it is in this country, it is at acertain cost as, for example, obesity, increased
prevalence of heart disease, and perhaps dia-betes. This decrease in activity has a numberof undesirable effects on human physiology andperhaps on mental health. Certainly, none ofus would advocate that physical activity befurther reduced by malnutrition, as is the casein the populations that Dr. Zubirán described.
I do think, Mr. Chairman, that we shouldhave the session address itself to only two ques-tions: What are the limits of adaptation with-out long-term or short-term physiological cost?What is the cost of adaptation beyond that par-ticular level, and is this an acceptable cost? Youraised the example earlier today of the pH andelectrolyte concentrations of the blood as ex-amples of regulations where the limits of normalare well-known in view of the disastrous con-sequences of going beyond them. Another anal-ogy is the regulation of body temperature. Thereis a zone of thermal neutrality in which vaso-constriction, vasodilation, or in the case ofman, the putting on of a coat, or not putting iton permits effective control of body temperaturewithout any additional thermal energetic cost.This is one zone of "adaptation," the "thermo-neutral" range. There is also another range onboth sides where we can adapt, but at somecost. We have to eat more in the cold and, onthe other hand, we have to reduce drasticallyour physical expenditure in the heat, particularlyin humid heat. But there are the extreme zoneswhere, in effect, we cannot adapt. Both ex-treme cold and extreme heat lead to death. Itseems to me we may have an analogous situa-tion regarding nutrition. Moreover, we mustconsider social adaptation as well as individualadaptation.
87

STANDARDS FOR THE DIAGNOSIS OF VITAMINDEFICIENCY IN MAN
Guillermo Arroyave
Introduction
The spectrum of vitamin deficiency states, asany other nutritional deficiency, extends be-tween two theoretical limits: that of optimalnutrition, when the metabolic needs for vitaminsare amply satisfied, and that of extreme de-ficiency, when the lack results in such severemetabolic and organic alterations as to interferewith the life process. In between, however,there is a continuum approaching either ex-treme. This concept is suggestive of the diffi-culties involved in the definition of standards,since the implication is that they must bequantitative and express in measurable termsthe distance between the particular situation ofan individual or a group from either or bothof these two extremes.
It is evident, then, that the first task in theelabuoration of standards is to define as clearlyas possible the characteristics of the subjectsthat exist at the two extremes. The secondwould be to develop means to express, quantita-tively, deviations from them. To define thesepoints, several criteria have been used that, atthe risk of oversimplification, can be classifiedas follows: dietary, biochemical, clinical, andfunctional. 1 have separated functional criteriafrom the rest, despite the fact that good functionis dependent on the normality of the biochemicalaspects of the organism, but the expression ofthese functions is dynamic and may be bestreferred to as "performance," whether this be
biochemical, physiological, physical, mental, orotherwise. Actually, functional tests shouldprovide the ultimate criteria, but unfortunately,they are also the most difficult to evaluate.
In view of the latter difficulty, efforts havebeen made to develop indices, particularlydietary and biochemical. In general, these arenumerical expressions of measurable characteris-tics which ideally are, or may be, related to astate of functional alteration, but which arepractical to apply to human subjects. Theyexpress arbitrary estimates of the position occu-pied by the subjects in the spectrum delimitedby the two extremes mentioned above. Un-fortunately, this relationship of the indices withfunction is as yet in many instances poorlydefined.
Clinical criteria
Clinical criteria are of limited use as standardsfor various reasons: (a) they are often unspe-cific and hence seldom pathognomonic of aparticular deficiency. Other factors in the physi-cal and microbiological environment may resultin the same or similar alterations; (b) the con-comitant presence of several deficiency statesobscures the appearance of clear-cut clinicalsigns, thus making their interpretation doubtful.Unfortunately, this is often the case with humanpopulations; and (c) in general, their presencein the individual reflects thc already extremestate of deficiency and, therefore, they do not
88
.4
e
?
·c

lend themselves to the evaluation of the gra-dient-type of situation characteristic of vitamindeficiency.
There is, however, one situation in which
1 dclinical signs may lend themselves to mathe-matical, or rather to statistical treatment. Whendealing with population groups, and providedthat their nutritional origin can be demon-
strated, prevalence figures could conceivably beset up as standards. The bases for defining theselimiting acceptable prevalences are still empiri-cal, but they have value in comparative studiesof population groups. An example of such aneffort by Jolliffe is given in Table 1 (12). Iwill not comment on the soundness of the spe-
cific prevalences proposed. They are several
Table 1
Clinical criteria of nutritional status
Nutrient
Calories:
Clinical sign
Obesity Skin thickness:ScapulaeLower Axillae
Height-weight tablesLeanness Skin thickness:
ScapulaeLower Axillae
Height-weight tablesProtein Dependent edema
Vitamin A Follicular Keratosis of arms
Vitamin D Under six months CraniotabesSix mo. to two years Beading
of the ribs.Over two years ( ) and X de-
formities of legs.Thiamine Absent Achilles tendon re-
flexes.Niacin Tongue lesion more advanced
than hypertrophy of papillaeat tip.
Reddened tonguePellagrous dermatitis
Riboflavin Angular stomatitis
Conjunctival hyperemia (cir-cum corneal infection).
Magenta tongueRed hyperemic gums
Ascorbic acidPerifolliculosis
Abnormal
Over 30 mm.Over 25 mm.Over 10 percent.
Under 8 mm.Under 8 mm.
Over 0 percent a under age 50.In absence of beriberi starva-tion, and pregnancy.
Over 5 percenta in adults andpre-adolescents. Not reliablein starvation and in adoles-cents.
Over 0 percent.aOver 0 percent.a
Over 0 percent.a
Over 1 or 2 percent.a
Over 5 percent.a
Over 1 or 2 percent.aOver 0 percent.a
Over 5 percent a in non-denture-wearing population.
Over 5 percent.a
Over 0 percent.aOver 1 or 2 percent a in children.Over 5 to 10 percent a in adults.Over 0 percent.a
89
a An educated guess of frequency that these signs might occur in a well-nourishedpopulation group.
From: Methods of Evaluation of Nutritional Adequacy and Status. National Re-search Council (U.S.), 1954.

years old, and perhaps the time is due for arevision of these standards by clinical nutri-tionists.
Dietary and biochemical criteria
I deem it impossible to discuss these twoapproaches separately because in most instancesthe criteria for establishing the dietary standardshave been based on biochemical alteration.
Efforts have been directed towards the de-termination of some biochemical characteristicsof subjects who are at the lower limit of thespectrum of deficiency, and there is a greatdeal of information on this point for manyvitamins. The determination of the other ex-treme, the extreme of sufficiency, is somewhatmore vague. Here we either have a level ofintake of a vitamin which will be sufficient tosatisfy all metabolic needs and no more, andwhich will determine certain biochemical char-acteristics of the subjects, or, on the other hand,we can have an excess of the vitamins whichproduce no harm but no further benefits either,and that will, nevertheless, change some bio-chemical measurements. The danger here lies innot being able to discriminate between sufficientand excessive and thereby running the risk ofsetting unduly high standards. I have partakenin the efforts of at least two scientific groups thathave proposed standards to assess vitamin de-ficiency or adequacy, and I guarantee that, to theextent of our present knowledge, this danger hasbeen carefully considered.
The next question is how to establish stan-dards to judge situations in between these twolimits. In reviewing the literature, 1 have cometo the conclusion that the prevailing criterionhas been based on the following: (a) valuesoccurring in individuals who are in a definitedeficiency state. These have been producedexperimentally both in animals and humans.Conditions of practically "complete depletion"have been obtained in which histological andphysiological alterations are clearly evident; (b)values occurring in individuals who present noevidence whatsoever of abnormality, whether
physical or physiological, and who furthermorepossess a certain amount in concentration ofthe vitamin in question in their body or specifictissues which acts as a reasonable insuranceagainst rapid depletion under conditions of de-privation; and (c) the intermediate values be-tween the upper range of values under (a),and the lower range of values under (b) maybe and in general are considered indicative ofundesirable situations at "risk" to a smaller orlarger extent. Subjects in these intermediatestages are in situations that can be changed froma doubtful status by increasing the supply of thenutrient to the body.
It would be impossible in the allotted timeto review the approaches which have been usedby groups of experts or individual investigatorsto set up dietary standards and correspondingbiochemical indices for all the vitamins con-cerned. Depending on the extent of our knowl-edge, these proposed standards range from whatcould be considered "educated guesses" to rela-tively well-documented figures.
Derivation of standards
Only three cases will be discussed. These canbe taken as models of what has been done toelaborate standards, perhaps under the best cir-cumstances, that is, when a relatively adequateamount of knowledge has been available. Thereare less fortunate cases, but emphasis is madeon one point: whatever information is avail-able now with regard to standards cannot beimproved by discussion or criticism; it has tobe done through research.
Ascorbic acid
There is still much controversy regarding theamount of ascorbic acid to be recommended asan adequate intake for humans. I believe thatthis controversy is due more to differences ofopinion than to contradictory data. If we taketwo standards, those of the National ResearchCouncil of the United States (NRC) (17) andthose of the Canadian Council on Nutrition
90
A
,n
;é
A

Table 2
Guides for the interpretation of ascorbic acid intakes and plasma levels(young adult male)
Deficient Low Acceptable High
Dietary intake <10 10-29 30-40 >50(mg/day)
Plasma concentration <0.10 0.10-0.19 0.20-0.39 >40(mg/100 ml)
From United States Interdepartmental Committee on Nutrition for National De-fense of the United States of America (ICNND). Manual for Nutrition Surveys, 2nded., Bethesda, Md., 1963.
(CCN) (5), it can readily be realized that theirtraditionally divergent standards are both de-rived from the same data. While NRC recom-mends a daily intake of 60 mg for the adultman, the Canadian standard recommendsexactly half. Another United States group, theInterdepartmental Committee on Nutrition forNational Defense (ICNND) (11) went some-what further, proposing categories of levels ofintake and corresponding expected plasmaascorbic acid concentrations which could beused as indices. These are shown in Table 2.
What are the data' on which these standards
are based? In Figure 1 are represented someof the pertinent associated phenomena in re-lation to levels of dietary intake. The data aremainly those from Lowry et al. (15) and Rallyet al. (18). The intake which results in maxi-mum plasma levels with minimum urinary lossis approximately 80 to 100 mg/day. Levelsof 8 to 10 mg are sufficient to prevent scurvy.Information regarding intakes below that levelis scarce and doubtful, but there is some evi-dence that four mg/day is not enough for ade-quate reversal of some clinical alterations (7).Studies with 14C ascorbic acid indicate, further-
TissueSoturation
o--o
r"Dficient" a IIC "Low"
_ "Acceptable"r-
Meobolic Utili..tion
Prevention of Scurvy
100
Intole (mg/doy)
150 200
Bosed on doto from Lowry et ao. J. Biol, Cher.,166: 111, 1946, End-Rolly ot . Proc. So. S p. Biol. Med.,40: 604, 1939.
Figure 1. Relation of intake of ascorbic acid and blood plasma concentration.
91
C.C.N.
50
E
w
.i
E1
1

more, that the actual metabolic utilization byhealthy men is around 22 mg/day (2, 3, 19).
In support of the recommendation of theNRC for the higher standard, two main argu-ments have been brought forward: (a) thatanimals that can synthesize ascorbic acid main-tain a tissue concentration at saturation levels;and (b) that the higher amount provides amargin of safety in cases of increased need andalso protects a proportion of individuals who,by the mere fact of individual variability, mayhave a higher requirement. In favor of thelower standards are the following arguments:(a) that 30 mg is at least three times the intakeneeded to prevent scurvy; (b) that it providesan amount somewhat above the ascorbic acidactually metabolized daily by a normal man;and (c) that it has not been possible to demon-strate satisfactorily any further benefits fromamounts in excess of this standard.
Thiamine
Several criteria have been considered in thedetermination of standards for thiamine nutri-tion. Among the most informative we maylist: (a) the attainment of a point of minimumurinary excretion of the vitamin. It is basedon the observation that as the thiamine intakeis gradually lowered from a high level, theurinary excretion decreases proportionally to apoint after which further lowering of the intakeresults in only minor changes in urinary output.This point is assuiimed to represent the miníiralintake of thiamine that will maintain the tissueswith a physiologically adequate thiamine con-centration. Intakes higher than this criticalpoint result in spilling and wasting of thevitamin; (b) closely related to the above cri-terion are the so-called dose-retention tests. Theyare conducted by the administration of a doseof thiamine either orally or parenterally, andthe determination of the percentage of the dosethat is excreted in the urine during the subse-quent four hours. The values obtained are alsosupposed to represent the extent of saturationof the tissues with thiamine; (c) appearance
of abnormalities in carbohydrate metabolism.These abnormalities are judged mainly by alter-ations in the concentrations of pyruvate andlactate in the blood and are particularly usefulwhen the metabolic paths involved are subjectedto a metabolic stress, such as a load of glucose,plus physical exercise. Recently, transketolaseactivity in erythrocytes has been shown to de-pend on a minimum intake of thiamine, butso far no direct application to the estimationof minimum requirement has been reported;and (d) appearance of early clinical signs suchas impaired appetite, lowered blood pressure,slight edema, diminution of deep reflex activity,and dulling of vibration sense. The estimationof plasma and red blood cell thiamine has alsobeen used, but they appear to be too insensitive.
Several independent groups of investigatorshave searched for the minimum daily intakerequired by humans using either one or acombination of the above criteria in a compre-hensive approach.
There is general agreement in expressing therequirements as mg daily per 1000 calories.The available evidence has been reviewed andcarefully analyzed by several groups of experts.There is little question that intakes of 0.3 to0.5 mg of thiamine/1000 calories are aboutthe highest range in values reported as aminimum requirement. One exception is thework of Williams et al. (21), who concludedthat even 0.45 mg/1000 calories was slightlyless than required. Their criterion, however, isopen to question, because it was based on anarbitrary set excretion level in the urine whichhas no definite basis and on a slight elevationof the blood pyruvate after a glucose load,which may not necessarily be abnormal. Valuesof 0.20 to 0.25 mg can be considered as thelowest range of the values reported as minimumintakes. Keys et al. (13), for example, concludethat "for the periods studied, no benefit of anykind was observed to be produced by an intake*of more than 0.23 mg of thiamine/1000calories." These authors state, however, thatno conclusions can be drawn for more prolonged
92
k
.,
i
.t

periods of time. Their observation period lastedonly from 10 to 12 weeks. Another very care-fully conducted study in adult men in whichlevels in this low range were evaluated bycomprehensive criteria was that of Horwitt andhis group (9), who concluded that 0.40 mg ofthiamine was below the minimal requirementfor subjects who were consuming about 2000calories/day (about 0.20 mg of thiamine/1000calories).
An interesting observation is that the extra-polation to man of the formulas developed by
400
* Militory doto
0 Civlon doto
350
300-
z 250-
0 150z ¡S
io0-
50-
Cowgill in 1934 for mice, rats, pigeons, anddogs indicate that the calculated thiamine re-quirement for a 60 kg woman and a 70 kgman would be 0.25 and 0.30 mg/1000 caloriesrespectively (16).
The stimulatory effect produced by the addi-tion of thiamine pyrophosphate (TPP) to thetransketolase activity of red blood cell hemol-yzate is increased under conditions of dietarythiamine restriction (4). Data are beginningto appear indicating that a TPP effect of morethan 20 per cent correlates with "deficient"
0.10 O.20 0.30 0.40 0.50 0.60 0.70 0.80 0.90
THIAMINE INTAKE
(mag 1.000 olories doy)
1 Data from civilian and military groups surveyed by the InterdepartmentalCommittee on Nutrition for National Defense of the United States of America.
From: FAO Nutrition Meetings Report Series No. 41.
Figure 2. Relationship between thiamine intake and thiamine urinary excretion inadults of 18 countries.
93
¡
° *'.
0 . .
O

thiamine intake and excretion, and more than25 per cent may be regarded as an index ofthiamine deficiency (6).
Reference to other works only serves to con-firm what has already been stated. This dis-cussion leaves a situation of relative agreement,but the decision regarding a minimum require-ment figure still has to be made. A figure cor-responding to the lowest range mentioned, ofapproximately 0.20 mg/1000 calories, mightbe selected. This is the position adopted by theCCN (5), which states that the results of theavailable studies indicate that "for the adultperson 0.2 mg of thiamine/1000 calories is atthe lower limit of adequacy and that 0.3 mg/1000 calories is near the level to produce tissuesaturation, and is undoubtedly adequate." Onthese bases the Council adopts 0.3 mg/1000calories as the recommended amount.
Adults (15 yr or > )
360
340 .
320.
180--
" 140.
o
60.
20
o
o
o!
o
.·
------o
It is interesting to note that in the latest edi-tion of the Recommended Dietary Allowances,the National Research Council of the UnitedStates of America (NRC) (7) also bases the"dietary allowance" for thiamine on the evi-dence that the minimal requirement approxi-mates 0.2 mg/1000 calories. The NRC, how-ever, recommends 0.5 mg/1000 calories on theassumption that this amount maintains wholeblood thiamine levels and permits relativelyhigh urinary excretion.
The Joint Food and Agriculture Organiza-tion/World Health Organization (FAO/WHO)Expert Group on Requirements of vitamin A,thiamine, riboflavin, and niacin (7) proposes0.4 mg/1000 calories. They state that on thebasis of available evidence, a value of approxi-mately 0.33 mg/1000 calories represents the re-quirement and "with an allowance of 20 per
o Males
* Females
1000
900 -
800
600 -
500 -
400 -
300
200
0.10 0.20 0.30 0.40 0.50 0.60 0.70 0.80
Children (0-14 yr)
o
!
o'
1
I
o /
_---e
0.10 0.20 0.30 0.40 0 0.60 0.700.10 0.20 0.30 0.40 0.50 0.60 0.70
Intaoke (mg/1000 cal)(Colculated from chemical anolysis)
Figure 3. Relationship between intake and urinary excretion of thiamine in Central America.
94
.A
.*
,1
*
-l
f-
1

cent for individual variation, the recommendedintake for thiamine is 0.40 mg/1000 calories."
Data obtained from nutrition populationstudies seem to support this "critical" relation-ship between intake and urinary excretion.Figure 2 shows data collected by ICNNDUSA(11). These data are for adults only and werecollected by different groups from 18 communi-ties. In the Nutrition Survey of Central Americaand Panama, it was possible to derive similarrelationships for a large number of subjects ofdifferent ages using the same biochemical anddietary techniques (1). The results are illus-trated in Figures 3 and 4.
In fact, the "critical intake," that is, the levelat which the tissues become "saturated" (theexcess thiamine being excreted in the urine)is usually found to be around 0.35 mg/1000calories, that is the mid-point between the
Canadian and the FAO/WHO recommendedfigures. Measurements of the thiamine metabo-lites excreted in the urine have indicated thatthe actual metabolic utilization of the vitaminis approximately 0.33 mg/1000 calories/dayand suggest this as the minimum daily require-ment (22). A model curve illustrating thisrelationship is shown in Figure 5, which alsopresents the intakes recommended by the CCN,NRC, and FAO/WHO. The ICNND guide tointerpretation of thiamine intake data is alsoincluded. Its scientific basis is quite evident.We must emphasize again that these figures areall based on the same set of data and that thedifference between the views of the two groupsis a question of balance between the degree ofrisk accepted as reasonable and the feasibility ofattaining in practice an intake to meet a rela-tively high recommendation.
o Males* Females
Children (10-12 yr) Children (0-3 yr)(Both sexes)
1100oID
1000
900
o
I
o Ie.
o--l
0.10 0.20 0.30 o0.40 0.'50 0.60 0.70
600
500 -
400
1
xl
11
/-
,x1
1Ix
0.10 0.20 0.30 0.40 0.50 0.60 0.70
Intake (mg/1000 cal)(Calculated from chemical analysis)
Figure 4. Relationship between intake and urinary excretion of thiamine in Central America.
95
700
600
0
E
o 400 -
300,
200

ICNND GUIDE
| Deficient I Lowo Acceploble High .]
1C
Sotroti o.,
Clinicol & 1Oef¡ciency = o bo M lcC UFAlOoon
FAO
0.10 0.20 0.30 0.40 0.0
Inotk (m.g/iO000 col.)
Figure 5. Relationship of thiamine intake and urinaryexcretion.
TV'itamin A
In theory, the standards for the assessment ofvitamin A deficiency should be based on theinterrelationship of four types of data: dietaryintake, concentration of vitamin A in liver,blood levels of the vitamin, and the appearanceof clinical signs, including abnormal dark adap-
tation, which could be considered as a functionaltest.
In practice, the data available are difficult to
interpret because of several factors: (a) vitamin
A accumulates in liver tissue, and can be used
as a reserve supply for other tissues for variable
periods of time, depending on the extent of the
reserves; (b) there is a need for more studies
in humans to establish the quantitative rela-
tionship between vitamin A serum levels and
vitamin A liver reserves, as well as to determine
factors other than nutrition which affect this
relationship; and (c) the scarcity of information
on the biological activity of the carotenes as
provitamin A compounds.
In this discussion I will follow the recom-
mendation of the Joint FAO/WHO Expert
Group that, because of the availability of crystal-
line vitamin A alcohol (retinol) as a reference
standard, the practice of expressing vitamin A
values in terms of international units (IU)
should be discontinued.
Intakes of compounds with vitamin A activity
must, therefore, be expressed in "retinol equiva-lents." The retinol equivalency of the differentcarotenes will not be discussed here. The readeris referred to the literature (7).
The determination of blood plasma concen-trations of retinol is still the only feasible bio-chemical tool to assess the state of vitamin Anutrition. I will try to describe the situationsalong the spectrum of vitamin deficiency states.At the upper extreme, sufficiency is obtainedwith an intake which will be compatible withnormal function, particularly dim light visionand with complete absence of clinical signs.Furthermore, it is accepted that at that levelthe liver should contain significant amounts ofretinol. After reviewing thoroughly the avail-able evidence, the FAO/WHO Expert Group(7) concluded that an intake of 750 /g ofretinol (2500 IU) ensures such a situation inthe human adult. This figure was proposed bythem as the daily recommended intake. TheSheffield study (20) is the main source of dataon which these conclusions are based. Theintake of 750 ug/day in two individuals main-tained the plasma retinol levels at approximately25 to 27 ttg/100 ml. Another "landmark" tobe derived from these studies is the plasmalevel of 15 /¿g/100 ml (50 IU). To quote: "Afall of the average plasma level to below 50IU (15 /Mg) per 100 ml in every case precededthe deterioration of dark adaptation by a fewweeks, and no abnormal values for dark adap-tation were noted in any subject as long as theplasma level of vitamin A remained above 50IU/100 ml." The next lower "landmark" set bythe Sheffield study is 12 Mtg (40 TU/100 ml).Since this was the average plasma level found atthe time, the deterioration of night vision waspronounced. Furthermore, none of the deprivedindividuals whose dark adaptation remained nor-mal had average plasma levels below 12 vtg/100ml.
In the literature reviewed, a few other obser-vations in humans do little more than confirmthe general magnitude of the figures givenabove. For example, the retinol levels of large
96
e
A
t

Table 3
Plasma vitamin A (ag/100 ml)
Deficient Low Acceptable High
<10 10-19 20-49 >50
From ICNND. Manual for Nutrition Surveys, 2nd ed.,Bethesda, Md., 1963.
groups of urban children or adults in CentralAmerica fall mostly between 20 and 50 [¿g/100ml (10).
As seen by the Group of Experts of theICNND (11), these data would support theguide to interpretation of blood vitamin A datashown in Table 3.
This is a reasonable approximation of greatpractical value. In Figure 6, data from Lewiset al. (14) indicate that intake and plasmalevels relate quite linearly to each other up toplasma levels of 25 to 30 ltg/100 ml. Liverretinol behaves differently, since it does not
begin to accumulate until the plasma values are
around 18 to 20 /Lg/100 ml. These data permit
three conclusions: (a) that a low plasma levelresults from a low intake, and is undesirable
(mcg) I.U.
(30) 100 -
o
r 1-i
. (15) 50-
o PlosmaA Liver
.1/
/1
1
11
>31y¡
1o
¡o?11,.--r
-- -50
1
1... 1 . . . . .
Table 4
Intake of retinol equivalents
Deficient Low Acceptable or high
<390 390-740 > 750
because it means a low vitamin A availabilityto the tissues and the absence of reserves inthe liver; (b) that a higher intake of vitaminA, sufficient to elevate significantly the plasmalevels, does not necessarily result in appreciableliver reserves ("risk situation"). Under theseconditions, the supply of retinol to the tissueswill be operating, but in terms of the economyof vitamin nutrition of the population, the situa-tion is one of risk; and (c) that with an evenhigher intake (upper extreme of the spectrum),both high plasma and liver retinol levels areensured.
From the Sheffield experiments (20) it canbe deduced that intakes of around 390 /¿g/day(1300 IU) of retinol would place the subjectsunder situation (b). One could also supposethat intakes below that would eventually leadto depletion of hepatic reserves.
I
/
I.U. (mcg)-1300 (390)
100 (30)
r=s
50(5) e
100
Intoke (IU/Rat/doy)(for 6 weeks)
Bosed on dta from Lews et ., J. u.ttition, 23: 351, 1942.
Figure 6. Relationship of vitamin A intake to blood plasma and liver concentration.
97
.S _""" ' '

A reasonable guide to interpret "retinol equiv-alent" intakes (/tg/day) would be, for the FAOreference man, that presented in Table 4.
Comments
Other standard values have been constructedon bases similar to those illustrated here. TheAppendices include those which have beenproposed by ICNND for some vitamins ofpublic health significance, those for blood serumand red blood cell folates, and for serumvitamin B12 used by the Institute of Nutritionof Central America and Panama (INCAP).
In conclusion, 1 would like to state that the
standards are to be recognized for what theyare. They are "yardsticks" against which toassess the relative position of subjects in thespectrum of vitamin deficiencies. Furthermore,they define a goal, or the position in the spec-trum which, within reason, represents thesmallest probability of being deficient or atrisk. They are most useful when taken as thebasis for the statistical expression of the nutri-tional characteristics of a population.
It is not my intention to defend the specificfigures proposed, but rather to emphasize thesoundness of the principles involved in theirdevelopment as well as the general usefulnessand limitations of the standards.
,A
Appendices
INCAP a suggested guides to interpretation of blood folates and vitamin B,,(all ages)
Acceptableor
Constituent Deficient Low high
Serum folates (ng/1 ml) <3.0 3.0-4.9 >5.0Serum vitamin B1 2 (pg/ ml) <100 100-149 >150
a Prepared by Drs. Fernando Viteri and Jorge Alvarado, Division of Biomedical Research, INCAP.
Suggested guide to interpretation of vitamin intake data for reference man
Deficient Low Acceptable High
Ascorbic acid: mg/day a <10 10-29 30-49 >50
Thiamine: mg/100 cal a <0.20 0.20-0.29 0.30-0.40 >0.50
Riboflavin: mg/day a <0.7 0.7-1.1 1.2-1.4 >1.5
Niacin: mg/day a <5 5-9 10-14 > 15
Retinol equivalents: ztg/day b <390 390-740 >750
a ICNNDbSuggested by author of present paper.
ICNND suggested guide to interpretation of blood vitamin data a(young adult males)
Constituent Deficient Low Acceptable High
Plasma ascorbic acid: mg/100 ml <0.10 0.10-0.19 0.20-0.39 Ž0.40
Plasma vitamin A: pg/100 ml <10 10-19 20-49 >50
Red blood cell riboflavin: gg/100 ml <10.0 10.0-14.9 15.0-19.9 >20.0
a Serum levels of nutrients in children do not differ appreciably beyond infancy from those of adults. Similarly
plasma levels of these blood constituents in women of child-bearing age are comparable to those of males. No guide
is suggested by ICNND for RBC riboflavin during pregnancy. For ascorbic acid and vitamin A, the same values are
given.
e
98

ICNND suggested guide to interpretation of urinary vitamin excretion data
Deficient Low Acceptable
Thiamine:tug/6 hours¿g/gm creatinine
Riboflavin:l g/6 hours,ag/gm creatinine
N-Methylnicotinamide:mg/6 hours
1 mg/gm creatinine
<10<27
<10<27
<0.2<0.5
Thiamine: ,ag/gm creatinine:Age (years):1-34-67-910-1213-15
Riboflavin: ,ag/gm creatinine:Age (years):1-34-67-910-15
<120<85<70<60<50
<150<100<85<70
Adults (males and non-pregnant, non-lactating females)a
10-24 25-49 >5027-65 66-129 > 130
10-29 30-99 >10027-79 80-269 >270
0.2-0.59 1.6-4.29 > 4.30.5-1.59 0.6-1.59 > 1.6
Provisional guide for urinary excretions in children b
120-17585-12070-18060-18050-150
150-499100-29985-26970-199
176-600121-400181-350181-300151-250
500-900300-600270-500200-400
>600>400>350>300>250
>900>600>500>400
a The urinary values indicated above for adults are based on an expected creatinine excretion of 1.5 gm daily for areference man weighing 65 kg, for creatinine coefficient of 23.
b The guides offered here for children are based on considerably less extensive data than are the guides for adults.
REFERENCES
1. ARROYAVE, G., and O. PINEDA. Relación entrela ingesta de tiamina y su excreción urinaria. ArchLatinoamer Nutr 18: 375-382, 1968.
2. BAKER, E. M., H. E. SAUBERLICH, S. J. WOLF-SKILL, W. T. WALLACE, and E. E. DEAN. Tracerstudies of vitamin C utilization in men: metabo-lism of D-glucuronolactone-6-C14, D-glucuronic-6-C14
acid and L-ascorbic 1-C1 4 acid. Proc Soc Exp BiolMed 109: 737-741, 1962.
3. BAKER, E. M., J. C. SAARI, and B. M. TOLBERT.
Ascorbic acid metabolism in man. Amer 1 ClinNutr 19: 371-378, 1966.
4. BRIN, M. Thiamine deficiency and erythrocyte- metabolism. amer 1 Clin Nutr 12: 107-116, 1963.
5. CANADIAN COUNCIL ON NUTRITION, DEPART-
MENT OF NATIONAL HEALTH AND WELFARE. Dietary
Standard for Canada, Vol. 6: No. 1. Ottawa,Queen's Printer, 1964.
6. CHONG, Y. H., and G. S. Ho. Erythrocyte
transketolase activity. Amer 1 Clin Nutr 23: 261-266, 1970.
7. FooD AND AGRICULTURE ORGANIZATION OF THE
UNITED NATIONS. Requirements of Vitamin A,Thiamine, Riboflavin and Niacin. (FAO, NutritionMeetings Report Series No. 41, 1967.) Report of aJoint FAO/WHO Expert Group.
8. HODGES, R. E., E. M. BAKER, J. HOOD, H. E.SAUBERLICH, and S. C. MARCH. Experimental scurvy
in man. Amer 1 Clin Nutr 22: 535-548, 1969.9. HORWITT, M. K., E. LIEBERT, O. KREISLER, and
P. WITTMAN. Investigations of Human Require-ments of B-complex Vitamins. (National ResearchCouncil Bull. No. 116, 1948.)
10. INSTITUTE OF NUTRITION OF CENTRAL AMERICA
AND PANAMA. Evaluación Nutricional de la Pobla-ción de Centro América y Panamá. (INCAP Pub-lications V-25 to V-30. Guatemala, 1969.) Costa
99
High

Rica, El Salvador, Guatemala, Honduras, Nicaragua,Panama. Six Reports.
11. INTERDEPARTMENTAL COMMITTEE ON NUTRI-
TION FOR NATIONAL DEFENSE. U.S. Manual for Nutri-tion Surveys, 2nd ed. Washington, GovernmentPrinting Office, 1963.
12. JOLLIFFE, N. Clinical examination. In Meth-ods for Evaluation oj Nutritional Adequacy andStatus. Quartermaster Food and Container Instituteof the Armed Forces-National Research Council,1954, pp. 195-202.
13. KEYS, A., A. F. HENSCHEL, O. MICKELSON, andJ. M. BROZEK. The performance of normal youngmen on controlled thiamine intakes. ¡ Nutr 26:399-415, 1943.
14. LEWIS, J. M., O. BODANSKY, K. G. FALK, andG. MCGUIRE. Vitamin A requirements in the rat.The relation of vitamin A intake to growth andto concentration of vitamin A in the blood plasma,liver and retina. 1 Nutr 23: 351-363, 1942.
15. LowRY, O. H., O. A. BESSEY, M. J. BROCK, andJ. A. LoPEz. The interrelationship of dietary, serum,white blood cell, and total body ascorbic acid. 1 BiolChem 166: 111-119, 1946.
16. MITCHELL, H. H. Comparative Nutrition oj
Man and Domestic Animals. New York, AcademicPress, 1964. v. 2.
17. NATIONAL ACADEMY OF SCIENCES-NATIONAL
RESEARCH COUNCIL, FOOD AND NUTRITION BOARD.
Recommended Dietary Allowances, 7th ed., 1968.(Publication No. 1694.)
18. RALLY, E. P., G. J. FRIEDMAN, and S. SHERRY.Vitamin C requirement of man. Prolonged studyof daily excretion and plasma concentration ofvitamin C. Proc Soc Exp Biol Med 40: 604-605,1939.
19. TOLBERT, B. M., A. W. CHEN, E. M. BELL, andE. M. BAKER. Metabolism of L-ascorbic-4- 3
H acid
in man. Amer 1 Clin Nutr 20: 250-252, 1967.20. UNITED KINGDOM. MEDICAL RESEARCH COUN-
CIL. Vitamin A Requirements of Human Adults.(Special Report Series No. 264, 1949.)
21. WILLIAMS, R. D., H. L. MASON, and R. M.WILDER. The minimum daily requirement of thia-
mine of man. 1 Nutr 25: 71-97, 1943.22. ZIPORIN, Z. Z., W. T. NUNES, R. C. POWELL,
P. P. WARING, and H. E. SAUBERLICH. Thiamine
requirement in the adult human as measured byurinary excretion of thiamine metabolites. 1 Nutr
85: 297-304, 1965.
100
4
J-
.,4

DISCUSSION
Schaefer: Dr. Arroyave's excellent presenta-tion has my whole-hearted support. The historyof the establishment of the ICNND guidelineswas precisely as you heard. The guidelineswere based on the best evidence we could findregarding biochemical levels associated withclinical or functional changes related to dietaryintake. They are guides for interpretation ofdata to identify populations at risk. I often findmyself included with many other researcherswho have a tendency to over-interpret the guide-lines. I need not remind this group that theguidelines are not to be used as definitivediagnoses of malnutrition in individuals. De-finitive diagnosis is dependent upon a responseof the syndrome, be it a physical lesion or afunctional alteration, to a specific therapy. Theyare merely a measuring mark or bench mark,and if one wishes to confirm a suspicion of abiochemical (tissue level) or dietary risk, otherconfirmatory data, such as specific response totherapy, or some other test, such as a "satura-tion" or "load test" would be required. Thereis an urgent need for more simplified screeningtests. For example, we are extremely interestedin the research that Dr. Hodges at Iowa Uni-versity is conducting on longitudinal studieswith prisoners on a vitamin A-free diet in whichhe is observing histological alteration in theepithelial cells of the buccal mucosa, intestinal,and urinary tract. It appears that these changesoccur much earlier than serum vitamin A levelswould indicate. It is very obvious from hislongitudinal studies that by measuring totalbody pool or store of vitamin A, one can pre-dict from a linear curve exactly when the serumvitamin A level will arrive at 20 micrograms or15 micrograms per 100 ml. We are hopefulthat a simplified histochemical test of changesin the epithelial cells may be a quick screening
method for vitamin A nutrition. It is this kindof study that we need to encourage. Similarly,the recent work on the total protein content ofhair follicles as an indicator of protein nutri-tion holds promise. It appears to be a muchmore sensitive method than serum albuminlevels.
Our knowledge of the human organism'sability to adapt to stress is indeed meager asregards nutritional status. In populations con-suming marginal or suboptimal levels of variousnutrients such as thiamine, riboflavin, vitaminA, and even calories, does the body adjust tolower intakes? Do these individuals have alower requirement or have they merely reducedphysical output? Such problems can not be an-swered using current nutritional status assess-ment techniques. Dr. Arroyave has mentioneda few promising new approaches toward assess-ment of nutritional status. For many of thenutrients there are indeed sophisticated bio-chemical and microbiological methods that aremore precise and sensitive. However, their usein large scale epidemiological surveys arelimited. For example, the determination of thevitamin C of white blood cells is much moresensitive than serum or plasma vitamin Cassays; also transketolase activity of serum is abetter indicator of thiamine nutrition than uri-nary thiamine values. One always needs toappreciate the limitations and constraints ininterpreting dietary or merely biochemical data.It is much more meaningful to assess nutritionalstatus on the basis of biochemical, physical, anddietary findings. We all know the restrictionsof dietary information. This is usually obtainedover an extremely short period of time. Oneis required to obtain this information, however,since the major purpose of any diagnosis orepidemiological study is to determine the po-
101

tential cause and then develop remedial andpreventive action. I have often been disturbedthat most nutrition research-and I will haveto admit most of us are guilty of the samething-is restricted to studies of a single nu-trient. In our experience, when one finds mal-nutrition determined or defined in a broadsense, very rarely does one find a single nutrientdeficiency. There are exceptions, of course, suchas iodine deficiency and goiter.
The general impression with reference tokwashiorkor is that it is a protein malnutritionproblem. Our experience, in fact, has shownit to be a multiple nutrient deficiency. Most ofthe nutrition research studies have not beendirected towards the influence of the total foodsupply and environment. We blithely establishguidelines and standards based on controlledstudies, and these values may not be appropriatefor assessing marginal, multiple nutritionalstates.
Cohen: Several important considerations haveemerged from Dr. Arroyave's presentation whichI appreciated hearing. It will be very helpfulas background for later presentations. Dr.Arroyave pointed up very clearly one of thedilemmas facing administrators. If one has tosupply a community with vitamin C, does onedecide on a daily requirement of 30 milligramsor 60 milligrams? Decision-making thus maybe economically very important. There are anumber of comparable situations in dealingwith the dietary needs of a population that thisgroup has concerned itself with over the years.If we find that the dietary intake of a consti-tuent in one population is lower than that rec-ommended for another population, does thismean necessarily that we are dealing with a"deficiency" of that dietary constituent? If weare committed to raising the level of intaketo that recommended for another population,are we certain that "readaptation" to a higherintake is really necessary or even desirable?These questions need to be answered and itwould be appropriate to ask Dr. Schaefer'sopinion on this. The popular press, in par-
ticular, has given wide publicity to certain ofDr. Schaefer's findings, to the effect that largesegments of the population in the United Statesare suffering from malnutrition because thelevel of intake of a particular nutrient may be20 to 30 per cent below that recommended. Dr.Schaefer, you suggested, in fact, that this posi-tion is not finally established, but rather is onlyan initial and tentative assessment which needsto be followed up for confirmation. I am cer-tain that the members of this meeting wouldlike to have you comment on this.
Schaefer: In our presentation of the NationalNutrition Survey data, whether to Congress orto the press-and I beg no credit for the pressinterpretation-it was repeatedly stressed thatwe were defining a population at risk, based ontissue levels of the six nutrients we studied. Wefurther stated that if these population groupswere subjected to continued low intakes orto other stresses (parasitic, chronic disease, andsuch), they were candidates for the appearanceof clinical lesions associated with malnutrition.We pointed out that the prevalance of clinicallesions as indicators of malnutrition were, in-deed, rare in our population sample. However,there were some cases of clinical findings thatwe had not expected to see in the United States;for example, the finding of eight cases ofkwashiorkor, 21 cases of Bit8t spots, a preva-lence of rickets of two to six per cent amongthe 0- to 3-year-old population in some statesand goiter in five to six per cent of the popula-tion in two states.
On the manner in which we selected ourpopulation-a random sample from the lowerquartile of income areas-I honestly would haveexpected in this sophisticated society that thesepeople would have been identified either bytheir parents, by their neighbors, by the school,or through our health care system. Obviously,we are dealing with a population that is un-aware of problems of malnutrition. Likewise,the prevalance of goiter occurred in one statein which 40 per cent of the stores did not stockiodized salt. One storekeeper wanted to know
102
4,
q

why he should stock iodized salt and thenstated that none of his customers asked for it.These were some of the points we made. Again,we did not say that 25 per cent of our popula-tion is severely anemic; we said 25 per cent ofthe population studied had hemoglobin levelsthat placed it in a risk category. This distinc-tion is usually not made by lay interpreters.There is, however, reason for concern. Whenwe compared our findings, moreover, with theCentral American studies, bearing in mind thatwe are studying populations living in the lowerquartile of income areas, we found some stateswith a higher prevalence than we found inCentral America. This was not hard for meto believe, but it was for others. My case rests.
Mayer: The difficulty that Dr. Schaefer de-scribed, "At what point do you make the de-cision that your data in nutrition show this orthat situation and that a specific action isnecessary?" is not very different from the mentalprocess involved in research; for there is notsuch a great difference between being a scien-tist and being an administrator. Our Chair-man quoted Claude Bernard a little earlier. Iwould like to quote him in a different contextby way of illustration. Bernard said that allresearch starts on a bet and ends on a bet, butyou hope that somehow you improved the oddsby your research. It seems to me that at somepoint you have to decide that your figures con-cerning, for example, vitamin A levels or vita-min B1 levels mean one thing from the pointof view of knowledge and something else fromthe point of view of action. The fact that wecannot demonstrate that in every case peopleare affected by low vitamin B1 levels is not anobstacle to knowledge; it is merely a statisticalfact. By the same token it should not precludeaction.
The danger, obviously, both from the view-point of knowledge, and from the viewpoint ofaction in misinterpreting the data-a practicethat the press is sometimes guilty of as Dr.Cohen rightly showed-lies in the fact that ifyou have standards which have some individual
variation and some margin of built-in safety,such as recommended dietary allowances, thena fraction of the population can be below thestandard without it necessarily representing adanger.
A problem for this group at some furthersession should be: what is the acceptableminimum below which we must act? In thecase of vitamin C, it may be less than 50 percent because there is a large margin of uncer-tainty built-in. In the case of vitamin B1, Iwould say that 50 per cent of the recommendeddietary allowance is too little for acceptablelong-term function for any large population orgroup.
Perhaps we need to have minimum levelsbelow which action is indicated. Merely havingrecommended dietary allowances for the feedingof the population in general may not be theonly guide we ought to have in terms of publichealth analysis of data.
Arroyave: I would like to mention a fewother arguments, not to defend, but to explainthe practical use of standards. Let me makea comparison with the use of standards ineconomics. For example, a country sets upminimum salaries, which does not mean thatpersons who earn slightly below the minimumare going to be necessarily suffering because oflack of money. It is merely a goal establishedon the basis of the fact that families earningless have a high probability of being at riskeconomically. Does one prefer to have justenough income to be obliged to spend the lastcent at the end of the month, or does oneprefer a situation that allows for some moneyin the bank so that in case of loss of work orunusual needs, one is not going to be in a criticalfinancial state suddenly? One can look at vita-min A nutrition in somewhat the same way.It may be stated that persons with less thanten micrograms of serum vitamin A (no liverreserves) are doing well. But suppose therecomes a period of scarcity of sources of vitaminA. The individuals under these limiting condi-
103

tions would definitely be at a higher risk ofdeveloping acute deficiency. One final point:standards, as I mentioned before, are to be usedto make decisions about particular situations.
In this context different situations may callfor different standards, depending on the cir-cumstances under which the decisions are to bemade or the objective of these decisions.
104

ANEMIA AND NORMALITY
A. H. Waters
Introduction
The automation of diagnostic laboratory pro-cedures has made it possible to extend the scopeof clinical assessment to the community outsidethe hospital. Fundamental to the interpretationof each observation is a knowledge of the rangeof values which should be considered normalfor the person concerned. "Normal" values forhemoglobin, as for other body constituents, havefrequently been determined from testing onlya small number of persons in a single laboratory,or by accepting and applying the published re-sults of other workers, often out of context,especially in relation to the comparability ofmethods used. Widespread use of automatedtechniques should make it possible to reassessnormal values for hemoglobin and other bodyconstituents, making use of large numbers ofobservations and also of improvements andstandardization of methodology.
The purpose of this paper is to review thepublished criteria of normality for the hemo-globin concentration. In particular, the impor-tance of careful selection criteria will be dis-cussed, especially in relation to the exclusion oflatent deficiencies of iron, vitamin B12 andfolate, which may reduce the Hb concentrationbelow its optimal level in otherwise apparentlyhealthy subjects. The functional significance ofa suboptimal Hb concentration will also bediscussed in relation to adaptive mechanismswhich compensate for the reduced oxygen-carry-ing capacity of the blood.
Definition of anemiao
In clinical medicine anemia is defined as areduction of the hemoglobin concentration be-low normal. This is a functional definitionbased on the oxygen-carrying capacity of theblood. It can be argued whether the Hb con-centration or the total red cell mass is the mostvalid index of anemia. However, the formeris more directly related to tissue oxygen supplyand is certainly the only practical clinical mea-surement. The packed cell volume (PCV orhematocrit) can be used as an indirect screen-ing test for anemia, and in practice this measure-ment is usually made in conjunction with theHb concentration, from which the mean cor-puscular hemoglobin concentration (MCHC)(Hb gm per cent X 100/PCV) can be calculated.
Normal Hb concentration
The term normal is a statistical concept re-flecting biological variability and refers to therange of Hb values obtained in a randomsample of apparently healthy subjects. How-ever, what we really want to know is the opti-mal Hb concentration, which is a physiologicalconcept implying maximal performance for age
and sex in a particular environment.
Population surveys
A precise assessment of the normal Hb con-centration is of more than just academic interestbecause of the increasing interest in community
105

Table 1
Norwegian survey of hemoglobin concentrations a
Proposed normal values and criteria for anemia
Age(Years)
7-910-1314-1617-20>20
Male
12.7 -+ 1.6 b13.2 +- 1.615.0 -2.015.5 ± 2.015.7 + 1.8
Anemia(Hb below)
11.011.513.013.514.0
a gm/100 ml.b Mean + 2SD ( = 95% of population).
From Natvig and Vellar (46); Natvig et al. (47).
health, and in particular in view of the preva-lence of anemia in various population groups.
In determining the normal Hb concentrationof a population group, it is essential to ensurethe good health of the subjects studied, for thesignificance of the results obtained depends onthe extent of the screening criteria used. Be-cause of its relative frequency, it is importantto exclude iron deficiency, for it is well recog-nized that the early stages of this deficiency maybe associated with a fall in the Hb concentrationof the particular subject without overt hema-tological changes (2, 9), and on the other hand,patients with overt iron-deficiency anemia mayescape detection for they often have no definitesymptoms (27, 28). One way to exclude signif-icant iron deficiency in apparently healthy menand women is to examine the bone marrow ironstores. Using this method, Scott and Pritchard(48) and Hallberg et al. (31) found the lowestHb concentration at which iron was consistentlypresent in the bone marrow of non-pregnantwomen was 12.0 gm/100 ml. Recent studies inSweden (29), and Norway (46, 47) have drawnattention to the value of therapeutic iron trialsin apparently healthy individuals in determiningoptimal values for the various hematological in-dices of anemia.
Table 1 summarizes the proposed normal Hbvalues for males and females at different ages inthe Norwegian survey. These results are ingeneral agreement with the Hb values found in
previous surveys of unselected healthy subjectsin Britain (5) and Australia (20, 55). How-ever, in these latter surveys, although the Hbvalues for men were essentially the same, therange of values for women' were lower thanin the Norwegian survey, which may reflect theinclusion of some women with latent iron de-ficiency who were especially excluded from theNorwegian survey. Natvig and co-workers (46,47) applied their criteria to determine the in-cidence of anemia in apparently healthy Nor-wegian subjects (Table 2). In children (boysand girls) anemia was most prevalent aroundpuberty and early adolescence (10 to 16 years).In adult men subnormal Hb values (below 14gm per cent) were most frequently found afterthe age of 40. In women, however, subnormalHb values (below 12.5 gm per cent) were com-mon in all age groups, the incidence reachinga peak between 30 and 40 years, but remainingrelatively high thereafter. It is of interest tocompare the results of the Norwegian surveyconducted in affluent peacetime with the Med-ical Research Council (MRC) (U.K.) surveyof Hb levels in Britain during World War II
' Berry et al. (5)14.0±+1.25 gm% (11.5=M-2 SD)
Walsh et al. (55)13.9± 1.16 gm% (11.6=M-2 SD)
Davis et al. (20)14.3 + -1.2gm% (11.9=M-2SD)
Natvig and Vellar (46)14.3 - 0.9 gm% (12.5 = M - 2 SD)
106
Female(Non-pregnant)
12.7 + 1.6 b13.2 + 1.614.2 -2.014.2 - 2.014.3 - 1.8
Anemia(Hb below)
11.011.512.012.012.5

Table 2
Incidence of anemia in control subjects
Male
Hb below %(gm%) Anemic
Female
Hb below %(gmi%) Anemic
7-9 11.0 0.6 11.0 0.610-13 11.5 2.1 11.5 2.114-16 13.0 2.9 12.0 3.417-20 13.5 0.7 12.0 1.7
20-29 14.0 1.9 12.5 3.430-39 14.0 1.1 12.5 12.540-49 14.0 4.8 12.5 3.950-59 14.0 4.1 12.5 6.860+ 14.0 6.2 12.5 7.1
From Natvig and Vellar (46); Natvig et al. (47).
(41). There was a relatively high incidence ofanemia among civilian men and women (Table3), and children (Table 4), much higher thanin the Norwegian survey (Table 2). There wasalso a striking difference in the incidence ofanemia between civilian men and Canadian
soldiers stationed in Britain (Table 3). Thisin itself suggested that the civilian Hb valueswere suboptimal, and may reflect the more rigidmedical criteria for selection of the soldiers andtheir better nutritional background. Further-more, Berry et al. (5) obtained a higher mean
Hb value of 15.7 gm/100 ml on 245 men testedin Britain some years after the war comparedwith the MRC survey mean value of 15.1 gm/100 ml. These differences in Hb values empha-size the importance of rigid criteria of goodhealth and the exclusion of iron deficiency andother factors which may affect the Hb con-centration when selecting a group of subjectsfor determining the optimal range of Hb values.
On the basis of these and similar surveysthroughout the world (Table 5) (13), theWorld Health Organization (63) has proposed
Table 3
MRC survey of Hb levels in Great Britain in 1943 aIncidence of anemia b in civilian men and women and
Canadian soldiers stationed in Great Britian
Civilians e
Hb level Single Married Canadiangm'% (% Haldane) Women Women Men soldiers d
Below 12.0 (80%) 5.8% 9.6%Below 12.5 (85%) 14.9% 19.9%Below 13.0 (90%) 7.4% 0.2%Below 14.0 (95%) 17.5% 0.5%
a MRC Special Report Series No. 252 (41).b Using criteria for anemia in Table 1, namely:
Men Hb <14.0 gm/100 ml ( -95% Haldane),Women Hb <12.5 gm/100 ml ( 85% Haldane).
e From Table VI, p. 25, MRC Report (41).d From Table XXXIV, p. 106, MRC Report (41).
107
Age(Years)

Table 4
MRC survey of Hb levels in Great Britain in 1943 aIncidence of anemia in children
Incidence (%) e
Age Anemia b(Years) (Hb less than) Boys Girls
5-10 <75% 3.9% (0.6)a 3.8% (0.6)d11-14 <80% 4.4% (2.1) 9.0% (2.1)15-19 <90% 8.1% (2.9) 26.5% (3.4)
a MRC Special Report Series No. 252 (4l).b Approximate equivalents to criteria for anemia in Table 1 expressed as Hb
per cent (Haldane).e From Table XIV, p. 32, MRC Special Report No. 252 (41).d Figures in brackets indicate corresponding incidence of anemia in the Norwegian
survey (see Table 2).
certain criteria for the diagnosis of anemia which
are summarized in Table 6. Some workers mayprefer, however, to use their own or other cri-
teria, but whatever criteria are adopted, the re-
sults of Hb surveys should be reported not only
as the mean - SD, but also as a percentage inci-
dence in 1 gm per cent (or smaller) Hb incre-
ments, so that the data can be analyzed by differ-
ent criteria of anemia should the necessity arise.
Clinical significance of suboptimal Hb levels
While the concept of a normal range of Hb
values is useful for population surveys and clin-ical screening, it overlooks the problem of theindividual patient whose Hb concentration,although within the normal range, is below hisoptimal value. This applies particularly to theearly stages of iron, B12 and folate deficiencies,which are of particular nutritional significancein population surveys.
Iron deficiency
The well-documented sequential changes inthe development of iron deficiency are shown inFigure 1. From this it can be seen that the iron
ble 5
Published criteria for anemia in adult men and women a
Author Country Men Women
Wintrobe (64) USA 14.0 12.0Bierring (8) Denmark 13.0 11.5Berry et al. (5) Britain 13.5 11.5Walsh et al. (55) Australia 13.5 11.6Kilpatrick (39) Britain 12.5 12.0Scott and Pritchard (48) USA - 12.0Garby et al. (29) Sweden - 11.5Natvig and Vellar (46) Norway 14.0 12.5Hallberg et al. (31) Sweden 13.0 12.0WHO (63) Composite series 13.0 12.5Dacie and Lewis (19) Composite series 13.5 11.5Davis et al. (20) Australia 13.3 11.9Weatherburn et al. (61) Canada 12.5 10.8
a Hb gm per cent below which anemia occurs: Mean-2 SD
108

Table 6
WHO criterio for the diagnosis of anemia (63)
Hb gm/100 ml
Children:6 months to 6 years 11 a6 years to 14 years 12
Adult females:non-pregnant 12pregnant 11
Adult males 13
a >95 per cent of normal subjects have Hb concen-trations higher than the values given. However, upwardcorrection must be made for high altitudes.
stores are depleted by the time the Hb starts tofall. At this stage, however, the Hb level,although suboptimal for the patient, may be stillwithin the normal range and an examination ofthe blood film may not reveal any significantmorphological changes. In a study of apparentlyhealthy adults, Natvig and Vellar (46) found ahigher incidence of subnormal MCHC valuesthan of subnormal Hb values which led themto suggest that a subnormal MCHC might be auseful index of mild uncomplicated iron de-ficiency in cases where the Hb concentration isstill within the normal range. These subjects
responded to iron therapy with a rise in theMCHC to normal and an increase in the Hbconcentration, even when this was initiallywithin the normal range (Table 7). Hallberget al. (31), using the absence of reticular ironin the bone marrow as an index of iron de-ficiency, showed that there was a considerableoverlap of the frequency histograms of Hb levelsof women with and without reticular iron in themarrow, but that the Hb levels of the lattergroup were shifted towards lower values(Figure 2).
The optimal Hb concentration will thereforebe underestimated if subjects with latent irondeficiency are not excluded from the populationsample, and, furthermore, the prevalence of irondeficiency may be underestimated if only anemicare considered. Some epidemiologists may arguethat this is of little clinical significance in rela-tion to symptoms and physical activity (27, 28,51), while others suggest that even slight irondeficiency may affect work capacity (6, 32). Innutrition surveys, however, where it is impor-tant to know the full extent of the problem, itis essential to have sensitive tests for iron de-ficiency, in addition to the measurement of Hbconcentration and MCHC, which can be ap-
Normal Lotent Iron Early Iron Late iron Tissue IronDeficiency Deficiency Deficiency Deficiency
Anemia Anemia
"i! ia I a
R-E MarrowIron - Normal
TransferrinSaturation l 30-45%
Anemia o- Absent
Reduced Absent Absent Absent
30-45% <15% <10%
Absent Normocytic Microcyticnorma- hypo-
chromic chromic
Sideroblaosts - 40-60% 40-60% <10% <5%
<10%
Microcytichypo-
chromic
Spoon noilsGlossitisDysphaogia
Figure 1. Sequential changes (from left to right) in the development of irondeficiency. From Simon, Giblett, and Finch (50). Rreproduced by permission ofUniversity of Washington Press, Seattle.
109

Table 7
Effect of iron therapy on the Hb and MCHC of 25 men and 23 women whose initialMCHC was subnormal (i.e. < 30.5%) a
Men b Women c
Duration Mean Mean Mean Meanof iron Hb MCHC Hb MCHC
therapy (gm%) (%) (gm%) (%)
Before iron 14.54 29.6 12.88 29.0After 1 month 15.42 33.8 13.80 32.7After 2 months 15.37 33.5 13.78 32.2After 3 months 15.67 34.0 14.25 33.6
Normal 15.7 33.6 14.3 33.6
a From Natvig and Vellar (46).b Only 3 of the 25 men had Hb <14 gm per cent.c Only 8 of the 23 women had Hb <12.5 gm per cent.
5.0
U
E 2.0
1.0
E 0.5
I---
2 0.2o 01rc
0.1
2a
oo00a
00
00
AOa
a* a
o<...............
.. . .. .
o
A o
....-...... .......... ..........-·.. .... . .-....-.. .. ...-.......
1 2 3BONE MARROW IRON GRADE
..,........::::::::::
:.'.'. '.."............ ......
4.. .. .
0-
7 8 9 10 11 12 13 14 15 16Hb 9/100 ml
- ret. iron grade: traces-m
…---- no ret. iron
Figure 2. Comparison of the frequency histograms ofhemoglobin concentrations of 193 women who had stain-able iron in the bone marrow (continuous line) and 67women who lacked such iron. From Hallberg et al. (31).Reproduced by permission of Almqvist and Wiksells,Uppsala.
BROZOVIC ( 1970 )
Figure 3. Relationship between the in vitro uptake ofFe`9 by reticulocytes and stainable iron in the bonemarrow in 33 anemic patients (Hb 5.0 to 10.5 gmper cent) suffering from conditions known to be associatedwith iron deficiency. The stippled area indicates thenormal range of Fe59
uptake by reticulocytes. Normalamounts of iron in the bone marrow are indicated byGrades 2 and 3; reduced iron by Grades 0 and 1;increased iron by Grade 4. Circles represent results inmales; triangles females. Closed symbols indicate normaland open symbols increased Fe69 uptake by reticulocytes.From Brozovi¿ (10).
110
25
20.
15-
10
Si

plied to large population samples. In this respectthe assessment of bone marrow iron, althoughprobably the best index of body iron status, isnot a practical proposition. On the other hand,there is a marked overlap between normal andiron-deficient subjects by the biochemical testsof iron deficiency (serum iron, TIBC, and per-centage transferrin saturation) (31). Prelim-inary observations by Brozovic (10), followingup an observation by Najean et al. (45) suggestthat the in vitro uptake of transferrin-boundFe5 9 by reticulocytes correlates well with bonemarrow iron stores in uncomplicated iron de-ficiency. However, in the hypochromic anemiaof chronic inflammatory or neoplastic disorders,the in vitro reticulocyte uptake of Fe59 may notaccurately reflect bone marrow iron stores (Fig-
I20 u-
I00 1-
a-
u-
u.
oi 80 r
60 - - - - -
na404^
20 -
o
ure 3), but correlates well with response to irontherapy (10). This is a simple and rapid in vitrotest which may prove useful in the interpreta-tion of equivocal serum iron and TIBC results,and may well have a useful application in nutri-tion surveys.
Vitamin B12 deficiency
The development of sensitive and specificmicrobiological assays for B12 in serum andother tissues has made it possible to diagnosedeficiency at an early stage, and it is now wellrecognized that a person may have severe B,,2deficiency before the onset of anemia (Figure 4).However, careful examination of the blood filmand bone marrow of such patients will revealearly megaloblastic changes, which are reversible
1
1
11
O
O
t o
1
I_
'oI; o
o oo
I o
3 o
-- i-- o -o
o
D
o
4-
o OO o I
0 20 40 60 80 100
Haemeglobin /e
Figure 4. Relationship between the serum Bi2 and hemoglobin concentrations (100per cent= 14.8 gm/100 ml) of 92 patients with pernicious anemia. The starred circlesindicate patients with subacute combined degeneration of the cord (SACD). FromAnderson (1).
111
T Iof lo
o o° I o 1 o 4
o 8 o
0o 0 o
o o ¡·* +
o 0> 1 0 4. 00o14.. 1~r.,a o
1I

by treatment with B12. This treatment will alsoraise the Hb concentration, even when the ini-tial Hb level is within the normal range.
Most of our knowledge of the patho-physiological effects of B12 deficiency in manhas been derived from the study of perniciousanemia. The non-anemic stage of pernicious
16
14
12
10
8
6
4
2
o
.
e
lo
"'i" +1 S.D.
ee
NEAN(59 Cases)
-1 S.D.
Hbin S.A.C.D. anduncomplicated PA
Figure 5. Hemoglobin concentrations (gm/100 ml) of 17patients with SACD (closed circles) compared with themean hemoglobin concentrations (+ 1 SD) of 59 patientssuffering from uncomplicated pernicious anemia. FromWaters and Mollin (60). Reproduced by permission ofthe Wellcome Trust.
anemia may be asymptomatic-"latent" perniciousanemia (7, 14, 43, 65), but such cases are rarelydetected in clinical practice except by chance orby deliberate screening for B12 deficiency. How-ever, patients with severe B,, deficiency maysuffer serious neurological damage even in theabsence of anemia. As a group, patients withsubacute combined degeneration of the spinalcord (SACD) tend to have higher Hb levelsthan patients with uncomplicated overt perni-cious anemia (Figure 5), although the serumB12 levels are as low as in severe perniciousanemia (Figure 6). Patients may also present,during the non-anemic stage of B1 2 deficiencywith a wide range of less specific symptoms in-cluding psychosis, glossitis, paresthesia, infertil-ity, and such vague comrplaints as lethargy,apathy, and anorexia (59).
Although B1 2 deficiency may cause a widerange of symptoms before the onset of anemia,the pathogenesis of anemia in severe B 2,, de-
RANGEj MEAN iRANGE MEAN IRANGE;MEANR.B.CM/cmrmm 38-47i 4.1 3'852 4 1 142-5 0 4 4
Hb-G.7. 130-1501 139 12413 13 4 133-156, 14'5SERUM 112 45-110 ' 75 -20-50 <30 35-135' 5
1I80- o@ez eO
zo 0u s 00 0
Al 4 0
-- 0 0 0
E'"' *00000000
d 20- 0000
u)
EARLYPERNICIOUS
ANAEMIA
SUBACUTE IPERNICIOUSCOMBINED ¡ANAEMIAWITH
DEGENERATION GLOSSITIS
Figure 6. The serum B1, concentrations in: (1) a groupof patients with early pernicious anemia who were notanemic and not complaining of symptoms of B. deficiency;(2) a group o4 patients with SACD without anemia; and(3) a group of non-anemic patients with pernicious anemiawhose only symptom was glossitis. From Mollin (43). Re-produced by permission of Athlone Press, London.
112
, · , ,
a

ficiency is still uncertain. As already pointedout, there is no correlation between the serumB1 2 concentration and the Hb concentration. Onthe other hand, there is a progressive fall in theserum folate level with increasing anemia inpatients with pernicious anemia, which is in-dependent of the serum B12 level (Figure 7)
SERUM B12RANGEMEAN
40
_ 30
E
1--
u,
n
:
, 10
0
(58). It is therefore tempting to suggest thatfolate deficiency precipitates the onset of anemiain pernicious anemia. However, very few pa-tients with pernicious anemia have serum folatelevels in the range found in overt folate de-ficiency (58). Nevertheless, owing to the postu-lated "B12 block" in the utilization of folate in
6-10 > 10
HAEMOGLOBIN q/lOOmlFigure 7. Serum folate (L. casei) concentrations of 119 patients with perniciousanemia in relation to the degree of anemia. Open circles indicate patients withSACD. The continuous oblique line joins the mean serum folate concentration in eachgroup; the differences between the means were highly significant (P < 0.001). Theserum B12 concentration (range and mean) for each group is indicated at the top ofeach column. The broken horizontal lines at 6 and 18 mugm/ml (ngm/ml) indicate therange of serum folate concentrations found in 95 per cent of normal subjects. FromWaters (56).
113

pernicious anemia (12, 35, 57, 58), it is possiblethat signs of folate deficiency might appear ata higher serum folate level than in the absenceof B12 deficiency. Thus, in a particular patient,the onset of megaloblastic anemia would dependnot only on the serum B,, level, but also on theserum folate level necessary to overcome the"B1 2 block" (56). Whatever the explanation, itis significant that in patients with severe B12deficiency, a surfeit of folate in the diet, whethernaturally as in vegans (56, 66, 67) or by pro-phylactic supplementation with folic acid (3, 15,17, 18, 23, 26, 54) will tend to delay the hema-tological manifestations of B12 deficiency whileallowing neurological and other complicationsto develop. In fact among patients with perni-cious anemia, those with SACD tend to havethe highest Hb and serum folate concentrationsand the lowest serum B12 concentrations (43, 58,60).
Folate deficiency
As in iron and B12 deficiency, significantfolate deficiency may occur while the Hb con-centration is still within the normal range.Furthermore, at this early stage of deficiency,morphological changes in the blood and bonemarrow are minimal and may be overlooked,especially when large numbers of films have tobe examined, as in a busy diagnostic laboratoryor in population surveys. Consequently, thepresence of early folate deficiency may be missedunless specific diagnostictests are carried out.
Herbert (34) has documented the sequenceof biochemical and hematological changes in thedevelopment of folate deficiency in a healthyadult whose dietary folate intake was reducedto approximately 5 /zg per day of Lactobacilluscasei-active folate (Figure 8). A fall in theserum folate concentration (after only threeweeks) was the first indication of developingfolate deficiency, followed much later (after 17weeks) by a fall in the red cell folate concentra-tion. The first hematological abnormality toappear was nuclear hypersegmentation of theneutrophil leukocytes as indicated by an increase
DIETARY FOLIC ACID DEPRIVATION IN MAN:BIOCHEMICAL AND HEMATOLOGIC SEQUENCE OF EVENTS
LOW SERUM FOLATE
n i HYPERSEGMENTATION
I-] E HIGH URINE FIGLU
Z LOW RBC FOLATE
L MACROOVALOCYTOSIS
[ MEGALOBLASTIC MARROW
| ANEMIA
2 4 6 8 l0 12 14 16 1§ 20WEEKS
Figure 8. Sequence of biochemical and hematologicalchanges in the development of folate deficiency due to
sudden reduction of dietary folate in a previously healthy
adult mole. From Herbert (34). Reproduced by per-mission of the Association of American Physicions.
in the mean lobe count (after seven weeks).However, definite macrocytosis appeared muchlater (after 18 weeks) followed by megaloblasticchange in the bone marrow (after 19 weeks)and last of all by anemia. Similar observationshave been reported by Mollin and Hoffbrand(44), who compared these various parametersof folate deficiency in a number of patients suf-fering from a wide variety of hematological andother conditions.
The red cell folate concentration is partic-ularly useful in assessing the severity of folatedeficiency in the absence of megaloblastic ane-mia in a patient who nevertheless has a sub-normal serum folate concentration. In this re-spect, it is probably the best single index ofsignificant folate deficiency when assessing theincidence of deficiency of this vitamin in pop-ulation surveys.
Table 8 summarizes some recent findings inrelation to the foregoing from a recent surveyof health of old people (65 years and over)organized by the United Kingdom Ministry ofHealth and Social Security (to be published).These results show that there was a significantdeficiency of iron, B12 and folate in subjectswhose Hb levels were within the accepted nor-mal range, as well as in the anemic subjects. Onthe other hand, there was no biochemical evi-dence of deficiency of these nutrients in a large
114
,1
r

Table 8
Incidence of iron, B12 and folate deficiency in healthy geriatric subjects ( 65years) in relation to Hb concentration
FolateIron deficiency B12 deficiency deficiency
Hb No. (Transferrin (Serum B12 (RCFconcentration studied Saturation < 16%) <100 pg/ml) <100 ng/ml)
Normal a 616 17.4% 0.8% 2.6%9Subnormal 52 53.0% 2.0% 4.0%Total 667 20.0% 0.9% 2.7%
a Male Hb > 13 gm per cent; female Hb > 12 gm per cent.
proportion of subjects with subnormal Hblevels. This raises the possibility that the arbi-trary lower normal Hb level may have been settoo high for old people (males 13 gm per cent,females 12 gm per cent), and similar observa-tions have been reported by Walsh et al. (55),Vellar (53), Kaufman et al. (38), and Weather-burn et al. (61). The explanation for theselower Hb levels in old people is uncertain, butthe final report of the recent Ministry of Healthsurvey may help to elucidate this. Apart frompossible nutritional differences, other factors pe-culiar to this age group may be important insuppressing hemopoiesis, and in this respect,altered hormonal balance and diminished phys-ical activity may be significant and requireinvestigation.
In Table 8, iron deficiency was assessed interms of a transferrin saturation less than 16per cent, which probably overestimates the ex-tent of true iron deficiency. Using a combina-tion of parameters (serum iron <65 ,agm percent and total iron-binding capacity (TIBC)>410 ,agm per cent), the incidence of iron de-ficiency in the same population was approx-imately 9 per cent (Brozovié, unpublished data)compared to 20 per cent, based on transferrinsaturation alone. There was a surprisingly lowincidence (2.7 per cent) of significant folatedeficiency, as determined by a red cell folateconcentration less than 100 ngm/ml, but a muchhigher incidence (14 per cent) of mild or in-cipient folate deficiency as indicated by a lowserum folate concentration (<3 ngm/ml). Theincidence of approximately 1 per cent of serum
B1 2 concentrations less than 100 pgm/ml (thatis, in the range found in overt pernicious ane-mia) is ten times that of "clinical" perniciousanemia in Britain reported by Scott (49). Thesurvey also revealed a 10 per cent incidence ofserum B1 2 concentrations in the borderline range(100-200 pgm/ml). The clinical significance ofthis borderline range is uncertain, but such levelsoccur in early pernicious anemia (14, 43), atro-phic gastritis (62), and in many patients follow-ing partial gastrectomy (22, 36), which prob-ably indicates mild B12 deficiency. The surveyhas therefore revealed a much higher incidenceof potential B12 deficiency in old people thanpreviously suspected.
Physiological adaptation to suboptimal Hb levels
Although deficiencies of B12 and folate (andpossibly iron) may produce definite symptoms intheir own right, it is still an open questionwhether mild anemia per se results in any func-tional impairment or lack of well-being owingto the existence of adaptive mechanisms whichcompensate for the decrease in arterial blood02 content due to anemia.
Perhaps the most important of these mech-anisms is the decreased affinity of Hb for 02in anemia (Figure 9), which is mediated by anincrease in red cell 2, 3-diphosphoglycerate (2,3-DPG), an intermediate metabolite in the redcell glycolytic (Emden-Meyerhoff) pathway (4,16). In vivo studies have shown that there isan increase in red cell 2, 3-DPG at high altitude(25, 40, 52), in cardiac failure (68), and in ane-
115

31 r
30 h
29 -
28
27
26O
I I 1
5 10 1'HAEMOGLOB IN g%
Figure 9. Average change of P5o (pH 7.4) (i.e., POa inmm Hg required for 50 per cent saturation of bloodwith oxygen at pH 7.4) as a function of hemoglobinconcentration. From Lenfont et al. (40). Reproduced bypermission of Plenum Press, New York.
mia (52). The linear relationship between 2,3-DPG and Hb concentration demonstrated inanemia and at high altitudes also exists inhealthy subjects with normal Hb levels (Figure10) (24, 52). The increase in 2, 3-DPG is alsoassociated with an increase in adenosine triphos-phate (ATP), but the overall effect of 2, 3-DPGon Hb-O2 dissociation is about nine times thatof ATP (52).
Changes in pH may also affect the Hb-O2
dissociation curve (the Bohr effect)-acidosisleading to a right shift and alkalosis to a leftshift. In a recent study of anemic patients,Torrance et al. (52) showed that acidosis wasassociated with a smaller increment in 2, 3-DPG
9r
O 5 10HAEMOGLOB IN 9g
15
Figure 10. Average change of intraerythrocyte DPG(2, 3-diphosphoglycerate) as a function of hemogiobinconcentration. From Lenfant et al. (40). Reproduced bypermission of Plenum Press, New York.
than expected from the Hb concentration, andvice versa for alkalosis (Figure 11). The relativeeffect of the pH and DPG adaptive mechanismswas studied in subjects exposed to sudden hy-poxia of altitude (40). These workers showedthat when normal subjects arrived at highaltitude there was a rapid increase in 2, 3-DPG(t/ 2 approximately 6 hours), which reached amaximum by 24 hours. At the same time therewas a marked alkalosis due to hyperventilation,which shifts the in vivo Hb-O2 dissociationcurve to the left, thus aggravating the anoxia
already present, and possibly enhancing therapid formation of DPG, which then shifts thecurve back to the right.
The DPG mechanism is therefore of funda-mental importance in the rapid metabolic adap-tation to tissue anoxia, whether this is due toanemia or to cardiopulmonary causes. In mildto moderate anemia, this mechanism may main-tain adequate tissue oxygenation without affect-ing cardiopulmonary function, and thus accountfor the minimal symptomatology of such pa-tients. The precise relationship between thismechanism and erythropoietin stimulation is un-certain, but probably the erythropoietin mech-anism is stimulated when the DPG mechanism
is unable to keep pace with tissue 02 demand.
4 /
-PRED-ICTED DPG
21/
7.3 7.4 7.5pH
Figure 11. Average deviation of measured DPG fromcalculated DPG (using the regression line DPG = - 0.194Hb + 8.89) as a function of arterial pH. These resultsfrom Lenfant et al. (40) were based on data from agroup of anemic patients at Medellín, Colombia. Repro-duced by permission of Plenum Press, New York.
116
EE
<D
ti.
8
.7
E46
CL
5
4 E
Summary and conclusions
The differentiation between anemia and nor-mality based on an arbitrary Hb concentrationremains a statistical concept. The results ofrandom surveys of Hb concentrations, althoughrepresentative of the group under study, maynot represent optimal levels. This shortcomingmay be largely of academic interest when themain objective is the detection and treatment ofovert anemia in underdeveloped countries wherenutritional anemia is a serious public healthproblem. On the other hand, in clinical med-icine, the individual patient's optimal Hb con-centration is the significant parameter and theacceptance as normal of an Hb concentrationwithin the statistical normal range may resultin delayed diagnosis of latent deficiencies ofiron, B12 or folate, which may reduce the Hbconcentration below its optimal level in ap-parently healthy subjects. However, carefulscreening of the blood film and specific tests foriron, B12 and folate deficiencies, especially inpatients and population groups at risk, willgreatly help in the early detection of these de-ficiencies before the onset of overt anemia orother complications.
To make this a feasible proposition for clinicalscreening and nutritional surveys, it will benecessary to automate the measurement of asmany nutritional parameters as possible. Pro-gress has been made in the automation of meth-ods for the measurement of serum iron andTIBC using auto-analyzers (11, 30, 69, 70). Themicrobiological assay of folate in serum andwhole blood has also been successfully auto-mated (42). This was made possible by theuse of a chloramphenicol-resistant strain of theassay organism, Lactobacillus casei (21), whichobviated the need for aseptic conditions. Thismethod is a simplification of the standard man-ual methods (33, 57) and has the capacity fordealing with 80 to 100 specimens in duplicateper hour compared with approximately 200specimens per week by the manual methods.This tremendous work capacity makes it espe-cially suitable for providing a regional diagnos-
tic service and nutritional surveys of large pop-ulation groups. The same principles are nowbeing applied to the assay of B 2,, in serum(Millbank et al. To be published).
The establishment of normal values for Hbconcentration and various nutrients implies thecomparability of results between different lab-oratories and necessitates standardization of themethods used. The International Committee forStandardization in Haematology (37) has maderecommendations for the measurement of Hbusing a cyanmethemoglobin solution as a stan-dard, and WHO has established central referencelaboratories to standardize the assays of iron,vitamin B12 and folate (63). The function ofthese laboratories is to distribute standards, tocorrelate the results of the participating labora-tories, and to advise on the possible cause ofdiscrepancies where these arise.
Correlation between Hb concentration andfunctional capacity is still an open question,although evidence is available that physiologicaladaptation to suboptimal Hb levels can main-tain tissue oxygen supply without significantcardiopulmonary embarrassment. Furthermore,with the Hb concentration, as with other phys-iological parameters, conditions other than nu-trition may affect the level of normality at dif-ferent ages and under different environmentalconditions.
From these observations it is apparent that,while it is still essential to define anemia as aparameter of health, the Hb concentration can-not be regarded as a sensitive index of nutri-tional status. This is better determined by directmeasurements of the nutrients concerned andwhere possible by careful examination of theblood film, especially in patients and populationgroups at risk.
Acknowledgments
I am most grateful to Dr. B. Brozovic for hishelp and advice on the sections dealing withiron deficiency and in particular for permissionto reproduce Figure 3. I also wish to thankDr. J. Torrance for generously allowing me toquote his paper (52) which is still in press.
117

REFERENCES
1. ANDERSON, B. B. Investigations into the Eu-glena method of assay of vitamin B 2,,: the resultsobtained in human serum and liver using an im-proved method of assay. Ph.D. Thesis, Universityof London, 1965.
2. BAINTON, D. F., and C. A. FINCH. The diag-nosis of iron deficiency anemia. Amer 1 Med37: 62-70, 1964.
3. BALDWIN, J. N., and D. J. DALESSIO. Folic acidtherapy and spinal cord degeneration in perniciousanaemia. New Eng 1 Med 264: 1339-1342, 1961.
4. BENESCH, R., and R. E. BENESCH. Intracellularorganic phosphates as regulators of oxygen releaseby haemoglobin. Nature (London) 221: 618-622,1969.
5. BERRY, W. T. C., P. J. COWIN, and H. E.MAGEE. Haemoglobin levels in adults and children.Brit Med j 1: 410-412, 1952.
6. BEUTLER, E., S. E. LARSH, and C. W. GURNEY.Iron therapy in chronically fatigued, non-anemicwomen: a double-blind study. Ann Intern Med52: 378-394, 1960.
7. BEVERIDGE, B. R., R. M. BANNERMAN, J. M.EVANSON, and L. J. WITTs. Hypochromic anaemia:
a retrospective study and follow-up of 378 in-patients. Quart 1 Med 58: 145-161, 1965.
8. BIERRING, E. Hemoglobinometry, standardisa-tion of hemometers and heinoglobin norm. NordMed 6: 953-958, 1940.
9. BOTHWELL, T. H., and C. A. FINCH. IronMetabolism. Boston, Little, Brown, 1962.
10. BRozovIC, B. Uptake of radioactive iron byreticulocytes in vitro. Method of assay and its valueas a test for iron deficiency. Ph.D. Thesis, Univer-sity of London, 1970.
11. BROzovIC, B., and J. COPESTAKE. Semi-auto-
mated micromethod for estimating the unsaturatediron-binding capacity of serum using radioactiveiron. 1 Clin Path 22: 605-608, 1969.
12. BUCHANAN, J. M. The function of vitaminB1 2 and folic acid coenzymes in mammalian cells.Medicine 43: 697-709, 1964.
13. BUREAU OF NUTRITION SURVEYS. Recommen-dations with Regard to Methods of Investigation.London, London Hospital, 1945. J. R. Marrack(ed.).
14. CALLENDER, S. T., and G. H. SPRAY. Latentpernicious anaemia. Brit ¡ Haemat 8: 230-240, 1962.
15. CHALLENER, W. A., and D. R. KORST. Pitfallsin diagnosis and treatment of pernicious anemia.Amer ] Med Sci 240: 226-231, 1960.
16. CHANUTIN, A., and R. R. CURNISH. Effects oforganic and inorganic phosphates on the oxygen
equilibrium of human erythrocytes. Arch BiochemBiophys 121: 96-102, 1967.
17. CONLEY, C. L., and J. R. KREVANS. Develop-ment of neurologic manifestations of perniciousanemia during multivitamin therapy. New Eng JMed 245: 529-531, 1951.
18. CROSBY, W. H. Danger of folic acid in multi-vitamin preparations. Military Med 125: 233-235,1960.
19. DACIE, J. V., and S. M. LEWIS. PracticalHaematology 4 ed. London, Churchill, 1968.
20. DAVIS, R. E., G. R. H. KELSALL, N. S. STEN-HOUSE, H. J. WOODLIFF, and J. T. WEARNE. Haemo-globin and haematocrit measurements in a com-munity. Med ¡ Aust 2: 1196-1200, 1969.
21. DAVIS, R. E., D. J. NICOL, and A. KELLY. Anautomated method for the measurement of folateactivity. ¡ Clin Path 23: 47-53, 1970.
22. DELLER, D. J., and L. J. WITTS. Changes inthe blood after partial gastrectomy with special ref-erence to vitamin B12 . 1. Serum vitamin B12,heamoglobin, serum iron and bone-marrow. Quart1 Med 31: 71-88, 1962.
23. DE WIT, J. C. Neurologic complications inpernicious anaemia following self-medication withfolic acid containing multivitamin preparation: case.Geneesk Gids 30: 408-410, 1952.
24. EATON, J. W., and G. J. BREwER. The rela-tionship between red cell 2,3-diphosphoglycerate andlevels of hemoglobin in the human. Proc Nat AcadSci USA 61: 756-760, 1968.
25. EATON, J. W., G. J. BREWER, and R. F. GROVER.Role of red cell 2,3-diphosphoglycerate .in the adap-tation of man to altitude. ! Lab Clin Med 73:603-609, 1969.
26. ELLISON, A. B. C. Pernicious anemia maskedby multivitamin preparations containing folic acid.[AMA 173: 240-243, 1960.
27. ELWOOD, P. C. Some epidemiological prob-lems of iron deficiency anaemia. Proc Nutr Soc 27:14-23, 1968.
28. ELWOOD, P. C., W. E. WATERS, W. J. W.GREENE, P. SWEETNAM, and M. M. WOOD. Symp-toms and circulating haemoglobin level. J ChronDis 21: 615-628, 1969.
29. GARBY, L., L. IRNELL, and I. WERNER. Irondeficiency in women of fertile age in a Swedishcommunity. 1. Distribution of packed cell volumeand the effect of iron supplementation. Acta SocMed Upsalien 72: 91-101, 1967.
30. GIOVANNIELLO, T. J., G. Di BENEDETTO, D. W.PALMER, and T. PETERS, JR. Fully and semi-auto-mated methods for the determination of serum iron
118

and total iron-binding capacity. I Lab Clin Med71: 874-883, 1968.
31. HALLBERG, L., J. HALLGREN, A. HOLLENDER,
A.-M. HOGDAHL, and G. TIBBLIN. Occurrence ofiron deficiency anaemia in Sweden. In Symposia ofSwedish Nutrition Foundation VI: 19-27, 1968.
32. HALLBERG, L., A.-M. HOGDAHL, L. NILSSON,
and G. RYBO. Menstrual blood loss and iron defi-ciency. Acta Med Scand 180: 639-650, 1966.
33. HERBERT, V. The assay and nature of folicacid activity in human serum. 1 Clin Invest 40:81-91, 1961.
34. HERBERT, V. Experimental nutritional folatedeficiency in man. Trans Ass Amer Physicians 75:307-320, 1962.
35. HERBERT, V., and R. ZALUSKY. Interrelation-ships of vitamin B12 and folic acid metabolism:folic acid clearance studies. 1 Clin Invest 41: 1263-1276, 1962.
36. HINES, J. D., A. V. HOFFBRAND, and D. L.MOLLIN. The hematologic complications followingpartial gastrectomy. A study of 292 patients. Amer1 Med 43: 555-569, 1967.
37. INTERNATIONAL COMMITTEE FOR STANDARDISA-
TION IN HAEMATOLOGY. Recommendations forHaemoglobinometry in Human Blood. Brit 1Haemat 13: (Suppl), 71-75, 1967.
38. KAUFMAN, B. J., D. R. GRANT, and J. A.MooRHOUSE. An analysis of blood urea nitrogenand hemoglobin values in a population screened fordiabetes mellitus. Canad Med Ass 1 100: 744-747,1969.
39. KILPATRICK, G. S. Prevalence of anaemia inthe general population. A rural and an industrialarea compared. Brit Med 1 2: 1736-1738, 1961.
40. LENFANT, C., J. TORRANCE, E. ENGLISH, C. A.FINCH, C. REYNAFARJE, J. RAMOS, and J. FAURA.
Effect of altitude on oxygen binding by hemoglobinand on organic phosphate levels. 1 Clin Invest 47:2652-2656, 1968.
41. MEDICAL RESEARCH COUNCIL. UNITED KING-
DOM. Haemoglobin Levels in Great Britain in 1943.(Special Report Series No. 252, 1945.)
42. MILLBANK, L., R. E. DAVIS, M. RAWLINS, andA. H. WATERS. Automation of the assay of folatein serum and whole blood. 1 Clin Path 23: 54-59,1970.
43. MOLLIN, D. L. The megaloblastic anaemias.Lectures Sci Basis Med 7: 94-126, 1957-58.
44. MOLLIN, D. L., and V. HOFFBRAND. The diag-nosis of folate deficiency. Series Haemat 3: 1-18,1965.
45. NAJEAN, Y., N. ARDAILLOU, M. MULMANN,and J. BERNARD. Etude de compartiments non-héminiques du fer. 3. Cinétique du fer et synthese
héminique "in vitro" dans le réticulocyte patholog-ique. Nouv Rev Franc Hémat 4: 55-68, 1964.
46. NATVIG, H., and O. D. VELLAR. Studies onhemoglobin values in Norway. 8. Hemoglobin,hematocrit and MCHC values in adult men andwomen. Acta Med Scand 182: 193-205, 1967.
47. NATVIG, H., O. D. VELLAR, and J. ANDERSEN.Studies on hemoglobin values in Norway. 7. Hemo-globin, hematocrit and MCHC values among boysand girls aged 7-20 years in elementary and gram-mar schools. Acta Med Scand 182: 183-191, 1967.
48. SCOTT, D. E., and J. A. PRITCHARD. Iron defi-ciency in healthy young college women. lAMA199: 897-900, 1967.
49. SCOTT, E. Prevalence of pernicious anaemia inGreat Britain. 1 Coll Gen Pract 3: 80-84, 1960.
50. SIMON, E. R., E. R. GIBLETT, and C. A. FINCH.The Red Cell Manual. Seattle, University of Wash-ington Press, 1966.
51. SIMPSON, J., and C. A. GOURLEY. The signifi-cance of anaemia among women factory workers.To be published.
52. TORRANCE, J., P. JACOBS, A. RESTREPO, J. ESCH-BACH, C. LENFANT, and C. A. FINCH. Intraerythro-cytic adaptation to anemia. New Engl 1 Med InPress.
53. VELLAR, O. D. Studies on hemoglobin valuesin Norway. 9. Hemoglobin, hematocrit and MCHCvalues in old men and women. Acta Med Scand182: 681-689, 1967.
54. VICTOR, M., and A. A. LEAR. Subacute com-bined degeneration of the spinal cord. Amer 1 Med20: 896-911, 1956.
55. WALSH, R. J., B. J. ARNOLD, H. O. LANCASTER,M. A. COOTE, and H. COTTER. A study of Haemo-globin Values in New South Wales. (NHMRCSpecial Report Series No. 5. Canberra, 1953).
56. WATERS, A. H. Folic acid metabolism in themegaloblastic anaemias. Ph.D. Thesis, Universityof London, 1963.
57. WATERS, A. H., and D. L. MOLLIN. Studieson the folic acid activity of human serum. 1 ClinPath 14: 335-344, 1961.
58. WATERS, A. H., and D. L. MOLLIN. Observa-tions on the metabolism of folic acid in perniciousanaemia. Brit 1 Haemat 9: 319-327, 1963.
59. WATERS, A. H., and D. L. MOLLIN. VitaminB12 . In J. C. Dreyfus and B. Dreyfus (eds.), Inter-national Encyclopedia of Pharmacology and Thera-peutics, Section 36. Oxford, Pergamon, 1971, pp.1-69.
60. WATERS, A. H., and D. L. MOLLIN. Neuro-logical aspects of vitamin B1 2 and folate deficiency.In Cassava Cyanide and Nutritional Neuropathy.Proc Wellcome Symp (London) 1969. In Press.
119

61. WEATHERBURN, M. W., B. J. STEWART, J. E.LOGAN, C. B. WALKER, and R. H. Allen. A surveyof hemoglobin levels in Canada. Canad Med Ass s102: 493-498, 1970.
62. WHITESIDE, M. G., D. L. MOLLIN, N. F.COGHILL, A. W. WILLIAMS, and B. ANDERSON. Theabsorption of radioactive vitamin B12 and the secre-tion of hydrochloric acid in patients with atrophic
gastritis. Gut 5: 385-399, 1964.
63. WORLD HEALTH ORGANIZATION. Nutritionalanaemias. (Tech Rep Ser No. 405, 1968.)
64. WINTROBE, M. M. Blood of normal men andwomen. Bull Johns Hopk Hosp 53: 118-130, 1933.
65. WITTS, L. J. The development of perniciousanaemia. Acta Haemat (Basel) 24: 1-6, 1960.
66. WOKES, F., J. BADENOCH and H. M. SINCLAIR.
Human dietary deficiency of vitamin B12. Amer IClin Nutr 3: 375-382, 1955.
67. WOKES, F., and A. D. M. SMITH. Vitamin B1 2
and vegetarians. In Europaisches Symposion fberVitamin B]2 und intrinsic factor. 2. Hamburg, 1961.Stuttgart, Enke, 1962, pp. 602-606.
68. WOODSON, R. D., J. D. TORRANCE, and C.LENFANT. Oxygen transport in low cardiac outputhypoxia. Physiologist 12: 399, 1969. Abstract.
69. YOUNG, D. S., and J. M. HICKS. Method forthe automatic determination of serum iron. 1 ClinPath 18: 98-102, 1965.
70. ZAK, B., and E. EPSTEIN. Automated deter-mination of serum iron. Clin Chem 11: 641-644,1965.
120

ENDOCRINE MECHANISM IN NUTRITIONAL ADAPTATION
Fernando Monckeberg B.
The literature on endocrine studies of mal-nourished children is presently in a state ofcontroversy and confusion.
This results from many considerations, pri-marily the tendency to oversimplify the etiologyof malnutrition, which, in fact, is a complexprocess influenced by many different factors thatin each geographical area may act in varyingways resulting in diverse clinical syndromes. Inconsequence of these variables, a conflictingterminology has developed; the same term hasa particular meaning for each author. Again,some of the controversial results can be explainedbecause the response to endocrine studies inmalnutrition varies. Patient response differs:(a) in accordance with the duration and degreeof malnutrition; (b) in accordance with theexistence of concomitant diseases; (c) the ageof the patient; (d) and finally the stage atwhich tests are performed-before or during re-covery. With respect to the last, from the bi-ochemical standpoint, recovery does not alwayscoincide in time with the initiation of weightincrease. For example, during treatment ofmarasmic infants, an increase in oxygen con-sumption has been observed (25), which pre-cedes increase in weight by several days.
Further confusion results from the fact thatfew authors provide a detailed description ofthe patients that they are studying, and hence,again, patients with different clinical character-istics are grouped under the same syndrome. Inview of the above, it is important to define theclinical characteristics of the patients that havebeen studied before reporting an experience.
Two types of malnutrition are generally recog-nized in children: marasmus and kwashiorkor.Marasmus is due to low calorie and proteinintake, whereas kwashiorkor is due mainly toprotein deficiency (23). In typical cases thesymptoms are, of course, quite characteristic;however, typical cases are exceptional, mostcases are of mixed etiology, and consequentlypresent a mixed symptomatology.
In order to clarify the two syndromes, typicalkwashiorkor cases are considered to be thosewhose etiology corresponds to a protein de-ficiency alone. In this type of malnutrition thedisease is acute, and the whole symptomatologyappears after a short period of protein deficiency.The child's growth has been normal or nearnormal during the first year of life, then sud-denly a protein restriction-due to many socio-economic factors-unchains the whole symptom-atology. Though this type of patient is veryinfrequent, they have been particularly selectedin order to study more clearly the effects ofprotein restriction upon the different biochem-ical parameters.
Selected marasmic patients correspond to thosewith malnutrition from their first months of life,and at one year of age they have almost the sameweight and height as at birth. These patientshad been breast-fed for a very short period oftime; they then all had a very serious hypoali-mentation withl very diluted milk, with or with-out the addition of carbohydrate. No evidenceof edema was found, and the changes of skinand hair, typical in kwashiorkor, were minimal
121

Figure 1. On the right in the photograph is a typicalseven-month-old marasmic patient.
or not present. The photograph shows a typicalseven-month-old patient (Figure 1).
3
14i
3 5 7 9 11n 13 1 7 21 23527 29
AGE Imon@u>.
Figure 2. A typical weight curve of a marasmic and akwashiorkor patient.
Both the marasmic and kwashiorkor cases se-lected were free of other concomitant diseases,and studies were initiated before treatment wasstarted. Figure 2 shows a typical weight curveof a marasmic and a kwashiorkor patient.
In the case of marasmic patients, when hypo-alimentation has been of long duration and hasbrought on growth retardation of 50 per centor more, the recuperation process takes a longtime to begin even when there are no signs ofinfection or of parasitic or other concurrentdiseases (21). It is, in fact, a frequent experiencethat for four months or more, neither clinicalimprovement nor an increase in weight can beobserved, in spite of a diet providing the propercalorie requirements for a normal child (120calories per kilogram per day). During this
Table 1
Balance data on severe marasmic mainutrition beforerecovery start
Case /o Reten-number Ingestion Urine Fecal tion
Phosphorus data (mg/kg/day)
1 169 76 79 82 140 61 54 173 210 94 99 54 231 110 111 45 167 92 74 06 169 87 81 0
Average 181 86 83 5
Potassium data (mg/kg/day)
1 2390 351 31 22 410 312 39 123 429 390 27 24 545 390 35 225 429 390 19 46 390 351 19 5
Average 430 364 28 8
Nitrogen data (mg/kg/day)
1 750 650 100 02 718 490 65 223 884 720 79 94 840 710 90 45 800 710 103 06 830 530 100 24
Average 803 635 89 9
122

period, the nitrogen balance may be negative oronly slightly positive, even though the absorp-tion of nitrogen is normal (26) (Table 1). Fur-thermore, the basal oxygen consumption is be-low normal, and it does not increase untilrecovery starts (26) (Figure 3).
In contrast, in the case of typical kwashiorkor,without other concomitant disease, the oxygenconsumption remains normal or near normalvalues and the recovery starts promptly withthe treatment (Figure 4).
Adrenal functionIn marasmic children there are many clinical
manifestations that conform to a diagnosis ofadrenal hypofunction. Recovery is slow anddifficult. Clinically they are characterized byweakness, apathy, skin pigmentation, electrolyteimbalance, severe diarrhea, and infections.
5.9
oo
o.or 3
o
e
2u
11-ch<>
-
*.
e.* .e
e.:: ei:1*
a*
Be
*:ea.
:@:*
e
e·
Normal
e
Experimentally, observations of these patientscan be summarized as follows: (a) marasmicinfants have a low sodium-retaining capacity(Figure 5). Normal infants at the same age
OorpE
Ox
z
z
o
O1
.m
z
oO
OE
1h.oe
*e
00
NORMAL KWASHIORKOR MARASMUS
e
e·
A
Figure 4. In typical cases of kwashiorkor, oxygen con-sumption remains normal or near normal values.
zoI--
Ld
ux
z
,Yr
z
o
e*,
e
e·
e
B
Figure 3. Basal oxygen consumption in marasmic patientis below normal and does not increase until recoverybegins. A = Marasmic patients during recovery; B =Marasmic patients before improvement began.
100
50
o
MALNOURISMED
- CONTROL
- -e-
DAYS 1 2 3 4
DIET WITHOUT Na
Figure 5. Sodium urinary excretion before and after adiet without sodium in 10 malnourished infants and sixnormal infants.
123
· ·
5
4
3
2
1
0
i

under a low sodium diet reduce the urinary Napractically to zero mEq/24 hours, whereas themarasmic, under the same test, continues to elim-inate this electrolyte in considerable amount, inspite of the fact that no Na has been adminis-tered in the diet (24), which suggests a deficitin the aldosterone secretion; (b) when largeamounts of water are administered, normal in-fants show a very similar diuresis of 58 per centbefore and 60 per cent after the administrationof cortisone. On the contrary, marasmic infantsexcrete only 50 per cent of the ingested waterbefore receiving cortisone, and this eliminationincreases significantly after cortisone to 78 percent (24) (Figure 6); (c) after stimulation withadrenocorticotrophic hormone (ACTH), infantswith severe marasmus show a lower urinary ex-cretion of 11-oxysteroids, 17-ketogenic, and 17-ketosteroids (24) (Figures 7, 8). Although ithas been shown that the urinary excretion of11-oxysteroids and 17-ketogenic steroids are un-reliable indices of adrenal function (12), it is
801
60
I
ESi8!
3
o50
---- HOnI4L WITHOUT CORTISOHE.... # WITH ,
- MALHOURISHED WITHOUT *- " WITH
interesting to observe that the response of themarasmic child is similar to normal childrenduring the first day, but the response decreasesafter two or three days of stimulation. The samehappens with the sodium-conserving capacity. Itis possible to assume that the same poor hor-monal secretion is produced when a marasmicchild experiences infection, dehydration, andother stresses.
The plasma cortisol level in marasmic patientshas been determined by Rav et al. (29) andalso by Alleyne and Young (2). Both papersgive very few details about the clinical char-acteristics of their patients, although both de-scribe a high level of plasma cortisol which fellwith recovery. This high level could be theresult of impaired breakdown and removal, orof over-production of cortisol. According toAlleyne and Young (2), it seems to be due toimpaired metabolism of cortisol, since a signif-icant increase of exogenous cortisol was observedin marasmic patients. The same authors describea good response from the adrenal gland aftercorticotrophin administration. Nevertheless, the
0.40'
0.35
Nr_
o
u
8x
1
0.30
0.25
0.20
0.15
0.10
0.0520 40 60 80
MINUTE5100 120 140
oFigure 6. After intake of large amounts of water,normal infants showed similar diuresis before (58%) andafter administration of cortisone (60%), whereas maras-tmic infants showed less diuresis before cortisone (50%)and a significant increase after administration of corti-sone (78%).
NORMAL
---- MALNOURISHED
1 2 3 . 4 5 6DAYS
A.C.T.H.
Figure 7. Urinary 11-oxycorticoids (mg/24 hrs.) in 10malnourished infants and six normal infants.
124

1.60NORMALMALNOURISHED ---
1.40
1.20
1.00 .--
L 0.80<4
0.60
0.401 2 3 4 5 6
DAYS
A.C.T.H
Figure 8. Urinary 17-ketosteroids in 10 malnourishedinfants and six normal infants during the administrationof ACTH (30 mg per doy).
response was studied only during a short periodof time and after a single dose of corticotrophin.
Gillman and Gillman (17) suggest that inmalnutrition there might initially be a phase of
adrenal hypofunction followed by adrenal ex-
haustion and atrophy. Castellano and Arroyave(11) claimed that the marasmic infants havehigh, while the kwashiorkor patients have lowglucocorticoid hormones. Lurie and Jackson(20) showed a significant reduction in excretionof 17-hydroxysteroids and 17-ketosteroids in mal-nourished children. As was pointed out in thebeginning, these contradictory results may bedue either to differences in the type of patientor to differences in terminology.
Thyroid function
Before recovery starts, the basal oxygen con-sumption of marasmic patients is significantlylower than that of normal children (25). Thethyroid radioiodine uptake is also lower, as isthe butanol-extractable iodine (BEI) (Table 2)
(5).After the administration of thyroid stimulat-
ing hormone (TSH), the marasmic patientscorrected the low values of radioiodine uptakefrom an average of 28 per cent to 50 per cent,which is very similar to the control group(Table 2). Therefore, it is probable that the
fundamental cause of the failure in the iodine
uptake was the absence of TSH.
The marasmic patients, as well as the controls,
showed increased BEI after TSH administra-
tion. Nevertheless, the average values attainedby the marasmic infants were significantly lower
than those of the control group. This result
ble 2
IT
` uptake, BEI, and oxygen consumption in marasmic and normal infants (before andafter TSH administration)
1 1 uptake BEI 02 consumptionInfants % (/ag/100 ml) (liters/hours/100 cm height)
Before TSH After TSH Before TSH After TSH Before TSH After TSH
39 ± 3.2 SD 60 + 3.6 SD 5.4 + 1.3 SD 7.9 - 1.7 SD 4.2 + 0.3 SD 4.2 + 0.4 SDNormal p < 0.001 p < 0.01
28 - 5.0 SD 50± 10.5 SD 3.4+- 0.9 SD 5.9 ± 0.5 SD 2.8 + 0.4 SD 3.5 + 0.4 SDMarasmic p < 0.001 p < 0.001 p < 0.01
a p < 0.001 0.01 0.001 0.001 0.001 0.001
a p represents the significance between normal and marasmic infants in each period of study.
125

suggests that although the low values of BEIare due in part to a decrease of hypophysealstimulation, there may also be a deficit of thethyroid function per se. It is probable that themechanism of hormonal synthesis, which ismore complex than the iodine uptake, is in-volved to a greater extent in marasmic mal-nutrition.
The oxygen consumption values in the normalgroup do not suffer important modificationsafter TSH administration, results which were
NORMAL MARASMATIC
o
8
p<0.01
O
BEFORE TSH AFTER TSH
°
oo
o
P< 0.01
BEFORE TSH AFTER TSH
Figure 9. Marasmics and control group showed increasedBEI after TSH administration, but average attained bymarasmic infants were lower than control group. Oxygenconsumption response to TSH administration in marasmicgroup was significant, but did not reach normal values.
obtained in spite of a significant increase ofBEI (Figure 9). It has been suggested that,under normal conditions, the response of oxygenconsumption to TSH takes several days longer(30, 34).
The oxygen consumption response to TSHadministration in the marasmic group was sig-nificant, but it did not reach normal values.Probably it is necessary to administer more thana single dose of TSH in order to obtain a satis-factory response. On the other hand, the lackof response to TSH stimulation may be a con-sequence of changes in the peripheral tissuessecondary to malnutrition. It should be remem-bered that marasmic malnutrition, unlike kwa-shiorkor, is not accompanied by hypoprotein-emia. The result, therefore, cannot be anartefact related to increase of protein binding ofthyroid hormone (13).
These results allow us to conclude that inchronic marasmic infants, there is a real de-ficiency of the thyroid function that in somedegree involves the gland, but is mainly due toa decrease in TSH stimulation. In the case oftypical kwashiorkor, the oxygen consumption isnormal (Figure 4), as is the iodine uptake (3),as if the thyroid gland were not seriouslyinvolved.
Somatotrophin studies
Chronic marasmic patients often present verydifficult problems in therapy. Recovery, if itoccurs at all, takes a long time. In our experi-ence, around 30 per cent of the severe marasmicchildren (21) require more than four months oftreatment before showing a consistent rate ofweight gain. The mortality rate is high duringthis period. Nitrogen, potassium, and phos-phorus balance is negative or only slightlypositive. Administration of human growth hor-mone (HGH) during the period of stationaryweight, however, produces a definite weightgain and an increase in nitrogen, potassium,and phosphorus retention (26). Discontinuationof HGH results again in weight stability. Thisfact suggests that a decrease in HGH production
:126
0o
P <0.001
70
60-
pa 55
k 40
_ 30
20-
I0-
10
9.
8-7.
65.
,a 4.3.2.
1'
= 5.
Eo 4
o 3
U 2
o 1

2mg. ltGH. I0
4
2 mn HGH.
-¡ Fl
::l l- 450 e~ Il 1~-iíl= ¡ irdilt - It:." S 200
400600800 '
1 5 6 7 8 9 10 n 1 1 7 8 9 101 a 12 154 17I I
!25 oca~X'ir dur II
u ', . . ..11 .! 7 8 9 10" 12 13 17
1 9 10 11 12 13 14 17 18
Weeks
4 . I 1 -¿
:L l4 i .7 t.
EJ J 4 5 6 7 8 9 . 16
6
5
'0200400600800
JLJ . rinetirgd.Ei Urirn Nitrogn.
i.. l U Feal Nt.
1 6 7 8 9 10 n 14 1S
Figure 10. After the administration of HGH, marasmic patients showed a weightgain and increase in nitrogen, potassium, and phosphorus retention.
results from chronic marasmic malnutrition of HGH in this type of patient are significantly
(Figure 10). reduced (Table 3). The same result with theBeas et al. (4) have shown that basal values same kind of patient has been reported by
Table 3
Basal values of plasma growth hormone during fasting and after arginine infusion in
undernourished infants (marasmus and kwashiorkor) and in normal controls
HGH plasma (mu/ml)Groups Number of
patients Fasting After 45 min. After 60 min.
Marasmus 6 4.1 ± 0.9 5.1 ± 1.7 5.8 ± 2.0
Kwashiorkor 6 25.6 ± 13.3 25.0 ± 17.6 14.2 ± 5.3Control 5 7.8 - 2.6 16.4 + 3.7 14.6 ± 2.6
Difference between control and marasmus p < 0.001.Difference between control and kwashiorkor p < 0.001.Difference between marasmus and kwashiorkor p < 0.001.
127
4
Ka
oNifrogn 200
400bane 600mg 24h. 800por Kg.
3
balm
mg :pr 1
W~Kg. 2
sen 0200nc 400
24h. (O0Kg 800
Ka.
5WMgh
Kg.4
Nitrogenbalance
mg 24h
por Kç
02004OO600800

Godard and co-author in Bolivian infants (18).Beas et al. (4) also describe in typical kwa-shiorkor a high basal level of plasma growthhormone (GH).
As in other hormonal studies, the GH de-termination has been the subject of controversialresults. There is agreement that kwashiorkorpatients present higher than normal levels ofplasma GH (1, 27, 28). However, some authorsreport low values in marasmic children, andHansen et al. (27, 28) report high values,although not as high as in kwashiorkor patients.Again we think that the confusion is due to thedifferent kinds of patients studied. For instance,Hansen et al. (27) report that the level of GHin malnourished children is related to the levelof plasma albumin-the lower the plasma albu-min, the higher the plasma GH. The marasmicpatients studied by these authors also have lowplasma albumin. From our own point of view,the marasmic patients have normal plasma albu-min, and consequently the patients that theystudied would be at least a mixed form betweenmarasmus and kwashiorkor (27).
It is well established that a single determina-tion of GH, during the fasting state, is veryoften of limited value, because many variablelevels may occur in subjects with normal pitui-tary functions (14). It has also been reportedthat an intravenous dose of arginine is a satis-factory test for the evaluation of human GHreserve (22). Based on these observations, theplasma GH level was determined in marasmic,kwashiorkor, and normal children, before andafter the arginine administration (Table 3). Asignificant increase in the serum levels of GHwas observed in normal infants after stimulationwith arginine. No significant response wasobserved, however, after the administration ofarginine in marasmic infants. However, patientswith kwashiorkor presented variable GH values-the basal level was high, but there was noincrease after arginine administration, and sixtyminutes afterwards there was even a tendencyto decrease. Godard and co-author (18) alsohave studied the pituitary reserve of GH inmarasmic children after hypoglycemia provoked
by insulin. Their results confirm the low basalvalues of GH with no significant increase afterthe hypoglycemia.
These results seem to indicate that in ma-rasmic infants, chronic low calorie and proteinintake produce low plasma GH levels andabsence of response to different stimuli. It canalso be assumed that protein deprivation, as inkwashiorkor, produces an increase in plasmaGH. The full meaning, however, is difficult tointerpret until further studies can be made. Theincrease of GH could be the consequence of anincrease of GH release, a decrease in peripheralutilization, or impaired breakdown as a conse-quence of acute protein deficiency.
When all the accumulated data is considered,it is clear that endocrine response is different inkwashiorkor patients as compared to marasmicpatients. A decrease of hypophyseal trophichormones in the case of chronic marasmicpatients is evident, whereas in kwashiorkor,facts have failed to demonstrate such a re-sponse. Kwashiorkor is the consequence of alow-protein intake with a sufficiently goodcalorie intake, whereas marasmus is due to alow-calorie and low-protein intake. In otherwords, the main difference is the calorie restric-tion, since both have a low-protein and probablya low-vitamin intake.
It can be postulated that, as a consequence ofcalorie restriction, there is a decrease of hypo-physeal trophic hormone. The apparently re-duced activity of the gland may, therefore, benothing else than an indication of a reduceddemand for its products, or perhaps may be areal adaptation triggered by the chronicallydiminished calorie intake. If it is an adaptation,it might then permit survival, in spite of agreatly lowered calorie intake, by resulting ina decrease in body activity, a lowering of thebasal metabolic rate, and a diminishing or arrest-ing of the growth rate.
Experimental results show that hypophysealhormones, and also the availability of energyregulate the rate of cell division. Cell multipli-cation requires an adequate amount of energy,and depends upon glycogen concentration and
128

Table 4
Mitotic index in the crypts of Lieberkuhn of fasted rats and rats fed on diets withdifferent protein content
Standarddiet
(15 animals)
Diet 0%protein
Fasted calories(8 animals) (8 animals)
Diet 4%proteincalories
(8 animals)
Diet 8%proteincalories
(8 animals)
Diet 20%proteincalories
(8 animals)
Mitotic index 6.6 ± 1.3 3.1 - 1.2 5.0 + 1.6 5.9 _ 0.9 5.9 _ 0.8 6.0 ± 1.1Number of cellsper mitosis 16 3 36 - 12 22 7 17 3 17 2 17 2Significance ofdifference fromnormal; p < 0.001 0.05 0.10 0.10 0.10
The number of epithelial cells per mitosis is given as the reciprocal value of the mitotic index.Mean values + SD.
carbohydrate metabolism. In rats, calorie restric- the calorie intake is of great importance intion immediately decreases mitotic rate. Fasting maintaining the rate of cell renewal.rats have a fall in the rate of cell division, but Experiments on animals show that thyroidwhen the calorie intake is increased, no change hormone and GH have a positive influence onin the mitotic rate is observed, even with a re- the rate of cell proliferation (16, 19). Thestricted protein intake (Table 4) (6). Through hypophysectomized animals present a lower ratestudy of the rate of cell division in the crypts of cell division in the LieberkIhn crypts (16,
of Lieberkihn by duodenal biopsy (7), similar 19). These experimental studies lead to a general
results have been obtained in a group of ma- hypothesis: chronic decrease of calorie intakerasmic patients in our laboratory. Marasmicrasmic patients in our laboratory. Marasm rcsults in a decrease in hypophyseal trophicinfants present a significantly low mitotic indexthat returns to normal values with treatment. hormones, and, onsequently, a decrease in cellStekel and Smith (31, 32, 33) have obtained division, growth, and metabolic rate results. Thesimilar results in hematopoietic tissue. The re- decrease is proportional to the decrease and du-
sponse in typical, acute kwashiorkor is different, ration of calorie restriction. On the other hand,
and the mitotic index remains near normal the protein restriction alone causes a decrease
values (Table 5). These results suggest that in protein synthesis and many other adaptation
Table 5
Mitotic index and number of epithelial cellis per mitosis in the crypts of Lieberkuhn of jejunal biopsies ofnormal infants and infants with marasmus and kwashiorkor
Normal Kwashiorkor Marasmus Marasmus Marasmus(8) (10) all cases before during
recovery recovery
Mitotic index 3.9 ± 0.2 3.0 - 0.6 1.9 ± 0.8 1.3 ± 0.5 2.4 - 0.8Range 2.6-4.5 1.8-3.7 0.7-3.6 0.7-2.1 1.4-3.6Number ofcrypt cells per 26 + 5 35 - 9 65 ± 32 87 +34 46 + 16mitosisp < 0.02 0.01 0.001 0.01
Numbers in parentheses are numbers of infants. The number of crypt epithelial cells per mitosis is the recipro-cal value of the mitotic index.
129

mechanisms in protein metabolism (these havebeen studied and reviewed by Waterlow). Pro-longation of protein restriction produces thetypical protein deficiency syndrome, kwashior-kor. However, the clear separation of the twosyndromes obtained under experimental con-
ditions is very unclear in actual cases. A fre-quent confusion in the clinical picture is dueto the fact that a deficit of proteins and calories,varying from patient to patient, is always found.In the final analysis, then, this hypothesis needsa much broader investigation.
REFERENCES
1. ALLEYNE, G. A., and V. H. YOUNG. Adrenalfunction in malnutrition. Lancet 1: 911, 1966.
2. ALLEYNE, G. A., and V. H. YOUNG. Adreno-cortical function in children with severe protein-calorie malnutrition. Clin Sci 33: 189, 1967.
3. BEAS, F., and I. CONTRERAS. Laboratorio deInvestigaciones Pediátricas, Santiago, Chile. Un-published data.
4. BEAS, F., I. CONTRERAS, and S. ARENAS. Growthhormone in infant malnutrition: the arginine testin marasmus and kwashiorkor. Amer 1 Clin NutrIn press.
5. BEAS, F., F. MONCKEBERG, and I. HORWITZ. Theresponse of the thyroid gland to thyroid stimulatinghormone (TSH) in infants with malnutrition. Pe-diatrics 38: 1003, 1966.
6. BRUNSER, O., and N. PAK. Mitotic index injejunal mucosa of rats subjected to fasting or pro-tein-deficient diets. In Trans Soc Pediat Res, 36thAnnual Meeting, Atlantic City, 1966, p. 174.
7. BRUNSER, O., A. REID, F. MONCKEBERG, A. MAC-CIONI, and I. CONTRERAS. Jejunal biopsies in infantmalnutrition: with special reference to mitotic in-dex. Pediatrics 38: 605, 1966.
8. BULLOUGH, W. S. Mitotic activity and carcino-genesis. Brit 1 Cancer 4: 329, 1950.
9. BULLOUGH, W. S., and F. J. EBLING. Cell re-placement in the epidermis and sebaceous gland ofthe mouse. 1 Anat 86: 29, 1952.
10. BULLOUGH, W. S., and E. A. EISA. The effectsof a graded series of restricted diets on epidermalmitotic activity in the mouse. Brit 1 Cancer 4: 321,1950.
11. CASTELLANO, H., and G. 4RROYAVE. Role ofthe adrenal cortical system in the response of chil-dren to severe protein malnutrition. Amer 1 ClinNutr 9: 186, 1961.
12. CoPE, C. L., and J. PEARSON. Clinical valueof the cortisol secretion rate. 1 Clin Path 18: 82, 1965.
13. DoNoso, G., O. BRUNSER, and F. MONCKEBERG.Metabolism of serum albumin in marasmic infants.1 Pediat 67: 306, 1965.
14. FRANTZ, A. G., and D. A. HOLUB. Daily se-cretion rates of human growth hormone (HGH)based on a new technique for continuous blood
samples. In Third International Congress of En-docrinology, Mexico, 1968, p. 18.
15. FRIEDMAN, M. H. The response of differentregions of the gastrointestinal tract to normal andabnormal stimuli (influence of feeding inert bulkmaterial and of hypophysectomy). I Nat CancerInst 13: 1035-1038, 1953.
16. GELB, A., and CH. GERSON. Influence of theendocrine glands on small intestine absorption.Amer ! Clin Nutr 22: 305, 1969.
17. GILLMAN, J., and T. GILLMAN. Prospectivesin Human Nutrition. New York, Grune and Strat-ton, 1951.
18. GODARD, C. Valores de tiroestimulina plasmá-tica en la desnutrición infantil grave. In IX Reu-nión Anual, Sociedad Latinoamericana de Investi-gación Pediátrica, Valdivia, Chile, 1969, p. 26.
19. LEBLOND, C. P. and R. CARRIERE. The effect ofgrowth hormone and thyroxine on the mitotic rateof the intestinal mucosa of the rat. Endocrinology56: 261, 1955.
20. LURIE, A. O., and W. P. JACKSON. Adrenalfunction in kwashiorkor and marasmus. Clin Sci22: 259, 1962.
21. MENEGHELLO, J., et al. Evolución introhospi-talaria del lactante distrófico menor de un año. RevChile Pediat 23: 1, 1952.
22. MERIMEE, T. J., L. RIGGS, D. L. RIMOIN, D.RABINOWITZ, J. A. BURGESS, and V. A. McKusic.Plasma growth hormone after arginine infusion.New Eng 1 Med 276: 434, 1967.
23. MONCKEBERG, F. Adaptation to caloric andprotein restriction in infants. In R. McCance andE. J. Widdowson (eds.), Calorie Deficiencies andProtein Deficiencies. London, Churchill, 1968, pp.91-107.
24. MONCKEBERG, F., F. BEAS, and M. PERRETTA.Función suprarrenal en distróficos. Rev Chile Pediat27: 187, 1956.
25. MÓNCKEBERG, F., F. BEAS, I. HORWITZ, A. DA-BANCES, and M. FIGUEROA. Oxygen consumption in
infant malnutrition. Pediatrics 33: 554, 1964.26. MONCKEBERO, F., G. DONOSO, S. OXMAN, N.
PAK, and J. MENEGHELLO. Human growth hormone
in infant malnutrition. Pediatrics 31: 58, 1963.
130

27. PIMSTONE, B. L., D. BECKER, and J. D. HANSEN.Abnormalities of human growth hormone (HGH)secretion in protein calorie malnutrition. In VIIIInternational Congress of Nutrition, Prague, 1969,p. 23.
28. PIMSTONE, B. L., W. WITTMANN, J. D. HAN-SEN, and P. MURRAY. Growth hormone and kwa-shiorkor. Lancet 2: 779, 1966.
29. RAV, S. K., S. G. SRIKANTIA, and C. GOPALAN.Plasma cortisol levels in protein-calorie malnutrition.Arch Dis Child 43: 365, 1968.
30. SHAUSE, B., and W. STUDNITZ. Metabolic effectof thyrotrophic hormone in man. Acta Endocr (Ko-benhavn) 41: 187, 1962.
31. STEKEL, A., and N. SMITH. Hematologicalstudies of severe undernutrition in infancy. Theanemia of prolonged calorie deprivation in the pig.Pediat Res 3: 320, 1969.
32. STEKEL, A., and N. SMITH. Hematologicstudies of severe undernutrition in infancy. Ery-thropoietic response of calorie deprived pigs to phle-botomy. Pediat Res 3: 338, 1969.
33. STEKEL, A., and N. SMITH. Hematologicstudies of severe undernutrition in infancy. Ery-throcyte survival in marasmic infants and caloriedeprived pigs. Amer 1 Clin Nutr In press.
34. STERLING, G. A. The thyroid in malnutrition.Arch Dis Child 37: 99, 1962.
131

HOMEOSTATIC MECHANISMS IN THE REGULATIONOF SERUM ALBUMIN LEVELS
R. Hoffenberg
The relative constancy of the plasma albuminconcentration in health suggests the existenceof some sort of regulating mechanism. Controlcould be effected through variations in synthesisor catabolism of the protein, or through altera-tions in its distribution between intra- andextra-vascular pools. Although there is evidenceof increased transfer of extravascular albuminto plasma in states of protein malnutrition (4,12), such measurements are usually based onisotopic tracer data which are difficult to inter-pret in the unsteady states that might be ex-pected to exist in disease or after acute experi-mental procedures. In any event, this type ofexchange must be regarded as a temporary ex-pedient to meet acute changes; alterations insynthesis or catabolism would be anticipated inmore chronic disturbances. These adaptivechanges have been studied in vivo in humansubjects suflering from ma!nutriion and inanimals experimentally deprived of dietary pro-tein, and attempts have been made to correlatethe findings with the in vitro behavior of theisolated perfused liver and of cell-free systems.
Catabolism of albumin and protein malnutrition
In healthy adult men the amount of albumincatabolized per day is variously reported to bebetween 150-250 mg kilogram-1 day-l (12, 27,29, 36). This is equivalent to a fractional rateof 8 to 12 per cent of the intravascular poolcatabolized per day. Both figures (absolute
amounts and fractional rates )are slightly higherin healthy children (29). A limited study ofapparently healthy male Africans (5) revealeda smaller intravascular albumin pool and a lowerabsolute rate of catabolism, a hint that the nu-tritional status of the individual might affectthe turnover of albumin.
When dietary protein is limited, the plasmaalbumin level falls 0and its catabolism is sloweddown. This has been demonstrated in kwashior-kor and in experimentally-induced protein de-pletion (4, 8, 12, 15, 19, 20, 26). Initially thefractional catabolic rate is unchanged and theabsolute rate falls in parallel with the plasmaalbumin concentration and pool size. By adap-tation of the catabolic rate to the synthesis rate,a simple but effective method of compensatingfor reduced synthesis is thus provided (Figure1) and a new equilibrium is reached.
It should be stressed that this fa!! in the rateof albumin catabolism follows reduction of theintravascular pool and is not primarily deter-mined by the reduction in dietary protein (12,15, 20). Further, it is not specific to the hypo-albuminemia of protein malnutrition, but isseen in cirrhosis of the liver (7, 30, 37) andafter plasmapheresis (1, 11, 23). Exceptions areseen in the nephrotic syndrome and protein-losing enteropathy where local hypercatabolismmay play a part (11, 17, 42). In kwashiorkor(4, 15) and in experimental protein depletion(12), a fall in thc fractional rate of albumincatabolism may also be observed.
132

log/d I V P. 10% IVP/d 5g/d ,1% IVP/d
lOOg (10g/dl (5g/dj
Normal Low protein diet
Figure 1. Diagrammatic representation of effects of diminished synthesis on albuminpool size. Maintenance of a constant fractional breakdown rate establishes a newequilibrium.
On refeeding, a reverse sequence of eventsis found. A return to a normal or supranormal(see below) synthesis rate rapidly restores theplasma albumin pool, and catabolism graduallyreturns to its normal rate, adapting once againto the altered rate of synthesis to reach a newequilibrium (20).
The site of albumin catabolism in the bodyis still not known and no specific organ hasbeen shown to play a predominant role. Studiesusing the isolated perfused rat liver have ledto the belief that this organ normally accountsfor 10 to 15 per cent of the total amount ofalbumin broken down in vivo (3, 10). Thereis good justification for the use of this systemas a model for studying adaptive changes incatabolism under experimental conditions and
0.5
0.4
0.3AIb.
Catab.%/hr. ,.
for the assumption that its behavior is repre-sentative of that of the intact live animal (13).Figure 2 shows the response of the perfused ratliver to a drastic increase in perfusate albuminconcentration. A constant fractional rate ofbreakdown is maintained resulting in increasedabsolute degradation. If a liver taken from arat which has been fed a non-protein diet for15 to 20 days is perfused with blood taken fromsimilarly deprived animals, a slower fractionalcatabolic rate is found, analagous to the observa-tions in human subjects and experimental ani-mals referred to earlier. It is interesting thatthis slow rate of catabolism can be acceleratedby the addition of albumin to the perfusate poolor by perfusion with blood taken from rats feda normal diet (Figure 3).
Hours Hours
Figure 2. Effect of increased concentration on the frac-tional breakdown rate of albumin by the perfused ratliver. Additional albumin raised the plasma concentra-tion of the perfusate from 21.8 to 38.9 mg/ml and 24.6to 37.6 mg/ml in the two experiments. Catabolic ratemeasured from non-protein-bound/protein-bound iodiderotios.
Figure 3. Albumin catabolism by livers taken from rotsfed a protein-free diet. Note slow rate when perfusedwith blood from similarly deprived animals, and attain.ment of normal rate when albumin is added to increasethe concentration from 18.7 to 21.6 mg/ml (solid line),or when perfused with normal blood (broken line). Nor-mal range of catabolic rate shown by hatched area.
133

The observed constancy of fractional albuminbreakdown rate by the perfused liver may beexplained by the theory of fluid endocytosis, interms of which hepatic cells engulf a fixedvolume of ambient fluid per unit time (14).The number of albumin molecules introducedinto the cell and therefore available for lysosomalproteolysis will be proportional to the concen-tration of the protein in the engulfed fluid,that is, in the extracellular milieu, providedselective adsorption of molecules at the cellmembrane does not occur. This would explainthe maintenance of first-order kinetics for albu-min breakdown observed in vivo and in vitro.In order to interpret the lower fractional ratefound with livers from protein-deprived rats,one might postulate a reduced rate of endo-cytosis or lysosomal activity. Protein starvationhas been shown to produce structural changesin liver lysosomes as well as alterations in pro-teolytic enzyme activity (25), but the relation-ship to the functional changes mentioned aboveis not clear.
Synthesis of albumin and protein malnutrition
Amino acids for plasma protein synthesis arederived mainly from dietary sources. It is notsurprising that one finds a close correlation be-tween plasma albumin concentrations and thelevel of protein in the diet (19). With prolongedrestriction of available protein, albumin synthesisis progressively reduced leading to gradual di-minution in the size of the body albumin stores(12, 15, 20). Refeeding with a diet of normalprotein composition causes a dramatic increasein albumin synthesis rate, which is apparentwithin 24 hours and which appears to be in-creased above the normal range. This leads torapid restoration of body albumin.
Perfusion of the isolated liver provides abetter model for studying albumin synthesisthan it does for catabolism, since production ofthis protein is confined to the liver (24). Yet,under ordinary conditions, livers taken fromnormal rats appear to synthesize only half theamount of albumin produced by the intact ani-mal. Despite this, the system has proved mostvaluable for comparative studies.
Rothschild et al. (28) have perfused rabbitlivers with blood diluted with a solution con-taining glucose and amino acids. They foundreduced rates of albumin synthesis when thedonor rabbit had been fasted for 18 to 36 hoursprior to extirpation of the liver. In a study ofprotein deprivation as opposed to starvationHoffenberg, Gordon, and Black (unpublishedobservations) found a similar lowering of albu-min synthesis. Because of difficulties in interpre-tation when synthesis rates of urea and proteinare low, we abandoned the 14CO 2 method ofMcFarlane (21) in favor of direct measurementof rat albumin production by an immunodiffu-sion technique (22), using a system of hetero-logous (rabbit) plasma with homologous redblood cells. Livers taken from rats previouslyfed non-protein diets for 15 to 20 days showedsignificant depression of albumin synthesis(Table 1). Yet, these differences were abolishedif liver size was taken into account and, weightfor weight, livers of protein-deprived ratsseemed competent to manufacture albumin. Theextent to which total albumin production isimpaired in these livers is comparable to thatseen in vivo after exposure to a non-protein diet(19), although, as mentioned, the performanceof the isolated liver does not match that foundin the intact animal. With livers taken fromrefed animals, the findings are again similar tothose in the intact rat. If the donor animal isfed a normal diet for 48 hours after 15 to 20days of protein-deprivation, high albuminsynthesis rates are found (Table 1). These arewithin the normal range in absolute terms, butare considerably raised when related to liverweight.
These responses of the isolated liver must beconsidered in the light of structural changesknown to affect the hepatic albumin-synthesiz-ing apparatus in protein-deprivation. Starvationand amino acid or protein restriction areattended by prompt alterations in polysome pro-file with a breakdown of membrane-bound poly-somes and the appearance of more free mono-somes and disomes (2, 9, 16, 33, 34, 38).
The shift of polysome particles from heavyto light is generally assumed to reflect a reduced
134

Table 1
Albumin synthesis rates. Livers taken from rats fed diets of differentprotein composition a
mg/h mg h- 100 gm rat -l
"4CO Imm-diff. "CO2 Imm-diff.
NL 5.0 4.0 1.50 1.13(n = 6) (2.7-8.3) (2.6-4.6) (0.68-2.85) (0.76-1.28)OPL 1.4 0.92(n = 5) - (0.9-1.7) - (0.55-1.13)Refed L. 3.4 4.4 1.77 2.32(n = 3) (2.2-4.1) (3;5-5.0) (1.24-2.16) (1.73-2.65)
a Albumin synthesis rates (mean and range) by isolated perfused rat livers. NL =livers from rats fed normal diet; OPL = livers from rats fed protein-free diet for15 to 20 days; refed L = rats refed normal diet for 48 hours after protein-free dietfor 15 to 20 days.
capacity for protein synthesis. Reaggregationand a restoration of ability to incorporate aminoacids into protein rapidly follow the introductionof amino acids into the system. Tryptophan, inparticular, seems to exert a unique and powerfulinfluence on polysome structure and function.
The interpretation of polysome profiles inrelation to dietary protein intake and aminoacid incorporating ability must be adopted withcaution, as aggregation may be restored whenanimals are refed a non-protein diet after aperiod of fasting, that is, exogenous proteinis not mandatory for their restoration (39, 41).Wilson and Hoagland (40) have shown that36 per cent of liver polysomes are stable afterfasting, that is, not subject to these structuralchanges, and a majority of these can synthesizealbumin. Selective disaggregation of polysomesnot committed to albumin synthesis could con-fuse the picture outlined above..
A final word to try to relate these findings tochanges in liver enzymes that have been de-scribed. In classical studies, Schimke (31, 32)and, more recently, Deosthale and Tulpule (6)have shown reduction in all hepatic urea cycleenzymes after protein deprivation. Reduced
urea synthesis is reflected in low blood ureaand urine excretion levels in protein malnutri-tion, and this was encountered in our perfusionstudies on livers from protein-deprived rats. Itis interesting that amino acid activating enzymeshave been shown to be increased in depletionstudies (35), suggesting that amino acids wouldpreferentially be diverted into protein synthesisrather than into urea formation. The liver mightbe thought of as "primed" to synthesize pro-tein as soon as adequate amino acids are sup-plied. This concept would fit very well withthe prompt, even exaggerated, response to re-feeding, which has been found in vivo and withthe perfused liver system.
In conclusion, one should emphasize thatbody responses cannot be contemplated in vacuo.In particular, the role of hormones needs tobe considered, as John and Miller (18) haverecently demonstrated. In their studies, maxi-mum albumin synthesis by the perfused liverrequired insulin and cortisol, as well as aminoacid supplementation. Any attempt to ignorethese factors must lead to an oversimplifiedview.
REFERENCES
1. ANDERSEN, S. B., and N. RossINc. Metabolismof albumin and yG-globulin during albumin infu-sions and during plasmapheresis. Scand ! Clin LabInvest 20: 183-184, 1967.
2. BALIGA, B. S., A. W. PRONCZUK, and H. N.MUNRO. Regulation of polysome aggregation in acell-free system through amino acid supply. 1 MolecBiol 34: 199-218, 1968.
135

3. COHEN, S., and A. H. GORDON. Catabolism ofplasma albumin by the perfused rat liver. Biochem1 70: 544-551, 1958.
4. COHEN, S., and J. D. L. HANSEN. Metabolismof albumin and y-globulin in kwashiorkor. ClinSci 23: 351-359, 1962.
5. COHEN, S., and L. SCHAMROTH. Metabolism of
1131-labelled albumin in African subjects. Brit MedI 1: 1391-1394. 1958.
6. DEOSTHALE, Y. G., and P. G. TULPULE. Adap-tive response of the urea cycle enzymes of the ratliver to the quality and quantity of dietary proteins.Indian 1 Biochem 6: 115-120, 1969.
7. DYKES, P. W. A study of the effect of albumininfusions in patients with cirrhosis of the liver.Quart 1 Med 30: 297-327, 1961.
8. FREEMAN, T., and A. H. GORDON. Metabolismof albumin and y-globulin in protein deficient rats.Clin Sci 26: 17-26, 1964.
9. GAETANI, S., D. MASSOTTI, M. A. SPADONI, andG. TOMASSI. Studies of dietary effects on free andmembrane-bound polysomes in rat liver. 1 Nutr 99:307-314, 1969.
10. GORDON, A. H. The catabolic rate of albumindoubly labelled with 131I and 14C in the isolatedperfused rat liver. Biochem 1 82: 531-540, 1962.
11. HOFFENBERG, R. Control of albumin degrada-tion in vivo and in the perfused liver. In M. A.Rothschild and T. A. Waldmann (eds.), PlasmaProtein Metabolism Regulation of Synthesis, Dis-tribution and Degradation. New York, AcademicPress, 1970.
12. HOFFENBERG, R., E. BLACK, and J. F. BROCK.Albumin and y-globulin tracer studies in protein
depletion states. 1 Clin Invest 45: 143-152, 1966.13. HOFFENBERG, R., A. H. GORDON, E. G. BLACK,
and L. N. Louis. Plasma protein catabolism by theperfused rat liver. The effect of alteration of albu-min concentration and dietary protein depletion.Biochem 1 118: 401-404, 1970.
14. JACQUES, P. J. Endocytosis. In J. T. Dingleand H. B. Fell (eds.), Lysosomes in Biology andPathology. Amsterdam, North-Holland, 1969, pp.395-420.
15. JAMES, W. P. T., and A. M. HAY. Albuminmetabolism: effect of the nutritional state and thedietary protein intake. 1 Clin Invest 47: 1958-1972,1968.
16. JEFFERSON, L. S., and A. KORNER. Influence of
amino acid supply on ribosomes and protein synthe-
sis of perfused rat liver. Biochem 1 111: 703-712,1969.
17. JENSEN, H., N. RoSSING, S. B. ANDERSEN, andS. JARNUM. Albumin metabolism in the nephrotic
syndrome in adults. Clin Sci 33: 445-457, 1967.18. JOHN, D. W., and L, L. MILLER. Regulation of
net biosynthesis of serum albumin and acute phaseplasma proteins. ¡ Biol Chem 244: 6134-6142, 1969.
19. KIRSCH, R. E., J. F. BROCK, and S. J. SAUNDERS.Experimental protein-calorie malnutrition. Amer !Clin Nutr 21: 820-826, 1968.
20. KIRSCH, R., L. FRITH, E. BLACK, and R. HOF-FENBERG. Regulation of albumin synthesis and ca-tabolism by alteration of dietary protein. Nature217: 578-579, 1968.
21. McFARLANE, A. S. Measurement of synthesisrate of liver-produced plasma proteins. Biochem ¡89: 277-290, 1963.
22. MANCINI, G., A. O. CARBONARA, and J. F.HEREMANS. Immunochemical quantitation of anti-gens by single radial immunodiffusion. Int 1 Im-munochem 2: 235-254, 1965.
23. MATTHEWS, C. M. E. Effects of plasmapheresison albumin pools in rabbits. 1 Clin Invest 40: 603-610, 1961.
24. MILLER, L. L., and W. F. BALE. Synthesis ofall plasma protein fractions except gamma globulinsby the liver. 1 Exp Med 99: 125-153, 1954.
25. NINJOOR, V., S. SAROJA, S. R. PADWALDESAI,
P. L. SAWANT, U. S. KUMTA, and A. SREENIVASAN.
Liver lysosomes in protein-starved rats. Brit 1 Nutr23: 755-761, 1969.
26. Picou, D., and J. C. WATERLOW. The effectof malnutrition on the metabolism of plasma albu-min. Clin Sci 22: 459-468, 1962.
27. RossING, N. The normal metabolism of 131I-labeled albumin in man. Clin Sci 33: 593-602, 1967.
28. ROTHSCHILD, M. A., M. ORATZ, J. MONGELLI,
and S. S. SCHREIBER. Effects of a short-term fast onalbumin synthesis studied in vivo, in the perfusedliver, and on amino acid incorporation by hepaticmicrosomes. 1 Clin Invest 47: 2591-2599, 1968.
29. ROTHSCHILD, M. A., M. ORATZ, and S. S.SCHREIBER. Serum albumin. Amer 1 Dig Dis 14:711-744, 1969.
30. ROTHSCHILD, M. A., M. ORATZ, D. ZIMMON,
S. S. SCHREIBER, and I. WEINER. Albumin synthesisin cirrhotic subjects with ascites studied with carbo-nate 14C. 1 Clin Invest 48: 344-350, 1969.
31. SCHIMKE, R. T. Adaptive characteristics ofurea cycle enzymes in the rat. 1 Biol Chem 237:459-468, 1962.
32. SCHIMKE, R. T. Differential effects of fastingand protein-free diets on levels of urea cycle en-zymes in rat liver. 1 Biol Chem 237: 1921-1924,1962.
33. SIDRANSKY, H., D. S. R. SARMA, M. BONGIORNO,and E. VERNEY. Effect of dietary tryptophan onhepatic polyribosomes and protein synthesis infasted mice. 1 Biol Chem 243: 1123-1132, 1968.
34. STAEHELIN, T., E. VERNEY, and H. SIDRANSKY.
136

The influence of nutritional change on polyribo-somes of the liver. Biochim Biophys Acta 145: 105-119, 1967.
35. STEPHEN, J. M. L., and J. C. WATERLOW. Effectof malnutrition on activity of two enzymes con-cerned with amino acid metabolism in human liver.Lancet 1: 118-119, 1968.
36. TAKEDA, Y., and E. B. REEVE. Studies of themetabolism and distribution of albumin with auto-logous I13a albumin in healthy men. J Lab ClinMed 61: 183-202, 1963.
37. TAVILL, A. S., A. CRAIGIE, and V. M. Ros-ENOER. The measurement of the synthetic rate ofalbumin in man. Clin Sci 34: 1-28, 1968.
38. WANNEMACHER, R. W., W. K. COOPER, andM. B. YATVIN. The regulation of protein synthesisin the liver of rats. Biochem 1 107: 615-623, 1968.
39. WEBB, T. E., G. BLOBEL, and V. R. POTTER.Polyribosomes in rat tissues. 3. The response ofthe polyribosomes pattern of rat liver to physiologicstress. Cancer Res 26: 253-257, 1966.
40. WILsON, S. H., and M. B. HOAGLAND. Physi-ology of rat liver ribosomes. Biochem 1 103: 556-566, 1967.
41. WITTMAN, J. F., K. L. LEE, and O. N. MILLER.Dietary and hormonal influences on rat liver poly-some profiles: fat, glucose and insulin. BiochimBiophys Acta 174: 536-543, 1969.
42. WOCHNER, R. D., S. M. WEISSMAN, T. A.WALDMANN, D. HOUSTON, and N. 1. BERLIN. Direct
measurement of the rates of synthesis of plasma pro-teins in control subjects and patients with gastro-intestinal protein loss. ¡ Clin Invest 47: 971-982,1968.
137

DISCUSSION
Neel: I should like to return to Dr. Moncke-berg's paper to ask a question. We are all verymuch aware of the possible lasting effect ofprotein malnutrition on mental development.In this regard, Doctor, did your study includeIQ follow-ups? When you have saved one ofthese children, do you have a functional citizenor not?
Monckeberg: This is a difficult questionsince adequate studies do not exist. In casesin which malnutrition is severe and affects thechild during the first stages of his life, a con-siderable retardation in psychomotor develop-ment can be observed. Our experience, andthat of several other investigators indicates thesedamages to be persistent, leaving behind serioussequelae, even when the nutritional conditionimproves in a later period. We have been ableto make a follow-up study of a group of 15patients, presently nine-to-ten-years-old, whoexperienced severe malnutrition during the firstmonths of life and later improved their nutri-tional condition. The IQ as an average is 74,compared to normal values of 94 to 110. Fromthe physical point of view they present ananthropometrical deficit-their height is 24centimeters below normal for their age. We alsohave a study on the frequency of mental de-ficiency in preschool children. Where malnu-trition is prevalent in a slum area, almost 40per cent of the children have an IQ lower than80. It is very difficult to arrive at a definiteconclusion about this, however, because we
know that a low IQ in a slum area will be theconsequence of at least two factors, malnutritionand deprivation. Unfortunately, those factorsare always together-we cannot separate them.In any event, we can demonstrate a very closecorrelation between the degree of growth re-tardation and the degree of mental retardation.
Neel: A third factor may be involved, namely,the possibility that people of low IQ gravitateto the slums so that you have a constitutionalfactor interacting with the two factors youmentioned.
Chairman Waterlow: We are just now fol-lowing up our malnourished patients after fiveto nine years. They seem presently to be someten IQ points below their own brothers whowere not treated for malnutrition. This onlypartially answers the question.
Neel: But where do their brothers stand withreference to the population norm?
Chairman Waterlow: I do not know that wecan answer that, but I should not conceal fromyou that brothers do not always have the samefather in our society.
Harper: I would like to return briefly to Dr.Hoffenberg's paper and ask if he has measuredproteolytic enzymes in the liver under some ofthe conditions in which changes in the catabolicrate have been observed.
Hoffenberg: No, we have not. This has beendone by other workers, but we have not doneso. Changes have been observed, of course, incertain enzymes.
138

SUMMARY
J. C. Waterlow
The purpose of these symposia, which theAdvisory Committee organizes every year is tobring together different ideas and disciplinesin order to help PAHO in its objective of im-proving health. I think I speak for the Com-mittee as a whole in thanking the contributorswho have come to present these papers to us.
In conclusion I should like to comment brieflyon some general ideas put forth by variousspeakers, particularly as they touch on my owninterests and research.
Very generally, what has emerged from thesessions is that a main problem for the futureis the recognition of marginal states, which arehalfway along what Dr. Arroyave calls "thespectrum of deficiency."
Dr. Mayer introduced the idea of adaptationat a cost. The problem is to determine wherethe cost begins, and at what point on the spec-trum is the division between all right and notall right. As Drs. Hilleboe and Mayer havepointed out, administrative decisions have to betaken on all these matters. It is our job to feedin the information on which those decisions arebased. We had some discussion about statistics.I am glad to have the last word because I canrestate my view that the collection of facts aboutpopulations is indeed very important and pro-vides part of the data that have to be fed in-facts about individual variation, facts about dif-ferences between groups. My contention wasthat these facts in themselves do not providethe basis for value judgments. They tell us
what the situation is. They don't tell us whetherit is good or bad. But our problem is to makevalue judgments. To repeat what I said earlier,I think these are made possible by a study ofassociations between different things, such as Dr.Arroyave described in the work on vitamin re-quirements and vitamin standards, by studiesof what happens in time, by functional tests,and, lastly, by an understanding of the basicmechanisms of adaptation. It would be quiteimpertinent of me to try to summarize theinformation given this morning and this after-noon, at various levels, on different kinds ofadaptive mechanisms. I can only say that inmy own work, which is concerned to a con-siderable extent with practical problems, suchas the protein requirements of infants, how todiagnose protein deficiency and so on, I havefound the work of Drs. Potter and Schimkeextremely valuable and helpful. It would beunnecessary to trace the intellectual connectionbetween their work and our problems, but itexists and I am sure the same is true for manyother people working in this field.
I would like to end by recalling a remarkthrown out casually by Dr. Waters at the veryend of his presentation in which he said thatwe have to search for sensitive indices. That isthe heart of the matter, and in my view, theway in which we are going to identify sensitiveindices is through a better understanding of thebiochemical mechanisms.
139

SUMMARY
Philip P. Cohen
What we have heard today exemplifies thespectrum of research input which is neces-sary in order that we can understand the adap-tive factors in so complex an organism as man,both as an individual, and as a member of agroup. The original question that was posed-namely, the question of adaptation, particu-larly in relation to diet, was explored perhapswithout defining what is meant by adaptation.Adaptation, as was pointed out, is basically anindividual problem. The intrinsic biochemicalor molecular aspects of the cell, the organ, andthe hormonal interplay operating in the wholeorganism have been emphasized, but as wasbrought out by Dr. Mayer, there is also theneed to recognize that, as a member of a com-munity, the individual has certain ecological orenvironmental relations which come into play,of which diet is only one consideration. Thebiochemical sophistication that has been de-
veloped together with a new way of lookingat problems, which a molecular view permits,encourages me to believe that a concept ofadaptation will eventually emerge that will bemore meaningful and useful. Although theproblem is complex, a reasonable and realisticposition as to what standards in nutrition interms of specific numbers are intended to mean,has been presented. If we recognize the limita-tions that are inherent in these numbers, andif we make certain that these numbers do notbecome so fixed that any deviation is consideredto represent malnutrition, we can consider areasonable beginning has been made to bringthe areas of cell biology, biochemistry, genetics,and related areas, into some more meaningfulframe of nutritional reference for help to thedietician and clinician in dealing with problemsof diet and health. With these goals in mind,1 feel that this has been a very rewarding session.
140

APPENDIX
THE ROLE OF MOLECULAR BIOLOGY IN HEALTH AND MEDICINE
Philip P. Cohen
A major current concern in the area of healthrelates to delivery of medical care with emphasison the relative shortage of physicians. Becausethe time spent in medical education and spe-cialty training has been increasing over the past50 years in response to the advances in scientificknowledge and technology, to the extent thata period of 12 years (4 premedical, 4 medical,1 interne and 3 residency), is usually spentbefore practice is undertaken, the medical pro-fession and some medical educators are talkingabout a shorter curriculum with less emphasison the natural sciences. The currently popularconcept of "relevance" has led to the assignmentby some of "less relevance" to the naturalsciences, and "more relevance" to the socialsciences (including psychiatry) as related tomedicine.
Historically, it is worth noting that the majorthrust and impact of the Flexner Report in 1910was that of stressing the scientific basis ofmedicine, and the necessity for structuringmedical education and practice on the scientificprinciples of the natural sciences of chemistry,physics, and biology. The great advances whichhad been made in the period of 1875-1910, par-ticularly in the areas of bacteriology and therole of bacteria in disease, and in the disciplineof pathology as developed particularly byVirchow in terms of a cellular basis of disease,
were compelling reasons for introducing thesenew sciences into the medical curriculum. In-deed, the microscope became a symbol of medi-cine along with the stethoscope, and reflectedthe commitment of medicine to a scientificbasis.
The exciting and very rapid advances in thenatural sciences in the past 25 years have servedto pose a dilemma for medicine. On the onehand, interesting new discoveries were beingmade in the areas of biochemistry, genetics,virology, and pharmacology, which required amore sophisticated level of scientific compre-hension than was possible for most physicians.At the same time, traditional and empiricalpractices of medicine were being challenged bythe newly emerging concepts, and laboratorytechniques applicable to clinical problems.
A prominent and most promising feature ofthe emerging new areas of the biologicalsciences was that of a molecular basis for under-standing complex biological events. In essence,the newly emerging concepts of molecularbiology were extending, if not replacing, thecellular basis of biology to a more fundamentallevel, namely, the molecular. While biochemistryis in its very nature oriented to a molecularview of cellular functions, it had been con-cerned, particularly for the past 30 years or so,with applying techniques for the main purposes
141

of isolation, identification, and characterizationof molecules such as vitamins, lipids, carbo-hydrates, and with the energetics of livingsystems. With the development of new tech-niques in the physical sciences, rapid advancesbegan to be made by the biochemist in the iso-lation and characterization of macromoleculessuch as proteins and nucleic acids. As the bio-chemist became more adept at understandingthe primary, secondary, and in some cases eventhe tertiary structure of macromolecules, suchas proteins and nucleic acids (including genesand viruses), events of the greatest scientificimportance occurred, particularly in the area ofbiochemical genetics, namely, the establishmentof deoxyribonucleic acids (DNA) as the primarygenetic material, the chemical and physicalnature of DNA, and above all else the "crack-ing" of the genetic code inherent in the DNAmolecule. This intellectual tour de force openedup a vista of scientific possibilities yet to befully appreciated. At this point one might saythat molecular biology emerged-but it shouldbe noted, and even emphasized, that molecularbiology is not in fact a discipline, but rather away of thinking and developing concepts aboutbiological events. The underlying basic disci-pline for molecular biology is in fact, today,chiefly biochemistry.
With the development of new concepts aboutgenetic transcription and translation, regulationof cellular processes, and differentiation anddevelopment, it was to be expected that newconcepts in molecular terms would emerge, par-ticularly in pathology, to replace-or at least toextend-the cellular basis of disease developedby Virchow. As a matter of fact, the molecularview of biological processes has led to a break-down of the traditional boundaries which earlierdistinguished anatomy, microbiology, physiol-ogy, pathology, and pharmacology from oneanother. New journals have even emerged withsuch titles as Experimental and Molecular Path-ology, lournal of Molecular Pharmacology, andMolecular and General Genetics. The molecu-lar concepts of biological processes aligned with
biochemical techniques have thus begun toemerge as a feature shared, to an increasingextent, by all the basic sciences of medicine. Thesignificance of this trend is not so much thatdistinctions are disappearing, but rather thatnew concepts are emerging. This developmentis not simply one of substituting one set ofwords or interpretations for another, but ratheris one which will permit, for the first time, anexperimental approach to problems heretoforeconsidered too complex to yield to experimentalapproach. Thus, investigators are now design-ing experiments to yield information on suchcomplex systems of the brain as memory,mentation, and related functions. The advancesin biochemical techniques and the new con-cepts of molecular biology have led to majornew advances in subcellular anatomy, micro-biology (in particular virology), physiology, im-munology, pathology, pharmacology, and genet-ics. The full impact of these new concepts areyet to be fully appreciated and exploited in thefields of medicine dependent on these basicdisciplines. While there is a gap-and alwayswill be and should be-between the implicationof a new concept in the basic sciences and theapplication of this new concept to clinical prob-lems, the gap today seems to be disconcertinglylarge and growing larger. In my view, theprimary reason for this is that the basic scientistis pursuing his research with a greater commit-ment than that of the clinician in comprehendingand applying the results of the new researchfindings. if this position is valid, then it followsthat the clinician cannot afford to be educatedand trained with less science, but rather, to beeffective, he must be trained with more science.
Because time will not permit a systematic re-view of the many areas of exciting new develop-ments in molecular biology and biochemistry,which give promise of great importance whendeveloped to the point of application in theclinic, I have decided to limit my comments tothe area of molecular mechanisms involved incell regulatory processes.
The problem of regulation of the cell to main-
142

tain its steady-state functions has begun to yieldinformation of great interest to the biologicalscientist, as well as to the clinician. While thebiochemist has been relatively successful in de-fining the energetics of the cell in terms ofspecific reactions involving the conversion ofchemical bond energy of food stuffs to theenergy required to do mechanical, osmotic,biosynthetic, and electrical work, mainlythrough the generation of adenosine triphos-phate (ATP), the capacity of a specific cell andthe whole organism to regulate these processeshas begun to be appreciated only recently.Although energy production and effective utili-zation of transduced forms of energy are offundamental importance, and basically similarin principle, if not in detail, in all cells, we nowrecognize that other forms of control aremuch more subtle and meaningful in the main-tenance of functional health and survival of acell or organism. It goes without saying thatif a cell or whole organism cannot generate theenergy necessary for effective function and regu-lation, particularly in higher animal forms, theorganism will not survive. As a matter of fact,one has to accept the fact that if an organismsurvives at all, it does so because it can generatethe energy necessary to do so. What is less clearis the nature and latitude of the regulatoryprocesses which determine the survival of agiven cell or the whole organism.
The regulatory processes which operate fromthe stage of the fertilized ovum and lead to thedifferentiation and development of the fetusand postpartum, the regulatory processes whichoperate through growth, maturation, and finallydeath are conceptually being developed andexperimentally approached. While the modelfor much of the thinking about higher animalforms, such as man, is based on the models ofmicroorganisms such as E. coli, cells of higheranimals must utilize similar regulatory processesto one degree or another, in addition to thecontrols inherent in a cell which has its nuclearDNA in a segregated cellular organelle sur-rounded by a nuclear membrane, and its DNA
bound to a family of proteins known as histones,plus a multiplicity of regulators at the level ofhormones.
It is widely held that all, or almost all ofthe biological information that the adult humanhas potentially or actually is encoded in theDNA of the fertilized ovum from which hedevelops. A clear understanding of how thisinformation is transcribed, translated, andfinally regulated is necessary before one canappreciate the regulatory aspects of this processas the most basic consideration in the healthand disease of a cell or organism. Althoughthe basic model of transcription of DNA viamessenger ribonucleic acid (RNA), and thetranslation of messenger RNA on ribosomes intospecific functional proteins is still not complete,it is nevertheless adequate to explain the spe-cific macromolecular defect in many cases ofhereditary disorders involving a genetic defector mutation. A considerable number of heredi-tary disorders have now been described in whichlack of a specific enzyme, or production of anabnormal protein (for example, phenylalaninehydroxylase deficiency in phenylketonuria), orsubstitution of a specific amino acid (for ex-ample, hemoglobin S in sickle cell anemia inwhich a valine residue replaces the glutamylresidue in position 6 of the 8-chain of normalhemoglobin A), can be explained on the basisof a mutant gene unable to code specifically forthe necessary amino acid sequence required fora functional enzyme or protein. Although theprocesses involved in transcription of DNA andthe translation of messenger RNA are far frombeing completely understood, meaningful ques-tions can now be asked on the basis of theavailable concepts which can be experimentallytested.
Once the differentiated organism has de-veloped to the stage of an adult animal, therole of the regulatory processes in maintainingthe steady-state functions of the individual celland whole organism becomes a predominantconsideration. While the DNA of muscle, liver,and kidney cells, for example, all contain the
143

same genetic information, it is clear that eachcell of these organs is regulated to carry outspecialized functions peculiar to that organ.Although all the cells are programmed to pro-duce the enzymes necessary for energy produc-tion and utilization, the cells of each organ alsohave the means of expressing themselves bysynthesis of the unique macromolecules whichare necessary for the specialized function of thatorgan. In essence then, the genetic informationin each cell is programmed in terms of a typeof repression and derepression of specific genes,inducers, plus other types of regulators. Becausethe macromolecules of each cell have a finitehalf-life time, there must be regulatory mecha-nisms in the adult cell which turn the geneticinformation on and off by some kind of a feed-back or other mechanism.
A second level of regulation relates to thetranslation process. There is now evidence thatthe translation of messenger RNA, formed bythe chromatin template of nuclear DNA, eitherbefore, during, or after attachment to the ribo-some, is subject to regulatory factors. Levels oftransfer RNA (needed for converting aminoacids into aminoacyladenylates for conversioninto peptides), initiation and termination factors(needed to indicate initiation and terminationof the peptide chain on the messenger RNA),and special binding factors are known to operatein regulation at this level. Many hormones arenow thought to exert their regulatory effectsin animal systems by affecting the transcriptionnr trancl]t;nn (nr hnt nrnrePoer
Regulation is also known to occur at theenzyme level by way of feedback inhibition,conformational changes, specific activators andinhibitors, enzyme turnover, and the like.
An area of emerging importance is that ofthe role of functioning membranes as regulatorysystems. The animal cell has an elaboratesystem of membranes involving not only thesurface of the cell, but also all of the intra-cellular organelles such as mitochondria, nu-cleus, microsomes, endoplasmic reticulum, andgolgi apparatus. These membranes serve tocompartmentalize certain cellular functions, and
thus provide a system for regulation in the wayof control of transport in and out of specializedareas of the cell.
The purpose of this excursion into regulationis primarily to call attention to the fact that weare on the brink of a new set of concepts whichwill hopefully provide a more basic understand-ing of the physiology of the cell and the orga-nism. These new concepts provide a new basisfor understanding disease in all of its aspects,whether the disease is a result of genetic defect,bacterial or viral infection, toxic agents, neo-plasia, or nutritional deficiency. It is safe topredict that the unifying theme in the newerpathology will be in terms of a failure in cellregulation at the molecular level, irrespectiveof the etiology. It follows then that conceptsof diagnosis, prognosis, and therapy must bebased on these concepts if a rational basis forthe practice of clinical medicine is to emergeand replace the large areas of empirically basedmedical practice. However, we will realize thisgoal only if it is recognized as a primary pur-pose of medical education and training. This,of necessity, must mean a more profound levelof science training and education, rather thanthe trend to less profound and more superficialscience.
The limited, if not erroneous view, of thefundamental basis of disease is revealed whenthe clinician talks-and even writes textbooks-about so-called metabolic diseases. It must beemphasized that basically all diseases are pri-mnrlrl thb rnnceniiPnrp nf o rphliilar mptihnlir
disorder. This is as true of a bacterial or viralinfection, or a coronary occlusion, as it is ofdiabetes mellitus. The argument that this termis a convenient basis for classifying a group ofdiseases does not relieve the clinician who sub-scribes to this of the burden of ignorance ofwhat is the underlying basis of all disease.
In countries with major problems of medicalcare and limited scientific traditions and researchexperience, a serious problem will exist in theattempt to apply the newly emerging scientificprinciples to clinical situations. The effectiveapplication of scientific principles requires the
144

availability of a group of basically-trained scien- individual, but of limited value as an index oftists to be certain that the principle is not only nutritional adequacy-or of good health.understood to begin with, but also is being The area of nutritional research which re-appropriately applied and critically evaluated. mains to be explored in any depth has to doAfter all, the great value of a scientific principle with regulation of cell function. It is obviousis that if fully and critically understood, it will that in any overall process, there will be a rate-permit a practical application free of empirical limiting requirement for any essential ingre-considerations. Since the clinician may not in dient of that process, and any level below thatall instances be sufficiently well trained to com- rate-limiting requirement will affect, perhapsprehend, appreciate, and effectively utilize the in an all-or-none manner, the operation of thatfull potential of all of the new developments in process. What we need to know are the conse-the basic sciences, it goes without saying that quences of regulatory failure or inadequacy ofany commitment of a society to deliver effective any of the multiplicity of regulatory processesmedical care must at the same time accept a which result from dietary restrictions. At thecommitment to train and maintain a sizeable same time, we have to know what degree ofgroup of basically-oriented scientists. adaptability exists and the limits of this adapta-
Finally, a word should be mentioned about bility in the regulatory process affected bycurrent nutritional research. First off, it seems dietary restriction. Dr. Waterlow has discussedvery clear to me that we have today all the this matter in a recent publication (1). Thebasic knowledge needed regarding essential means of regulation of cell function are complexnutrients, but what we lack is the effective and finely controlled; the limits of adaptabilitymeans in the different countries for application in any given dietary situation are not wellof this knowledge in the prevention or treatment understood. The kind of information neededof primary nutritional disorders. In addition, will result not from the perpetuation of tradi-we lack a meaningful definition of health and tional experiments in human nutrition, butwhat constitutes a departure from good health. rather from experiments designed on the basisAlthough there is uncertainty as to the quanti- of the newer concepts of molecular biology andtative requirement for one or more nutrients cell regulation. It is, thus, likely that well-in one situation or another, this search for a designed animal model systems will be neededmagic number seems not likely to yield anything to exploit these newer concepts before suitablemore than a series of quantitative limits which experiments can be developed for use withmay be relevant to the requirement of a given humans.
REFERENCE
1. WATERLOW, J. C. Observations on the mechanism of adaptation to lowprotein intakes. Lancet 2: 1091-1097, 1968.
145