META- One-dimensional analyses of Rapoport’s rule … · the Rapoport effect through the...
14
© 2007 The Authors DOI: 10.1111/j.1466-8238.2006.00303.x Journal compilation © 2007 Blackwell Publishing Ltd www.blackwellpublishing.com/geb 401 Global Ecology and Biogeography, (Global Ecol. Biogeogr.) (2007) 16, 401–414 META- ANALYSIS Blackwell Publishing Ltd One-dimensional analyses of Rapoport’s rule reviewed through meta-analysis Adriana Ruggiero 1 * and Victoria Werenkraut ABSTRACT Aim To analyse quantitatively the extent to which several methodological, geographical and taxonomic variables affect the magnitude of the tendency for the latitudinal ranges of species to increase with latitude (the Rapoport effect). Location Global. Methods A meta-analysis of 49 published studies was used to evaluate the effect of several methodological and biological moderator variables on the magnitude of the pattern. Results The method used to depict the latitudinal variation in range sizes is a strong moderator variable that accounts for differences in the magnitude of the pattern. In contrast, the extent of the study or the use of areal or linear estimations of range sizes does not affect the magnitude of the pattern. The effect of geography is more consistent than the effect of taxonomy in accounting for differences in the magnitude of the pattern. The Rapoport effect is indeed strong in Eurasia and North America. Weaker or non-significant latitudinal trends are found at the global scale, and in Australia, South America and the New World. There are no significant differences in the magnitude of the pattern between different habitats, however, the overall pattern is weaker in oceans than in terrestrial regions of the world. Main conclusions The Rapoport effect is indeed strong in continental land- masses of the Northern Hemisphere. The magnitude of the effect is primarily affected by methodological and biogeographical factors. Ecological and spatial scale effects seem to be less important. We suggest that not all methodological approaches may be equally useful for analysing the pattern. Keywords Ecogeographical rule, geographical range, latitudinal gradient, macroecology, meta-analysis, Rapoport effect, range size, species ranges. *Correspondence: Adriana Ruggiero, Laboratorio Ecotono, Centro Regional Universitario Bariloche, Universidad Nacional del Comahue/CONICET, Quintral 1250 (8400) Bariloche, Rio Negro, Argentina. E-mail: [email protected] Laboratorio Ecotono, Centro Regional Universitario Bariloche, Universidad Nacional del Comahue/CONICET, Quintral 1250 (8400) Bariloche, Rio Negro, Argentina INTRODUCTION In contrast to the latitudinal diversity gradient, which is a universal feature of the spatial variation in biodiversity (Hillebrand, 2004), the tendency for the geographical ranges of species to increase with latitude (known as Rapoport’s rule; Stevens, 1989) is nowadays considered to be only a regional or local pheno- menon restricted to high latitudes in the Northern Hemisphere (Rohde, 1996, 1999; Gaston et al., 1998; but see Cardillo, 2002). Studies that focused on different regions and taxa, or that applied different methods of analysis, have come up with different perceptions of the pattern (Lyons & Willig, 1997; Gaston et al., 1998; Rohde, 1999; Ashton, 2001; Gaston, 2003). The existence of equivocal evidence in support of a Rapoport effect (i.e. 15 out of 24 studies reported in Gaston et al., 1998, support the pattern; see also Cowlishaw & Hacker, 1998; but results from simulation models also contradict the pattern; see Stauffer & Rohde, 2006; Ribas & Schoereder, 2006) has led to the dismissal of the pattern as a universal ecogeographical rule. Nonetheless, the analysis of the Rapoport effect has continued until today. Thus, it is timely to elaborate a new, quantitative, revision of the literature for re- assessment of the overall magnitude of the pattern. Given that the number of significant outcomes may have little relationship to the magnitude of an effect (Hedges & Olkin, 1985; Rosenberg
Transcript of META- One-dimensional analyses of Rapoport’s rule … · the Rapoport effect through the...
© 2007 The Authors DOI: 10.1111/j.1466-8238.2006.00303.xJournal compilation © 2007 Blackwell Publishing Ltd www.blackwellpublishing.com/geb
401
Global Ecology and Biogeography, (Global Ecol. Biogeogr.)
(2007)
16
, 401–414
META-ANALYSIS
Blackwell Publishing Ltd
One-dimensional analyses of Rapoport’s rule reviewed through meta-analysis
Adriana Ruggiero
1
* and Victoria Werenkraut
ABSTRACT
Aim
To analyse quantitatively the extent to which several methodological,geographical and taxonomic variables affect the magnitude of the tendency for thelatitudinal ranges of species to increase with latitude (the Rapoport effect).
Location
Global.
Methods
A meta-analysis of 49 published studies was used to evaluate the effect ofseveral methodological and biological moderator variables on the magnitude of thepattern.
Results
The method used to depict the latitudinal variation in range sizes is astrong moderator variable that accounts for differences in the magnitude of thepattern. In contrast, the extent of the study or the use of areal or linear estimations ofrange sizes does not affect the magnitude of the pattern. The effect of geography ismore consistent than the effect of taxonomy in accounting for differences in themagnitude of the pattern. The Rapoport effect is indeed strong in Eurasia and NorthAmerica. Weaker or non-significant latitudinal trends are found at the global scale,and in Australia, South America and the New World. There are no significantdifferences in the magnitude of the pattern between different habitats, however, theoverall pattern is weaker in oceans than in terrestrial regions of the world.
Main conclusions
The Rapoport effect is indeed strong in continental land-masses of the Northern Hemisphere. The magnitude of the effect is primarilyaffected by methodological and biogeographical factors. Ecological and spatial scaleeffects seem to be less important. We suggest that not all methodological approachesmay be equally useful for analysing the pattern.
Keywords
Ecogeographical rule, geographical range, latitudinal gradient, macroecology,
meta-analysis, Rapoport effect, range size, species ranges.
*Correspondence: Adriana Ruggiero, Laboratorio Ecotono, Centro Regional Universitario Bariloche, Universidad Nacional del Comahue/CONICET, Quintral 1250 (8400) Bariloche, Rio Negro, Argentina.E-mail: [email protected]
Laboratorio Ecotono, Centro Regional
Universitario Bariloche, Universidad Nacional
del Comahue/CONICET, Quintral
1
250 (8400)
Bariloche, Rio Negro, Argentina
INTRODUCTION
In contrast to the latitudinal diversity gradient, which is a universal
feature of the spatial variation in biodiversity (Hillebrand,
2004), the tendency for the geographical ranges of species to
increase with latitude (known as Rapoport’s rule; Stevens, 1989)
is nowadays considered to be only a regional or local pheno-
menon restricted to high latitudes in the Northern Hemisphere
(Rohde, 1996, 1999; Gaston
et al
., 1998; but see Cardillo, 2002).
Studies that focused on different regions and taxa, or that applied
different methods of analysis, have come up with different
perceptions of the pattern (Lyons & Willig, 1997; Gaston
et al.
, 1998;
Rohde, 1999; Ashton, 2001; Gaston, 2003). The existence of
equivocal evidence in support of a Rapoport effect (i.e. 15 out of
24 studies reported in Gaston
et al
., 1998, support the pattern;
see also Cowlishaw & Hacker, 1998; but results from simulation
models also contradict the pattern; see Stauffer & Rohde, 2006;
Ribas & Schoereder, 2006) has led to the dismissal of the pattern
as a universal ecogeographical rule. Nonetheless, the analysis of
the Rapoport effect has continued until today. Thus, it is timely
to elaborate a new, quantitative, revision of the literature for re-
assessment of the overall magnitude of the pattern. Given that the
number of significant outcomes may have little relationship to
the magnitude of an effect (Hedges & Olkin, 1985; Rosenberg

A. Ruggiero and V. Werenkraut
© 2007 The Authors
402
Global Ecology and Biogeography
,
16
, 401–414, Journal compilation © 2007 Blackwell Publishing Ltd
et al
., 2000), the extent to which some consistency might be
found in the magnitude of the Rapoport effect across different
taxa or regions of the world still remains debatable.
Most of the tests of the Rapoport pattern have been based on a
statistical one-dimensional approach of analysis that uses scatter
plots to show the latitudinal variation in range size over latitudinal
bands, across individual species, or have analysed changes in
the latitude:range size association with time through phylo-
genetic comparative analysis. More rarely, studies have adopted a
truly geographical perspective to map directly the mean varia-
tion of range size over continents (Australian mammals, Smith
et al
., 1994; African primates, Eeley & Foley, 1999; carabid beetles
in the Northern Hemisphere, Noonan, 1999; South American
birds, Graves & Rahbek, 2005; birds at a global scale, Orme
et al
.,
2006; New World birds, Hawkins & Diniz-Filho, 2006). Thus,
most of the analyses of range size patterns that tested the
Rapoport pattern are impregnated by the imprint of thinking in
one ‘latitudinal’ dimension (see Hawkins & Diniz-Filho, 2004) and
lack a truly geographical approach (see Ruggiero & Hawkins,
2006). Within this context, several methods of analysis have been
developed, which may influence further our perception of the
pattern (see e.g. Lyons & Willig, 1997; Blackburn & Gaston,
2006). Blackburn & Gaston (2006) have suggested that the
different approaches applied so far to the analysis of the
Rapoport effect have been equally useful for understanding the
pattern as they provide complementary information on species
ranges (cf. Ruggiero & Hawkins, 2006). The present study will
be useful for evaluating this premise in more detail. We will
show the extent to which the several methodological approaches
have influenced the magnitude of the Rapoport effect reported in
the literature.
In the present study, we analyse one-dimensional studies of
the Rapoport effect through the application of meta-analytical
techniques to quantify the overall strength of the latitudinal
gradient in range size globally, and to examine several key issues
related to the analysis of the Rapoport effect. Meta-analysis
allows the estimation of an overall magnitude of the Rapoport
effect by taking into account not merely the number of signific-
ant and non-significant outcomes obtained by different studies,
but also the strength of the latitude:range size association, as
expressed by a general measurement of ‘effect size’. A weighted
overall effect size is estimated by taking into account that the
non-systematic variance of estimates of effect size is inversely
proportional to the sample size of the studies on which estimates
are based (Hedges & Olkin, 1985; Rosenberg
et al
., 2000). Then,
such estimations of effect sizes, insensitive to the effects of
sample size, are useful for evaluating consistency among studies
and the kind of biological and non-biological moderator variables
that might be responsible for heterogeneity in the results obtained
by different authors (see Hedges & Olkin, 1985; Rosenberg
et al.
,
2000). More specifically, in the present study we evaluate
whether the strength of the latitude:range size association is
significantly correlated with the extent and focus of the study
(Rohde, 1996; Gaston
et al
., 1998; Gaston & Chown, 1999).
Although it has been suggested that the pattern is largely con-
fined to high latitudes in the Northern Hemisphere (Rohde,
1996; Gaston
et al
., 1998), the degree to which the scale and/or
the focus of studies affects the perception of the Rapoport effect
is unknown. Here, we evaluate the effect of the geographical
and taxonomic focus of a study by analysing whether the pattern
differs in strength among different taxa, habitats and/or regions
of the world.
METHODS
Choice of data
We conducted a systematic search for papers that contain the
words ‘Rapoport’ and ‘Rule’ in two literature data bases, which
retrieved 100 (JSTOR) and 79 (ISI Web of Science) papers that
matched this query. Out of the total number of papers found,
we selected a working list of 49 papers (see reference list) that
quantified the relationship between latitude and range size, thus
complementing the lists of papers previously reported by Gaston
et al
. (1998) and Gaston (2003). We distinguished among studies
that used four broad families of methods to quantify the latitudi-
nal range size variation.
(1)
Band methods
average species ranges over latitudinal bands
to quantify the latitudinal range size patterns, with three main
variants: (i) Stevens’ (1989) method shows the latitudinal
variation in the range sizes of all species recorded at each
band; examples include France (1992), Letcher & Harvey (1994),
Macpherson & Duarte (1994), Roy
et al
. (1994), Ruggiero
(1994), Hughes
et al
. (1996), Kalin-Arroyo
et al
. (1996), Price
et al
. (1997), Stevens & Enquist (1998), Santelices & Marquet
(1998), Eeley & Foley (1999), Sax (2001), Husak & Husak (2003),
Fortes & Absalao (2004) and Arita
et al
. (2005); (ii) Rohde
et al
.’s
(1993) method shows the latitudinal variation in the range sizes
of all species whose midpoints lie on each band; examples
include Rohde & Heap (1996), Lyons & Willig (1997), Mourelle
& Ezcurra (1997), Roy
et al
. (1998), Ruggiero & Lawton (1998),
Hecnar (1999) and Koleff & Gaston (2001); and (iii) Pagel
et al
.’s
(1991) method shows the latitudinal variation in the range sizes
of all species whose most distal points lie on each band; examples
include Lyons & Willig (1997) and Ruggiero (1999).
(2) The
individual species as independent points methods
use
the geographical range and location of each species as independent
data points for the analysis of the latitudinal range size variation.
Examples include Juliano (1983), Smith
et al
. (1994), Taylor &
Gotelli (1994), Blackburn & Gaston (1996), Meladiou &
Troumbis (1997), Price
et al
. (1997), Murray
et al
. (1998),
Noonan (1999), Harcourt (2000), Gillespie (2002), Ramos de
Sant’Ana
et al
. (2002), Garcillán
et al
. (2003), Macpherson
(2003), Reed (2003), Valgas
et al
. (2003), Pfenninger (2004) and
Folgarait
et al
. (2005).
(3)
Phylogenetic comparative methods
(hereafter referred to as
PC methods) use different techniques to control for phylogenetic
effects while estimating the magnitude of the latitude:range size
association. Individual species are not statistically independent
sample points and phylogenetic effects on range size have been
reported by a number of authors (e.g. Jablonski, 1987; Ricklefs &
Latham, 1992; Brown, 1995). Phylogeny has been taken into

Meta-analysis of the Rapoport effect
© 2007 The Authors
Global Ecology and Biogeography
,
16
, 401–414, Journal compilation © 2007 Blackwell Publishing Ltd
403
account in several analyses of the Rapoport effect to evaluate
whether there has been a positive range size:latitude association
through evolutionary time. Examples include Blackburn &
Gaston (1996), Edwards & Westoby (1996), Cowlishaw & Hacker
(1997), Price
et al
. (1997), Blackburn
et al
. (1998), Johnson
(1998), Ruggiero & Lawton (1998), Harcourt (2000), Diniz-
Filho & Tôrres (2002), Cardillo (2002), Olifiers
et al
. (2004),
Pfenninger (2004) and Cruz
et al
. (2005).
(4)
Across cell analyses
: studies that map directly the mean
variation of range size over continents (see references in the
Introduction) usually correlate the values of mean range size and
latitude for each cell in the map to provide a statistical estimation
of the magnitude of the Rapoport effect.
Estimation of effect sizes
In the present study we used the correlation coefficient (
r
) and
the number of observations (
n
) reported in studies to estimate a
common measure of effect size (Fisher’s
Z
-transform,
Zr
; for a
formal definition see Hedges & Olkin, 1985) using MetaWin v.2
(Rosenberg
et al
., 2000). If correlation coefficients were not avail-
able, we square-root transformed
R
2
and converted
t
-values to
r
(Rosenberg
et al
., 2000; Hillebrand, 2004).
Ideally, each independent study should be included only once
in a single meta-analysis to avoid pseudoreplication (Rosenberg
et al
., 2000). However, in the present case, the implementation of
this decision was complicated because most often studies provide
several estimations of effect size. It is a common practice in most
macroecological papers to evaluate the consistency of the latitu-
dinal range size patterns estimated in several ways. For instance,
within any single study, the latitude:range size association may be
estimated first by using species as independent points, then by
averaging ranges sizes over latitudinal bands and finally by the
calculation of independent contrasts. It is also common to
provide estimations of the latitude:range size association for
different subsets or regrouping of data, i.e. at the global scale and
then dividing the same data into Northern and Southern
Hemispheres, or considering division of all the data into different
subsets (see examples in Table 1 of Gaston
et al
., 1998). As a
consequence, we extracted a total of 246 estimations of effect
sizes from a total of 49 studies analysed. The estimation of an
overall cumulative effect size based on all these data taken
together is affected by the high level of pseudoreplication present
(246/49 or
c.
5). Thus, we conducted preliminary analyses based
on the whole data set to examine whether differences in the mag-
nitude of the pattern were associated with different methods of
analysis. Then, we conducted separate and specific meta-analyses
on the outcomes of studies that measure the latitudinal variation
in species range sizes in different ways.
We reasoned that the unit of analysis of those studies that test
the Rapoport effect through averaging range sizes over latitudinal
bands (i.e. those applying Stevens’, Rohde’s and Pagel’s methods)
are not strictly comparable to the unit of analyses of studies that
use species as independent sample points (i.e. individual ranges)
or examine correlated patterns of changes in both variables
through time using phylogenetic comparative methods (i.e.
calculating phylogenetically independent contrasts). On the
other hand, given the problem of spatial autocorrelation inherent
in Stevens’ method (see Rohde
et al
., 1993, for discussion) a great
number of studies based on this method do not provide a
quantitative estimation of an effect magnitude but rely only on visual
interpretation of trends. In this case, we calculated effect sizes
from values within the graphs. These estimations of effect size are
not based on the exact values obtained by the original researcher
but on the relative positions of data points obtained after digiti-
zation. Thus, to evaluate the effect of several biological and
methodological moderators on the magnitude of the latitude:
range size association, it seemed reasonable to conduct a separate
meta-analysis on the outcomes of studies that showed the latitu-
dinal range size variation based on different methods.
We also repeated the analyses on a restricted subset of data to
evaluate the robustness of trends after further reduction of the
level of pseudoreplication. The inclusion of papers within this
reduced subset involved the application of several criteria. If a
paper provided several estimations of effect sizes based on the
same data base, we took into account: (1) the geographical scale
— those estimations based on global-scale analyses were included
over those based on single continents or biogeographical regions;
those based on the analysis of both hemispheres were included
over those based on the Northern or the Southern Hemispheres;
(2) taxonomic inclusiveness — those estimations of effect sizes
based on a high-order taxon (e.g. mammals) were included over
those based on subordinate taxa (e.g. primates, carnivores); and
(3) range size estimations — effect sizes based on the use of linear
estimations of range sizes (i.e. latitudinal extent) were included
over those based on areal estimations. The level of pseudoreplica-
tion after the application of these inclusion criteria decreased
considerably, from
c.
5 (246/49: all effects/all studies) to
c.
2
(38/20: Stevens’ method),
c.
1.75 (21/12: Rohde’s method),
c.
1.75 (42/24: individual species as independent points) and
c.
1.4 (14/10: phylogenetic comparative methods). The list of
papers with estimations of effect sizes used and the results
obtained from this reduced subset of data are provided in
Appendix S1 in Supplementary Material.
Choice of moderator variables
Each estimation of effect size was classified with respect to the
following eight variables characterizing aspects of methodology,
taxonomy and biogeography that we considered might poten-
tially affect the magnitude of the Rapoport effect. (1) Extent of
study. This is a continuous quantitative variable. The latitudinal
range of each study was estimated as the difference between the
northernmost and southernmost latitudinal limits of the study.
The approximate latitudinal limits of the regions/continents
studied were used for those studies that did not report the exact
latitudinal limits. (2) Unit of analysis — a categorical variable
with three levels: bands, contrasts, species as independent points.
(3) Type of band method — a categorical variable with three
levels, namely Stevens’, Pagel’s and Rohde’s methods. (4) High
order taxon — a categorical variable with seven levels: mammals,
birds, invertebrates, vascular plants, fishes, reptiles, amphibians.

A. Ruggiero and V. Werenkraut
© 2007 The Authors
404
Global Ecology and Biogeography
,
16
, 401–414, Journal compilation © 2007 Blackwell Publishing Ltd
(5) Type of habitat — a categorical variable with five levels:
terrestrial, marine, freshwater, freshwater and coastal, freshwater
and terrestrial. (6) Terrestrial regions — a categorical variable
with 10 levels: Eurasia (in this level were included studies focused
on Eurasia, Europa, Asia, Palaearctic, Southeast Asia), Africa,
Madagascar, Holarctic, North America (included studies that
focused on North America, North and Central America), Central
America, South America (
idem
South America, Neotropics,
Andes), New World, Australia, Global. (7) Marine regions — a
categorical variable with three levels: Atlantic, Pacific (included
studies that focused on Pacific, Indo-Pacific), Pacific/Atlantic.
(8) Hemisphere — a categorical variable with three levels:
Northern, Southern, both.
Analyses of data
We conducted a weighted regression analysis in
metawin
2.0
(Rosenberg
et al
., 2000) to test for the effect of continuous
moderator variables on the magnitude of the Rapoport effect.
This allows us to estimate whether the total amount of hetero-
geneity explained by the continuous moderator variable (
Q
M
)
is statistically significant.
metawin
also allows us to test
whether categorical variables explained a significant amount of
heterogeneity in the effect sizes using a random effect model,
through comparing the overall heterogeneity in the effect sizes
explained by the categorical variable (
Q
B
) with the residual
heterogeneity (Rosenberg
et al
., 2000). The significance levels
(
P
) for the analyses of heterogeneity are obtained by 999
randomizations. Non-overlapping 95% confidence intervals
(95% CI) indicate a significant difference between levels within
categorical variables.
One disadvantage of the meta-analytic approach is that it does
not allow the interactions between explanatory variables to be
quantified. It is not possible to formally test the extent to which
the effect of the method of analysis interacts with the effect of
taxa and/or biogeographical regions to account for differences in
the magnitude of the Rapoport effect. Note, for instance, that the
distribution of taxa and biogeographical regions within different
methods of analysis is not homogeneous (results from a
G
-test:
G
taxa
= 101,
χ
2
(0.05; 28) = 41.34,
P
= 0.003;
G
biog reg
= 156.3,
χ
2
(0.05; 48) = 65.17,
P
< 0.001; see also below); neither is
the distribution of taxa within biogeographical regions (
G
=
362.5,
χ
2
(0.05; 96) = 119.87). In part, we try to partially over-
come this problem by conducting a separate meta-analysis on
effect sizes obtained through different methods but we must
caution that this only partially reduces the problem.
RESULTS
A preliminary cumulative meta-analysis showed that there is
a significant, although low, Rapoport effect across all data
(
n
= 246):
Zr
= 0.3109 (
r
= 0.30, 95% CI = 0.296, 0.326). However,
the high level of heterogeneity
Q
total
= 4426.884 (
P
< 0.00001)
suggests the existence of significant moderator variables that may
account for differences in the magnitude of the effect within this
data set.
The effect of different methods of analysis on the test of the latitudinal Rapoport effect
When the 246 estimations of effect sizes are taken together, the
method of analysis applied to examine the latitude:range size
association has a significant influence on the magnitude of the
Rapoport effect (
Q
B
= 15.17,
P
= 0.074). Although all methods
suggest an overall positive latitudinal trend in the range size of
species, a stronger latitude:range size association is revealed
through the application of band methods (
Zr
= 0.50, 95% CI =
0.40, 0.61,
n
= 118) and independent contrasts (
Zr
= 0.50, 95%
CI = 0.30, 0.70,
n
= 31) rather than through the use of individual
species as independent points (
Zr
= 0.22, 95% CI = 0.11, 0.33,
n
= 31). The number of studies that quantify the variation
of mean range size across cells in a grid map is too small (
n
= 3)
to reveal significance, however, these kind of analyses still
suggest a positive overall latitudinal pattern (
Zr
= 0.40, 95%
CI =
−
0.87, 1.68).
When we examine in more detail the outcomes of studies that
applied different band methods, it is clear that the magnitude
of the Rapoport effect is affected by the way studies average
the range size of species over latitudinal bands. Studies that
applied Stevens’ method show a significant and strong positive
latitudinal pattern in the mean range size of species (
Zr
= 0.88,
95% CI = 0.62, 1.14,
n
= 60); the same positive — although non-
significant — trend is suggested by studies that applied Pagel’s
method (
Zr
= 0.67, 95% CI =
−
0.17, 1.51,
n
= 8), but those that
followed Rohde’s do not reveal latitudinal trends (
Zr
= 0.03, 95%
CI =
−
0.26, 0.32,
n
= 50).
After diminishing the level of pseudoreplication in the
reduced subset of data there are still differences in the strength of
the pattern associated with different methods of analysis (see
Table S1 in Supplementary Material). Studies that applied
Stevens’ method show a significant and strong positive latitudinal
pattern in the mean range size of species. A positive, though
weaker, latitude:range size association is suggested by studies that
use individual species as independent points. In contrast, no
significant latitudinal trends, though overall still positive, emerge
from studies that applied Rohde’s and phylogenetic comparative
methods (Table S1). Fail-safe tests indicate that the significance
of results obtained from studies that applied Stevens’ method or use
individual species as independent points is not seriously affected
by the file-drawer problem (i.e. the deficit of non-significant
published studies; Arnqvist & Wooster, 1995; Rosenberg
et al
.,
2000). The year of publication also does not account for dif-
ferences in the effect sizes reported by different studies. This con-
firms that the method chosen to analyse the latitudinal variation
in range sizes can be considered a significant moderator variable
that accounts for differences in the magnitude of the Rapoport
effect reported in the published literature. In contrast, other
methodological decisions, such as the use of linear (i.e. latitudinal
extents) or areal estimations of range do not affect the outcomes
of the analyses (
Q
B
= 0.38,
P
= 0.704,
n
= 246; Stevens’ method:
Q
B
= 0.153,
P
= 0.743; Rohde’s method:
Q
B
= 0.119,
P
= 0.733;
independent contrasts:
Q
B
= 1.499,
P = 0.375; individual species
as independent points: QB = 4.792, P = 0.054).

Meta-analysis of the Rapoport effect
© 2007 The Authors Global Ecology and Biogeography, 16, 401–414, Journal compilation © 2007 Blackwell Publishing Ltd 405
The effect of geographical scale and location of the latitudinal limits of studies on the test of the latitudinal Rapoport effect
The latitudinal extent of the study does not have an influence on
the magnitude of the Rapoport effect when the 246 estimations
of effect sizes are analysed together (slope: s = −0.0006, P =
0.106). The division of the data into different methods (Fig. 1 &
Table S2 in Supplementary Material) shows that Stevens’
band method suggests a significant tendency for the strength of
the pattern to decrease with the extent of the study, although the
proportion of variance in the magnitude of the Rapoport effect
explained by the extent of the study is low (Fig. 1 & Table S2).
The analysis of the effect of the most extreme latitudinal limits
of studies offers another way to test for the effect of geographical
location on the magnitude of the Rapoport effect. The 246 esti-
mations of effect sizes analysed together show no evidence of a
significant effect of the northernmost latitudinal limit of studies
on the magnitude of the Rapoport effect (s = −0.0006, d.f. = 243,
P < 0.098; QM = 0.61, P = 0.434). A tendency for the Rapoport
effect to be stronger as the northern latitudinal limits of studies
extend towards the north is found only within studies that used
species as independent points (Fig. 2 & Table S2). Rather there
is a more consistent effect of the location of the southernmost
limits of studies on the magnitude of the Rapoport effect
(s = 0.0049, d.f. = 243, P = 0.001; QM = 21.04, P < 0.00001). The
outcomes of analyses applying Stevens’, Pagel’s and PC methods
suggest that the latitudinal Rapoport effect is less detectable as
the latitudinal limits of studies extend towards the south (Fig. 3
& Table S2).
Figure 1 Test of the effect of the extent of the study on the magnitude of the Rapoport effect: S, slope obtained from weighted regression analysis; P, probability values; QM, amount of heterogeneity in the data explained by the latitudinal extent of studies; Zr, Fisher’s Z-transformation of correlation coefficients.
A. Ruggiero and V. Werenkraut
© 2007 The Authors406 Global Ecology and Biogeography, 16, 401–414, Journal compilation © 2007 Blackwell Publishing Ltd
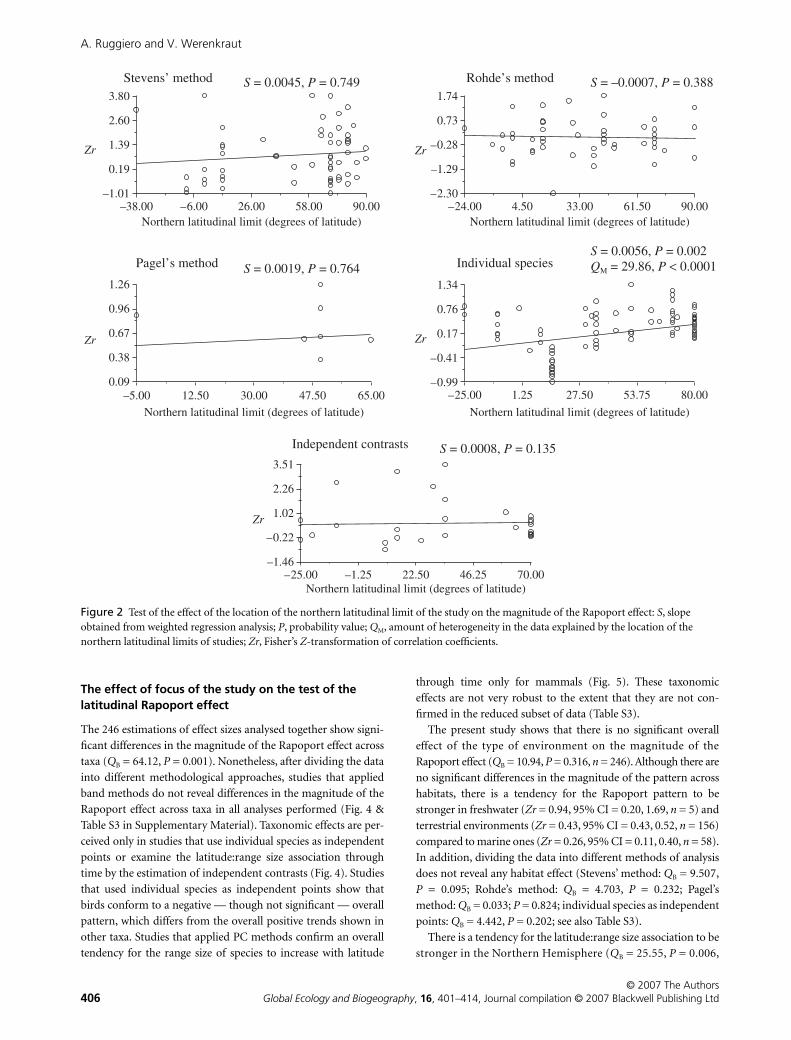
The effect of focus of the study on the test of the latitudinal Rapoport effect
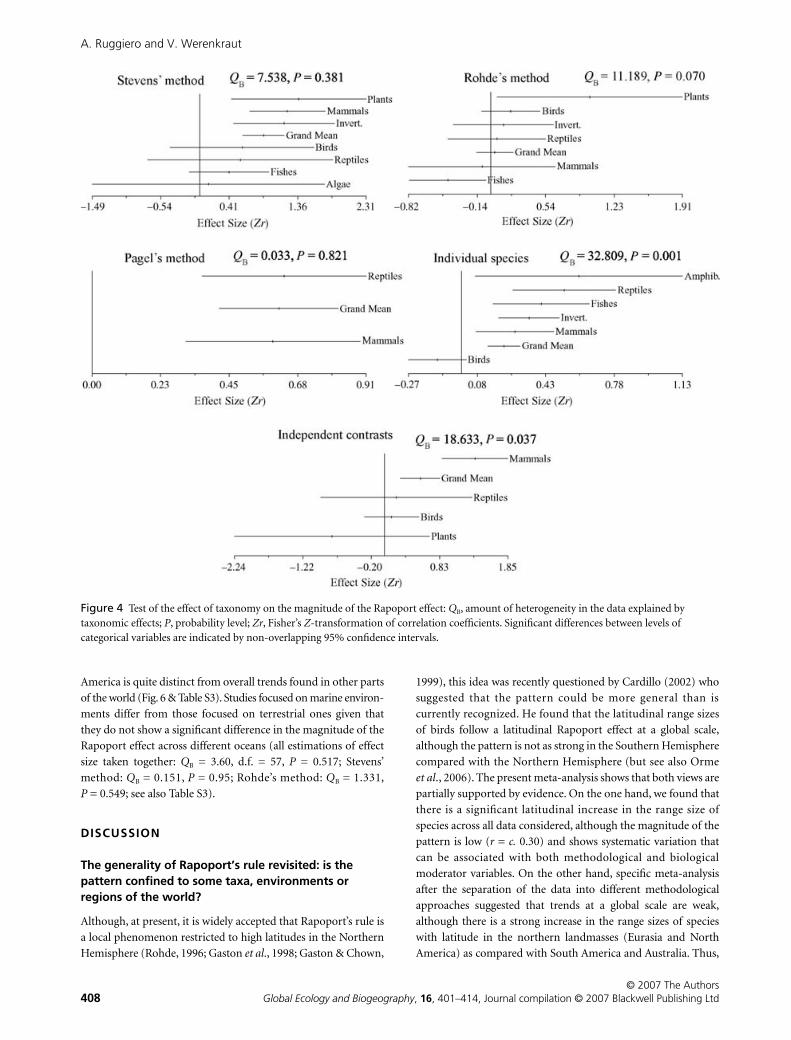
The 246 estimations of effect sizes analysed together show signi-
ficant differences in the magnitude of the Rapoport effect across
taxa (QB = 64.12, P = 0.001). Nonetheless, after dividing the data
into different methodological approaches, studies that applied
band methods do not reveal differences in the magnitude of the
Rapoport effect across taxa in all analyses performed (Fig. 4 &
Table S3 in Supplementary Material). Taxonomic effects are per-
ceived only in studies that use individual species as independent
points or examine the latitude:range size association through
time by the estimation of independent contrasts (Fig. 4). Studies
that used individual species as independent points show that
birds conform to a negative — though not significant — overall
pattern, which differs from the overall positive trends shown in
other taxa. Studies that applied PC methods confirm an overall
tendency for the range size of species to increase with latitude
through time only for mammals (Fig. 5). These taxonomic
effects are not very robust to the extent that they are not con-
firmed in the reduced subset of data (Table S3).
The present study shows that there is no significant overall
effect of the type of environment on the magnitude of the
Rapoport effect (QB = 10.94, P = 0.316, n = 246). Although there are
no significant differences in the magnitude of the pattern across
habitats, there is a tendency for the Rapoport pattern to be
stronger in freshwater (Zr = 0.94, 95% CI = 0.20, 1.69, n = 5) and
terrestrial environments (Zr = 0.43, 95% CI = 0.43, 0.52, n = 156)
compared to marine ones (Zr = 0.26, 95% CI = 0.11, 0.40, n = 58).
In addition, dividing the data into different methods of analysis
does not reveal any habitat effect (Stevens’ method: QB = 9.507,
P = 0.095; Rohde’s method: QB = 4.703, P = 0.232; Pagel’s
method: QB = 0.033; P = 0.824; individual species as independent
points: QB = 4.442, P = 0.202; see also Table S3).
There is a tendency for the latitude:range size association to be
stronger in the Northern Hemisphere (QB = 25.55, P = 0.006,
Figure 2 Test of the effect of the location of the northern latitudinal limit of the study on the magnitude of the Rapoport effect: S, slope obtained from weighted regression analysis; P, probability value; QM, amount of heterogeneity in the data explained by the location of the northern latitudinal limits of studies; Zr, Fisher’s Z-transformation of correlation coefficients.

Meta-analysis of the Rapoport effect
© 2007 The Authors Global Ecology and Biogeography, 16, 401–414, Journal compilation © 2007 Blackwell Publishing Ltd 407
n = 246), however, the significant effect of hemisphere is
confirmed only within studies that applied Stevens’ method
(QB = 10.840, P = 0.016). No significant differences in the mag-
nitude of the Rapoport effect between hemispheres is observed
within studies concerned with other methods of analysis (Rohde’s
method: QB = 5.645, P = 0.078; Pagel’s method: QB = 3.404,
P = 0.088; individual species: QB = 3.176, P = 0.300; PC methods:
QB = 1.757, P = 0.656); neither is the effect of hemisphere
confirmed in the reduced data set (Table S3).
When the total estimations of effect sizes are considered as
a whole, there are significant differences in the magnitude of
the Rapoport effect across different terrestrial biogeographical
regions (QB = 113.28, P = 0.001, n = 188). The strong positive
patterns found in the northern landmasses (North America:
Zr = 1.11, 95% CI = 0.90, 1.32, n = 30, Eurasia: Zr = 0.76, 95%
CI = 0.53, 1.00) contrast with the weak trends found at the global
scale (Zr = 0.15, 95% CI = −0.18, −0.48, n = 13) and in South America
(Zr = 0.29, 95% CI = 0.12, 0.45, n = 45) or the negative patterns
reported in Australia (Zr = −0.20, 95% CI = −0.67, 0.27, n = 9)
and Central America (Zr = −0.50, 95% CI = −0.82, −0.18, n = 13).
Dividing the data into different methods of analysis basically
suggests the same trends. Effect sizes derived from the application
of Stevens’ band method suggest that the strongest Rapoport
pattern is found in North America. The positive latitude:
range size association there differs significantly from patterns
shown in South America, in the New World or in Australia (Fig. 5).
Studies that used individual species as independent points
also suggest a stronger Rapoport effect for analyses restricted to
North America and Eurasia (Palaearctic) regions. In general,
North America differs significantly from the positive — though
weaker — latitudinal trends found in the New World, South
America, Australia and the whole world. Eurasia differs signi-
ficantly from the trends found in South America and the whole
world. Also, the negative latitudinal pattern found in Central
Figure 3 Test of the effect of the location of the southern latitudinal limit of the study on the magnitude of the Rapoport effect: S, slope obtained from weighted regression analysis; P, probability value; QM, amount of heterogeneity in the data explained by the location of the southern latitudinal limits of studies; Zr, Fisher’s Z-transformation of correlation coefficients.
A. Ruggiero and V. Werenkraut
© 2007 The Authors408 Global Ecology and Biogeography, 16, 401–414, Journal compilation © 2007 Blackwell Publishing Ltd
America is quite distinct from overall trends found in other parts
of the world (Fig. 6 & Table S3). Studies focused on marine environ-
ments differ from those focused on terrestrial ones given that
they do not show a significant difference in the magnitude of the
Rapoport effect across different oceans (all estimations of effect
size taken together: QB = 3.60, d.f. = 57, P = 0.517; Stevens’
method: QB = 0.151, P = 0.95; Rohde’s method: QB = 1.331,
P = 0.549; see also Table S3).
DISCUSSION
The generality of Rapoport’s rule revisited: is the pattern confined to some taxa, environments or regions of the world?
Although, at present, it is widely accepted that Rapoport’s rule is
a local phenomenon restricted to high latitudes in the Northern
Hemisphere (Rohde, 1996; Gaston et al., 1998; Gaston & Chown,
1999), this idea was recently questioned by Cardillo (2002) who
suggested that the pattern could be more general than is
currently recognized. He found that the latitudinal range sizes
of birds follow a latitudinal Rapoport effect at a global scale,
although the pattern is not as strong in the Southern Hemisphere
compared with the Northern Hemisphere (but see also Orme
et al., 2006). The present meta-analysis shows that both views are
partially supported by evidence. On the one hand, we found that
there is a significant latitudinal increase in the range size of
species across all data considered, although the magnitude of the
pattern is low (r = c. 0.30) and shows systematic variation that
can be associated with both methodological and biological
moderator variables. On the other hand, specific meta-analysis
after the separation of the data into different methodological
approaches suggested that trends at a global scale are weak,
although there is a strong increase in the range sizes of species
with latitude in the northern landmasses (Eurasia and North
America) as compared with South America and Australia. Thus,
Figure 4 Test of the effect of taxonomy on the magnitude of the Rapoport effect: QB, amount of heterogeneity in the data explained by taxonomic effects; P, probability level; Zr, Fisher’s Z-transformation of correlation coefficients. Significant differences between levels of categorical variables are indicated by non-overlapping 95% confidence intervals.

Meta-analysis of the Rapoport effect
© 2007 The Authors Global Ecology and Biogeography, 16, 401–414, Journal compilation © 2007 Blackwell Publishing Ltd 409
we confirm that, in contrast to the ubiquitous latitudinal gradi-
ent in species diversity (Hillebrand, 2004) or the species–area
relationship (Drakare et al., 2006), the Rapoport effect is a ‘local
phenomenon’ (sensu Rohde, 1996).
The lack of generality of the Rapoport effect at the global scale has
often been understood as reflecting differences in land availability
and climatic conditions between the Northern and Southern
Hemispheres (e.g. Gaston & Chown, 1999; Cardillo, 2002).
Nonetheless, the present meta-analysis shows that there is no
significant effect of hemisphere on the magnitude of the pattern
for most methods of analysis (all but Stevens’). Neither are there
differences in the magnitude of the pattern that can be associated
with differences in habitat type, although a weak tendency for the
pattern to be stronger in mainland rather than in marine habitats
is suggested. This opens the possibility that differences in the
magnitude of the Rapoport pattern across northern and southern
continents are probably mediated through the role of biogeo-
graphical factors rather than being the consequence of climatic
or ecological differences between the Northern and Southern
Hemispheres.
Although we think that there is considerable added value in
the application of a meta-analysis to study the Rapoport effect,
we are aware of the kind of potential problems associated with
this kind of quantitative revision. The application of a meta-
analysis, by definition, obscures the details of particular cases,
which represents considerable loss of biological information (see
e.g. Simberloff, 2006, for a related discussion on this specific
topic). Such kinds of detail are evident only in those primary
works that applied a truly geographical perspective (e.g. Hawkins
& Diniz-Filho, 2006; Orme et al., 2006). On the other hand,
although doing a specific meta-analysis for subsets of data,
as performed in the present study, allows the evaluation of the
effect of specific taxonomic or geographical variables on the
magnitude of the Rapoport effect, there are still some other issues
that complicate the interpretation. Specifically, the uneven
distribution of studies across taxa or regions (Fig. 6) produces an
interaction between the imprints of geographical and taxonomic
effects on the magnitude of the pattern that potentially may
influence conclusions derived from the present study. Thus, the
significant Rapoport effect in Africa could be because the majority
of studies conducted there are focused on mammals rather than
due to pure geographical effects. The extreme negative value of
Central America can be due to the influence of most of the studies
there being based on birds (Fig. 6). Given the paucity of studies
for Africa and Central America we are, at present, unable to
disentangle the relative role of both factors (taxonomic and
biogeographical) on the magnitude of the pattern found in these
regions. In contrast, we can affirm that the negative trend found
in Australia is truly geographical, given the sufficient number of
studies focused on different taxa there that suggest the same neg-
ative pattern. We can have confidence in the effect of taxonomy
on effect sizes derived from studies that applied the independent
contrast method, which do not reveal a significant effect of bio-
geographical region. Similarly, we can be confident that there is
an effect of geography affecting the magnitude of the Rapoport
effect derived from studies that used Stevens’ method which, in
Figure 5 Test of the effect of geographical region on the magnitude of the Rapoport effect: QB, amount of heterogeneity in the data explained by geography. Zr, Fisher’s Z-transformation of correlation coefficients. Significant differences between levels of categorical variables are indicated by non-overlapping 95% confidence intervals.

A. Ruggiero and V. Werenkraut
© 2007 The Authors410 Global Ecology and Biogeography, 16, 401–414, Journal compilation © 2007 Blackwell Publishing Ltd
turn, do not reveal a significant effect of taxonomy on the
magnitude of the Rapoport effect. The interaction between
taxonomic and geographical effects remains an issue that deserves
further study.
Are all methodological approaches equally useful for understanding the pattern?
We showed that indeed the method of analysis used to show the
latitudinal variation in range size is a strong moderator variable
of the magnitude of the Rapoport pattern. Actually, it is one of
the reasons for the existence of equivocal evidence in support of
the pattern. In general, studies that average range sizes over
latitudinal bands or examine the relationship between range size
and latitude through the estimation of phylogenetically in-
dependent contrasts show more consistent overall positive latitudinal
trends in range sizes than studies that use individual species as
independent points or examine the variation in the mean range
size within cells. The same tendency for phylogenetic methods to
provide significant evidence in support of the Rapoport effect (in
contrast to non-significant latitudinal variation found by cross-
species analysis) was suggested in an independent analysis of
global range size patterns in birds (Cardillo, 2002). Differences in
the outcomes of phylogenetic and non-phylogenetic approaches
applied to the analysis of patterns in species ranges may be rather
expected given that only phylogenetic methods are able to reveal
the evolutionary history underlying range size patterns (Black-
burn & Gaston, 2006). However, the present study emphasizes
that studies that take into account the effects of phylogeny could
indeed be more appropriate than band methods to test the
Rapoport pattern across different taxa.
In our opinion, the very contrasting results that can be
obtained from the application of different methods cannot be
understood as merely representing complementary information
on species range patterns (see also Lyons & Willig, 1997). The
methods applied to show the latitudinal variation in range sizes
represent very different ways of reducing the original informa-
tion to basic data susceptible to analysis by the statistical method.
This is an important issue to take into account, particularly when
statistics is taken as the ultimate indication of the latitude:range
size association. For instance, as shown by the present analysis,
using mean range sizes averaged over bands as basic units for
statistical analysis will tend to reduce the number of observations,
and hence the power of statistical tests. Trends will eventually
vanish when information is reduced to the extreme so as to con-
form to the statistical assumptions of independence through the
application of Rohde’s method. As shown by the present analysis,
Rohde’s method tends to reveal only a weak overall positive lati-
tudinal trend in range size throughout, which is also insensitive
to the effects of most moderator variables considered. On the
other hand, although using individual species as independent
points may greatly increase the number of observations, it intro-
duces a great amount of dispersion into the data.
Rohde (pers. comm.; see also Rohde et al., 1993; Rohde, 1999;
Stauffer & Rohde, 2006) emphasizes that his midpoint method
makes better biological sense because it is likely that species have
originated somewhere near the midpoint of their distributions,
from which they have spread into adjacent latitudes, rather than
at the margins of their distributions. This implies, for instance,
an assumption that widespread species that cross tropical lati-
tudes are likely to be of tropical origin and, thus, should be
excluded from the analyses at high latitudes. The assumption
about the tropical origin of widespread species is rather related to
the idea that latitudinal gradients in species diversity may have
arisen as the result of faster evolutionary rates at high tempera-
tures (Rohde, 1992; Jablonski, 1993; Wright et al., 2006), which
implies that many new species may have arisen predominantly in
Figure 6 Relative distribution of effect sizes estimated on (a) geographical region within each method, (b) taxa within each method, and (c) taxa within each geographical region. Abbrevia-tions: Afr, Africa; Atl, Atlantic Ocean; Aus, Australia; CAm, Central America; Eur, Eurasia; G, global; Hol, Holarctic; Mad, Madagascar; NAm, North America; NWo, New World; P/A, Pacific and Atlantic Oceans; Pac, Pacific Ocean; SAm, South America.
Meta-analysis of the Rapoport effect
© 2007 The Authors Global Ecology and Biogeography, 16, 401–414, Journal compilation © 2007 Blackwell Publishing Ltd 411
the tropics from where they spread into higher latitudes (e.g.
Rohde & Stauffer, 2005; out of the tropics model, Jablonski et al.,
2006). However, we think that caution is needed when making
generalizations about the origin of species based exclusively on
the location of midpoints of species’ present distributions (see
also Stauffer & Rohde, 2006). Historical shifts in distributions
complicate the identification of the area of origin of species (see
Jablonski et al., 2006, for discussion). Provided that phylogenetic
relationships among species are taken into account, such historical
shifts can be traced back to make a hypothesis of the likely
location of a species’ ancestral area (e.g. Nelson, 1969; Bremer,
1992). Thus, even when Rohde’s method is correct from the
statistical point of view, we think it is worth asking whether it
is equally valid from a biological perspective.
Studies that incorporate a geographical perspective into the
test of the Rapoport effect often use data taken from cells in a
grid map as the basis for the statistical analysis. However, after
the extraction of data from the cells, the geographical structure is
lost (unless specific spatial statistics is incorporated into the ana-
lysis) and the use of individual cells as units of analysis introduces
a great amount of dispersion into the data, which may result in
weaker and more variable trends. Within a geographical context,
the existence of the Rapoport effect could be more easily deducible
directly from visual examination of maps on a simple qualitative
basis. In contrast, if the analysis is on an ‘individual species
focus’ (sensu Ruggiero & Hawkins, 2006) the application of the
phylogenetic comparative method would be recommended to
reduce the original information according to a phylogenetic
design that, at the same time, produces statistically independent
basic data.
The present meta-analysis suggests that the decision of using
areal or linear estimations of range sizes has no significant effect
on the magnitude of the Rapoport effect reported in the literature.
This is likely reflecting that the magnitudes of the latitudinal and
longitudinal axes of species distributions tend to be positively
correlated (Gaston et al., 1998). The scale of analysis, as estimated
by the extent and geographical location of the latitudinal limits
of studies, also has a minimal effect on the magnitude of the
Rapoport effect. The confinement of the Rapoport effect to some
continental regions of the world might partially explain the lack
of influence of the spatial scale of analysis on the magnitude of
the effect. This contrasts with the significant effects of spatial
scale known to influence large-scale patterns in species diversity
(e.g. Hillebrand, 2004; Rahbek, 2005; Drakare et al., 2006).
We think it is timely to begin methodological agreements to
ease comparison between the outcomes of different studies.
Although so far the most common method of studying Rap-
oport’s rule is to plot a measure of range size versus latitude, this
should not represent a conceptual constraint for critical assessment
of current methods and the development of new approaches.
After more than a decade of intense study of this pattern, it is
difficult to disentangle the role of competing hypotheses invoked
to explain the spatial variation in the range size of species at
the continental scale (e.g. Brown, 1995; Gaston et al., 1998).
The present study shows that the different methodological
approaches applied so far to test the Rapoport effect have had
a strong impact in our perception of the pattern and have com-
plicated the interpretation. Even when a statistical approach is
adopted to disentangle the role of competing hypotheses, the way
the basic information on species distribution is compiled and
reduced for statistical analysis depends strongly on the way in
which the relationship between latitude and range is shown. As
also suggested by Lomolino et al. (2006), coordinated efforts are
needed to move conceptually from the primary objective of test-
ing the pattern to a more integrative approach that allows the
elaboration and testing of a specific hypothesis that may account
for differences in the magnitude of the pattern between different
taxa and regions of the world.
ACKNOWLEDGEMENTS
H. Hillebrand, P. Rodríguez Moreno, K. Rohde, J. Lockwood and
an anonymous referee gave valuable comments and suggestions
to improve the manuscript. F. Cruz, J.A.F. Diniz-Filho, P.P. Gar-
cillán, S.A. Juliano and M. Pfenninger contributed with papers,
original data and information that otherwise would have been
unavailable to us. A.R. and V.W. receive financial support from
CONICET (PIP2005-5113), Universidad Nacional del Comahue
and Agencia-FONCYT (PICT2002/01-11826).
REFERENCES
Note: (M) Highlights papers used as sources for the meta-analysis.
Arita, H.T., Rodríguez, P. & Vázquez-Domínguez, E. (2005)
Continental and regional ranges of North American mammals:
Rapoport’s rule in real and null worlds. Journal of Biogeography,
32, 1–11. (M)Arnqvist, G. & Wooster, D. (1995) Meta-analysis: synthesizing
research findings in ecology and evolution. Trends in Ecology &
Evolution, 10, 236–240.
Ashton, K.G. (2001) Are ecological and evolutionary rules being
dismissed prematurely? Diversity and Distributions, 7, 289–
295.
Blackburn, T.M. & Gaston, K.J. (1996) Spatial patterns in the
geographic range sizes of bird species in the New World. Philo-
sophical Transactions of the Royal Society of London Series B,
Biological Sciences, 351, 897–912. (M)Blackburn, T.M., Gaston, K.J. & Lawton, J.H. (1998) Patterns in
the geographic ranges of the world’s woodpeckers. Ibis, 140,
626–638. (M)Blackburn, T.M. & Gaston, K.J. (2006) There’s more to macro-
ecology than meets the eye. Global Ecology and Biogeography,
15, 537–540.
Bremer, K. (1992) Ancestral areas: a cladistic reinterpretation of
the center of origin concept. Systematic Biology, 41, 436–
445.
Brown, J.H. (1995) Macroecology. University of Chicago Press,
Chicago, IL.
Cardillo, M. (2002) The life-history basis of latitudinal diversity
gradients: how do species traits vary from the poles to the
equator? Journal of Animal Ecology, 71, 79–87.

A. Ruggiero and V. Werenkraut
© 2007 The Authors412 Global Ecology and Biogeography, 16, 401–414, Journal compilation © 2007 Blackwell Publishing Ltd
Cowlishaw, G. & Hacker, J.E. (1997) Distribution, diversity, and
latitude in African primates. The American Naturalist, 150,
505–512. (M)Cowlishaw, G. & Hacker, J.E. (1998) Too much latitude for
Rapoport’s rule? Trends in Ecology & Evolution, 13, 241–242.
Cruz, F.B., Fitzgerald, L.A., Espinoza, R.E. & Schulte, J.A. (2005)
The importance of phylogenetic scale in tests of Bergmann’s
and Rapoport’s rules: lessons from a clade of South American
lizards. Journal of Evolutionary Biology, 18, 1559–1574. (M)Diniz-Filho, J.A.F. & Tôrres, N.M. (2002) Rapoport effect in
South American Carnivora (Mammalia): null models under
geometric and phylogenetic constraints. Brazilian Journal of
Biology, 62, 437–444. (M)Drakare, S., Lennon, J.J. & Hillebrand, H. (2006) The imprint
of the geographical, evolutionary and ecological context on
species–area relationships. Ecology Letters, 9, 215–227.
Edwards, W. & Westoby, M. (1996). Reserve mass and dispersal
investment in relation to geographic range of plant species:
phylogenetically independent contrasts. Journal of Biogeography,
23, 329–338. (M)Eeley, H.A.C. & Foley, R.A. (1999) Species richness, species
range size and ecological specialisation among African pri-
mates: geographical patterns and conservation implications.
Biodiversity and Conservation, 8, 1033–1056. (M)Folgarait, P.J., Bruzzone, O., Porter, S.D., Pesquero, M.A. &
Gilbert, L.E. (2005) Biogeography and macroecology of phorid
flies that attack fire ants in southeastern Brazil and Argentina.
Journal of Biogeography, 32, 353–367. (M)Fortes, R.R. & Absalao, R.S. (2004) The applicability of Rap-
oport’s rule to the marine molluscs of the Americas. Journal of
Biogeography, 31, 1909–1916. (M)France, R. (1992) The North American latitudinal gradient in
species richness and the geographical range of freshwater cray-
fish and amphipods. The American Naturalist, 139, 343–354.
(M)Garcillán, P.P., Ezcurra, E. & Riemann, H. (2003) Distribution
and species richness of woody dryland legumes in Baja Cali-
fornia, Mexico. Journal of Vegetation Science, 14, 475–486. (M)Gaston, K.J. (2003) The structure and dynamics of geographic
ranges. Oxford University Press, Oxford.
Gaston, K.J. & Blackburn, T.M. (1996) Range size–body size rela-
tionships: evidence of scale dependence. Oikos, 75, 479–485.
Gaston, K.J. & Chown, S.L. (1999) Why Rapoport’s rule does not
generalise. Oikos, 84, 309–312.
Gaston, K.J., Blackburn, T.M. & Spicer, J.I. (1998) Rapoport’s
rule: time for an epitaph? Trends in Ecology & Evolution, 13,
70–74.
Gillespie, T.W. (2002) Latitudinal extent and natural history
characteristics of birds in Nicaragua. Global Ecology and Bio-
geography, 11, 411–417. (M)Graves, G.R. & Rahbek, C. (2005) Source pool geometry and the
assembly of continental faunas. Proceedings of the National
Academy of Sciences USA, 102, 7871–7876.
Harcourt, A.H. (2000) Latitude and latitudinal extent: a global
analysis of the Rapoport effect in a tropical mammalian taxon:
primates. Journal of Biogeography, 27, 1169–1182. (M)
Hawkins, B.A. & Diniz-Filho, J.A.F. (2004) ‘Latitude’ and geo-
graphic patterns in species richness. Ecography, 27, 268–272.
Hawkins, B.A. & Diniz-Filho, J.A.F. (2006) Beyond Rapoport’s
rule: evaluating range size patterns of New World birds in a
two-dimensional framework. Global Ecology and Biogeography,
15, 461–469.
Hecnar, S.J. (1999) Patterns of turtle species’ geographic range
size and a test of Rapoport’s rule. Ecography, 22, 436–446. (M)Hedges, L.V. & Olkin, I. (1985) Statistical methods for meta-analysis.
Academic Press, New York.
Hillebrand, H. (2004) On the generality of the latitudinal diver-
sity gradient. The American Naturalist, 163, 192–211.
Hughes, L., Cawsey, E.M. & Westoby, M. (1996) Geographic and
climatic range sizes of Australian eucalypts and a test of Rap-
oport’s rule. Global Ecology and Biogeography, 5, 128–142. (M)Husak, M.S. & Husak, A.L. (2003) Latitudinal patterns in range
sizes of New World woodpeckers. The Southwestern Naturalist,
48, 61–69. (M)Jablonski, D. (1987) Heritability at the species level: analysis of
geographic ranges of Cretaceous mollusks. Science, 238, 360–
363.
Jablonski, D. (1993) The tropics as a source of evolutionary
novelty through geological time. Nature, 364, 142–144.
Jablonski, D., Roy, K. & Valentine, J.W. (2006) Out of the tropics:
evolutionary dynamics of the latitudinal diversity gradient.
Science, 314, 102–106.
Johnson, C.N. (1998) Rarity in the tropics: latitudinal gradients
in distribution and abundance in Australian mammals.
Journal of Animal Ecology, 67, 689–698. (M)Juliano, S.A. (1983) Body size, dispersal ability and range size in
North American species of Brachinus (Coleoptera: Carabidae).
The Coleopterists Bulletin, 37, 232–238. (M)Kalin-Arroyo, M.T., Riveros, M., Peñaloza, A., Cavieres, L. &
Faggi, A.M. (1996) Phytogeographic relationships and regional
richness patterns of the cool temperate rainforest flora of
southern South America. High-latitude rainforests and associated
ecosystems of the west coast of the Americas (ed. by R.G. Lawford,
P.B. Alaback & E. Fuentes), pp. 134–172. Springer, New York.
(M)
Koleff, P. & Gaston, K.J. (2001) Latitudinal gradients in diversity:
real patterns and random models. Ecography, 24, 341–351. (M)Letcher, A.J. & Harvey, P.H. (1994) Variation in geographical
range size among mammals of the Palearctic. The American
Naturalist, 144, 30–42. (M)Lomolino, M.V., Sax, D.F., Riddle, B.R. & Brown, J.H. (2006) The
island rule and a research agenda for studying ecogeographical
patterns. Journal of Biogeography, 33, 1503–1510.
Lyons, S.K. & Willig, M.R. (1997) Latitudinal patterns of range
size: methodological concerns and empirical evaluations for
New World bats and marsupials. Oikos, 79, 568–580. (M)Macpherson, E. (2003) Species range size distributions for some
marine taxa in the Atlantic Ocean. Effect of latitude and depth.
Biological Journal of the Linnean Society, 80, 437–455. (M)Macpherson, E. & Duarte, C.M. (1994) Patterns in species
richness, size and latitudinal range of East Atlantic fishes.
Ecography, 17, 242–248. (M)

Meta-analysis of the Rapoport effect
© 2007 The Authors Global Ecology and Biogeography, 16, 401–414, Journal compilation © 2007 Blackwell Publishing Ltd 413
Meliadou, A. & Troumbis, A.Y. (1997) Aspects of heterogeneity
in the distribution of diversity of the European herpetofauna.
Acta Oecologica, 18, 393–412. (M)Mourelle, C. & Ezcurra, E. (1997) Rapoport’s rule: a comparative
analysis between South and North American columnar cacti.
The American Naturalist, 150, 131–142. (M)Murray, B.R., Fonseca, C.R. & Westoby, M. (1998) The
macroecology of Australian frogs. Journal of Animal Ecology, 67,
567–579. (M)Nelson, G. (1969) The problem of historical biogeography.
Systematic Zoology, 18, 243–246.
Noonan, G.R. (1999) GIS analysis of the biogeography of beetles
of the subgenus Anisodactylus (Insecta: Coleoptera: Carabidae:
genus Anisodactylus). Journal of Biogeography, 26, 1147–1160.
(M)Olifiers, N., Vieira, M.V. & Grelle, C.E.V. (2004) Geographic
range and body size in Neotropical marsupials. Global Ecology
and Biogeography, 13, 439–444. (M)Orme, C.D.L., Davies, R.G., Olson, V.A., Thomas, G.H., Ding, T.-S.,
Rasmussen, P.C., Ridgely, R.S., Stattersfield, A.J., Bennet, P.M.,
Owen, I.P.F., Blackburn, T.M. & Gaston, K.J. (2006) Global
patterns of geographic range size in birds. PloS Biology, 4,
1276–1283.
Pagel, M.D., May, R.M. & Collie, A.R. (1991) Ecological aspects
of the geographical distribution and diversity of mammalian
species. The American Naturalist, 137, 791–815. (M)Pfenninger, M. (2004) Comparative analysis of range sizes in
Helicidae s.l. (Pulmonata, Gastropoda). Evolutionary Ecology
Research, 6, 1–18. (M)Price, T.D., Helbig, A.J. & Richman, A.D. (1997) Evolution of
breeding distributions in the old world leaf warblers (genus
Phylloscopus). Evolution, 5, 552–561. (M)Rahbek, C. (2005) The role of spatial scale and the perception of
large-scale species richness patterns. Ecology Letters, 8, 224–239.
Ramos de Sant’Ana, C.E., Diniz-Filho, J.A.F. & Rangel, T.F.L.V.B.
(2002) Null models and Rapoport’s effect in Neotropical
falconiformes. Ornitología Neotropical, 13, 247–254. (M)Reed, R.N. (2003) Interspecific patterns of species richness,
geographic range size, and body size among New World
venomous snakes. Ecography, 26, 107–117. (M)Ribas, C.R. & Schoereder, J.H. (2006) Is the Rapoport effect
widespread? Null models revisited. Global Ecology and Bio-
geography, 15, 614–624.
Ricklefs, R.E. & Latham, R.E. (1992) Intercontinental correlation
of geographic ranges suggests stasis in ecological traits of relict
genera of temperate perennial herbs. The American Naturalist,
139, 1305–1321.
Rohde, K. (1992) Latitudinal gradients in species diversity: the
search for the primary cause. Oikos, 65, 514–527.
Rohde, K. (1996) Rapoport’s rule is a local phenomenon and
cannot explain latitudinal gradients in species diversity.
Biodiversity Letters, 3, 10–13.
Rohde, K. (1999) Latitudinal gradients in species diversity and
Rapoport’s rule revisited: a review of recent work and what can
parasites teach us about the causes of the gradients? Ecography,
22, 593–613.
Rohde, K. & Heap, M. (1996) Latitudinal ranges of teleost fish in
the Atlantic and Indo-Pacific oceans. The American Naturalist,
147, 659–665. (M)Rohde, K. & Stauffer, D. (2005) Simulation of geographical
trends in Chowdhury ecosystem model. Advances in Complex
Systems, 8, 1–14.
Rohde, K., Heap, M. & Heap, D. (1993) Rapoport’s rule does not
apply to marine teleosts and cannot explain latitudinal gradi-
ents in species richness. The American Naturalist, 142, 1–16.
Rosenberg, M.S., Adams, D.C. & Gurevitch, J. (2000) MetaWin.
Statistical software for meta-analysis, version 2. Sinauer,
Sunderland, MA.
Roy, K., Jablonski, D. & Valentine, J. (1994) Eastern Pacific
molluscan provinces and latitudinal diversity gradient: no
evidence for ‘Rapoport’s rule’. Proceedings of the National
Academy of Sciences USA, 91, 8871–8874. (M)Roy, K., Jablonski, D., Valentine, J. & Rosenberg, G. (1998) Marine
latitudinal diversity gradients: tests of causal hypotheses.
Proceedings of the National Academy of Sciences USA, 95,
3699–3702.
Ruggiero, A. (1994) Latitudinal correlates of the sizes of
mammalian geographical ranges in South America. Journal of
Biogeography, 21, 545–559. (M)Ruggiero, A. (1999) Búsqueda de patrones en macroecología: la
regla de Rapoport. Ecología Austral, 9, 45–63. (M)Ruggiero, A. & Hawkins, B.A. (2006) Mapping macroecology.
Global Ecology and Biogeography, 15, 433–437.
Ruggiero, A. & Lawton, J.H. (1998) Are there latitudinal and
altitudinal Rapoport effects in the geographic ranges of
Andean passerine birds? Biological Journal of the Linnean Society,
63, 283–304. (M)Santelices, B. & Marquet, P.A. (1998) Seaweeds, latitudinal diversity
patterns, and Rapoport’s rule. Diversity and Distributions, 4,
71–75. (M)Sax, D.F. (2001) Latitudinal gradients and geographic ranges of
exotic species: implications for biogeography. Journal of Bio-
geography, 28, 139–150. (M)Simberloff, D. (2006) Rejoinder to Simberloff (2006): Don’t
calculate effect sizes: study ecological effects. Ecology Letters,
9, 921–922.
Smith, F.D.M., May, R.M. & Harvey, P.H. (1994) Geographical
ranges of Australian mammals. Journal of Animal Ecology, 63,
441–450. (M)Stauffer, D. & Rohde, K. (2006) Simulation of Rapoport’s rule
for latitudinal species spread. Theory of Biosciences, 125, 55–
65.
Stevens, G.C. (1989) The latitudinal gradient in geographical
range: how so many species coexist in the tropics. The American
Naturalist, 133, 240–256. (M)Stevens, G.R. & Enquist, B.J. (1998) Macroecological limits
to the abundance and distribution of Pinus. Ecology and
biogeography of Pinus (ed. by D.M. Richardson), pp. 183–190.
Cambridge University Press, Cambridge. (M)
Taylor, C.M. & Gotelli, N.J. (1994) The macroecology of Cyprinella:
correlates of phylogeny, body size, and geographical range. The
American Naturalist, 144, 549–569. (M)
A. Ruggiero and V. Werenkraut
© 2007 The Authors414 Global Ecology and Biogeography, 16, 401–414, Journal compilation © 2007 Blackwell Publishing Ltd
Valgas, A.B., Diniz-Filho, J.A.F. & Ramos de Santana, C.E. (2003).
Macroecologia de Icterinae (Aves: Passeriformes): Efeito
Rapoport e modelos nulos de distribucao geográfica. Ararajuba,
11, 57–64. (M)Wright, S., Keeling, J. & Gillman, L. (2006) The road from Santa
Rosalia: a faster tempo of evolution in tropical climates.
Proceedings of the National Academy of Sciences, USA, 103,
7718–7722.
Editor: Julie Lockwood
SUPPLEMENTARY MATERIAL
The following supplementary material is available for this article:
Appendix S1 List of papers and estimations of effect sizes and
variance estimated from the data set with the lower level of pseudo-
replication (reduced data set)
Table S1 Results from cumulative meta-analysis of studies that
test the Rapoport effect using different methods, based on the
restricted data set with the lower level of pseudoreplication
Table S2 Test of the effect of extent of the study on the test of the
Rapoport effect, based on the restricted data set with the lower
level of pseudoreplication
Table S3 Test of the effect of taxonomic, ecological and geo-
graphical focus of the study on the magnitude of the Rapoport
effect, based on the restricted data set with the lower level of
pseudoreplication
This material is available as part of the online article from:
http://www.blackwell-synergy.com/doi/abs/10.1111/j.1466-
8238.2006.00303.x
(This link will take you to the article abstract).
Please note: Blackwell Publishing is not responsible for the con-
tent or functionality of any supplementary materials supplied by
the authors. Any queries (other than missing material) should be
directed to the corresponding author for the article.
BIOSKETCHES
Adriana Ruggiero is a researcher interested in
biogeography and macroecology.
Victoria Werenkraut is a graduate student at the
Universidad Nacional de Buenos Aires (Argentina).
She is doing her doctoral research at Laboratorio Ecotono,
at the Universidad Nacional del Comahue. She is studying
altitudinal patterns in species richness, geographical range
and body size in insects in north-west Patagonia,
Argentina.