Met-regulated Expression Signature Defines a Subset of Human Hepatocellular Carcinomas With Poor...
14
Research article 1582 The Journal of Clinical Investigation http://www.jci.org Volume 116 Number 6 June 2006 Met-regulated expression signature defines a subset of human hepatocellular carcinomas with poor prognosis and aggressive phenotype Pal Kaposi-Novak, Ju-Seog Lee, Luis Gòmez-Quiroz, Cédric Coulouarn, Valentina M. Factor, and Snorri S. Thorgeirsson Laboratory of Experimental Carcinogenesis, Center for Cancer Research, National Cancer Institute, NIH, Bethesda, Maryland, USA. Identification of specific gene expression signatures characteristic of oncogenic pathways is an important step toward molecular classification of human malignancies. Aberrant activation of the Met signaling pathway is frequently associated with tumor progression and metastasis. In this study, we defined the Met-dependent gene expression signature using global gene expression profiling of WT and Met-deficient primary mouse hepatocytes. Newly identified transcriptional targets of the Met pathway included genes involved in the regula- tion of oxidative stress responses as well as cell motility, cytoskeletal organization, and angiogenesis. To assess the importance of a Met-regulated gene expression signature, a comparative functional genomic approach was applied to 242 human hepatocellular carcinomas (HCCs) and 7 metastatic liver lesions. Cluster analysis revealed that a subset of human HCCs and all liver metastases shared the Met-induced expression signature. Furthermore, the presence of the Met signature showed significant correlation with increased vascular inva- sion rate and microvessel density as well as with decreased mean survival time of HCC patients. We conclude that the genetically defined gene expression signatures in combination with comparative functional genom- ics constitute an attractive paradigm for defining both the function of oncogenic pathways and the clinically relevant subgroups of human cancers. Introduction The application of microarray-based gene expression profiling in cancer research has provided mechanistic insights into the oncogenic process and contributed to the molecular classifica- tion of malignancies (1). Transcription profiles from hundreds of microarray experiments have recently been integrated into large, multiplex data sets (2), and various reverse engineering methods have been used to decipher functionally significant gene networks (3). An important contribution from these stud- ies is the identification of well-defined, coregulated transcrip- tional modules that are beginning to provide a molecular expla- nation of disease pathogenesis and consequently may hold great therapeutic significance (4). An alternative approach to identifying relevant molecular events of malignant transformation and tumor progression is to char- acterize both known and suspected oncogenic pathways and to establish their specific gene expression signatures (5). Although the presence of these expression signatures is frequently obscured by the etiological complexity of the human tumors, they could be revealed using in vitro experimental systems and genetically modified animal models, in which the number of experimental variables could be rigorously controlled (6). Cross-comparison of the well-defined expression signatures with transcription profiles of human tumors may also improve the current understanding of the oncogenic process. The HGF/Met signaling pathway regulates multiple cellular functions, including cell proliferation, motility, differentiation, tubulogenesis, and angiogenesis (7, 8). The importance of intact HGF/Met signaling during embryogenesis is clearly demonstrated in mouse models, where homozygous deletion of either Hg f (9) or Met (10) is embryonic lethal. HGF/Met signaling also affects liver biology at several levels (11). In Hg f KO mice the hepatic plate is underdeveloped (9), while in adult livers Met activation alleviates chemically induced fibrosis (12) and protects hepatocytes from CD95-mediated apoptosis (13, 14). Increased HGF levels after par- tial hepatectomy promote liver regeneration by enhancing prolif- eration of mature hepatocytes and hepatic progenitor cells (15). In addition to its physiological functions, the protooncogene MET is a master regulator of metastasis formation, tumor inva- sion, and angiogenesis (8, 16). In various types of human carci- nomas, including papillary renal cancer and gastric and small cell lung cancer, activating mutation, amplification, and overexpres- sion of the MET gene have been associated with “metastatic phe- notype” and poor prognosis (17). Consequently, Met is regarded as a promising molecular target for antimetastasis therapies (18). In human hepatocellular carcinoma (HCC), overexpression and mutation of the MET gene are associated with intrahepatic metas- tases and vascular invasion, 2 of the most important clinical find- ings determining disease outcome (17, 19). In the present study we have adopted a global genomic approach to comprehensively define the effect of HGF/Met signaling on the Nonstandard abbreviations used: CCP, compound covariate predictor; HCC, hepatocellular carcinoma; LDA, linear discriminator analysis; LEC, Laboratory of Experimental Carcinogenesis, National Cancer Institute; LOOCV, leave-one-out cross- validation; MVD, microvessel density; NC, nearest centroid; NN, nearest neighbor; SVM, support vector machine. Conflict of interest: The authors have declared that no conflict of interest exists. Citation for this article: J. Clin. Invest. 116:1582–1595 (2006). doi:10.1172/JCI27236.
-
Upload
vaztion-onarres -
Category
Documents
-
view
218 -
download
2
Transcript of Met-regulated Expression Signature Defines a Subset of Human Hepatocellular Carcinomas With Poor...
Research article
1582 TheJournalofClinicalInvestigation http://www.jci.org Volume 116 Number 6 June 2006
Met-regulated expression signature defines a subset of human hepatocellular
carcinomas with poor prognosis and aggressive phenotype
Pal Kaposi-Novak, Ju-Seog Lee, Luis Gòmez-Quiroz, Cédric Coulouarn, Valentina M. Factor, and Snorri S. Thorgeirsson
Laboratory of Experimental Carcinogenesis, Center for Cancer Research, National Cancer Institute, NIH, Bethesda, Maryland, USA.
Identificationofspecificgeneexpressionsignaturescharacteristicofoncogenicpathwaysisanimportantsteptowardmolecularclassificationofhumanmalignancies.AberrantactivationoftheMetsignalingpathwayisfrequentlyassociatedwithtumorprogressionandmetastasis.Inthisstudy,wedefinedtheMet-dependentgeneexpressionsignatureusingglobalgeneexpressionprofilingofWTandMet-deficientprimarymousehepatocytes.NewlyidentifiedtranscriptionaltargetsoftheMetpathwayincludedgenesinvolvedintheregula-tionofoxidativestressresponsesaswellascellmotility,cytoskeletalorganization,andangiogenesis.Toassesstheimportanceofa Met-regulatedgeneexpressionsignature,acomparativefunctionalgenomicapproachwasappliedto242humanhepatocellularcarcinomas(HCCs)and7metastaticliverlesions.ClusteranalysisrevealedthatasubsetofhumanHCCsandalllivermetastasessharedtheMet-induced expressionsignature.Furthermore,thepresenceoftheMetsignatureshowedsignificantcorrelationwithincreasedvascularinva-sionrateandmicrovesseldensityaswellaswithdecreasedmeansurvivaltimeofHCCpatients.Weconcludethatthegeneticallydefinedgeneexpressionsignaturesincombinationwithcomparativefunctionalgenom-icsconstituteanattractiveparadigmfordefiningboththefunctionofoncogenicpathwaysandtheclinicallyrelevantsubgroupsofhumancancers.
IntroductionThe application of microarray-based gene expression profiling in cancer research has provided mechanistic insights into the oncogenic process and contributed to the molecular classifica-tion of malignancies (1). Transcription profiles from hundreds of microarray experiments have recently been integrated into large, multiplex data sets (2), and various reverse engineering methods have been used to decipher functionally significant gene networks (3). An important contribution from these stud-ies is the identification of well-defined, coregulated transcrip-tional modules that are beginning to provide a molecular expla-nation of disease pathogenesis and consequently may hold great therapeutic significance (4).
An alternative approach to identifying relevant molecular events of malignant transformation and tumor progression is to char-acterize both known and suspected oncogenic pathways and to establish their specific gene expression signatures (5). Although the presence of these expression signatures is frequently obscured by the etiological complexity of the human tumors, they could be revealed using in vitro experimental systems and genetically modified animal models, in which the number of experimental variables could be rigorously controlled (6). Cross-comparison of
the well-defined expression signatures with transcription profiles of human tumors may also improve the current understanding of the oncogenic process.
The HGF/Met signaling pathway regulates multiple cellular functions, including cell proliferation, motility, differentiation, tubulogenesis, and angiogenesis (7, 8). The importance of intact HGF/Met signaling during embryogenesis is clearly demonstrated in mouse models, where homozygous deletion of either Hgf (9) or Met (10) is embryonic lethal. HGF/Met signaling also affects liver biology at several levels (11). In Hg f KO mice the hepatic plate is underdeveloped (9), while in adult livers Met activation alleviates chemically induced fibrosis (12) and protects hepatocytes from CD95-mediated apoptosis (13, 14). Increased HGF levels after par-tial hepatectomy promote liver regeneration by enhancing prolif-eration of mature hepatocytes and hepatic progenitor cells (15).
In addition to its physiological functions, the protooncogene MET is a master regulator of metastasis formation, tumor inva-sion, and angiogenesis (8, 16). In various types of human carci-nomas, including papillary renal cancer and gastric and small cell lung cancer, activating mutation, amplification, and overexpres-sion of the MET gene have been associated with “metastatic phe-notype” and poor prognosis (17). Consequently, Met is regarded as a promising molecular target for antimetastasis therapies (18). In human hepatocellular carcinoma (HCC), overexpression and mutation of the MET gene are associated with intrahepatic metas-tases and vascular invasion, 2 of the most important clinical find-ings determining disease outcome (17, 19).
In the present study wehave adopted a global genomic approach to comprehensively define the effect of HGF/Met signaling on the
Nonstandardabbreviationsused: CCP, compound covariate predictor; HCC, hepatocellular carcinoma; LDA, linear discriminator analysis; LEC, Laboratory of Experimental Carcinogenesis, National Cancer Institute; LOOCV, leave-one-out cross-validation; MVD, microvessel density; NC, nearest centroid; NN, nearest neighbor; SVM, support vector machine.
Conflictofinterest: The authors have declared that no conflict of interest exists.
Citationforthisarticle: J. Clin. Invest. 116:1582–1595 (2006). doi:10.1172/JCI27236.
research article
TheJournalofClinicalInvestigation http://www.jci.org Volume 116 Number 6 June 2006 1583
hepatocyte transcriptome.First, we assessed the HGF-induced gene expression patterns in primary hepatocytes isolated from Met KO (20) and WT mice and identified several potential Met target genes as well as novel regulatory functions of Met. We next applied comparative functional genomic analysis to evaluate the importance of the Met-regulated gene expression signature in the pathogenesis of human HCC. A study of 2 independent human data sets revealed that the Met-regulated gene expression signa-ture characterizes a subgroup of HCC with aggressive phenotypic traits and poor prognosis.
ResultsCharacterization of the Met-regulated gene expression signature in primary hepatocytes. To identify HGF/Met–regulated genes, we performed expression microarray analysis after inducible activation of Met receptor in primary cultures of hepatocytes established from WT and Met conditional KO mice. Total RNA was isolated from untreated hepatocyte cultures as well as from cultures treated with 50 ng/ml of HGF for 0.5, 2, 12, or 24 hours. RNA collected from these experiments was converted to fluorescently labeled cDNA and used for hybridizations of oligonucleotide microarrays con-
taining 21,997 features representing 19,140 unique mouse genes. After normalization of the data, 13,477 features with a sufficient number of valid expression values were selected for further analy-sis as described in Methods.
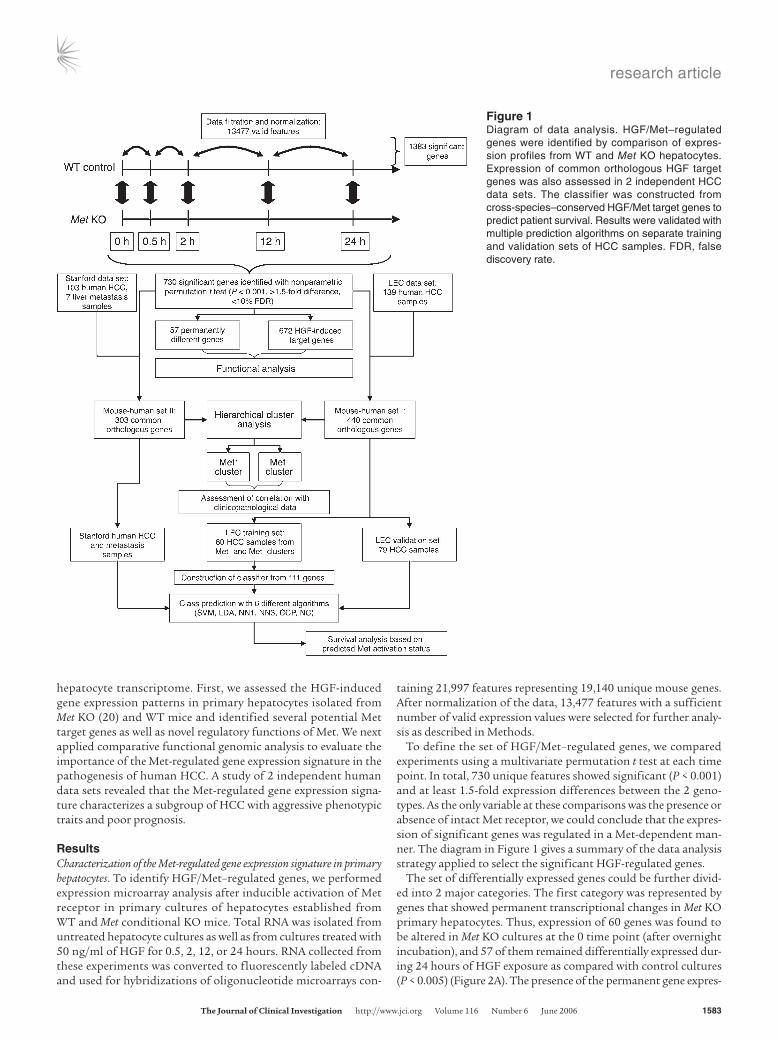
To define the set of HGF/Met–regulated genes, we compared experiments using a multivariate permutation t test at each time point. In total, 730 unique features showed significant (P < 0.001) and at least 1.5-fold expression differences between the 2 geno-types. As the only variable at these comparisons was the presence or absence of intact Met receptor, we could conclude that the expres-sion of significant genes was regulated in a Met-dependent man-ner. The diagram in Figure 1 gives a summary of the data analysis strategy applied to select the significant HGF-regulated genes.
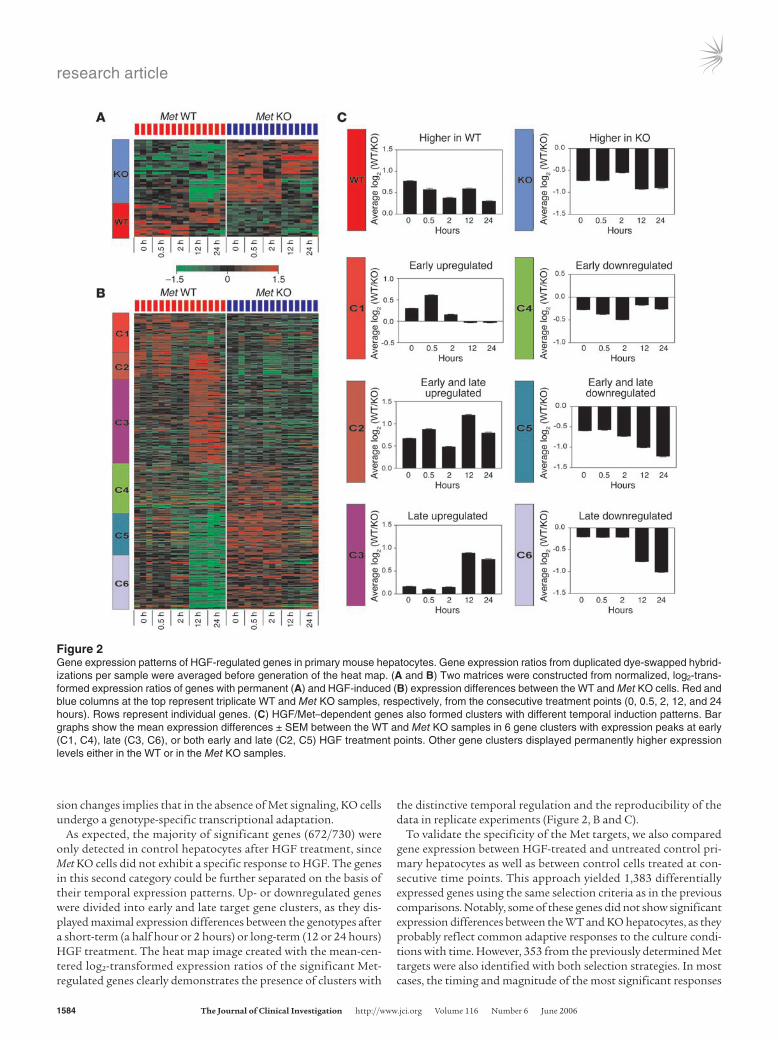
The set of differentially expressed genes could be further divid-ed into 2 major categories. The first category was represented by genes that showed permanent transcriptional changes in Met KO primary hepatocytes. Thus, expression of 60 genes was found to be altered in Met KO cultures at the 0 time point (after overnight incubation), and 57 of them remained differentially expressed dur-ing 24 hours of HGF exposure as compared with control cultures (P < 0.005) (Figure 2A). The presence of the permanent gene expres-
Figure 1Diagram of data analysis. HGF/Met–regulated genes were identified by comparison of expres-sion profiles from WT and Met KO hepatocytes. Expression of common orthologous HGF target genes was also assessed in 2 independent HCC data sets. The classifier was constructed from cross-species–conserved HGF/Met target genes to predict patient survival. Results were validated with multiple prediction algorithms on separate training and validation sets of HCC samples. FDR, false discovery rate.
research article
1584 TheJournalofClinicalInvestigation http://www.jci.org Volume 116 Number 6 June 2006
sion changes implies that in the absence of Met signaling, KO cells undergo a genotype-specific transcriptional adaptation.
As expected, the majority of significant genes (672/730) were only detected in control hepatocytes after HGF treatment, since Met KO cells did not exhibit a specific response to HGF. The genes in this second category could be further separated on the basis of their temporal expression patterns. Up- or downregulated genes were divided into early and late target gene clusters, as they dis-played maximal expression differences between the genotypes after a short-term (a half hour or 2 hours) or long-term (12 or 24 hours) HGF treatment. The heat map image created with the mean-cen-teredlog2-transformed expression ratios of the significant Met-regulated genes clearly demonstrates the presence of clusters with
the distinctive temporal regulation and the reproducibility of the data in replicate experiments (Figure 2, B and C).
To validate the specificity of the Met targets, we also compared gene expression between HGF-treated and untreated control pri-mary hepatocytes as well as between control cells treated at con-secutive time points. This approach yielded 1,383 differentially expressed genes using the same selection criteria as in the previous comparisons. Notably, some of these genes did not show significant expression differences between the WT and KO hepatocytes, as they probably reflect common adaptive responses to the culture condi-tions with time. However, 353 from the previously determined Met targets were also identified with both selection strategies. In most cases, the timing and magnitude of the most significant responses
Figure 2Gene expression patterns of HGF-regulated genes in primary mouse hepatocytes. Gene expression ratios from duplicated dye-swapped hybrid-izations per sample were averaged before generation of the heat map. (A and B) Two matrices were constructed from normalized, log2-trans-formed expression ratios of genes with permanent (A) and HGF-induced (B) expression differences between the WT and Met KO cells. Red and blue columns at the top represent triplicate WT and Met KO samples, respectively, from the consecutive treatment points (0, 0.5, 2, 12, and 24 hours). Rows represent individual genes. (C) HGF/Met–dependent genes also formed clusters with different temporal induction patterns. Bar graphs show the mean expression differences ± SEM between the WT and Met KO samples in 6 gene clusters with expression peaks at early (C1, C4), late (C3, C6), or both early and late (C2, C5) HGF treatment points. Other gene clusters displayed permanently higher expression levels either in the WT or in the Met KO samples.
research article
TheJournalofClinicalInvestigation http://www.jci.org Volume 116 Number 6 June 2006 1585
overlapped in the horizontal and vertical comparisons, indicating that the majority of the differentially expressed genes represented a specific response to HGF induction.
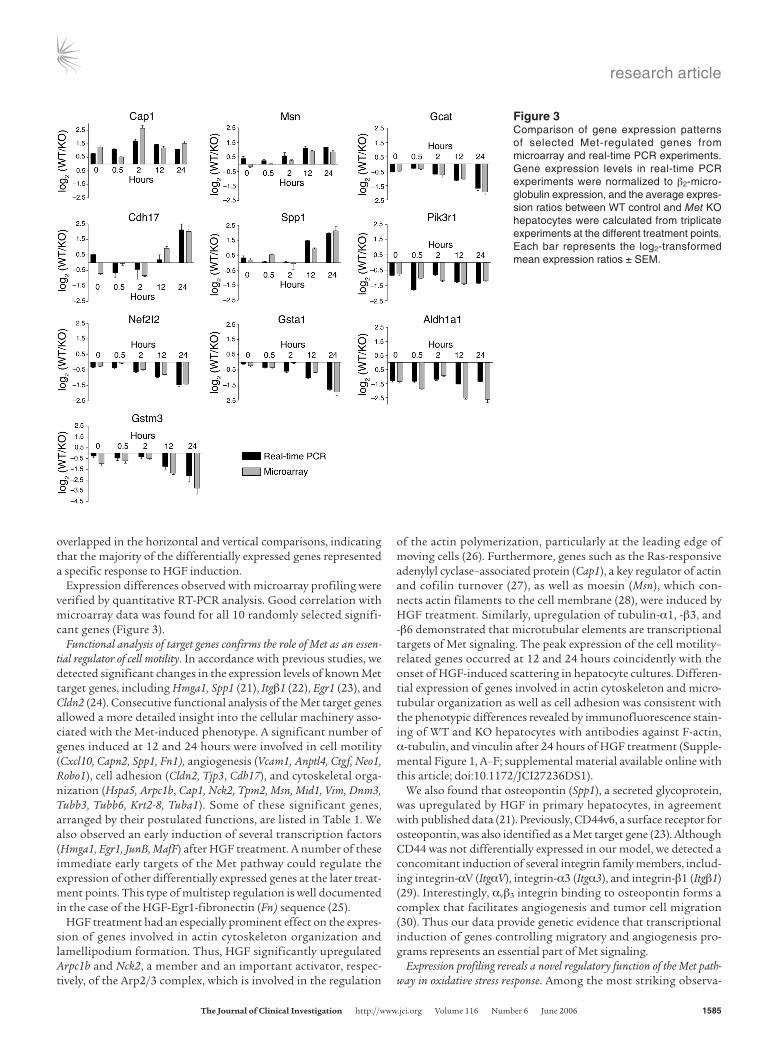
Expression differences observed with microarray profiling were verified by quantitative RT-PCR analysis. Good correlation with microarray data was found for all 10 randomly selected signifi-cant genes (Figure 3).
Functional analysis oftarget genes confirms the role of Met as an essen-tial regulator of cell motility. In accordance with previous studies, we detected significant changes in the expression levels of known Met target genes, including Hmga1, Spp1 (21), Itgβ1 (22), Egr1 (23), and Cldn2 (24). Consecutive functional analysis of the Met target genes allowed a more detailed insight into the cellular machinery asso-ciated with the Met-induced phenotype. A significant number of genes induced at 12 and 24 hours were involved in cell motility (Cxcl10, Capn2, Spp1, Fn1), angiogenesis (Vcam1, Anptl4, Ctgf, Neo1, Robo1), cell adhesion (Cldn2, Tjp3, Cdh17), and cytoskeletal orga-nization (Hspa5, Arpc1b, Cap1, Nck2, Tpm2, Msn, Mid1, Vim, Dnm3, Tubb3, Tubb6, Krt2-8, Tuba1). Some of these significant genes, arranged by their postulated functions, are listed in Table 1. We also observed an early induction of several transcription factors (Hmga1, Egr1, JunB, MafF) after HGF treatment. A number of these immediate early targets of the Met pathway could regulate the expression of other differentially expressed genes at the later treat-ment points. This type of multistep regulation is well documented in the case of the HGF-Egr1-fibronectin (Fn) sequence (25).
HGF treatment had an especially prominent effect on the expres-sion of genes involved in actin cytoskeleton organization and lamellipodium formation. Thus, HGF significantly upregulated Arpc1b and Nck2, a member and an important activator, respec-tively, of the Arp2/3 complex, which is involved in the regulation
of the actin polymerization, particularly at the leading edge of moving cells (26). Furthermore, genes such as the Ras-responsive adenylyl cyclase–associated protein (Cap1), a key regulator of actin and cofilin turnover (27), as well as moesin (Msn), which con-nects actin filaments to the cell membrane (28), were induced by HGF treatment. Similarly, upregulation of tubulin-α1, -β3, and -β6 demonstrated that microtubular elements are transcriptional targets of Met signaling. The peak expression of the cell motility–related genes occurred at 12 and 24 hours coincidently with the onset of HGF-induced scattering in hepatocyte cultures. Differen-tial expression of genes involved in actin cytoskeleton and micro-tubular organization as well as cell adhesion was consistent with the phenotypic differences revealed by immunofluorescence stain-ing of WT and KO hepatocytes with antibodies against F-actin, α-tubulin, and vinculin after 24 hours of HGF treatment (Supple-mental Figure 1, A–F; supplemental material available online with this article; doi:10.1172/JCI27236DS1).
We also found that osteopontin (Spp1), a secreted glycoprotein, was upregulated by HGF in primary hepatocytes, in agreement with published data (21). Previously, CD44v6, a surface receptor for osteopontin, was also identified as a Met target gene (23). Although CD44 was not differentially expressed in our model, we detected a concomitant induction of several integrin family members, includ-ing integrin-αV (ItgαV), integrin-α3 (Itgα3), and integrin-β1 (Itgβ1) (29). Interestingly, αvβ3 integrin binding to osteopontin forms a complex that facilitates angiogenesis and tumor cell migration (30). Thus our data provide genetic evidence that transcriptional induction of genes controlling migratory and angiogenesis pro-grams represents an essential part of Met signaling.
Expression profiling reveals a novel regulatory function of the Met path-way in oxidative stress response. Among the most striking observa-
Figure 3Comparison of gene expression patterns of selected Met-regulated genes from microarray and real-time PCR experiments. Gene expression levels in real-time PCR experiments were normalized to β2-micro-globulin expression, and the average expres-sion ratios between WT control and Met KO hepatocytes were calculated from triplicate experiments at the different treatment points. Each bar represents the log2-transformed mean expression ratios ± SEM.
research article
1586 TheJournalofClinicalInvestigation http://www.jci.org Volume 116 Number 6 June 2006
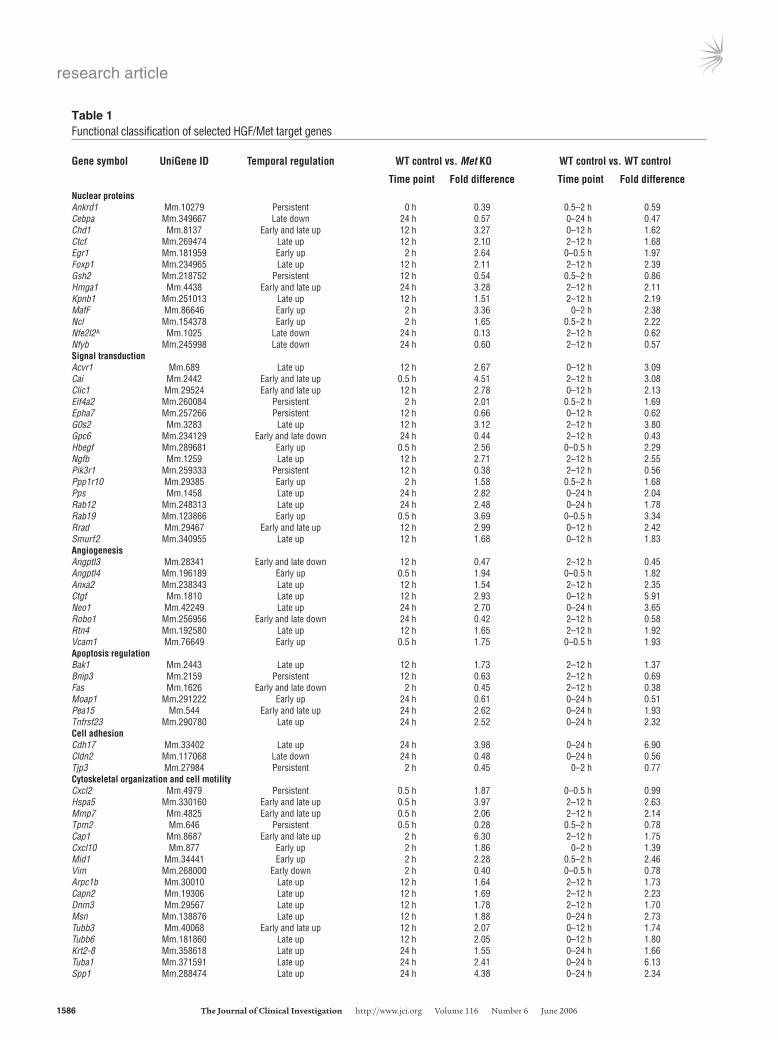
Table 1Functional classification of selected HGF/Met target genes
Gene symbol UniGene ID Temporal regulation WT control vs. Met KO WT control vs. WT control
Time point Fold difference Time point Fold differenceNuclear proteins Ankrd1 Mm.10279 Persistent 0 h 0.39 0.5–2 h 0.59Cebpa Mm.349667 Late down 24 h 0.57 0–24 h 0.47Chd1 Mm.8137 Early and late up 12 h 3.27 0–12 h 1.62Ctcf Mm.269474 Late up 12 h 2.10 2–12 h 1.68Egr1 Mm.181959 Early up 2 h 2.64 0–0.5 h 1.97Foxp1 Mm.234965 Late up 12 h 2.11 2–12 h 2.39Gsh2 Mm.218752 Persistent 12 h 0.54 0.5–2 h 0.86Hmga1 Mm.4438 Early and late up 24 h 3.28 2–12 h 2.11Kpnb1 Mm.251013 Late up 12 h 1.51 2–12 h 2.19MafF Mm.86646 Early up 2 h 3.36 0–2 h 2.38Ncl Mm.154378 Early up 2 h 1.65 0.5–2 h 2.22Nfe2l2A Mm.1025 Late down 24 h 0.13 2–12 h 0.62Nfyb Mm.245998 Late down 24 h 0.60 2–12 h 0.57Signal transduction Acvr1 Mm.689 Late up 12 h 2.67 0–12 h 3.09Cai Mm.2442 Early and late up 0.5 h 4.51 2–12 h 3.08Clic1 Mm.29524 Early and late up 12 h 2.78 0–12 h 2.13Eif4a2 Mm.260084 Persistent 2 h 2.01 0.5–2 h 1.69Epha7 Mm.257266 Persistent 12 h 0.66 0–12 h 0.62G0s2 Mm.3283 Late up 12 h 3.12 2–12 h 3.80Gpc6 Mm.234129 Early and late down 24 h 0.44 2–12 h 0.43Hbegf Mm.289681 Early up 0.5 h 2.56 0–0.5 h 2.29Ngfb Mm.1259 Late up 12 h 2.71 2–12 h 2.55Pik3r1 Mm.259333 Persistent 12 h 0.38 2–12 h 0.56Ppp1r10 Mm.29385 Early up 2 h 1.58 0.5–2 h 1.68Pps Mm.1458 Late up 24 h 2.82 0–24 h 2.04Rab12 Mm.248313 Late up 24 h 2.48 0–24 h 1.78Rab19 Mm.123866 Early up 0.5 h 3.69 0–0.5 h 3.34Rrad Mm.29467 Early and late up 12 h 2.99 0–12 h 2.42Smurf2 Mm.340955 Late up 12 h 1.68 0–12 h 1.83Angiogenesis Angptl3 Mm.28341 Early and late down 12 h 0.47 2–12 h 0.45Angptl4 Mm.196189 Early up 0.5 h 1.94 0–0.5 h 1.82Anxa2 Mm.238343 Late up 12 h 1.54 2–12 h 2.35Ctgf Mm.1810 Late up 12 h 2.93 0–12 h 5.91Neo1 Mm.42249 Late up 24 h 2.70 0–24 h 3.65Robo1 Mm.256956 Early and late down 24 h 0.42 2–12 h 0.58Rtn4 Mm.192580 Late up 12 h 1.65 2–12 h 1.92Vcam1 Mm.76649 Early up 0.5 h 1.75 0–0.5 h 1.93Apoptosis regulation Bak1 Mm.2443 Late up 12 h 1.73 2–12 h 1.37Bnip3 Mm.2159 Persistent 12 h 0.63 2–12 h 0.69Fas Mm.1626 Early and late down 2 h 0.45 2–12 h 0.38Moap1 Mm.291222 Early up 24 h 0.61 0–24 h 0.51Pea15 Mm.544 Early and late up 24 h 2.62 0–24 h 1.93Tnfrsf23 Mm.290780 Late up 24 h 2.52 0–24 h 2.32Cell adhesion Cdh17 Mm.33402 Late up 24 h 3.98 0–24 h 6.90Cldn2 Mm.117068 Late down 24 h 0.48 0–24 h 0.56Tjp3 Mm.27984 Persistent 2 h 0.45 0–2 h 0.77Cytoskeletal organization and cell motility Cxcl2 Mm.4979 Persistent 0.5 h 1.87 0–0.5 h 0.99Hspa5 Mm.330160 Early and late up 0.5 h 3.97 2–12 h 2.63Mmp7 Mm.4825 Early and late up 0.5 h 2.06 2–12 h 2.14Tpm2 Mm.646 Persistent 0.5 h 0.28 0.5–2 h 0.78Cap1 Mm.8687 Early and late up 2 h 6.30 2–12 h 1.75Cxcl10 Mm.877 Early up 2 h 1.86 0–2 h 1.39Mid1 Mm.34441 Early up 2 h 2.28 0.5–2 h 2.46Vim Mm.268000 Early down 2 h 0.40 0–0.5 h 0.78Arpc1b Mm.30010 Late up 12 h 1.64 2–12 h 1.73Capn2 Mm.19306 Late up 12 h 1.69 2–12 h 2.23Dnm3 Mm.29567 Late up 12 h 1.78 2–12 h 1.70Msn Mm.138876 Late up 12 h 1.88 0–24 h 2.73Tubb3 Mm.40068 Early and late up 12 h 2.07 0–12 h 1.74Tubb6 Mm.181860 Late up 12 h 2.05 0–12 h 1.80Krt2-8 Mm.358618 Late up 24 h 1.55 0–24 h 1.66Tuba1 Mm.371591 Late up 24 h 2.41 0–24 h 6.13Spp1 Mm.288474 Late up 24 h 4.38 0–24 h 2.34
research article
TheJournalofClinicalInvestigation http://www.jci.org Volume 116 Number 6 June 2006 1587
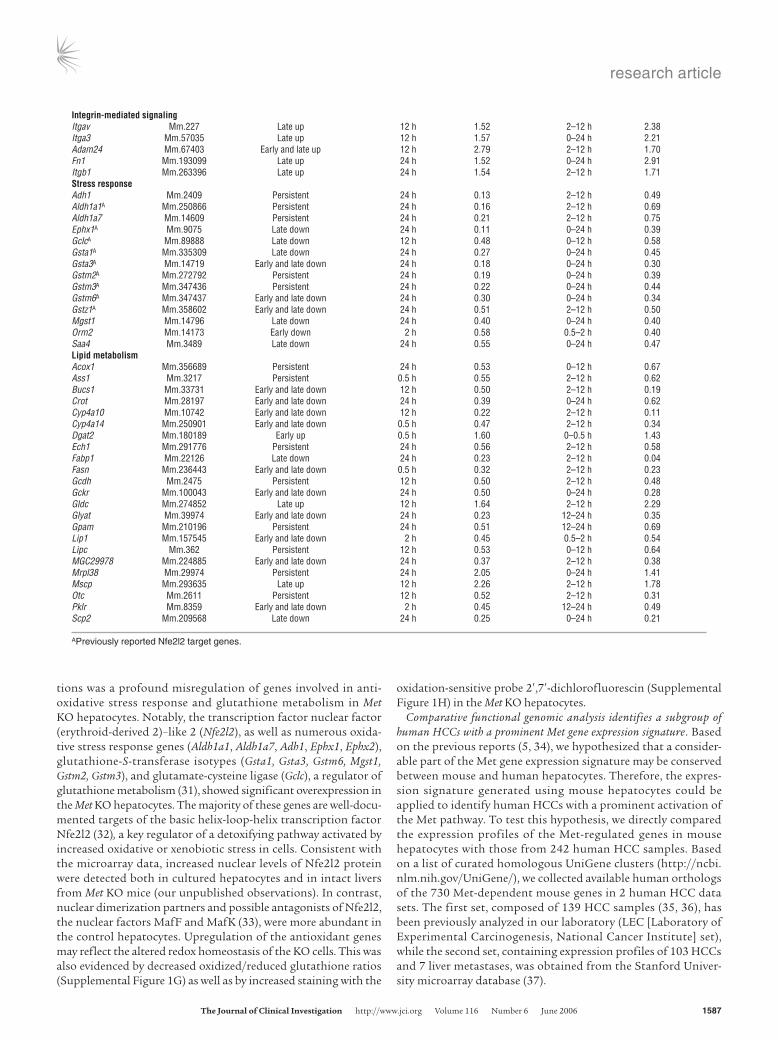
tions was a profound misregulation of genes involved in anti-oxidative stress response and glutathione metabolism in Met KO hepatocytes. Notably, the transcription factor nuclear factor (erythroid-derived 2)–like 2 (Nfe2l2), as well as numerous oxida-tive stress response genes (Aldh1a1, Aldh1a7, Adh1, Ephx1, Ephx2), glutathione-S-transferase isotypes (Gsta1, Gsta3, Gstm6, Mgst1, Gstm2, Gstm3), and glutamate-cysteine ligase (Gclc), a regulator of glutathione metabolism (31), showed significant overexpression in the Met KO hepatocytes. The majority of these genes are well-docu-mented targets of the basic helix-loop-helix transcription factor Nfe2l2 (32), a key regulator of a detoxifying pathway activated by increased oxidative or xenobiotic stress in cells. Consistent with the microarray data, increased nuclear levels of Nfe2l2 protein were detected both in cultured hepatocytes and in intact livers from Met KO mice (our unpublished observations). In contrast, nuclear dimerization partners and possible antagonists of Nfe2l2, the nuclear factors MafF and MafK (33), were more abundant in the control hepatocytes. Upregulation of the antioxidant genes may reflect the altered redox homeostasis of the KO cells. This was also evidenced by decreased oxidized/reduced glutathione ratios (Supplemental Figure 1G) as well as by increased staining with the
oxidation-sensitive probe 2′,7′-dichlorofluorescin (Supplemental Figure 1H) in the Met KO hepatocytes.
Comparative functional genomic analysis identifies a subgroup of human HCCs with a prominent Met gene expression signature. Based on the previous reports (5, 34), we hypothesized that a consider-able part of the Met gene expression signature may be conserved between mouse and human hepatocytes. Therefore, the expres-sion signature generated using mouse hepatocytes could be applied to identify human HCCs with a prominent activation of the Met pathway. To test this hypothesis, we directly compared the expression profiles of the Met-regulated genes in mouse hepatocytes with those from 242 human HCC samples. Based on a list of curated homologous UniGene clusters (http://ncbi.nlm.nih.gov/UniGene/), we collected available human orthologs of the 730 Met-dependent mouse genes in 2 human HCC data sets. The first set, composed of 139 HCC samples (35, 36), has been previously analyzed in our laboratory (LEC [Laboratory of Experimental Carcinogenesis, National Cancer Institute] set), while the second set, containing expression profiles of 103 HCCs and 7 liver metastases, was obtained from the Stanford Univer-sity microarray database (37).
Integrin-mediated signaling Itgav Mm.227 Late up 12 h 1.52 2–12 h 2.38Itga3 Mm.57035 Late up 12 h 1.57 0–24 h 2.21Adam24 Mm.67403 Early and late up 12 h 2.79 2–12 h 1.70Fn1 Mm.193099 Late up 24 h 1.52 0–24 h 2.91Itgb1 Mm.263396 Late up 24 h 1.54 2–12 h 1.71Stress response Adh1 Mm.2409 Persistent 24 h 0.13 2–12 h 0.49Aldh1a1A Mm.250866 Persistent 24 h 0.16 2–12 h 0.69Aldh1a7 Mm.14609 Persistent 24 h 0.21 2–12 h 0.75Ephx1A Mm.9075 Late down 24 h 0.11 0–24 h 0.39GclcA Mm.89888 Late down 12 h 0.48 0–12 h 0.58Gsta1A Mm.335309 Late down 24 h 0.27 0–24 h 0.45Gsta3A Mm.14719 Early and late down 24 h 0.18 0–24 h 0.30Gstm2A Mm.272792 Persistent 24 h 0.19 0–24 h 0.39Gstm3A Mm.347436 Persistent 24 h 0.22 0–24 h 0.44Gstm6A Mm.347437 Early and late down 24 h 0.30 0–24 h 0.34Gstz1A Mm.358602 Early and late down 24 h 0.51 2–12 h 0.50Mgst1 Mm.14796 Late down 24 h 0.40 0–24 h 0.40Orm2 Mm.14173 Early down 2 h 0.58 0.5–2 h 0.40Saa4 Mm.3489 Late down 24 h 0.55 0–24 h 0.47Lipid metabolism Acox1 Mm.356689 Persistent 24 h 0.53 0–12 h 0.67Ass1 Mm.3217 Persistent 0.5 h 0.55 2–12 h 0.62Bucs1 Mm.33731 Early and late down 12 h 0.50 2–12 h 0.19Crot Mm.28197 Early and late down 24 h 0.39 0–24 h 0.62Cyp4a10 Mm.10742 Early and late down 12 h 0.22 2–12 h 0.11Cyp4a14 Mm.250901 Early and late down 0.5 h 0.47 2–12 h 0.34Dgat2 Mm.180189 Early up 0.5 h 1.60 0–0.5 h 1.43Ech1 Mm.291776 Persistent 24 h 0.56 2–12 h 0.58Fabp1 Mm.22126 Late down 24 h 0.23 2–12 h 0.04Fasn Mm.236443 Early and late down 0.5 h 0.32 2–12 h 0.23Gcdh Mm.2475 Persistent 12 h 0.50 2–12 h 0.48Gckr Mm.100043 Early and late down 24 h 0.50 0–24 h 0.28Gldc Mm.274852 Late up 12 h 1.64 2–12 h 2.29Glyat Mm.39974 Early and late down 24 h 0.23 12–24 h 0.35Gpam Mm.210196 Persistent 24 h 0.51 12–24 h 0.69Lip1 Mm.157545 Early and late down 2 h 0.45 0.5–2 h 0.54Lipc Mm.362 Persistent 12 h 0.53 0–12 h 0.64MGC29978 Mm.224885 Early and late down 24 h 0.37 2–12 h 0.38Mrpl38 Mm.29974 Persistent 24 h 2.05 0–24 h 1.41Mscp Mm.293635 Late up 12 h 2.26 2–12 h 1.78Otc Mm.2611 Persistent 12 h 0.52 2–12 h 0.31Pklr Mm.8359 Early and late down 2 h 0.45 12–24 h 0.49Scp2 Mm.209568 Late down 24 h 0.25 0–24 h 0.21
APreviously reported Nfe2l2 target genes.
research article
1588 TheJournalofClinicalInvestigation http://www.jci.org Volume 116 Number 6 June 2006
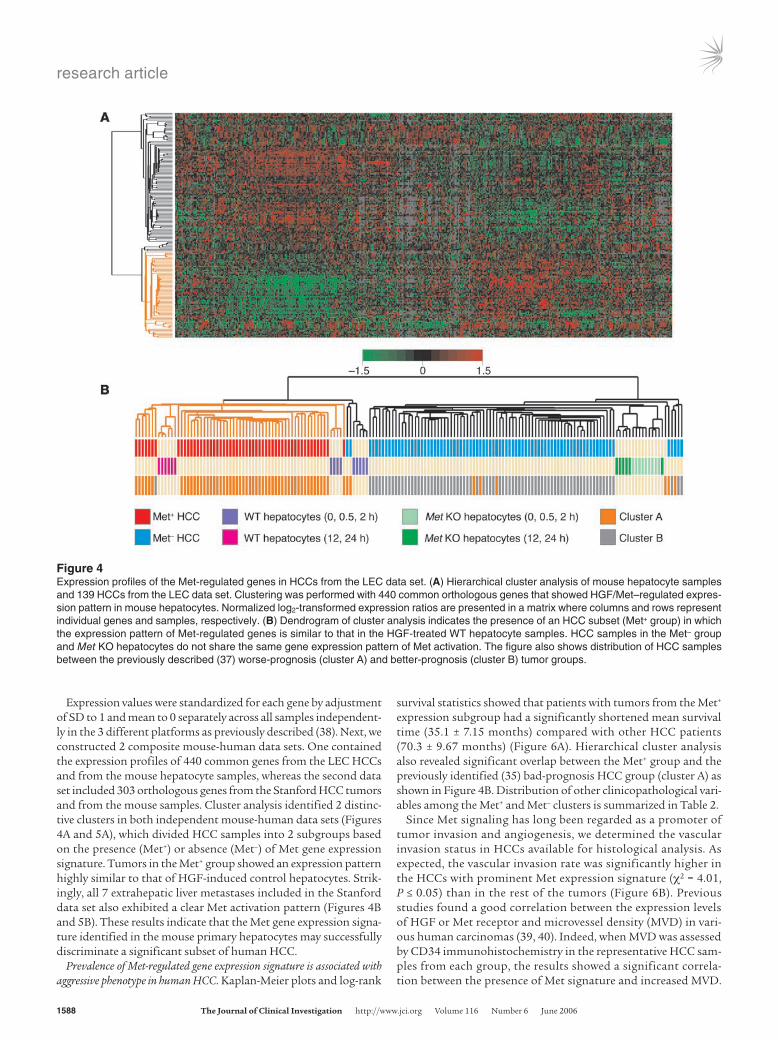
Expression values were standardized for each gene by adjustment of SD to 1 and mean to 0 separately across all samples independent-ly in the 3 different platforms as previously described (38). Next, we constructed 2 composite mouse-human data sets. One contained the expression profiles of 440 common genes from the LEC HCCs and from the mouse hepatocyte samples, whereas the second data set included 303 orthologous genes from the Stanford HCC tumors and from the mouse samples. Cluster analysis identified 2 distinc-tive clusters in both independent mouse-human data sets (Figures 4A and 5A), which divided HCC samples into 2 subgroups based on the presence (Met+) or absence (Met–) of Met gene expression signature. Tumors in the Met+ group showed an expression pattern highly similar to that of HGF-induced control hepatocytes. Strik-ingly, all 7 extrahepatic liver metastases included in the Stanford data set also exhibited a clear Met activation pattern (Figures 4B and 5B). These results indicate that the Met gene expression signa-ture identified in the mouse primary hepatocytes may successfully discriminate a significant subset of human HCC.
Prevalence of Met-regulated gene expression signature is associated with aggressive phenotype in human HCC. Kaplan-Meier plots and log-rank
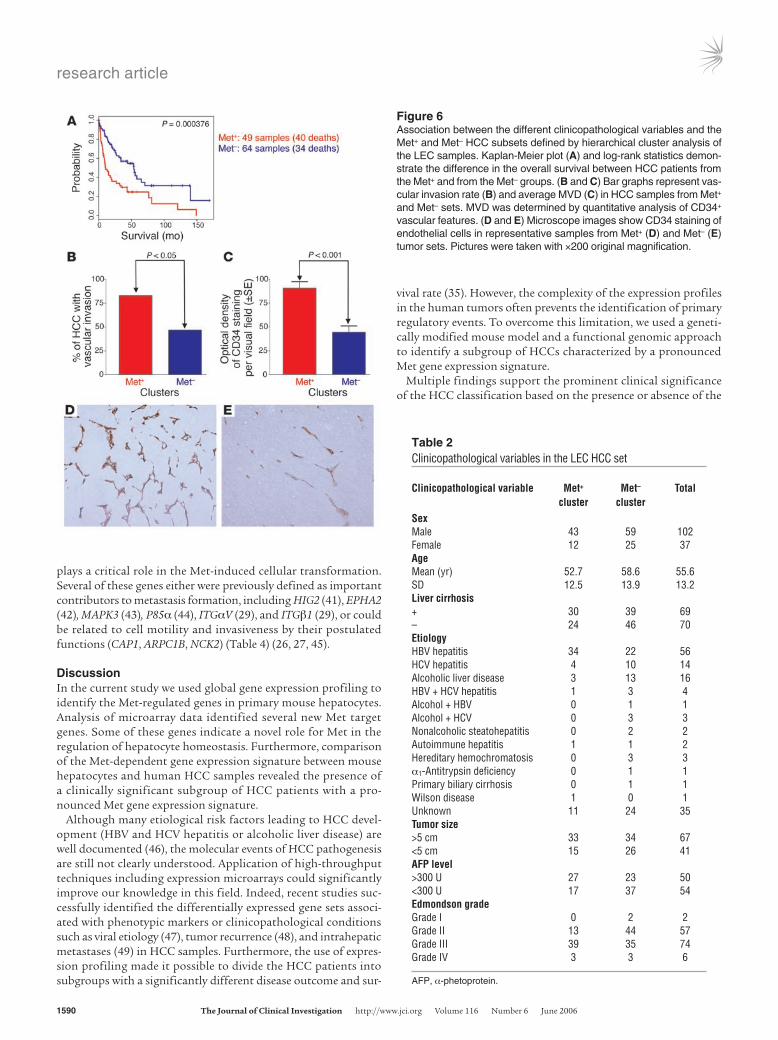
survival statistics showed that patients with tumors from the Met+ expression subgroup had a significantly shortened mean survival time (35.1 ± 7.15 months) compared with other HCC patients (70.3 ± 9.67 months) (Figure 6A). Hierarchical cluster analysis also revealed significant overlap between the Met+ group and the previously identified (35) bad-prognosis HCC group (cluster A) as shown in Figure 4B. Distribution of other clinicopathological vari-ables among the Met+ and Met– clusters is summarized in Table 2.
Since Met signaling has long been regarded as a promoter of tumor invasion and angiogenesis, we determined the vascular invasion status in HCCs available for histological analysis. As expected, the vascular invasion rate was significantly higher in the HCCs with prominent Met expression signature (χ2 = 4.01, P ≤ 0.05) than in the rest of the tumors (Figure 6B). Previous studies found a good correlation between the expression levels of HGF or Met receptor and microvessel density (MVD) in vari-ous human carcinomas (39, 40). Indeed, when MVD was assessed by CD34 immunohistochemistry in the representative HCC sam-ples from each group, the results showed a significant correla-tion between the presence of Met signature and increased MVD.
Figure 4Expression profiles of the Met-regulated genes in HCCs from the LEC data set. (A) Hierarchical cluster analysis of mouse hepatocyte samples and 139 HCCs from the LEC data set. Clustering was performed with 440 common orthologous genes that showed HGF/Met–regulated expres-sion pattern in mouse hepatocytes. Normalized log2-transformed expression ratios are presented in a matrix where columns and rows represent individual genes and samples, respectively. (B) Dendrogram of cluster analysis indicates the presence of an HCC subset (Met+ group) in which the expression pattern of Met-regulated genes is similar to that in the HGF-treated WT hepatocyte samples. HCC samples in the Met– group and Met KO hepatocytes do not share the same gene expression pattern of Met activation. The figure also shows distribution of HCC samples between the previously described (37) worse-prognosis (cluster A) and better-prognosis (cluster B) tumor groups.

research article
TheJournalofClinicalInvestigation http://www.jci.org Volume 116 Number 6 June 2006 1589
Accordingly, the average OD of CD34+ vascular features was sig-nificantly higher (P < 0.001) in the Met+ (90.78 ± 6.71) than in the Met– (44.55 ± 6.16) HCC subgroup (Figure 6, C–E).
Notably, in the LEC data set, average expression level of the Met was not significantly different between the Met– and Met+ clusters as detected by either microarray analysis or immunohistochemistry (data not shown). However, at least 2-fold upregulation of the Met receptor was found more frequently in the Met+ tumors (5/54) compared with the Met– group (2/85) in the LEC set. These data overlap well with the expression profile–based classification and suggest that, in some HCCs, overexpression of the Met receptor is the driving force behind the Met-dependent expression signature.
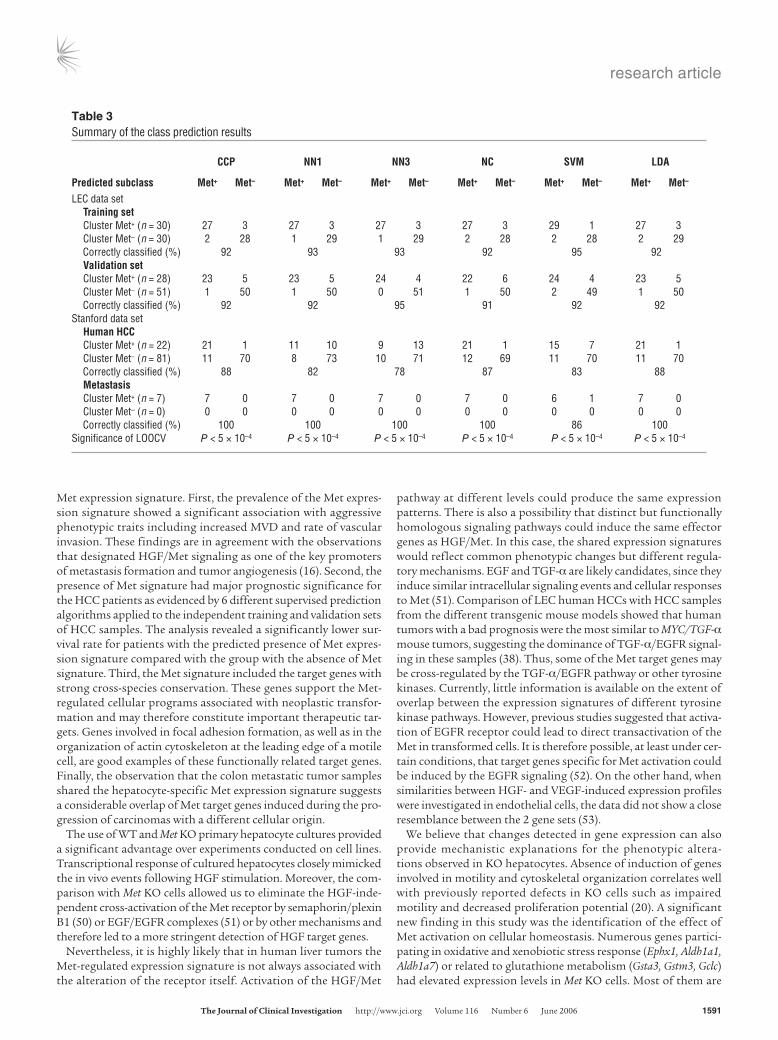
The Met expression signature predicts survival of HCC patients. To test the predictive value of the Met expression signature regarding prognosis of HCC patients, the expression patterns of the human homologs of the mouse Met-regulated genes were used to con-struct a classifier with 6 different supervised prediction algorithms, including the compound covariate predictor (CCP), nearest neigh-bors 1 and 3 (NN1 and NN3), nearest centroid (NC), support vector machine (SVM), and linear discriminator analysis (LDA) methods. Since survival data were only available for the patients from the LEC group, we randomly divided these samples into a training set
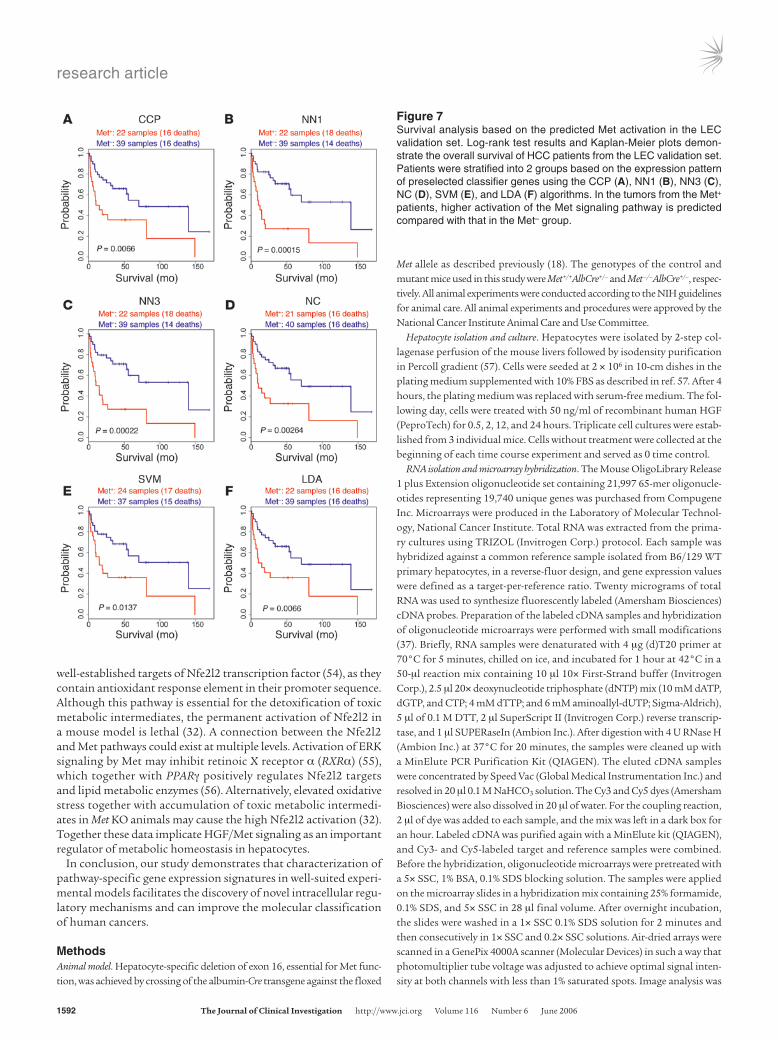
(60 samples) and a validation set (79 samples). Next, we selected the common target genes with the matching expression pattern between tumors displaying the high and low Met gene expression signature in the primary hepatocytes and in the training set. Using these genes and all 6 algorithms, classifiers were built according to a leave-one-out cross-validation (LOOCV) strategy. The optimal classifier producing the highest correct classification rate in the training set contained 111 genes. When the classifier was applied to the validation set, all 6 algorithms could identify the subgroups of Met+ tumors. Moreover, membership of the Met+ group showed little fluctuation using different statistical methods (Table 3). Kaplan-Meier survival curves and results of the log-rank tests with all predictors showed that HCC patients with tumors harboring prominent Met gene expression signature have a worse survival rate compared with other patients (Figure 7, A–E). We also applied the prediction algorithms to the Stanford arrays, using the same LEC training set and only genes that were represented in both platforms. In the Stanford data set, the prediction rate of the metastatic liver lesions was 100% with 5 of 6 algorithms.
Beyond predicting the disease outcome in HCC patients, the clas-sifier genes may also represent the most conserved cross-species part of prominent HGF/Met–regulated expression signature that
Figure 5Expression profiles of the Met-regulated genes in HCCs from the Stanford data set. (A) Hierarchical cluster analysis of mouse hepatocyte sam-ples together with 103 HCC and 7 liver metastases from the Stanford data set. Clustering was performed with 303 common orthologous genes that showed HGF/Met–regulated expression pattern in mouse hepatocytes. Normalized log2-transformed expression ratios are presented in a matrix where columns and rows represent individual genes and samples, respectively. (B) Dendrogram of cluster analysis shows that several HCC samples and all metastatic tumors (Met+ group) share a similar expression pattern with the HGF-treated control hepatocytes (WT). HCC samples in the Met– group and Met KO hepatocytes do not share the same gene expression pattern of Met activation.
research article
1590 TheJournalofClinicalInvestigation http://www.jci.org Volume 116 Number 6 June 2006
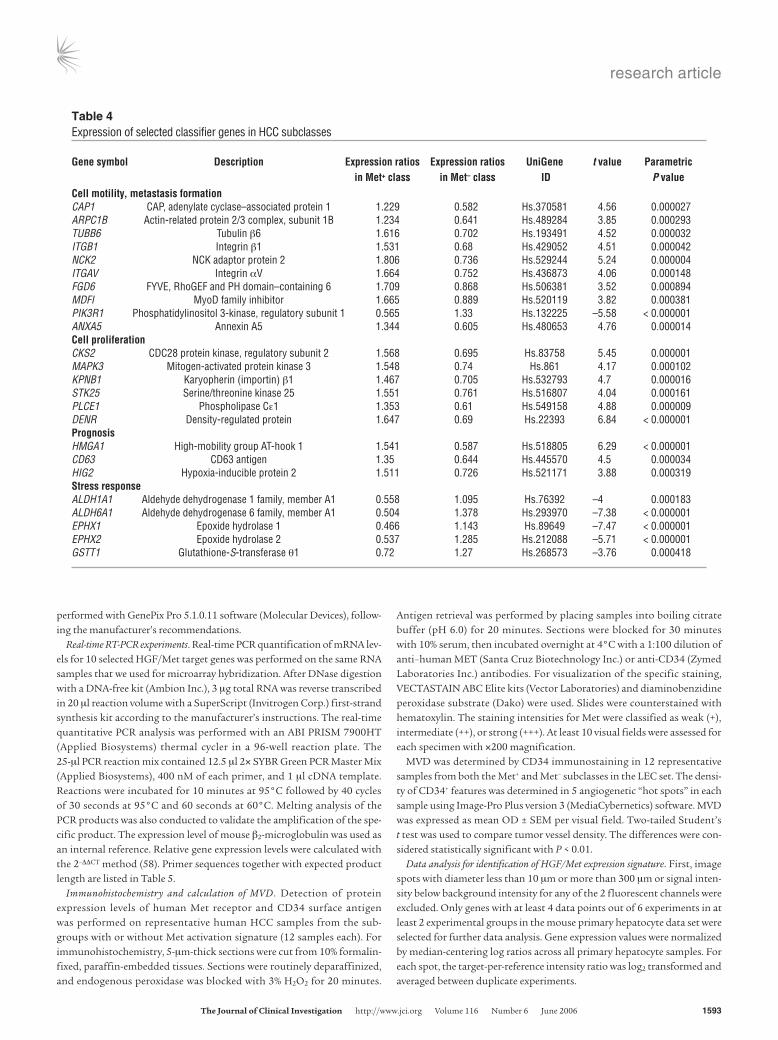
plays a critical role in the Met-induced cellular transformation. Several of these genes either were previously defined as important contributors to metastasis formation, including HIG2 (41), EPHA2 (42), MAPK3 (43), P85α (44), ITGαV (29), and ITGβ1 (29), or could be related to cell motility and invasiveness by their postulated functions (CAP1, ARPC1B, NCK2) (Table 4) (26, 27, 45).
DiscussionIn the current study we used global gene expression profiling to identify the Met-regulated genes in primary mouse hepatocytes. Analysis of microarray data identified several new Met target genes. Some of these genes indicate a novel role for Met in the regulation of hepatocyte homeostasis. Furthermore, comparison of the Met-dependent gene expression signature between mouse hepatocytes and human HCC samples revealed the presence of a clinically significant subgroup of HCC patients with a pro-nounced Met gene expression signature.
Although many etiological risk factors leading to HCC devel-opment (HBV and HCV hepatitis or alcoholic liver disease) are well documented (46), the molecular events of HCC pathogenesis are still not clearly understood. Application of high-throughput techniques including expression microarrays could significantly improve our knowledge in this field. Indeed, recent studies suc-cessfully identified the differentially expressed gene sets associ-ated with phenotypic markers or clinicopathological conditions such as viral etiology (47), tumor recurrence (48), and intrahepatic metastases (49) in HCC samples. Furthermore, the use of expres-sion profiling made it possible to divide the HCC patients into subgroups with a significantly different disease outcome and sur-
vival rate (35). However, the complexity of the expression profiles in the human tumors often prevents the identification of primary regulatory events. To overcome this limitation, we used a geneti-cally modified mouse model and a functional genomic approach to identify a subgroup of HCCs characterized by a pronounced Met gene expression signature.
Multiple findings support the prominent clinical significance of the HCC classification based on the presence or absence of the
Table 2Clinicopathological variables in the LEC HCC set
Clinicopathological variable Met+ Met– Total cluster clusterSex Male 43 59 102Female 12 25 37Age Mean (yr) 52.7 58.6 55.6SD 12.5 13.9 13.2Liver cirrhosis + 30 39 69– 24 46 70Etiology HBV hepatitis 34 22 56HCV hepatitis 4 10 14Alcoholic liver disease 3 13 16HBV + HCV hepatitis 1 3 4Alcohol + HBV 0 1 1Alcohol + HCV 0 3 3Nonalcoholic steatohepatitis 0 2 2Autoimmune hepatitis 1 1 2Hereditary hemochromatosis 0 3 3α1-Antitrypsin deficiency 0 1 1Primary biliary cirrhosis 0 1 1Wilson disease 1 0 1Unknown 11 24 35Tumor size >5 cm 33 34 67<5 cm 15 26 41AFP level >300 U 27 23 50<300 U 17 37 54Edmondson grade Grade I 0 2 2Grade II 13 44 57Grade III 39 35 74Grade IV 3 3 6
AFP, α-phetoprotein.
Figure 6Association between the different clinicopathological variables and the Met+ and Met– HCC subsets defined by hierarchical cluster analysis of the LEC samples. Kaplan-Meier plot (A) and log-rank statistics demon-strate the difference in the overall survival between HCC patients from the Met+ and from the Met– groups. (B and C) Bar graphs represent vas-cular invasion rate (B) and average MVD (C) in HCC samples from Met+ and Met– sets. MVD was determined by quantitative analysis of CD34+ vascular features. (D and E) Microscope images show CD34 staining of endothelial cells in representative samples from Met+ (D) and Met– (E) tumor sets. Pictures were taken with ×200 original magnification.
research article
TheJournalofClinicalInvestigation http://www.jci.org Volume 116 Number 6 June 2006 1591
Met expression signature. First, the prevalence of the Met expres-sion signature showed a significant association with aggressive phenotypic traits including increased MVD and rate of vascular invasion. These findings are in agreement with the observations that designated HGF/Met signaling as one of the key promoters of metastasis formation and tumor angiogenesis (16). Second, the presence of Met signature had major prognostic significance for the HCC patients as evidenced by 6 different supervised prediction algorithms applied to the independent training and validation sets of HCC samples. The analysis revealed a significantly lower sur-vival rate for patients with the predicted presence of Met expres-sion signature compared with the group with the absence of Met signature. Third, the Met signature included the target genes with strong cross-species conservation. These genes support the Met-regulated cellular programs associated with neoplastic transfor-mation and may therefore constitute important therapeutic tar-gets. Genes involved in focal adhesion formation, as well as in the organization of actin cytoskeleton at the leading edge of a motile cell, are good examples of these functionally related target genes. Finally, the observation that the colon metastatic tumor samples shared the hepatocyte-specific Met expression signature suggests a considerable overlap of Met target genes induced during the pro-gression of carcinomas with a different cellular origin.
The use of WT and Met KO primary hepatocyte cultures provided a significant advantage over experiments conducted on cell lines. Transcriptional response of cultured hepatocytes closely mimicked the in vivo events following HGF stimulation. Moreover, the com-parison with Met KO cells allowed us to eliminate the HGF-inde-pendent cross-activation of the Met receptor by semaphorin/plexin B1 (50) or EGF/EGFR complexes (51) or by other mechanisms and therefore led to a more stringent detection of HGF target genes.
Nevertheless, it is highly likely that in human liver tumors the Met-regulated expression signature is not always associated with the alteration of the receptor itself. Activation of the HGF/Met
pathway at different levels could produce the same expression patterns. There is also a possibility that distinct but functionally homologous signaling pathways could induce the same effector genes as HGF/Met. In this case, the shared expression signatures would reflect common phenotypic changes but different regula-tory mechanisms. EGF and TGF-α are likely candidates, since they induce similar intracellular signaling events and cellular responses to Met (51). Comparison of LEC human HCCs with HCC samples from the different transgenic mouse models showed that human tumors with a bad prognosis were the most similar to MYC/TGF-α mouse tumors, suggesting the dominance of TGF-α/EGFR signal-ing in these samples (38). Thus, some of the Met target genes may be cross-regulated by the TGF-α/EGFR pathway or other tyrosine kinases. Currently, little information is available on the extent of overlap between the expression signatures of different tyrosine kinase pathways. However, previous studies suggested that activa-tion of EGFR receptor could lead to direct transactivation of the Met in transformed cells. It is therefore possible, at least under cer-tain conditions, that target genes specific for Met activation could be induced by the EGFR signaling (52). On the other hand, when similarities between HGF- and VEGF-induced expression profiles were investigated in endothelial cells, the data did not show a close resemblance between the 2 gene sets (53).
We believe that changes detected in gene expression can also provide mechanistic explanations for the phenotypic altera-tions observed in KO hepatocytes. Absence of induction of genes involved in motility and cytoskeletal organization correlates well with previously reported defects in KO cells such as impaired motility and decreased proliferation potential (20). A significant new finding in this study was the identification of the effect of Met activation on cellular homeostasis. Numerous genes partici-pating in oxidative and xenobiotic stress response (Ephx1, Aldh1a1, Aldh1a7) or related to glutathione metabolism (Gsta3, Gstm3, Gclc) had elevated expression levels in Met KO cells. Most of them are
Table 3Summary of the class prediction results
CCP NN1 NN3 NC SVM LDA
Predicted subclass Met+ Met– Met+ Met– Met+ Met– Met+ Met– Met+ Met– Met+ Met–
LEC data set Training set Cluster Met+ (n = 30) 27 3 27 3 27 3 27 3 29 1 27 3 Cluster Met– (n = 30) 2 28 1 29 1 29 2 28 2 28 2 29 Correctly classified (%) 92 93 93 92 95 92 Validation set Cluster Met+ (n = 28) 23 5 23 5 24 4 22 6 24 4 23 5 Cluster Met– (n = 51) 1 50 1 50 0 51 1 50 2 49 1 50 Correctly classified (%) 92 92 95 91 92 92Stanford data set Human HCC Cluster Met+ (n = 22) 21 1 11 10 9 13 21 1 15 7 21 1 Cluster Met– (n = 81) 11 70 8 73 10 71 12 69 11 70 11 70 Correctly classified (%) 88 82 78 87 83 88 Metastasis Cluster Met+ (n = 7) 7 0 7 0 7 0 7 0 6 1 7 0 Cluster Met– (n = 0) 0 0 0 0 0 0 0 0 0 0 0 0 Correctly classified (%) 100 100 100 100 86 100 Significance of LOOCV P < 5 × 10⁻⁴ P < 5 × 10⁻⁴ P < 5 × 10⁻⁴ P < 5 × 10⁻⁴ P < 5 × 10⁻⁴ P < 5 × 10⁻⁴
research article
1592 TheJournalofClinicalInvestigation http://www.jci.org Volume 116 Number 6 June 2006
well-established targets of Nfe2l2 transcription factor (54), as they contain antioxidant response element in their promoter sequence. Although this pathway is essential for the detoxification of toxic metabolic intermediates, the permanent activation of Nfe2l2 in a mouse model is lethal (32). A connection between the Nfe2l2 and Met pathways could exist at multiple levels. Activation of ERK signaling by Met may inhibit retinoic X receptor α (RXRα) (55), which together with PPARγ positively regulates Nfe2l2 targets and lipid metabolic enzymes (56). Alternatively, elevated oxidative stress together with accumulation of toxic metabolic intermedi-ates in Met KO animals may cause the high Nfe2l2 activation (32). Together these data implicate HGF/Met signaling as an important regulator of metabolic homeostasis in hepatocytes.
In conclusion, our study demonstrates that characterization of pathway-specific gene expression signatures in well-suited experi-mental models facilitates the discovery of novel intracellular regu-latory mechanisms and can improve the molecular classification of human cancers.
MethodsAnimal model. Hepatocyte-specific deletion of exon 16, essential for Met func-tion, was achieved by crossing of the albumin-Cre transgene against the floxed
Met allele as described previously (18). The genotypes of the control and mutant mice used in this study were Met+/+AlbCre+/– and Met–/–AlbCre+/–, respec-tively. All animal experiments were conducted according to the NIH guidelines for animal care. All animal experiments and procedures were approved by the National Cancer Institute Animal Care and Use Committee.
Hepatocyte isolation and culture. Hepatocytes were isolated by 2-step col-lagenase perfusion of the mouse livers followed by isodensity purification in Percoll gradient (57). Cells were seeded at 2 × 10⁶ in 10-cm dishes in the plating medium supplemented with 10% FBS as described in ref. 57. After 4 hours, the plating medium was replaced with serum-free medium. The fol-lowing day, cells were treated with 50 ng/ml of recombinant human HGF (PeproTech) for 0.5, 2, 12, and 24 hours. Triplicate cell cultures were estab-lished from 3 individual mice. Cells without treatment were collected at the beginning of each time course experiment and served as 0 time control.
RNA isolation and microarray hybridization. The Mouse OligoLibrary Release 1 plus Extension oligonucleotide set containing 21,997 65-mer oligonucle-otides representing 19,740 unique genes was purchased from Compugene Inc. Microarrays were produced in the Laboratory of Molecular Technol-ogy, National Cancer Institute. Total RNA was extracted from the prima-ry cultures using TRIZOL (Invitrogen Corp.) protocol. Each sample was hybridized against a common reference sample isolated from B6/129 WT primary hepatocytes, in a reverse-fluor design, and gene expression values were defined as a target-per-reference ratio. Twenty micrograms of total RNA was used to synthesize fluorescently labeled (Amersham Biosciences) cDNA probes. Preparation of the labeled cDNA samples and hybridization of oligonucleotide microarrays were performed with small modifications (37). Briefly, RNA samples were denaturatedwith 4 µg (d)T20 primer at 70°C for 5 minutes, chilled on ice, and incubated for 1 hour at 42°C in a 50-µl reaction mix containing 10 µl 10× First-Strand buffer (Invitrogen Corp.), 2.5 µl 20× deoxynucleotide triphosphate (dNTP) mix (10 mM dATP, dGTP, and CTP; 4 mM dTTP; and 6 mM aminoallyl-dUTP; Sigma-Aldrich), 5 µl of 0.1 M DTT, 2 µl SuperScript II (Invitrogen Corp.) reverse transcrip-tase, and 1 µl SUPERaseIn (Ambion Inc.). After digestion with 4 U RNase H (Ambion Inc.) at 37°C for 20 minutes, the samples were cleaned up with a MinElute PCR Purification Kit (QIAGEN). The eluted cDNA samples were concentrated by Speed Vac (Global Medical Instrumentation Inc.) and resolved in 20 µl 0.1 M NaHCO3 solution. The Cy3 and Cy5 dyes (Amersham Biosciences) were also dissolved in 20 µl of water. For the coupling reaction, 2 µl of dye was added to each sample, and the mix was left in a dark box for an hour. Labeled cDNA was purified again with a MinElute kit (QIAGEN), and Cy3- and Cy5-labeled target and reference samples were combined. Before the hybridization, oligonucleotide microarrays were pretreated with a 5× SSC, 1% BSA, 0.1% SDS blocking solution. The samples were applied on the microarray slides in a hybridization mix containing 25% formamide, 0.1% SDS, and 5× SSC in 28 µl final volume. After overnight incubation, the slides were washed in a 1× SSC 0.1% SDS solution for 2 minutes and then consecutively in 1× SSC and 0.2× SSC solutions. Air-dried arrays were scanned in a GenePix 4000A scanner (Molecular Devices) in such a way that photomultiplier tube voltage was adjusted to achieve optimal signal inten-sity at both channels with less than 1% saturated spots. Image analysis was
Figure 7Survival analysis based on the predicted Met activation in the LEC validation set. Log-rank test results and Kaplan-Meier plots demon-strate the overall survival of HCC patients from the LEC validation set. Patients were stratified into 2 groups based on the expression pattern of preselected classifier genes using the CCP (A), NN1 (B), NN3 (C), NC (D), SVM (E), and LDA (F) algorithms. In the tumors from the Met+ patients, higher activation of the Met signaling pathway is predicted compared with that in the Met– group.
research article
TheJournalofClinicalInvestigation http://www.jci.org Volume 116 Number 6 June 2006 1593
performed with GenePix Pro 5.1.0.11 software (Molecular Devices), follow-ing the manufacturer’s recommendations.
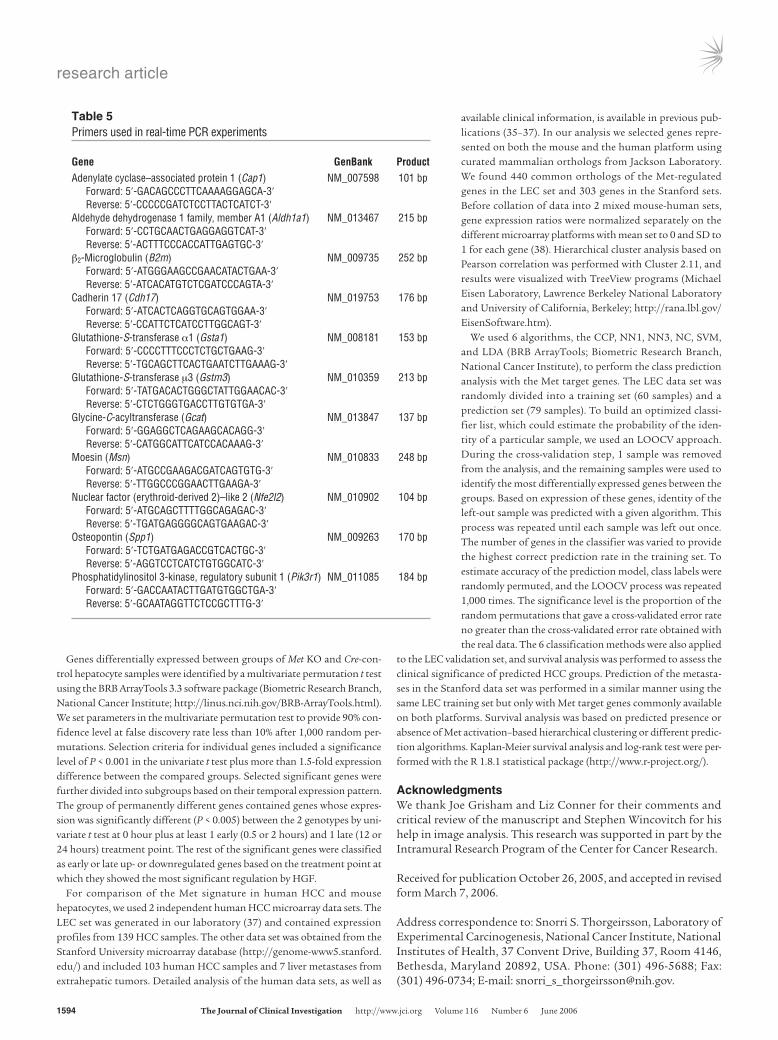
Real-time RT-PCR experiments. Real-time PCR quantification of mRNA lev-els for 10 selected HGF/Met target genes was performed on the same RNA samples that we used for microarray hybridization. After DNase digestion with a DNA-free kit (Ambion Inc.), 3 µg total RNA was reverse transcribed in 20 µl reaction volume with a SuperScript (Invitrogen Corp.) first-strand synthesis kit according to the manufacturer’s instructions. The real-time quantitative PCR analysis was performed with an ABI PRISM 7900HT (Applied Biosystems) thermal cycler in a 96-well reaction plate. The 25-µl PCR reaction mix contained 12.5 µl 2× SYBR Green PCR Master Mix (Applied Biosystems), 400 nM of each primer, and 1 µl cDNA template. Reactions were incubated for 10 minutes at 95°C followed by 40 cycles of 30 seconds at 95°C and 60 seconds at 60°C. Melting analysis of the PCR products was also conducted to validate the amplification of the spe-cific product. The expression level of mouse β2-microglobulin was used as an internal reference. Relative gene expression levels were calculated with the 2–∆∆CT method (58). Primer sequences together with expected product length are listed in Table 5.
Immunohistochemistry and calculation of MVD. Detection of protein expression levels of human Met receptor and CD34 surface antigen was performed on representative human HCC samples from the sub-groups with or without Met activation signature (12 samples each). For immunohistochemistry, 5-µm-thick sections were cut from 10% formalin-fixed, paraffin-embedded tissues. Sections were routinely deparaffinized, and endogenous peroxidase was blocked with 3% H2O2 for 20 minutes.
Antigen retrieval was performed by placing samples into boiling citrate buffer (pH 6.0) for 20 minutes. Sections were blocked for 30 minutes with 10% serum, then incubated overnight at 4°C with a 1:100 dilution of anti–human MET (Santa Cruz Biotechnology Inc.) or anti-CD34 (Zymed Laboratories Inc.) antibodies. For visualization of the specific staining, VECTASTAIN ABC Elite kits (Vector Laboratories) and diaminobenzidine peroxidase substrate (Dako) were used. Slides were counterstained with hematoxylin. The staining intensities for Met were classified as weak (+), intermediate (++), or strong (+++). At least 10 visual fields were assessed for each specimen with ×200 magnification.
MVD was determined by CD34 immunostaining in 12 representative samples from both the Met+ and Met– subclasses in the LEC set. The densi-ty of CD34+ features was determined in 5 angiogenetic “hot spots” in each sample using Image-Pro Plus version 3 (MediaCybernetics) software. MVD was expressed as mean OD ± SEM per visual field. Two-tailed Student’s t test was used to compare tumor vessel density. The differences were con-sidered statistically significant with P < 0.01.
Data analysis for identification of HGF/Metexpression signature. First, image spots with diameter less than 10 µm or more than 300 µm or signal inten-sity below background intensity for any of the 2 fluorescent channels were excluded. Only genes with at least 4 data points out of 6 experiments in at least 2 experimental groups in the mouse primary hepatocyte data set were selected for further data analysis. Gene expression values were normalized by median-centering log ratiosacross all primary hepatocyte samples. For each spot, the target-per-reference intensity ratio was log2 transformed and averaged between duplicate experiments.
Table 4Expression of selected classifier genes in HCC subclasses
Gene symbol Description Expression ratios Expression ratios UniGene t value Parametric in Met+ class in Met– class ID P valueCell motility, metastasis formation CAP1 CAP, adenylate cyclase–associated protein 1 1.229 0.582 Hs.370581 4.56 0.000027ARPC1B Actin-related protein 2/3 complex, subunit 1B 1.234 0.641 Hs.489284 3.85 0.000293TUBB6 Tubulin β6 1.616 0.702 Hs.193491 4.52 0.000032ITGB1 Integrin β1 1.531 0.68 Hs.429052 4.51 0.000042NCK2 NCK adaptor protein 2 1.806 0.736 Hs.529244 5.24 0.000004ITGAV Integrin αV 1.664 0.752 Hs.436873 4.06 0.000148FGD6 FYVE, RhoGEF and PH domain–containing 6 1.709 0.868 Hs.506381 3.52 0.000894MDFI MyoD family inhibitor 1.665 0.889 Hs.520119 3.82 0.000381PIK3R1 Phosphatidylinositol 3-kinase, regulatory subunit 1 0.565 1.33 Hs.132225 –5.58 < 0.000001ANXA5 Annexin A5 1.344 0.605 Hs.480653 4.76 0.000014Cell proliferation CKS2 CDC28 protein kinase, regulatory subunit 2 1.568 0.695 Hs.83758 5.45 0.000001MAPK3 Mitogen-activated protein kinase 3 1.548 0.74 Hs.861 4.17 0.000102KPNB1 Karyopherin (importin) β1 1.467 0.705 Hs.532793 4.7 0.000016STK25 Serine/threonine kinase 25 1.551 0.761 Hs.516807 4.04 0.000161PLCE1 Phospholipase Cε1 1.353 0.61 Hs.549158 4.88 0.000009DENR Density-regulated protein 1.647 0.69 Hs.22393 6.84 < 0.000001Prognosis HMGA1 High-mobility group AT-hook 1 1.541 0.587 Hs.518805 6.29 < 0.000001CD63 CD63 antigen 1.35 0.644 Hs.445570 4.5 0.000034HIG2 Hypoxia-inducible protein 2 1.511 0.726 Hs.521171 3.88 0.000319Stress response ALDH1A1 Aldehyde dehydrogenase 1 family, member A1 0.558 1.095 Hs.76392 –4 0.000183ALDH6A1 Aldehyde dehydrogenase 6 family, member A1 0.504 1.378 Hs.293970 –7.38 < 0.000001EPHX1 Epoxide hydrolase 1 0.466 1.143 Hs.89649 –7.47 < 0.000001EPHX2 Epoxide hydrolase 2 0.537 1.285 Hs.212088 –5.71 < 0.000001GSTT1 Glutathione-S-transferase θ1 0.72 1.27 Hs.268573 –3.76 0.000418
research article
1594 TheJournalofClinicalInvestigation http://www.jci.org Volume 116 Number 6 June 2006
Genes differentially expressed between groups of Met KO and Cre-con-trol hepatocyte samples were identified by a multivariate permutation t test using the BRB ArrayTools 3.3 software package (Biometric Research Branch, National Cancer Institute; http://linus.nci.nih.gov/BRB-ArrayTools.html). We set parameters in the multivariate permutation test to provide 90% con-fidence level at false discovery rate less than 10% after 1,000 random per-mutations. Selection criteria for individual genes included a significance level of P < 0.001 in the univariate t test plus more than 1.5-fold expression difference between the compared groups. Selected significant genes were further divided into subgroups based on their temporal expression pattern. The group of permanently different genes contained genes whose expres-sion was significantly different (P < 0.005) between the 2 genotypes by uni-variate t test at 0 hour plus at least 1 early (0.5 or 2 hours) and 1 late (12 or 24 hours) treatment point. The rest of the significant genes were classified as early or late up- or downregulated genes based on the treatment point at which they showed the most significant regulation by HGF.
For comparison of the Met signature in human HCC and mouse hepatocytes, we used 2 independent human HCC microarray data sets. The LEC set was generated in our laboratory (37) and contained expression profiles from 139 HCC samples. The other data set was obtained from the Stanford University microarray database (http://genome-www5.stanford.edu/) and included 103 human HCC samples and 7 liver metastases from extrahepatic tumors. Detailed analysis of the human data sets, as well as
available clinical information, is available in previous pub-lications (35–37). In our analysis we selected genes repre-sented on both the mouse and the human platform using curated mammalian orthologs from Jackson Laboratory. We found 440 common orthologs of the Met-regulated genes in the LEC set and 303 genes in the Stanford sets. Before collation of data into 2 mixed mouse-human sets, gene expression ratios were normalized separately on the different microarray platforms with mean set to 0 and SD to 1 for each gene (38). Hierarchical cluster analysis based on Pearson correlation was performed with Cluster 2.11, and results were visualized with TreeView programs (Michael Eisen Laboratory, Lawrence Berkeley National Laboratory and University of California, Berkeley; http://rana.lbl.gov/EisenSoftware.htm).
We used 6 algorithms, the CCP, NN1, NN3, NC, SVM, and LDA (BRB ArrayTools; Biometric Research Branch, National Cancer Institute), to perform the class prediction analysis with the Met target genes. The LEC data set was randomly divided into a training set (60 samples) and a prediction set (79 samples). To build an optimized classi-fier list, which could estimate the probability of the iden-tity of a particular sample, we used an LOOCV approach. During the cross-validation step, 1 sample was removed from the analysis, and the remaining samples were used to identify the most differentially expressed genes between the groups. Based on expression of these genes, identity of the left-out sample was predicted with a given algorithm. This process was repeated until each sample was left out once. The number of genes in the classifier was varied to provide the highest correct prediction rate in the training set. To estimate accuracy of the prediction model, class labels were randomly permuted, and the LOOCV process was repeated 1,000 times. The significance level is the proportion of the random permutations that gave a cross-validated error rate no greater than the cross-validated error rate obtained with the real data. The 6 classification methods were also applied
to the LEC validation set, and survival analysis was performed to assess the clinical significance of predicted HCC groups. Prediction of the metasta-ses in the Stanford data set was performed in a similar manner using the same LEC training set but only with Met target genes commonly available on both platforms. Survival analysis was based on predicted presence or absence of Met activation–based hierarchical clustering or different predic-tion algorithms. Kaplan-Meier survival analysis and log-rank test were per-formed with the R 1.8.1 statistical package (http://www.r-project.org/).
AcknowledgmentsWe thank Joe Grisham and Liz Conner for their comments and critical review of the manuscript and Stephen Wincovitch for his help in image analysis. This research was supported in part by the Intramural Research Program of the Center for Cancer Research.
Received for publication October 26, 2005, and accepted in revised form March 7, 2006.
Address correspondence to: Snorri S. Thorgeirsson, Laboratory of Experimental Carcinogenesis, National Cancer Institute, National Institutes of Health, 37 Convent Drive, Building 37, Room 4146, Bethesda, Maryland 20892, USA. Phone: (301) 496-5688; Fax: (301) 496-0734; E-mail: [email protected].
Table 5Primers used in real-time PCR experiments
Gene GenBank ProductAdenylate cyclase–associated protein 1 (Cap1) NM_007598 101 bp Forward: 5′-GACAGCCCTTCAAAAGGAGCA-3′ Reverse: 5′-CCCCCGATCTCCTTACTCATCT-3′ Aldehyde dehydrogenase 1 family, member A1 (Aldh1a1) NM_013467 215 bp Forward: 5′-CCTGCAACTGAGGAGGTCAT-3′ Reverse: 5′-ACTTTCCCACCATTGAGTGC-3′ β2-Microglobulin (B2m) NM_009735 252 bp Forward: 5′-ATGGGAAGCCGAACATACTGAA-3′ Reverse: 5′-ATCACATGTCTCGATCCCAGTA-3′ Cadherin 17 (Cdh17) NM_019753 176 bp Forward: 5′-ATCACTCAGGTGCAGTGGAA-3′ Reverse: 5′-CCATTCTCATCCTTGGCAGT-3′ Glutathione-S-transferase α1 (Gsta1) NM_008181 153 bp Forward: 5′-CCCCTTTCCCTCTGCTGAAG-3′ Reverse: 5′-TGCAGCTTCACTGAATCTTGAAAG-3′ Glutathione-S-transferase µ3 (Gstm3) NM_010359 213 bp Forward: 5′-TATGACACTGGGCTATTGGAACAC-3′ Reverse: 5′-CTCTGGGTGACCTTGTGTGA-3′ Glycine-C-acyltransferase (Gcat) NM_013847 137 bp Forward: 5′-GGAGGCTCAGAAGCACAGG-3′ Reverse: 5′-CATGGCATTCATCCACAAAG-3′ Moesin (Msn) NM_010833 248 bp Forward: 5′-ATGCCGAAGACGATCAGTGTG-3′ Reverse: 5′-TTGGCCCGGAACTTGAAGA-3′ Nuclear factor (erythroid-derived 2)–like 2 (Nfe2l2) NM_010902 104 bp Forward: 5′-ATGCAGCTTTTGGCAGAGAC-3′ Reverse: 5′-TGATGAGGGGCAGTGAAGAC-3′ Osteopontin (Spp1) NM_009263 170 bp Forward: 5′-TCTGATGAGACCGTCACTGC-3′ Reverse: 5′-AGGTCCTCATCTGTGGCATC-3′ Phosphatidylinositol 3-kinase, regulatory subunit 1 (Pik3r1) NM_011085 184 bp Forward: 5′-GACCAATACTTGATGTGGCTGA-3′ Reverse: 5′-GCAATAGGTTCTCCGCTTTG-3′
research article
TheJournalofClinicalInvestigation http://www.jci.org Volume 116 Number 6 June 2006 1595
1. Rhodes, D.R., and Chinnaiyan, A.M. 2005. Integra-tive analysis of the cancer transcriptome. Nat. Genet. 37(Suppl.):S31–S37.
2. Rhodes, D.R., et al. 2004. ONCOMINE: a cancer microarray database and integrated data-mining platform. Neoplasia. 6:1–6.
3. Rhodes, D.R., et al. 2004. Large-scale meta-analy-sis of cancer microarray data identifies common transcriptional profiles of neoplastic transforma-tion and progression. Proc. Natl. Acad. Sci. U. S. A. 101:9309–9314.
4. Segal, E., Friedman, N., Kaminski, N., Regev, A., and Koller, D. 2005. From signatures to models: understanding cancer using microarrays. Nat. Genet. 37(Suppl.):S38–S45.
5. Sweet-Cordero, A., et al. 2005. An oncogenic KRAS2 expression signature identified by cross-species gene-expression analysis. Nat. Genet. 37:48–55.
6. Huang, E., et al. 2003. Gene expression phenotypic models that predict the activity of oncogenic path-ways. Nat. Genet. 34:226–230.
7. Furge, K.A., Zhang, Y.W., and Vande Woude, G.F. 2000. Met receptor tyrosine kinase: enhanced signaling through adapter proteins. Oncogene. 19:5582–5589.
8. Gentile, A., and Comoglio, P.M. 2004. Inva-sive growth: a genetic program. Int. J. Dev. Biol. 48:451–456.
9. Schmidt, C., et al. 1995. Scatter factor/hepatocyte growth factor is essential for liver development. Nature. 373:699–702.
10. Bladt, F., Riethmacher, D., Isenmann, S., Aguzzi, A., and Birchmeier, C. 1995. Essential role for the c-met receptor in the migration of myogenic precur-sor cells into the limb bud. Nature. 376:768–771.
11. Michalopoulos, G.K., and DeFrances, M.C. 1997. Liver regeneration. Science. 276:60–66.
12. Ueki, T., et al. 1999. Hepatocyte growth factor gene therapy of liver cirrhosis in rats. Nat. Med. 5:226–230.
13. Schulze-Bergkamen, H., et al. 2004. Hepatocyte growth factor induces Mcl-1 in primary human hepatocytes and inhibits CD95-mediated apopto-sis via Akt. Hepatology. 39:645–654.
14. Wang, X., et al. 2002. A mechanism of cell survival: sequestration of Fas by the HGF receptor Met. Mol. Cell. 9:411–421.
15. Stolz, D.B., Mars, W.M., Petersen, B.E., Kim, T.H., and Michalopoulos, G.K. 1999. Growth factor signal transduction immediately after two-thirds partial hepatectomy in the rat. Cancer Res. 59:3954–3960.
16. Birchmeier, C., Birchmeier, W., Gherardi, E., and Vande Woude, G.F. 2003. Met, metastasis, motility and more. Nat. Rev. Mol. Cell Biol. 4:915–925.
17. Ma, P.C., Maulik, G., Christensen, J., and Salgia, R. 2003. c-Met: structure, functions and potential for therapeutic inhibition. Cancer Metastasis Rev. 22:309–325.
18. Corso, S., Comoglio, P.M., and Giordano, S. 2005. Cancer therapy: can the challenge be MET? Trends Mol. Med. 11:284–292.
19. Ueki, T., Fujimoto, J., Suzuki, T., Yamamoto, H., and Okamoto, E. 1997. Expression of hepatocyte growth factor and its receptor c-met proto-onco-gene in hepatocellular carcinoma. Hepatology. 25:862–866.
20. Huh, C.G., et al. 2004. Hepatocyte growth factor/ c-met signaling pathway is required for efficient liver regeneration and repair. Proc. Natl. Acad. Sci. U. S. A. 101:4477–4482.
21. Medico, E., et al. 2001. Osteopontin is an autocrine mediator of hepatocyte growth factor-induced invasive growth. Cancer Res. 61:5861–5868.
22. Gujdar, A., Sipeki, S., Bander, E., Buday, L., and Farago, A. 2004. Protein kinase C modulates nega-tively the hepatocyte growth factor-induced migra-tion, integrin expression and phosphatidylinositol 3-kinase activation. Cell. Signal. 16:505–513.
23. Recio, J.A., and Merlino, G. 2003. Hepatocyte growth factor/scatter factor induces feedback up-regulation of CD44v6 in melanoma cells through Egr-1. Cancer Res. 63:1576–1582.
24. Lipschutz, J.H., Li, S., Arisco, A., and Balkovetz, D.F. 2005. Extracellular signal-regulated kinases 1/2 control claudin-2 expression in Madin-Darby canine kidney strain I and II cells. J. Biol. Chem. 280:3780–3788.
25. Baron, V., Adamson, E.D., Calogero, A., Ragona, G., and Mercola, D. 2006. The transcription fac-tor Egr1 is a direct regulator of multiple tumor suppressors including TGFbeta1, PTEN, p53, and fibronectin. Cancer Gene Ther. 13:115–124.
26. Kempiak, S.J., et al. 2005. A neural Wiskott-Aldrich Syndrome protein-mediated pathway for localized activation of actin polymerization that is regulated by cortactin. J. Biol. Chem. 280:5836–5842.
27. Moriyama, K., and Yahara, I. 2002. Human CAP1 is a key factor in the recycling of cofilin and actin for rapid actin turnover. J. Cell Sci. 115:1591–1601.
28. McClatchey, A.I. 2003. Merlin and ERM proteins: unappreciated roles in cancer development? Nat. Rev. Cancer. 3:877–883.
29. Guo, W., and Giancotti, F.G. 2004. Integrin signal-ling during tumour progression. Nat. Rev. Mol. Cell Biol. 5:816–826.
30. Wai, P.Y., and Kuo, P.C. 2004. The role of Osteopon-tin in tumor metastasis. J. Surg. Res. 121:228–241.
31. Dickinson, D.A., et al. 2004. Human glutamate cysteine ligase gene regulation through the elec-trophile response element. Free Radic. Biol. Med. 37:1152–1159.
32. Motohashi, H., and Yamamoto, M. 2004. Nrf2-Keap1 defines a physiologically important stress response mechanism. Trends Mol. Med. 10:549–557.
33. Dhakshinamoorthy, S., and Jaiswal, A.K. 2000. Small maf (MafG and MafK) proteins negatively regulate antioxidant response element-medi-ated expression and antioxidant induction of the NAD(P)H:Quinone oxidoreductase1 gene. J. Biol. Chem. 275:40134–40141.
34. Stahl, S., et al. 2005. Genotype-phenotype relation-ships in hepatocellular tumors from mice and man. Hepatology. 42:353–361.
35. Lee, J.S., et al. 2004. Classification and prediction of survival in hepatocellular carcinoma by gene expression profiling. Hepatology. 40:667–676.
36. Lee, J.-S., et al. 2006. A novel prognostic subtype of human hepatocellular carcinoma derived from hepatic progenitor cells. Nat. Med. 12:410–416.
37. Chen, X., et al. 2002. Gene expression patterns in human liver cancers. Mol. Biol. Cell. 13:1929–1939.
38. Lee, J.S., et al. 2004. Application of comparative func-tional genomics to identify best-fit mouse models to study human cancer. Nat. Genet. 36:1306–1311.
39. Strohmeyer, D., et al. 2004. Expression of bFGF, VEGF and c-met and their correlation with microvessel density and progression in prostate carcinoma. Anticancer Res. 24:1797–1804.
40. Kuhnen, C., et al. 2003. Impact of c-Met expression on angiogenesis in soft tissue sarcomas: correla-tion to microvessel-density. J. Cancer Res. Clin. Oncol. 129:415–422.
41. Denko, N., et al. 2000. Epigenetic regulation of gene expression in cervical cancer cells by the tumor microenvironment. Clin. Cancer Res. 6:480–487.
42. Kinch, M.S., and Carles-Kinch, K. 2003. Overex-
pression and functional alterations of the EphA2 tyrosine kinase in cancer. Clin. Exp. Metastasis. 20:59–68.
43. MacDonald, T.J., et al. 2001. Expression profiling of medulloblastoma: PDGFRA and the RAS/MAPK pathway as therapeutic targets for metastatic dis-ease. Nat. Genet. 29:143–152.
44. Bardelli, A., et al. 1999. Concomitant activation of pathways downstream of Grb2 and PI 3-kinase is required for MET-mediated metastasis. Oncogene. 18:1139–1146.
45. Pollard, T.D., and Borisy, G.G. 2003. Cellular motil-ity driven by assembly and disassembly of actin fila-ments. Cell. 112:453–465.
46. Sherman, M. 2005. Hepatocellular carcinoma: epi-demiology, risk factors, and screening. Semin. Liver Dis. 25:143–154.
47. Okabe, H., et al. 2001. Genome-wide analysis of gene expression in human hepatocellular carci-nomas using cDNA microarray: identification of genes involved in viral carcinogenesis and tumor progression. Cancer Res. 61:2129–2137.
48. Iizuka, N., et al. 2003. Oligonucleotide microarray for prediction of early intrahepatic recurrence of hepatocellular carcinoma after curative resection. Lancet. 361:923–929.
49. Ye, Q.H., et al. 2003. Predicting hepatitis B virus-positive metastatic hepatocellular carcinomas using gene expression profiling and supervised machine learning. Nat. Med. 9:416–423.
50. Giordano, S., et al. 2002. The semaphorin 4D recep-tor controls invasive growth by coupling with Met. Nat. Cell Biol. 4:720–724.
51. Fischer, O.M., Giordano, S., Comoglio, P.M., and Ullrich, A. 2004. Reactive oxygen species mediate Met receptor transactivation by G protein-cou-pled receptors and the epidermal growth factor receptor in human carcinoma cells. J. Biol. Chem. 279:28970–28978.
52. Jo, M., et al. 2000. Cross-talk between epidermal growth factor receptor and c-Met signal pathways in transformed cells. J. Biol. Chem. 275:8806–8811.
53. Gerritsen, M.E., Tomlinson, J.E., Zlot, C., Ziman, M., and Hwang, S. 2003. Using gene expression profiling to identify the molecular basis of the synergistic actions of hepatocyte growth factor and vascular endothelial growth factor in human endothelial cells. Br. J. Pharmacol. 140:595–610.
54. Lee, J.M., Calkins, M.J., Chan, K., Kan, Y.W., and Johnson, J.A. 2003. Identification of the NF-E2-related factor-2-dependent genes conferring pro-tection against oxidative stress in primary cortical astrocytes using oligonucleotide microarray analy-sis. J. Biol. Chem. 278:12029–12038.
55. Matsushima-Nishiwaki, R., et al. 2003. Molecu-lar mechanism for growth suppression of human hepatocellular carcinoma cells by acyclic retinoid. Carcinogenesis. 24:1353–1359.
56. Park, E.Y., Cho, I.J., and Kim, S.G. 2004. Transac-tivation of the PPAR-responsive enhancer module in chemopreventive glutathione S-transferase gene by the peroxisome proliferator-activated receptor-gamma and retinoid X receptor heterodimer. Can-cer Res. 64:3701–3713.
57. Kao, C.Y., Factor, V.M., and Thorgeirsson, S.S. 1996. Reduced growth capacity of hepatocytes from c-myc and c-myc/TGF-α transgenic mice in primary culture. Biochem. Biophys. Res. Commun. 222:64–70.
58. Pfaffl, M.W., Horgan, G.W., and Dempfle, L. 2002. Relative expression software tool (REST) for group-wise comparison and statistical analysis of relative expression results in real-time PCR. Nucleic Acids Res. 30:e36.