Mesoporous silica particle for selective detection of … Electronic Supplementary Information for...
29
1 Electronic Supplementary Information for Mesoporous silica particle for selective detection of dopamine with beta-cyclodextrin as the selective barricade Changmin Yu, Ming Luo, Fang Zeng,* Fangyuan Zheng, and Shuizhu Wu* College of Materials Science & Engineering, South China University of Technology, Guangzhou, P. R. China; State Key Laboratory of Physics & Chemistry of Luminescence, South China University of Technology, Guangzhou, 510640, P. R. China. E-mail: [email protected], [email protected] Contents 1. Experimental Details……..………………………………………….....…………S2-S6 2. Scheme S1……………………………………………………………………………..S7 3. Figure S1- Figure S18…………………..……….…………………………….....S8-S26 4. Table S1………………………………………………………………………………...S27 Electronic Supplementary Material (ESI) for Chemical Communications This journal is © The Royal Society of Chemistry 2011
Transcript of Mesoporous silica particle for selective detection of … Electronic Supplementary Information for...

1
Electronic Supplementary Information for
Mesoporous silica particle for selective detection of dopamine with
beta-cyclodextrin as the selective barricade
Changmin Yu, Ming Luo, Fang Zeng,* Fangyuan Zheng, and Shuizhu Wu*
College of Materials Science & Engineering, South China University of Technology,
Guangzhou, P. R. China;
State Key Laboratory of Physics & Chemistry of Luminescence, South China University of
Technology, Guangzhou, 510640, P. R. China.
E-mail: [email protected], [email protected]
Contents
1. Experimental Details……..………………………………………….....…………S2-S6
2. Scheme S1……………………………………………………………………………..S7
3. Figure S1- Figure S18…………………..……….…………………………….....S8-S26
4. Table S1………………………………………………………………………………...S27
Electronic Supplementary Material (ESI) for Chemical CommunicationsThis journal is © The Royal Society of Chemistry 2011
2
1. Experimental Details
Reagents and materials. Sodium azide (N3Na) and p-toluenesulfonyl chloride (Ts-Cl) were
purchased from Acros. β-cyclodextrin, L-serine (Ser), tetraethoxysilane (TEOS),
2-adamantanamine and tetrasodium ethylenediaminetetraacetic acid (EDTANa4) were
obtained from Alfa. (3-Isocyanatopropyl)triethoxysilane, 3-mercaptopropyltrimethoxysilane
(MPS), o-phthalaldehyde, n-cetyltrimethylammonium bromide (CTAB), sodium ascorbate,
L-tryptophan (Trp), L-phenylalanine (Phe), L-tyrosine (Tyr), L-glutamic acid (Glu),
L-arginine (Arg), L-lysine (Lys), L-aspartic acid (Asp), L-threonine (Thr), L-asparagine
(Asn), L-glutamine (Gln), cysteine (Cys), glycine (Gly), L-proline (Pro), L-alanine (Ala),
L-isoleucine (IIe), L-leucine (Leu), L-methionine (Met), L-valine (Val), L-histidine (His),
ascorbic acid, dopamine hydrochloride, propargylamine, norepinephrine and epinephrine
were obtained from Sigma. Fetal bovine serum was supplied by Hangzhou Sijiqing
Biological Engineering Materials Co. Ltd. Human urine was from a healthy female.
N,N-dimethyl-formamide (DMF) was dried with CaH2 and vacuum distilled. Tetrahydrofuran
(THF) was dried over molecular sieves and vacuum distilled. Methanol, ethanol and
dichloroethane were analytically pure solvents and distilled before use.
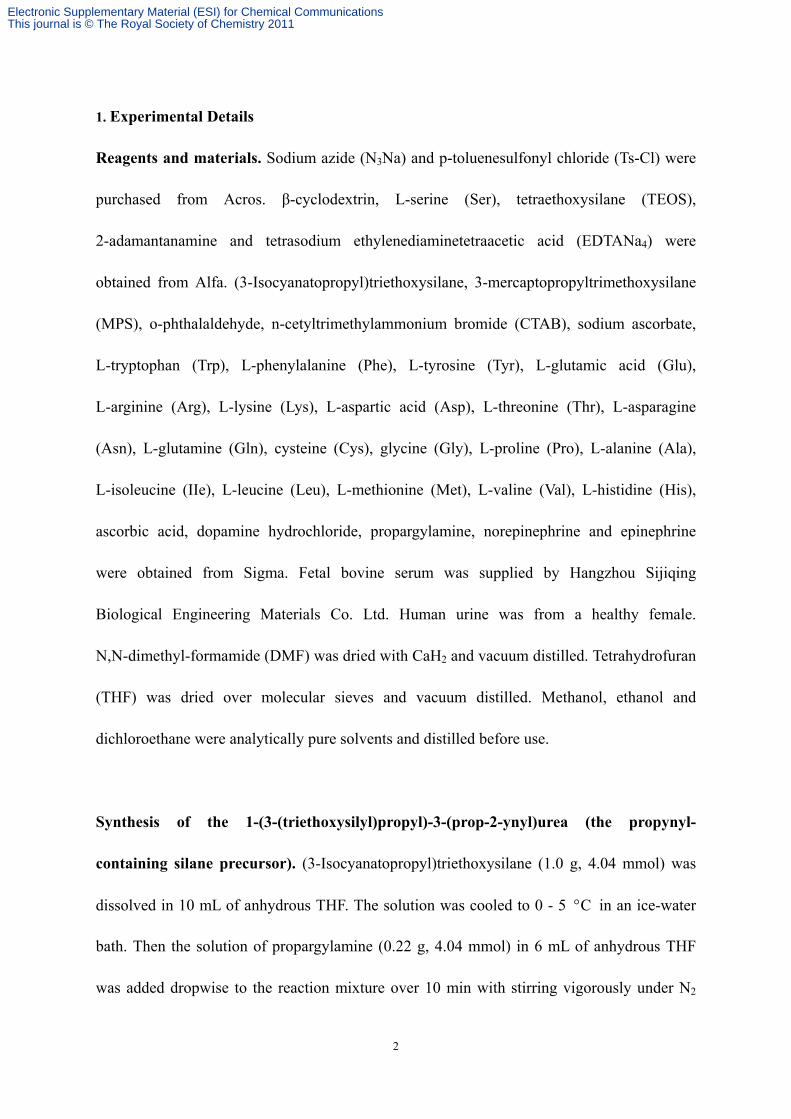
Synthesis of the 1-(3-(triethoxysilyl)propyl)-3-(prop-2-ynyl)urea (the propynyl-
containing silane precursor). (3-Isocyanatopropyl)triethoxysilane (1.0 g, 4.04 mmol) was
dissolved in 10 mL of anhydrous THF. The solution was cooled to 0 - 5 C in an ice-water
bath. Then the solution of propargylamine (0.22 g, 4.04 mmol) in 6 mL of anhydrous THF
was added dropwise to the reaction mixture over 10 min with stirring vigorously under N2
Electronic Supplementary Material (ESI) for Chemical CommunicationsThis journal is © The Royal Society of Chemistry 2011
3
protection. After 3 h of stirring at 0 - 5 C, the reaction mixture was heated to 65 C and
stirred over night. The solvent was then evaporated, and the residue was purified by silica gel
column chromatography using 3:1 (v/v) ethyl acetate/petroleum ether as the eluent to give
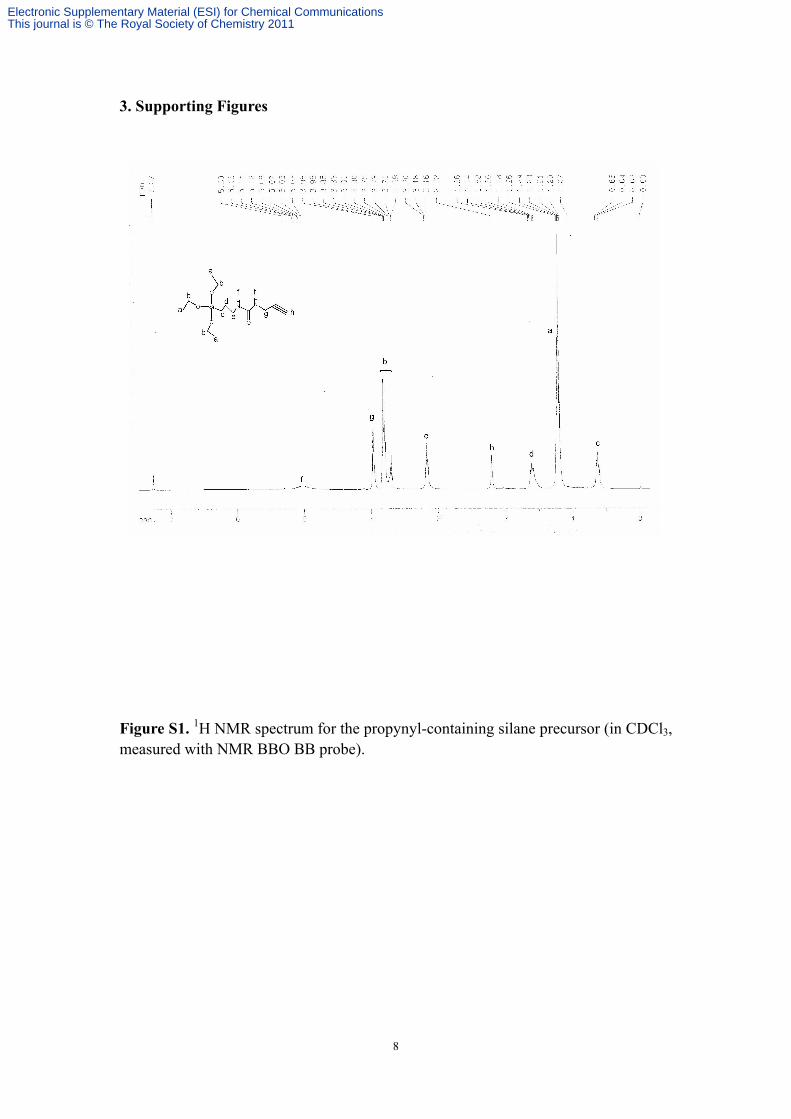
pale solid. Yield: 0.6 g, 50%. 1H NMR(400MHz, CDCl3), δ: 0.62-0.66 (m, 2H), 1.20-1.26 (m,
9H), 1.58-1.66 (m, 2H), 2.22 (m, 1H), 3.16-3.20 (m, 2H), 3.69-3.85 (m, 6H), 3.98 (m, 2H).
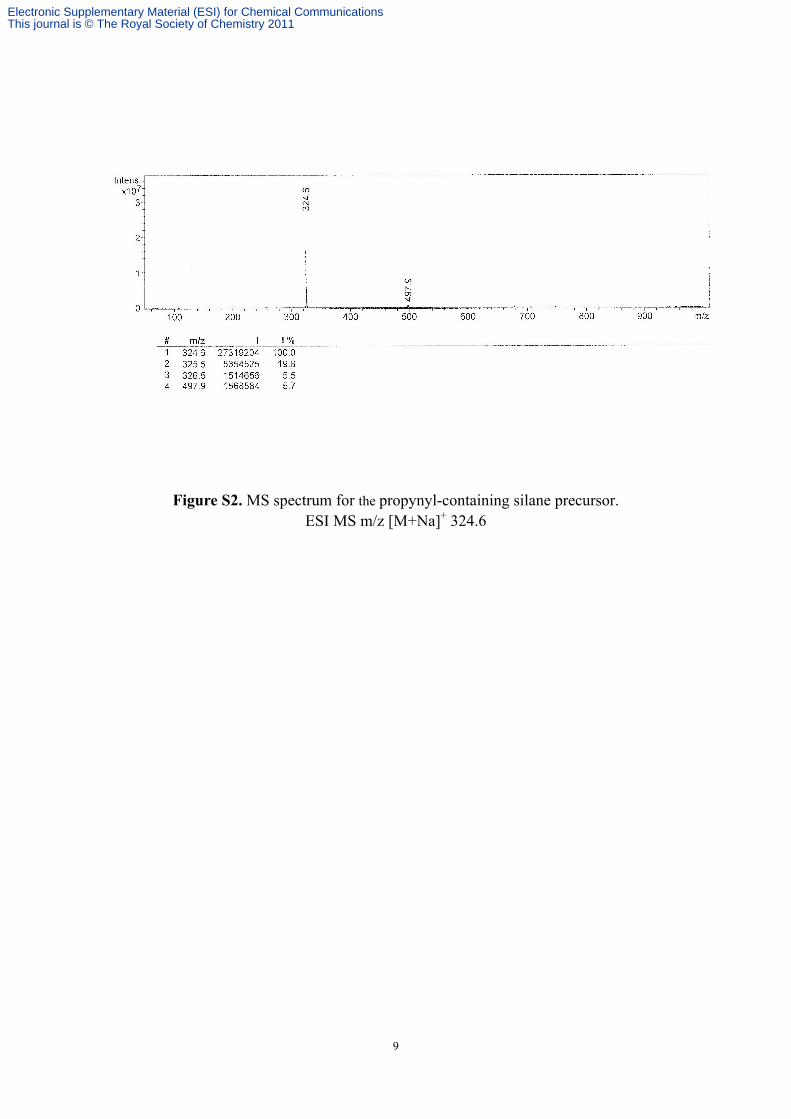
ESI MS m/z [M+Na]+ 324.6.
Synthesis of the mercaptopropyl-functionalized mesoporous silica nanoparticle
(Thiol-MSN). First, n-cetyltrimethylammonium bromide (CTAB, 1.0 g, 2.74 mmol) was
dissolved in 480 mL of deionized water. NaOH (aq) (2.0 M, 3.50 mL) was added to the
solution, and then the solution was heated to 80 C. Tetraethoxysilane (TEOS, 5.0 mL, 22.4
mmol) was first introduced dropwise to the surfactant solution, followed by the dropwise
addition of 3-mercaptopropyltrimethoxysilane (MPS) (1.28 ml, 6.76 mmol). After 2 h of
stirring, silica nanoparticles were formed. The solid product was filtered, washed with
deionized water and methanol, and dried in a vacuum.
Synthesis of the β-CD-covered Thiol-MSN (Thiol-MSN-CD). The mono-6-azido-6-deoxy-
β-cyclodextrin (β-CD-N3) was synthesized as previous reported (M. Xu, S. Wu, F. Zeng, C.
Yu, Langmuir 2010, 26, 4529–4534). The synthesis procedures were briefly described as
follows: first mono-6-O-(p-tolylsulfonyl)-β-cyclodextrin (6-TSO-β-CD) was synthesized
through the reaction of β-cyclodextrin with p-toluenesulfonyl chloride. Then
mono-6-(p-tolylsulfonyl)-β-CD was reacted with sodium azide to offer the β-CD-N3.
Electronic Supplementary Material (ESI) for Chemical CommunicationsThis journal is © The Royal Society of Chemistry 2011
4
The propynyl-containing silica particles (Thio-MSN-propyne with template) were
prepared as follows: the as-made Thiol-MSN (with template CTAB inside mesoporous
channels, 1.5 g) was dispersed in 150 mL of anhydrous toluene. This suspension was
sonicated for 30 min and then placed into an oil bath heated to 120 C. Afterwards the
solution of the propynyl-containing silane precursor (0.3 g, 0.96 mmol) in 6 mL of anhydrous
toluene was added dropwise to the suspension with stirring vigorously under nitrogen. The
suspension was refluxed for 6 h and cooled to room temperature. These functionalized silica
nanoparticles were filtered, and washed extensively with anhydrous toluene and methanol.
The resulting propynyl-containing silica nanoparticles (Thio-MSN-propyne with template)
were dried under high vacuum to remove the remaining solvent.
To remove the surfactant template, silica nanoparticles (Thio-MSN-propyne with
template, 1.4 g) was refluxed for 24 h in a solution of 9.00 mL of HCl (37.4%) and 140.00
mL of methanol. The particles were recovered by centrifugation at 10000 rpm for 20 min.
These particles were redispersed in deionized water for several times and in methanol for
several times and centrifuged. The resulting surfactant-removed Thiol-MSN-propyne material
was dried under high vacuum to remove the remaining solvent in the mesopores.
The “click chemistry” reaction of the propynyl-containing silica particles: the dried
propynyl-containing silica particles (Thio-MSN-propyne with CTAB removed, 0.5 g) were
dispersed in 30 mL of methanol and the mixture was sonicated for 30 min, and then the
solution of mono-6-azido-6-deoxy-β-cyclodextrin (0.87 g, 0.75 mmol, excessive amount) in
28 mL deionized water, sodium ascorbate (0.03 g, 0.15 mmol, dissolved in 1 mL water),
CuSO4•5H2O (0.019 g, 0.075 mmol, dissolved in 1 mL water) were added. After stirring for
Electronic Supplementary Material (ESI) for Chemical CommunicationsThis journal is © The Royal Society of Chemistry 2011
5
40 h at 40 C, the obtained materials were recovered by centrifugation at 10000 rpm for 20
min, washed with deionized water for several times, and 10% EDTANa4 for three times. The
resulting nanoparticles (Thio-MSN-CD) were dried under high vacuum.
Conversion of the thio moieties of Thiol-MSN-CD into OPTA groups (OPTA-MSN-CD,
the -CD/MSN sensor) and those of Thio-MSN-propyne into OPTA groups
(OPTA-MSN-propyne, the control sample). The mercaptopropyl functionality was then
converted to the amine-sensitive OPTA group by reacting the Thiol-MSN-CD (0.5 g) or the
Thio-MSN-propyne (0.5 g) with o-phthalaldehyde (OPA, 0.277 g, 2.06 mmol) in 40 mL of
methanol for 12 h. After centrifugation, the resulting material was thoroughly washed with
methanol and dried under vacuum, finally the -CD/MSN Sensor --- OPTA-MSN-CD and the
control sample --- OPTA-MSN-propyne were obtained.
Measurements. 1H NMR spectra were recorded on a Bruker Avance 400 MHz NMR
spectrometer. UV-vis spectra were recorded on a Hitachi U-3010 UV-vis spectrophotometer.
Fluorescence spectra were recorded on a Hitachi F-4600 fluorescence spectrophotometer.
Mass spectra were obtained through a Bruker Esquire HCT Plus mass spectrometer. Powder
XRD diffraction data were collected on a X’Pert PRO X-ray diffractometer using Cu Kα
radiation. Nitrogen adsorption and desorption isotherm, surface area and median pore
diameter were measured using a Micromeritics ASAP2020 sorptometer. Transmission
electron microscopy (TEM) images were gained using a JEM-2010HR transmission electron
microscopy (Japan). FT-IR spectra were measured using a MAGNA 760 (USA, Nicolet
Electronic Supplementary Material (ESI) for Chemical CommunicationsThis journal is © The Royal Society of Chemistry 2011
6
Instrument). Thermogravimetic analysis (TGA) were conducted by using TG209F1 thermal
analyzer, the samples were heated from 25 C to 900 C with a heating rate of 10 C per min
under nitrogen. The particle size and distribution was determined by dynamic light scattering
(DLS) on a Malvern Nano-ZS90 particle size analyzer.
The detection measurements were conducted as follows:
The pH 7.4 PBS buffer (10 mM) solution was bubbled with nitrogen for 15 min. The
nanoparticles (dry particles, the -CD/MSN sensor --- OPTA-MSN-CD and the control
sample --- OPTA-MSN-propyne) were introduced into a pH 7.4 PBS buffer (10 mM) solution,
and sonicated for 10 min, then dopamine (various amounts, or other substances) was added at
25 C, the particles’ final concentration was 1 mg/mL. After 20 min of mixing under nitrogen,
the fluorescence of the particle suspension was recorded.
For the time-scan measurement of the fluorescence intensity, the measurement was
conducted immediately after the amines were added into the sensor suspension.
Electronic Supplementary Material (ESI) for Chemical CommunicationsThis journal is © The Royal Society of Chemistry 2011
7
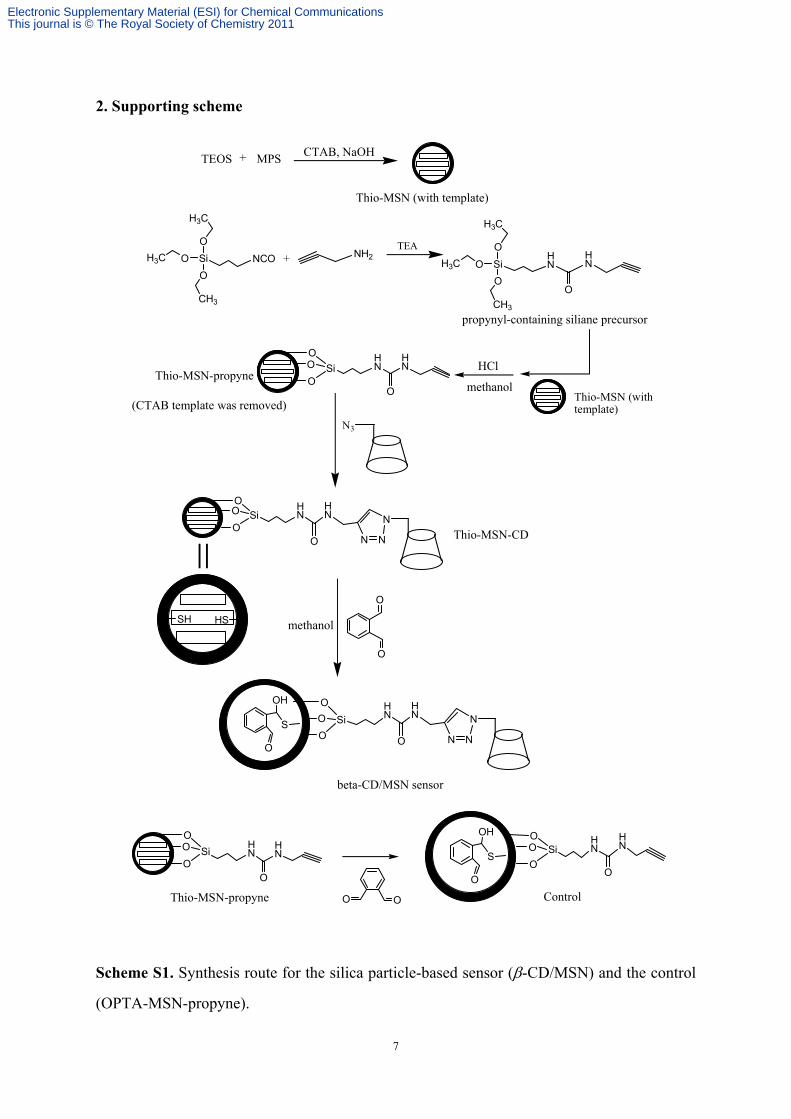
2. Supporting scheme
Scheme S1. Synthesis route for the silica particle-based sensor (-CD/MSN) and the control
(OPTA-MSN-propyne).
H3C
O
Si
O
CH3
OH3C NCO NH2TEA
+
O
O Si
O HN
HN
O
N3
O
O Si
O HN
HN
O N N
N
HSSH
O
O
O
O Si
O HN
HN
O N N
NS
O
OH
propynyl-containing siliane precursor
=methanol
TEOS + MPSCTAB, NaOH
Thio-MSN (with template)
Thio-MSN (with template)
Thio-MSN-propyne
Thio-MSN-CD
beta-CD/MSN sensor
O
O Si
OHN
HN
O
O O
O
O SiO H
NHN
O
S
O
OH
ControlThio-MSN-propyne
(CTAB template was removed)
H3C
O
Si
O
CH3
OH3CHN
HN
O
HCl
methanol
Electronic Supplementary Material (ESI) for Chemical CommunicationsThis journal is © The Royal Society of Chemistry 2011
8
3. Supporting Figures
Figure S1. 1H NMR spectrum for the propynyl-containing silane precursor (in CDCl3, measured with NMR BBO BB probe).
Electronic Supplementary Material (ESI) for Chemical CommunicationsThis journal is © The Royal Society of Chemistry 2011
9
Figure S2. MS spectrum for the propynyl-containing silane precursor. ESI MS m/z [M+Na]+ 324.6
Electronic Supplementary Material (ESI) for Chemical CommunicationsThis journal is © The Royal Society of Chemistry 2011
10
4000 3200 2400 1600 8000
20
40
60
80
100
Tra
nsm
ittan
ce (
%)
Wavenumber (cm-1)
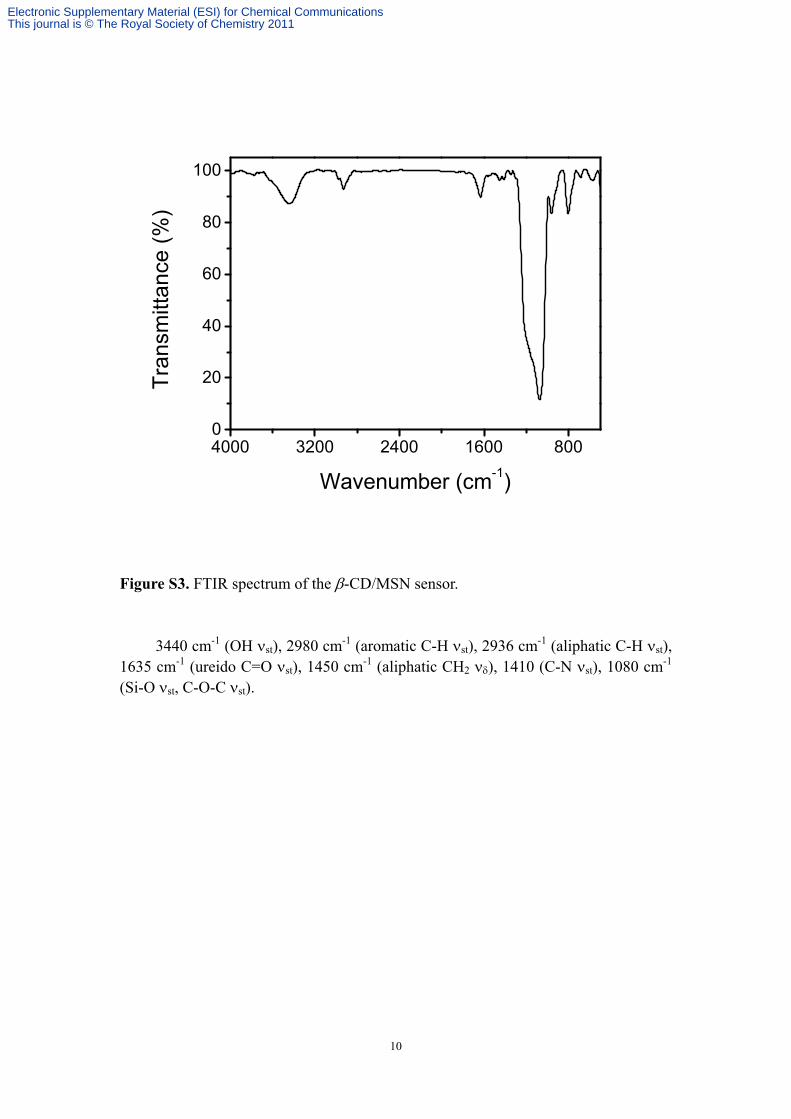
Figure S3. FTIR spectrum of the -CD/MSN sensor.
3440 cm-1 (OH st), 2980 cm-1 (aromatic C-H st), 2936 cm-1 (aliphatic C-H st), 1635 cm-1 (ureido C=O st), 1450 cm-1 (aliphatic CH2 ), 1410 (C-N st), 1080 cm-1 (Si-O st, C-O-C st).
Electronic Supplementary Material (ESI) for Chemical CommunicationsThis journal is © The Royal Society of Chemistry 2011
11
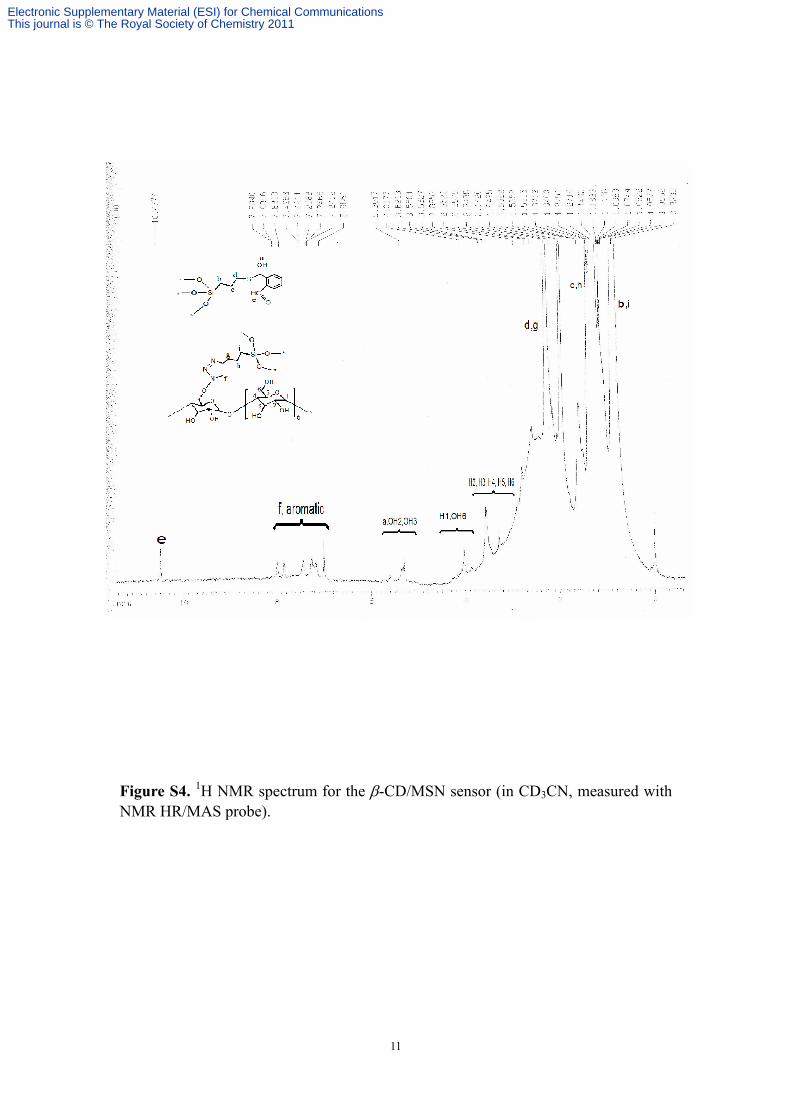
Figure S4. 1H NMR spectrum for the -CD/MSN sensor (in CD3CN, measured with NMR HR/MAS probe).
Electronic Supplementary Material (ESI) for Chemical CommunicationsThis journal is © The Royal Society of Chemistry 2011
12
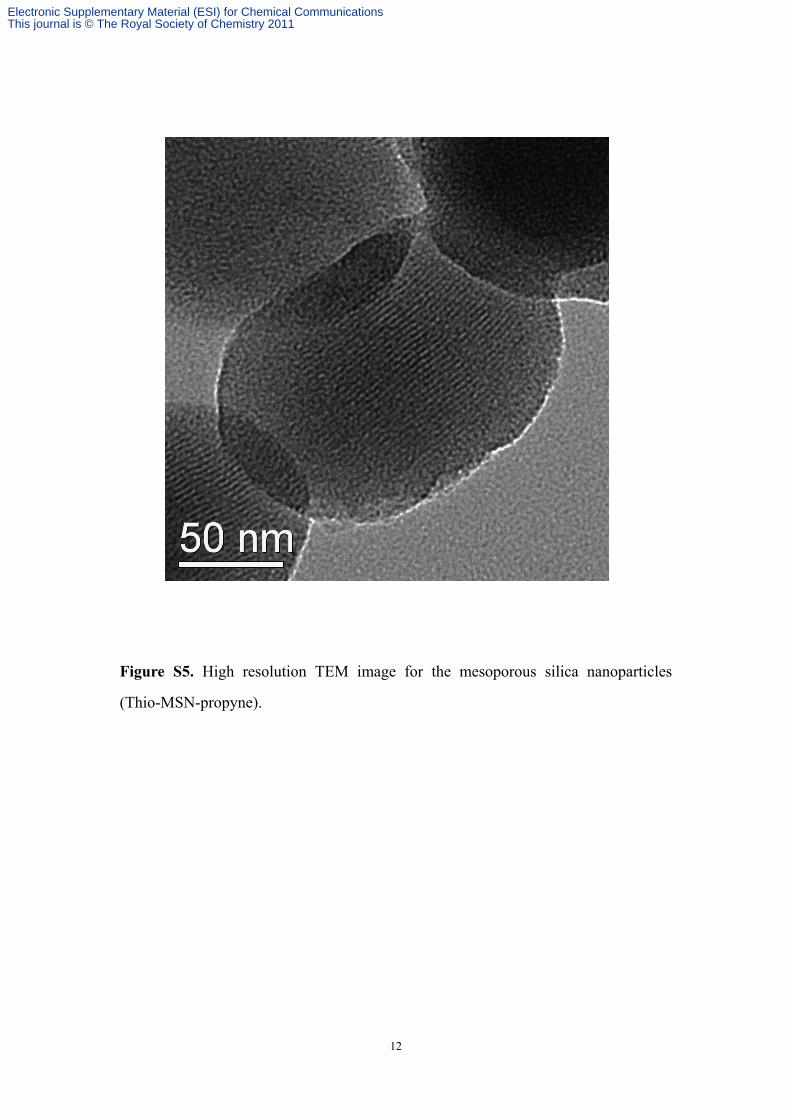
Figure S5. High resolution TEM image for the mesoporous silica nanoparticles
(Thio-MSN-propyne).
Electronic Supplementary Material (ESI) for Chemical CommunicationsThis journal is © The Royal Society of Chemistry 2011
13
0.0 0.2 0.4 0.6 0.8 1.0 1.2
0
50
100
150
200
250
300
Pore Diameter /nm
Po
re v
ol./
cm
3g
-1
Vo
l. ads/c
m3g
-1(S
TP
)
Relative Pressure (P/P0)
N2 Adsorption
N2 Desorption
0 30 60 90
0.00
0.02
0.04
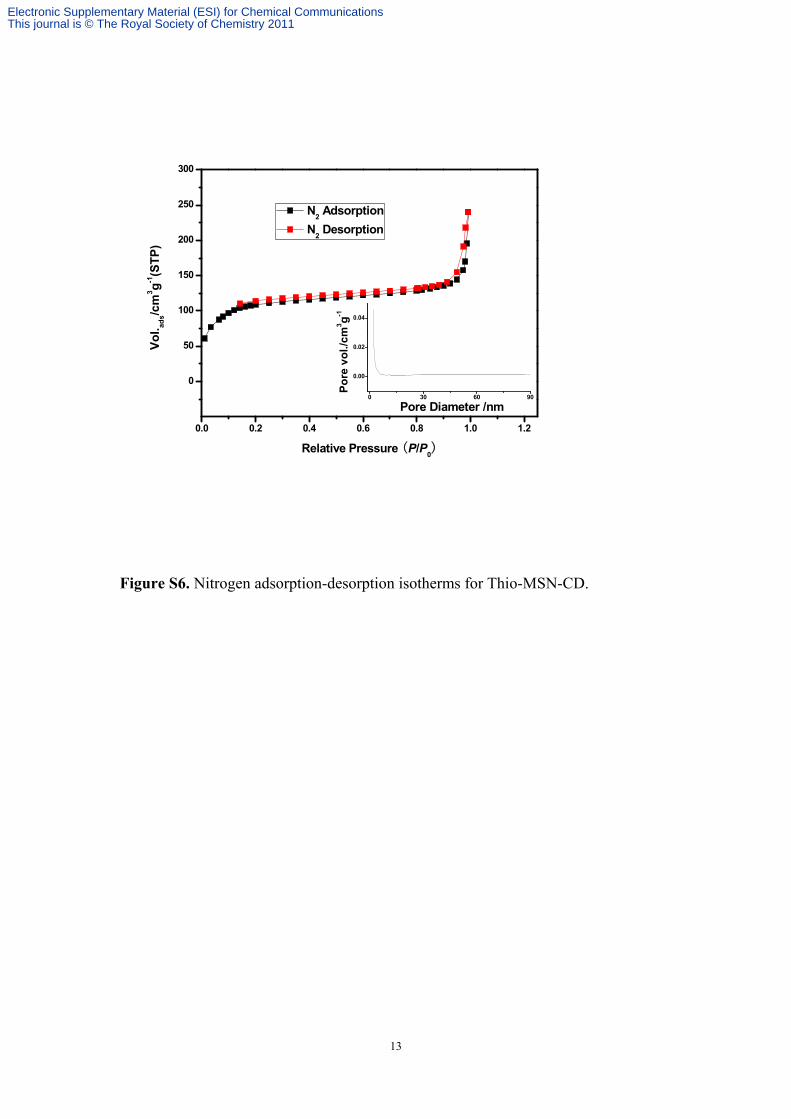
Figure S6. Nitrogen adsorption-desorption isotherms for Thio-MSN-CD.
Electronic Supplementary Material (ESI) for Chemical CommunicationsThis journal is © The Royal Society of Chemistry 2011
14
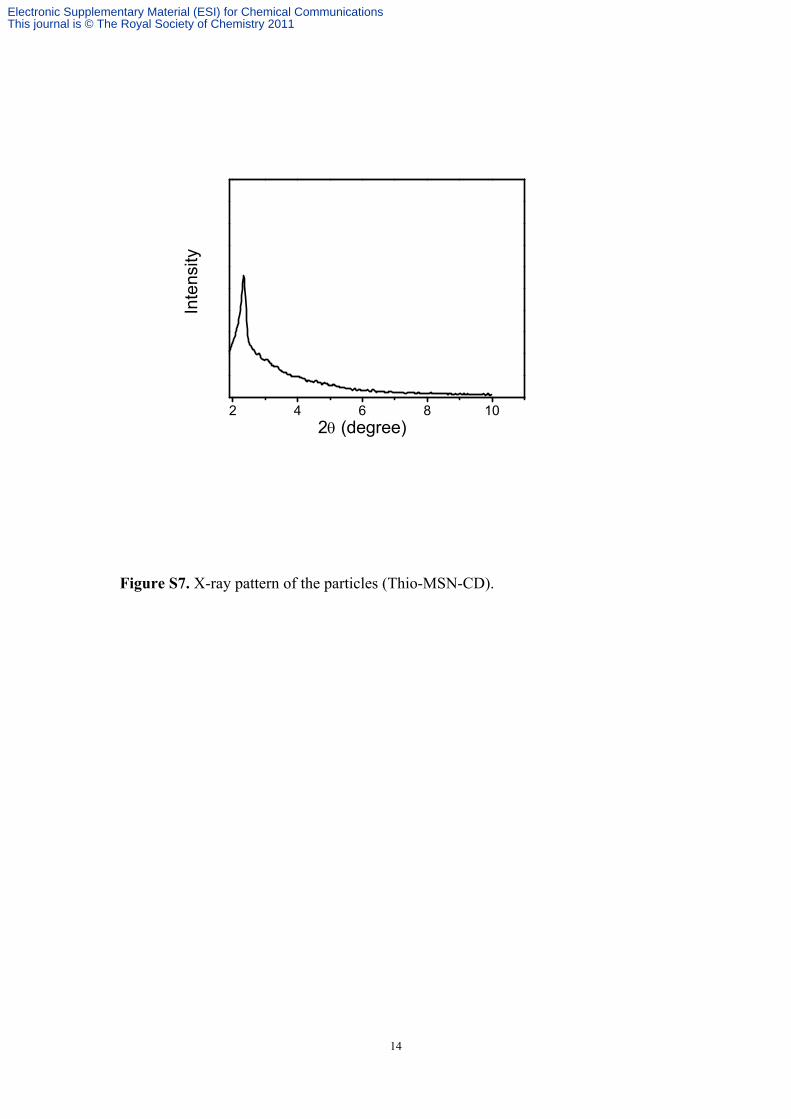
Figure S7. X-ray pattern of the particles (Thio-MSN-CD).
2 4 6 8 10
Inte
nsity
2 (degree)
Electronic Supplementary Material (ESI) for Chemical CommunicationsThis journal is © The Royal Society of Chemistry 2011
15
100 1000
0
5
10
15
20
25
Inte
nsity
/%
diameter /nm
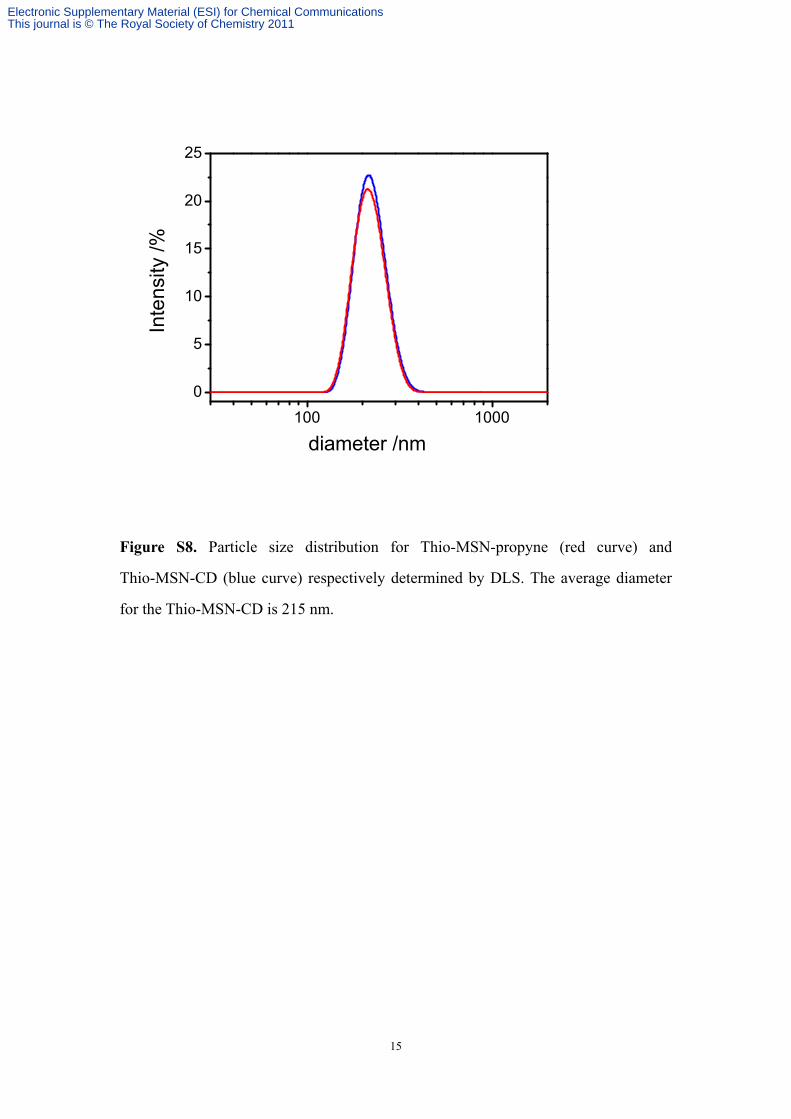
Figure S8. Particle size distribution for Thio-MSN-propyne (red curve) and
Thio-MSN-CD (blue curve) respectively determined by DLS. The average diameter
for the Thio-MSN-CD is 215 nm.
Electronic Supplementary Material (ESI) for Chemical CommunicationsThis journal is © The Royal Society of Chemistry 2011
16
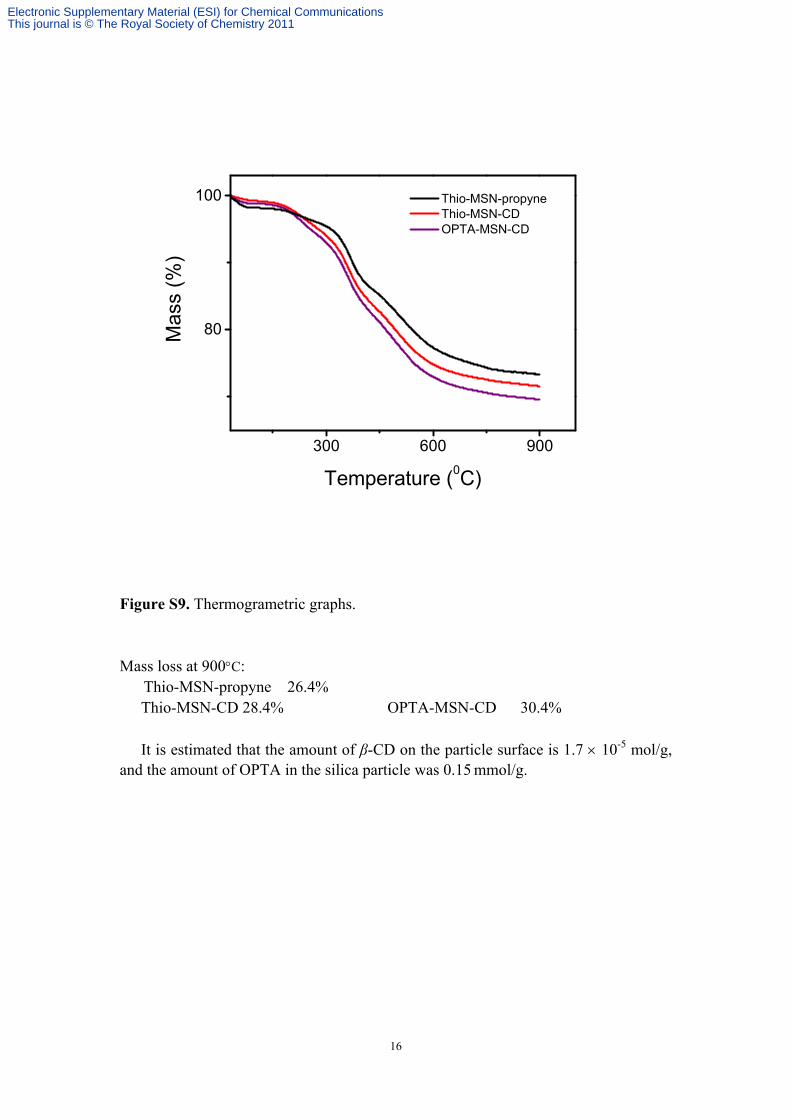
Figure S9. Thermogrametric graphs. Mass loss at 900C: Thio-MSN-propyne 26.4%
Thio-MSN-CD 28.4% OPTA-MSN-CD 30.4% It is estimated that the amount of β-CD on the particle surface is 1.7 10-5 mol/g,
and the amount of OPTA in the silica particle was 0.15 mmol/g.
300 600 900
80
100 Thio-MSN-propyne Thio-MSN-CD OPTA-MSN-CD
M
ass
(%)
Temperature (0C)
Electronic Supplementary Material (ESI) for Chemical CommunicationsThis journal is © The Royal Society of Chemistry 2011
17
300 400 500 600 700 8000.0
0.5
1.0
1.5
2.0
Thio-MSN-CD OPTA-MSN-CD
Abs
orba
nce
(nm)
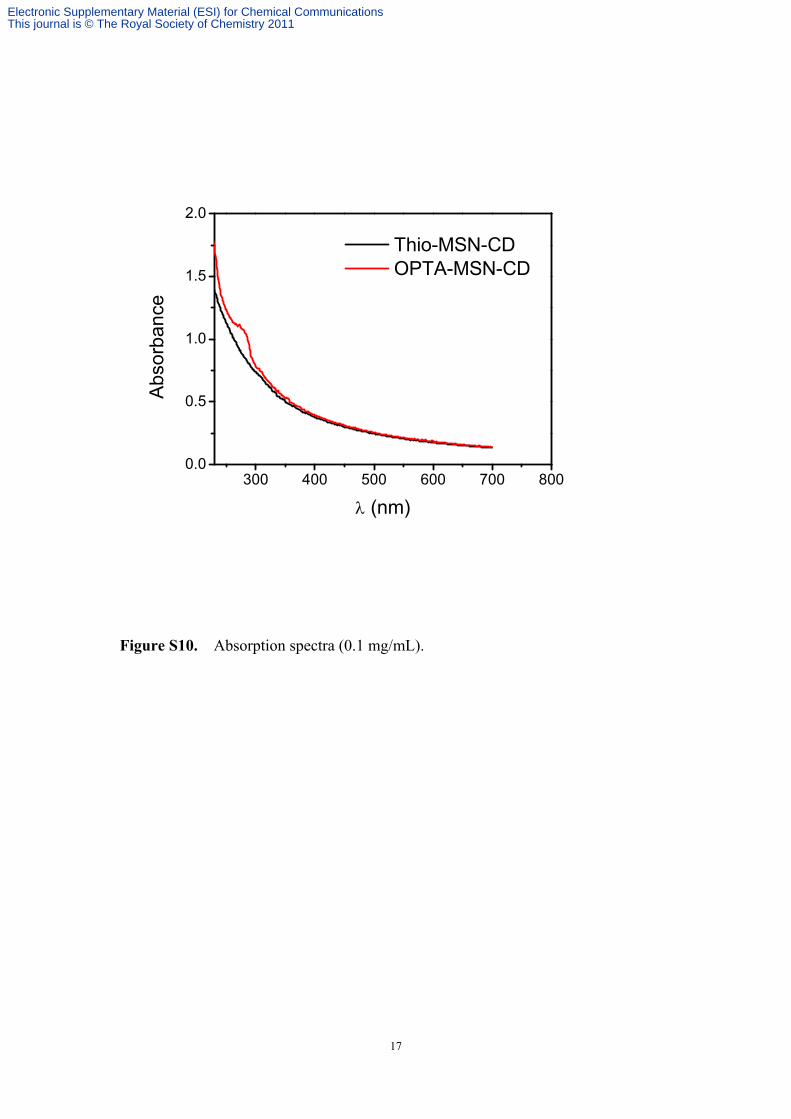
Figure S10. Absorption spectra (0.1 mg/mL).
Electronic Supplementary Material (ESI) for Chemical CommunicationsThis journal is © The Royal Society of Chemistry 2011
18
300 400 500 6000
100
200
300
400
500
emission excitation
Inte
nsity
(a.
u.)
(nm)
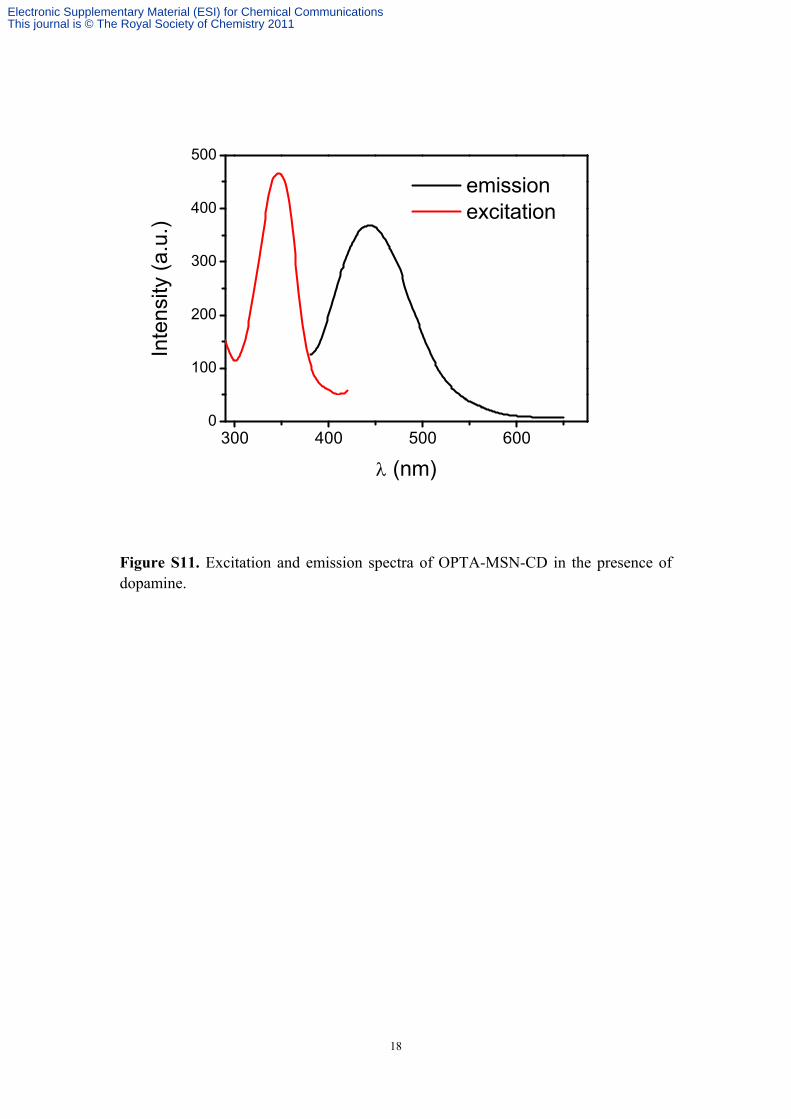
Figure S11. Excitation and emission spectra of OPTA-MSN-CD in the presence of dopamine.
Electronic Supplementary Material (ESI) for Chemical CommunicationsThis journal is © The Royal Society of Chemistry 2011
19
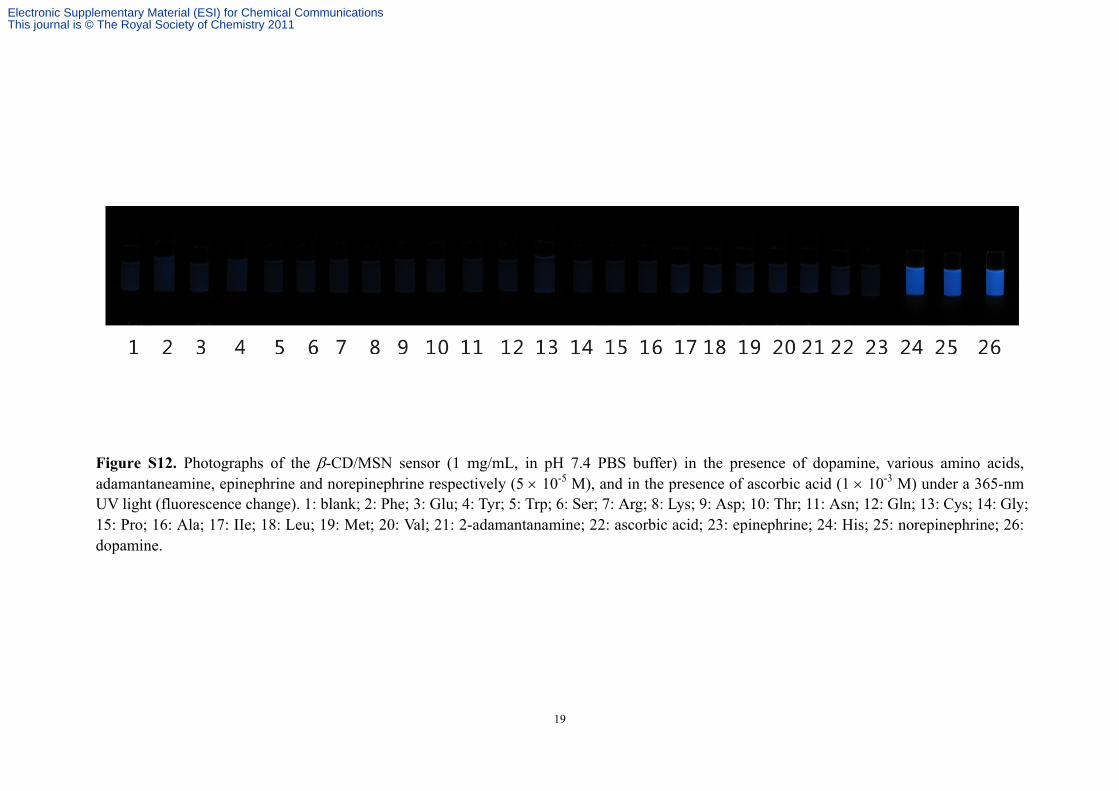
Figure S12. Photographs of the -CD/MSN sensor (1 mg/mL, in pH 7.4 PBS buffer) in the presence of dopamine, various amino acids, adamantaneamine, epinephrine and norepinephrine respectively (5 10-5 M), and in the presence of ascorbic acid (1 10-3 M) under a 365-nm UV light (fluorescence change). 1: blank; 2: Phe; 3: Glu; 4: Tyr; 5: Trp; 6: Ser; 7: Arg; 8: Lys; 9: Asp; 10: Thr; 11: Asn; 12: Gln; 13: Cys; 14: Gly; 15: Pro; 16: Ala; 17: IIe; 18: Leu; 19: Met; 20: Val; 21: 2-adamantanamine; 22: ascorbic acid; 23: epinephrine; 24: His; 25: norepinephrine; 26: dopamine.
Electronic Supplementary Material (ESI) for Chemical CommunicationsThis journal is © The Royal Society of Chemistry 2011
20
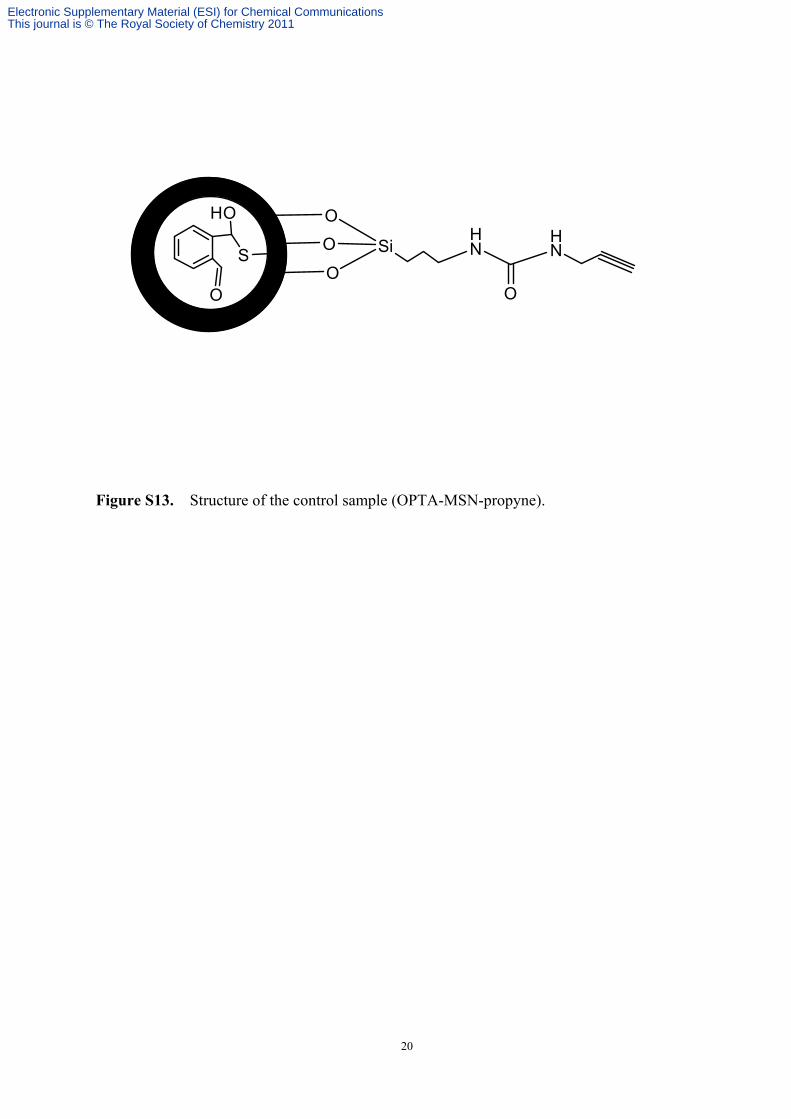
Figure S13. Structure of the control sample (OPTA-MSN-propyne).
O
O Si
OHN
HN
O
S
O
HO
Electronic Supplementary Material (ESI) for Chemical CommunicationsThis journal is © The Royal Society of Chemistry 2011
21
100
200
300
400
500
8
I 440
1 2 3 4 5 6 7
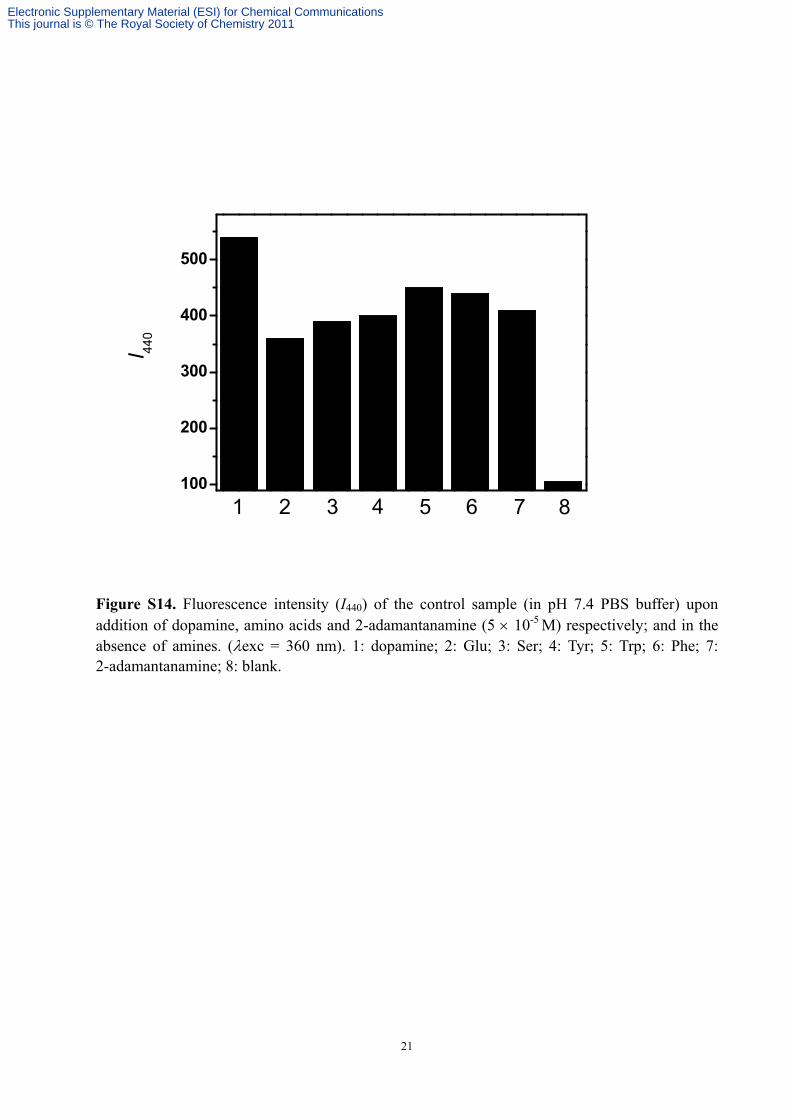
Figure S14. Fluorescence intensity (I440) of the control sample (in pH 7.4 PBS buffer) upon addition of dopamine, amino acids and 2-adamantanamine (5 10-5 M) respectively; and in the absence of amines. (exc = 360 nm). 1: dopamine; 2: Glu; 3: Ser; 4: Tyr; 5: Trp; 6: Phe; 7: 2-adamantanamine; 8: blank.
Electronic Supplementary Material (ESI) for Chemical CommunicationsThis journal is © The Royal Society of Chemistry 2011

22
Figure S15. Fluorescence intensity (I440) as a function of time for the blank -CD/MSN sensor
(1 mg/mL, in pH 7.4 PBS buffer); the -CD/MSN sensor (1 mg/mL, in pH 7.4 PBS buffer) in the
presence of dopamine, several amino acids and 2-adamantanamine (5 10-5 M) respectively.
(The time-scan measurement of the fluorescence intensity was conducted immediately after the
amines were added into the sensor suspension)
0 400 800 1200
150
300
450
I
at 4
40 n
m
Time (s)
dopamine glutamic acid phenylanaline serine tyrosine tryptophan adamantaneamine blank
Electronic Supplementary Material (ESI) for Chemical CommunicationsThis journal is © The Royal Society of Chemistry 2011
23
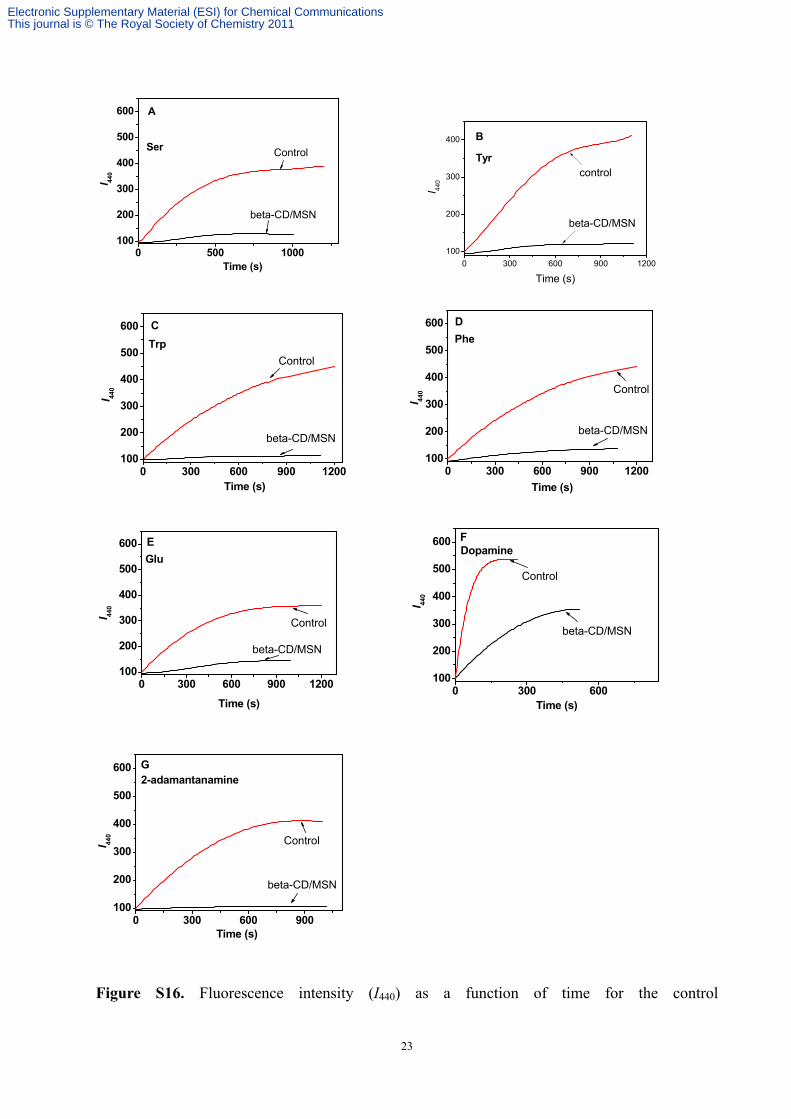
Figure S16. Fluorescence intensity (I440) as a function of time for the control
0 500 1000100
200
300
400
500
600I 44
0
Time (s)
A
Ser Control
beta-CD/MSN
0 300 600 900 1200100
200
300
400
500
600
I 44
0
Time (s)
C
Trp
Control
beta-CD/MSN
0 300 600 900 1200100
200
300
400
500
600
I 44
0
Time (s)
D
Phe
Control
beta-CD/MSN
0 300 600 900 1200100
200
300
400
500
600
I 44
0
Time (s)
E
Glu
Control
beta-CD/MSN
0 300 600100
200
300
400
500
600
I 440
Time (s)
FDopamine
Control
beta-CD/MSN
0 300 600 900100
200
300
400
500
6002-adamantanamine
I 44
0
Time (s)
G
Control
beta-CD/MSN
0 300 600 900 1200
100
200
300
400
I 440
Time (s)
B
Tyrcontrol
beta-CD/MSN
Electronic Supplementary Material (ESI) for Chemical CommunicationsThis journal is © The Royal Society of Chemistry 2011
24
(OPTA-MSN-propyne, red curves) and the -CD/MSN sensor (OPTA-MSN-CD, black curves)
in the presence of dopamine, several amino acids and 2-adamantanamine (5 10-5 M)
respectively. A: Ser; B: Tyr; C: Trp; D: Phe; E: Glu; F: dopamine; G: 2-adamantanamine. The
time-scan measurement of the fluorescence intensity was conducted immediately after the
amines were added into the sensor suspension.
Electronic Supplementary Material (ESI) for Chemical CommunicationsThis journal is © The Royal Society of Chemistry 2011
25
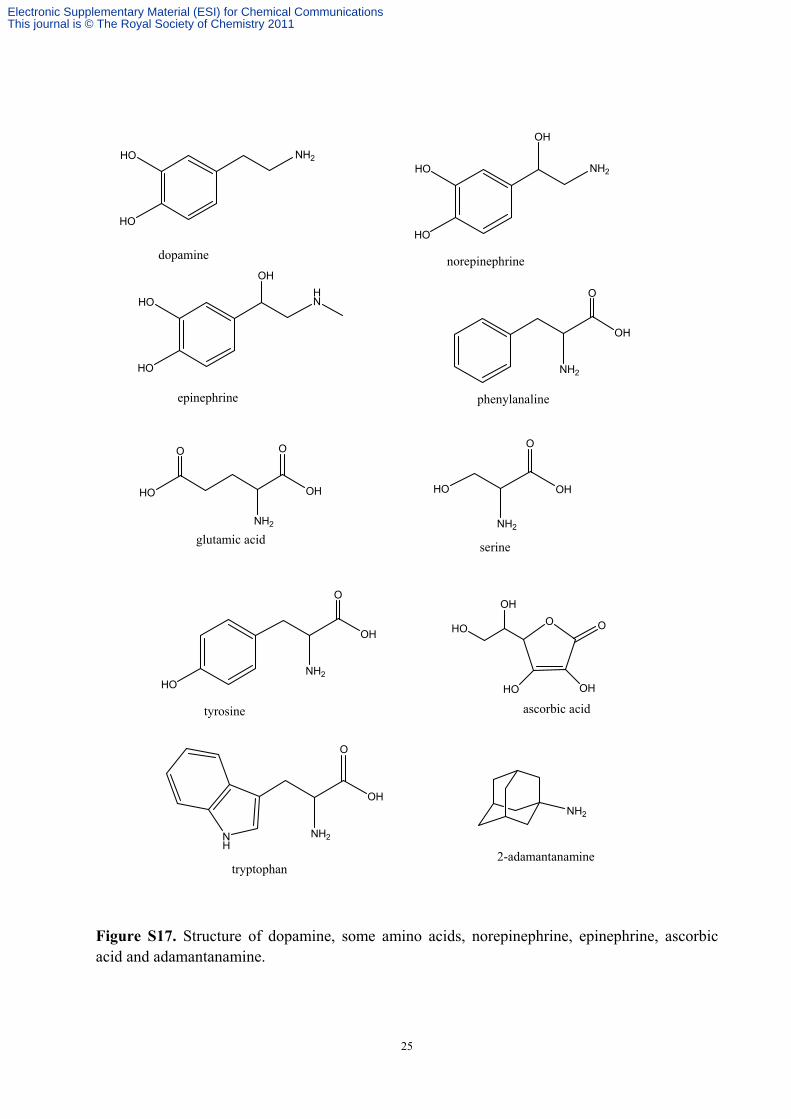
Figure S17. Structure of dopamine, some amino acids, norepinephrine, epinephrine, ascorbic acid and adamantanamine.
HO
HO
NH2
dopamine
HO
HO
NH2
norepinephrine
HO
HO
HN
OH
epinephrine
OH
O
NH2
phenylanaline
NH2
HO
tyrosine
HO OH
O
OH
O
NH2
serine
NH2
2-adamantanamine
O
HO OH
OHO
OH
ascorbic acid
NH
OH
O
NH2
tryptophan
OH
HO OH
O O
NH2
glutamic acid
Electronic Supplementary Material (ESI) for Chemical CommunicationsThis journal is © The Royal Society of Chemistry 2011
26
1 2 3 4 50
150
300
450
I 440
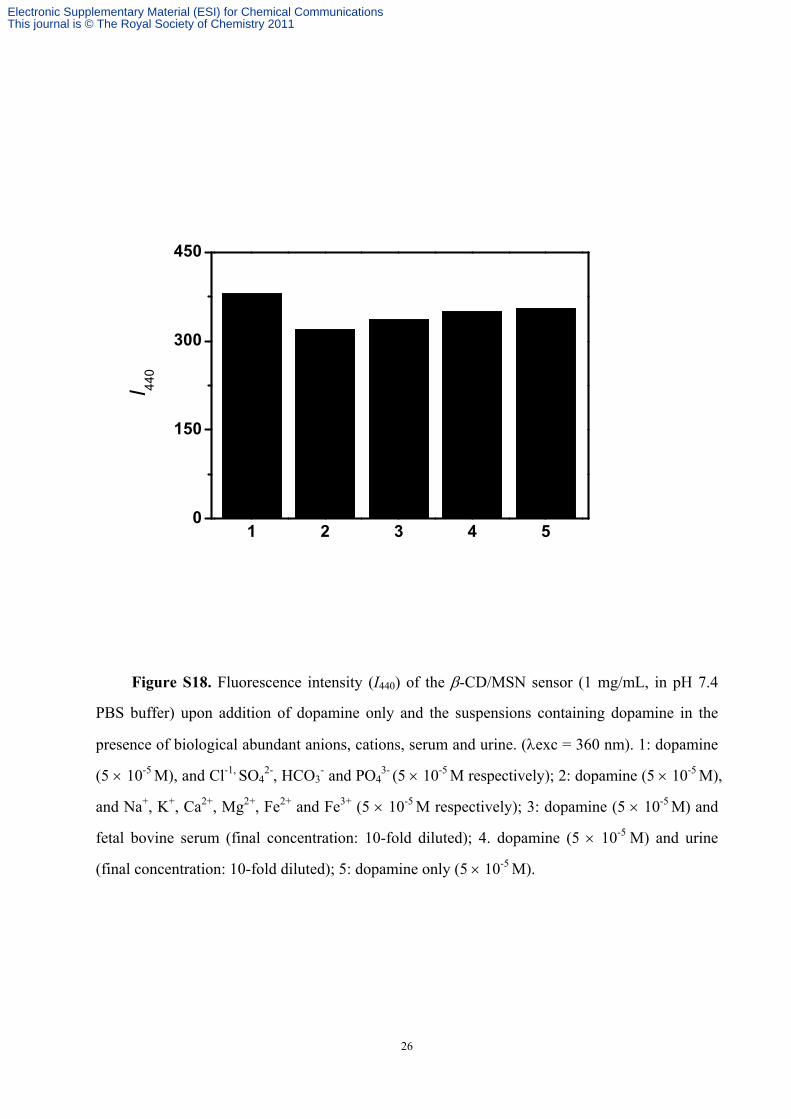
Figure S18. Fluorescence intensity (I440) of the -CD/MSN sensor (1 mg/mL, in pH 7.4
PBS buffer) upon addition of dopamine only and the suspensions containing dopamine in the
presence of biological abundant anions, cations, serum and urine. (exc = 360 nm). 1: dopamine
(5 10-5 M), and Cl-1, SO42-, HCO3
- and PO43- (5 10-5 M respectively); 2: dopamine (5 10-5 M),
and Na+, K+, Ca2+, Mg2+, Fe2+ and Fe3+ (5 10-5 M respectively); 3: dopamine (5 10-5 M) and
fetal bovine serum (final concentration: 10-fold diluted); 4. dopamine (5 10-5 M) and urine
(final concentration: 10-fold diluted); 5: dopamine only (5 10-5 M).
Electronic Supplementary Material (ESI) for Chemical CommunicationsThis journal is © The Royal Society of Chemistry 2011
27
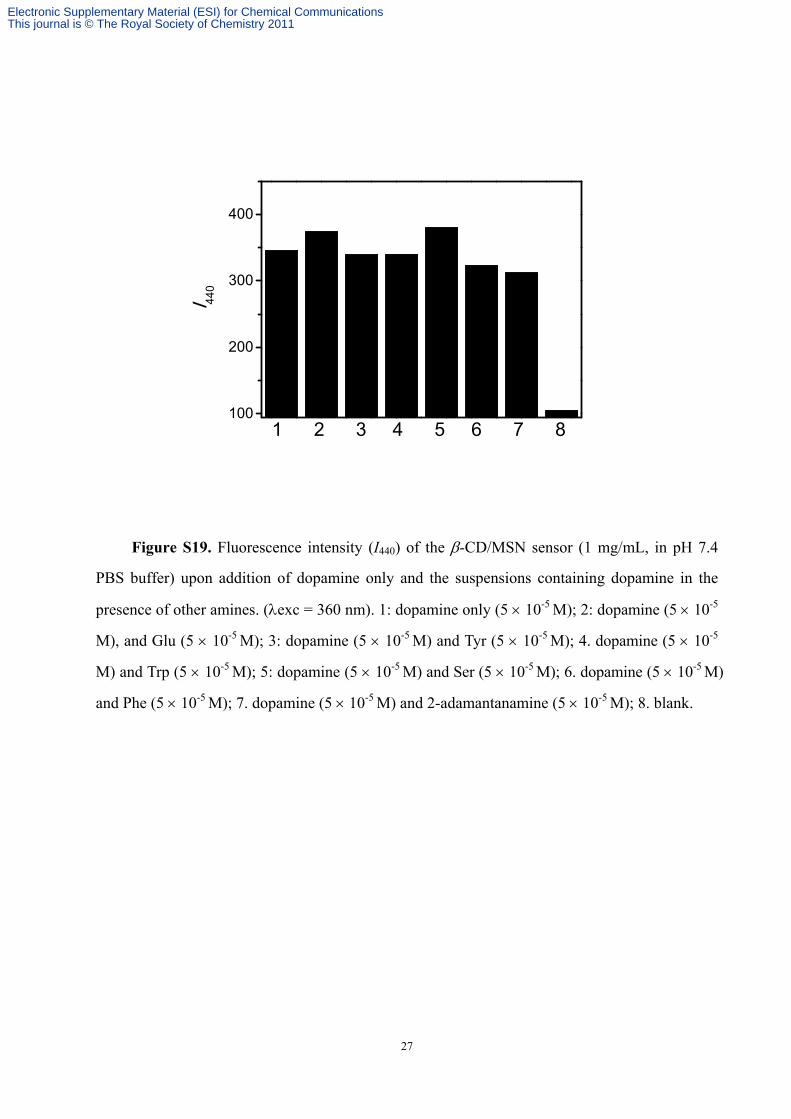
Figure S19. Fluorescence intensity (I440) of the -CD/MSN sensor (1 mg/mL, in pH 7.4
PBS buffer) upon addition of dopamine only and the suspensions containing dopamine in the
presence of other amines. (exc = 360 nm). 1: dopamine only (5 10-5 M); 2: dopamine (5 10-5
M), and Glu (5 10-5 M); 3: dopamine (5 10-5 M) and Tyr (5 10-5 M); 4. dopamine (5 10-5
M) and Trp (5 10-5 M); 5: dopamine (5 10-5 M) and Ser (5 10-5 M); 6. dopamine (5 10-5 M)
and Phe (5 10-5 M); 7. dopamine (5 10-5 M) and 2-adamantanamine (5 10-5 M); 8. blank.
100
200
300
400I 44
0
1 2 3 4 5 6 7 8
Electronic Supplementary Material (ESI) for Chemical CommunicationsThis journal is © The Royal Society of Chemistry 2011
28
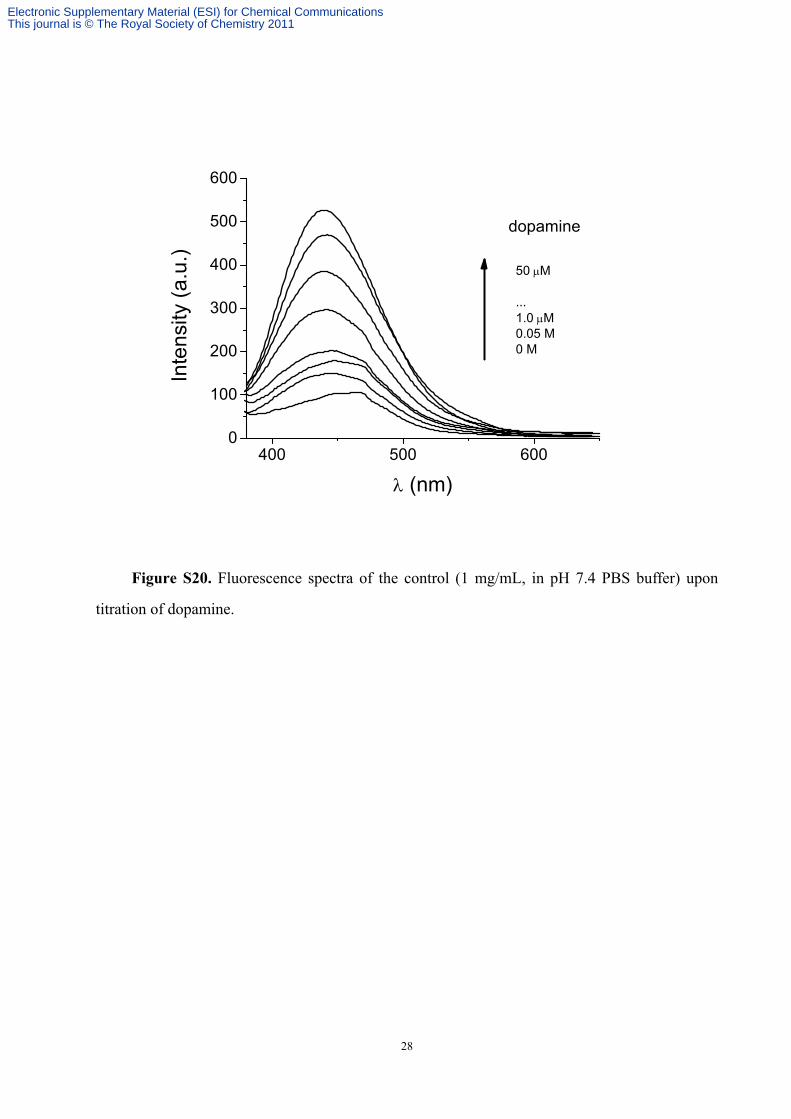
Figure S20. Fluorescence spectra of the control (1 mg/mL, in pH 7.4 PBS buffer) upon
titration of dopamine.
400 500 6000
100
200
300
400
500
600In
ten
sity
(a
.u.)
(nm)
dopamine
50 M
...1.0 M0.05 M0 M
Electronic Supplementary Material (ESI) for Chemical CommunicationsThis journal is © The Royal Society of Chemistry 2011
29
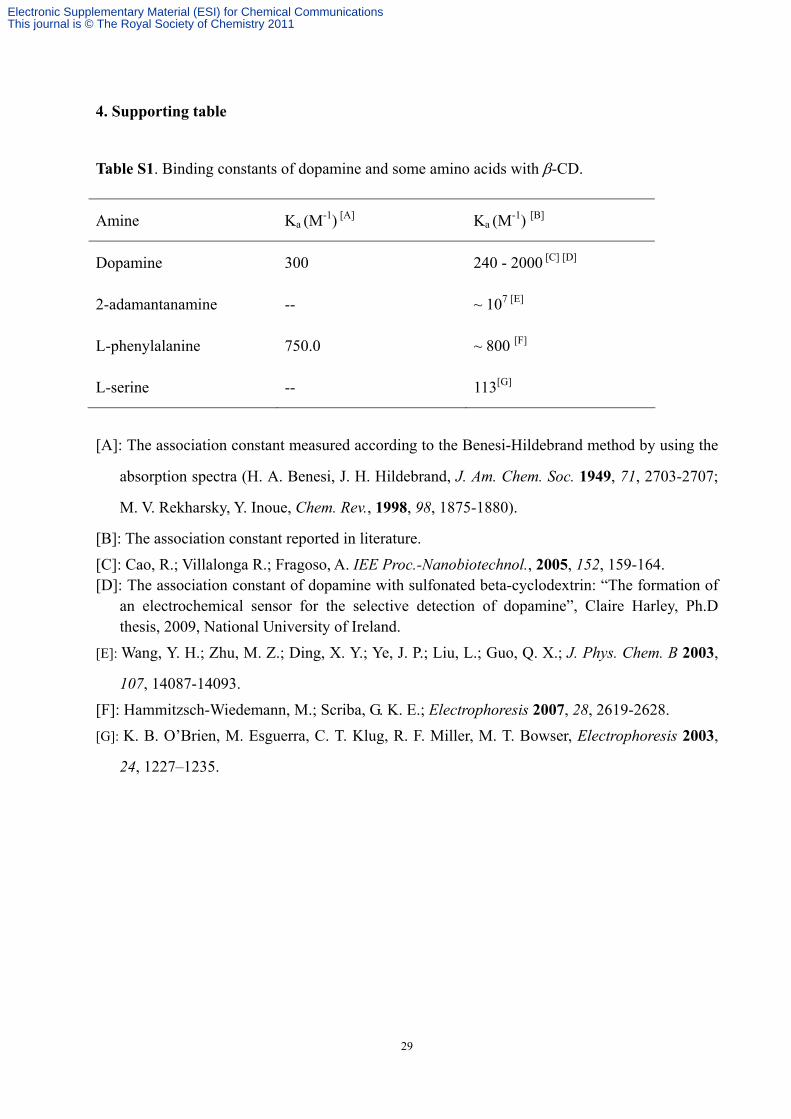
4. Supporting table
Table S1. Binding constants of dopamine and some amino acids with -CD.
Amine Ka (M-1) [A] Ka (M
-1) [B]
Dopamine 300 240 - 2000 [C] [D]
2-adamantanamine -- ~ 107 [E]
L-phenylalanine 750.0 ~ 800 [F]
L-serine -- 113[G]
[A]: The association constant measured according to the Benesi-Hildebrand method by using the
absorption spectra (H. A. Benesi, J. H. Hildebrand, J. Am. Chem. Soc. 1949, 71, 2703-2707;
M. V. Rekharsky, Y. Inoue, Chem. Rev., 1998, 98, 1875-1880).
[B]: The association constant reported in literature.
[C]: Cao, R.; Villalonga R.; Fragoso, A. IEE Proc.-Nanobiotechnol., 2005, 152, 159-164. [D]: The association constant of dopamine with sulfonated beta-cyclodextrin: “The formation of
an electrochemical sensor for the selective detection of dopamine”, Claire Harley, Ph.D thesis, 2009, National University of Ireland.
[E]: Wang, Y. H.; Zhu, M. Z.; Ding, X. Y.; Ye, J. P.; Liu, L.; Guo, Q. X.; J. Phys. Chem. B 2003,
107, 14087-14093.
[F]: Hammitzsch-Wiedemann, M.; Scriba, G. K. E.; Electrophoresis 2007, 28, 2619-2628.
[G]: K. B. O’Brien, M. Esguerra, C. T. Klug, R. F. Miller, M. T. Bowser, Electrophoresis 2003,
24, 1227–1235.
Electronic Supplementary Material (ESI) for Chemical CommunicationsThis journal is © The Royal Society of Chemistry 2011