
Merlin software Tests - geminisi.com · Reservoir Simulation software Tests ... short synonyms will...
37
Merlin Reservoir Simulation software Tests Western Australia Department of Mines and Petroleum July 2009 Nasser Amirabadi
Transcript of Merlin software Tests - geminisi.com · Reservoir Simulation software Tests ... short synonyms will...

Merlin Reservoir Simulation software
Tests
Western Australia Department of Mines and Petroleum
July 2009
Nasser Amirabadi

2
Acknowledgements
In the process of executing these tests and comparing the results with other softwares, my colleague Behrooz Bizhany Gilan prepared the Petrel peer model and arranged to be run on Eclipse 100. I would like to express my sincere appreciation for his efforts and contribution.

3
1. Introduction ............................................................................................................ 4
2. Description of Test cases ....................................................................................... 4
3. The detail of Test cases .......................................................................................... 5
Case-1(Test-1): Merlintest.mer (merlintest.mer is the input file name ..................... 5
Case-2(Test-2): Merlintest2.mer ................................................................................ 7
Case-3 (Test-3): Merlintest3.mer ............................................................................... 8
Case-4 (Test-4): Merlintest4.mer ............................................................................... 9
Case-5 (Test-5): Merlintest5.mer (Merlin 2006) ..................................................... 10
Case-6 (Test-5): Merlintest5.mer (Merlin 2008) ..................................................... 11
Case-7 (Test-6): Merlintest6.mer (Merlin 2008) ..................................................... 12
Case 8 (Test-7): Merlintest7.mer (Merlin 2008) ...................................................... 14
Case 9 (Test-7): E100 software results .................................................................... 15
Case-10 (Test-8): Merlintest8.mer (Merlin 2008) ................................................... 16
Case-11 (Test-9): Merlintest9.mer (Merlin 2006) ................................................... 18
Case-12 (Test-9): Merlintest9.mer (Merlin 2008) ................................................... 19
Case 13 (Test-9): E100 software results .................................................................. 20
Case-14 (Test 10): Merlintest10.mer (Merlin 2006) ................................................ 22
Case-15 (Test-10): Merlintest10.mer (Merlin 2008) ............................................... 24
Case-16 (Test 10A): Merlintest10A.mer (Merlin 2008) .......................................... 25
Case-17 (Test 10B): Merlintest10B.mer (Merlin 2008 ............................................ 26
Case-18 (Test 10C): Merlintest10C.mer (Merlin 2008) .......................................... 27
Case-19 (Test 10D): Merlintest10D.mer (Merlin 2008) .......................................... 28
Case-20 (Test 10E): Merlintest10E.mer (Merlin 2008) ........................................... 29
Case- 21 (Test 10F): Merlintest10F.mer (Merlin 2008) .......................................... 30
Case-22 (Test 10G): Merlintest10G.mer (Merlin 2008) .......................................... 31
Case-23 (Test 10GR): Merlintest10GR.mer (Merlin 2009) .................................... 32
Case-24 (Test 10H): Merlintest10H.mer (Merlin 2008) .......................................... 33
Case-25 (Test 10D): E100 Software ........................................................................ 34
4. Simulation results ................................................................................................. 36
5. Conclusions and recommendations: .................................................................... 36
6. Production performance plots .............................................................................. 37
4
1. Introduction
Merlin is a reservoir simulation software prepared by Gimini Solutions, Inc.
Resource Branch had it before 2006 but it was never really tested and fully used as a handy tool for assessment of oil and gas resources evaluation. The software is not as complicated as professional famous simulation softwares such as Eclipse but it is a handy tool with some options. It is easy to use by reservoir engineers and likely experienced geoscientists.
The main objective of this study was to check the validity of this program’s
computations. In order to check the performance of the software, a hypotetical model of about 50,000 cells in 8 layers and 36 by 180 grids in X and Y direction was prepared. During this process 10 tests were conducted and 25 cases were designed and run around those tests and the results were analysed. With the simple model in hand, the following concepts and software options
were tested and analysed:
o Conventional vertical well completions, pressure depletion of reservoir with different platau rates by using simulation options and parameters as necessary (cases 1-6).
o The same model was run with one horizontal well (cases 7-9) o The same model was run with two horizontal wells with reduced
production rates (case 10). o The same model with two horizontal oil/gas producer and one
horizontal gas injection well (cases 11 -13). o The same model with two horizontal oil/gas producer and one
horizontal water injection well (cases 14 -16). o Parameters used in solution techniques tab of software were
analysed by rerun of case 10 with different parameters.(cases 17 - 25)
o To check the validity of this software, a similar model with exactly same grid size and orientation was prepared in Petrel and cases 9, 13 and 25 were arranged to be run on Eclipse 100.
2. Description of Test cases
After construction of the model, the first case was designed based on
preliminary runs. The production rate was assigned to the well based on OOIP of the model. Each case was run and the result analysed and based on the results analysis the new case was prepared considering the set goals.
Of course there were some mistakes and delays in designing the initial
cases due to lack of experience in using this software. After runing the first few cases, the required skill was gained and additional tests were designed with more comfort and precision.

5
During these tests three versions of Merlin were used. The first version was
version 2006 that DMP kept from the beginning. During the tests, the software owner, Gimini Solutions, Ltd, was contacted and version 2008 was downloaded and installed. As the tests proceed, a new version of 2009 was received and installed and a few cases were run on the 2009 version. Detail of input files and output results are stored on 3 sub-folders 2006, 2008 and 2009.
NOTE: After case 16 was run an importand issue was noticed by comparison of case 15 and 16. Comparing case 15 and case 16 showed that solution techniques selection has significant effect on simulation performance. For this run the solution technique was changed from IMPES to fully Implicit. The flactuation in gas and water production seen in case 15 was not observed. The gas volume production reduced significantly and the ultimate recovery reduced from 34.75 to 30.38%. These changes triggered a sensation that solution technique parameters may have significant effect on the result of simulation. To check these phenomena, a few other tests with different solution techniques parameters have been run which proved this fact. During these tests (10B to 10H) the production/Injection pattern was kept as case 15 (Test10) and only solution technique parameters were changed for each run. To simplify the repeatation of solution technique parameters, a short synonym was defined for each parameter according to the following table and these short synonyms will be used when comparing cases:
Paramer Synonym used in the following Table
OrthoMin Option P1
Max Outer Iteration P2
Max Mat Bal Err P3
No of Orthogonalization P4
Max Inner iteration P5
Max Pressure Change P6
For each case these parameters are listed.
3. The detail of Test cases
Case-1(Test-1): Merlintest.mer (merlintest.mer is the input file name)

6
This is the first test run. Model consists of 36X180X8 grids is x,y and z
directions. All DX and DYs is set to 300ft. Top layer depth is 10500 and gross thickness for all layers is 10ft. Table 1 shows the layer parameters:
Layer H-Gross,ft H- Net Por(frac) Kx, md Ky, md Kz, md
1 10 8 .12 200 200 20
2 10 8 .12 200 200 20
3 10 8 .12 200 200 20
4 10 9 .15 250 250 25
5 10 9 .15 250 250 25
6 10 9 .15 250 250 25
7 10 10 .20 300 300 30
8 10 10 .20 300 300 30
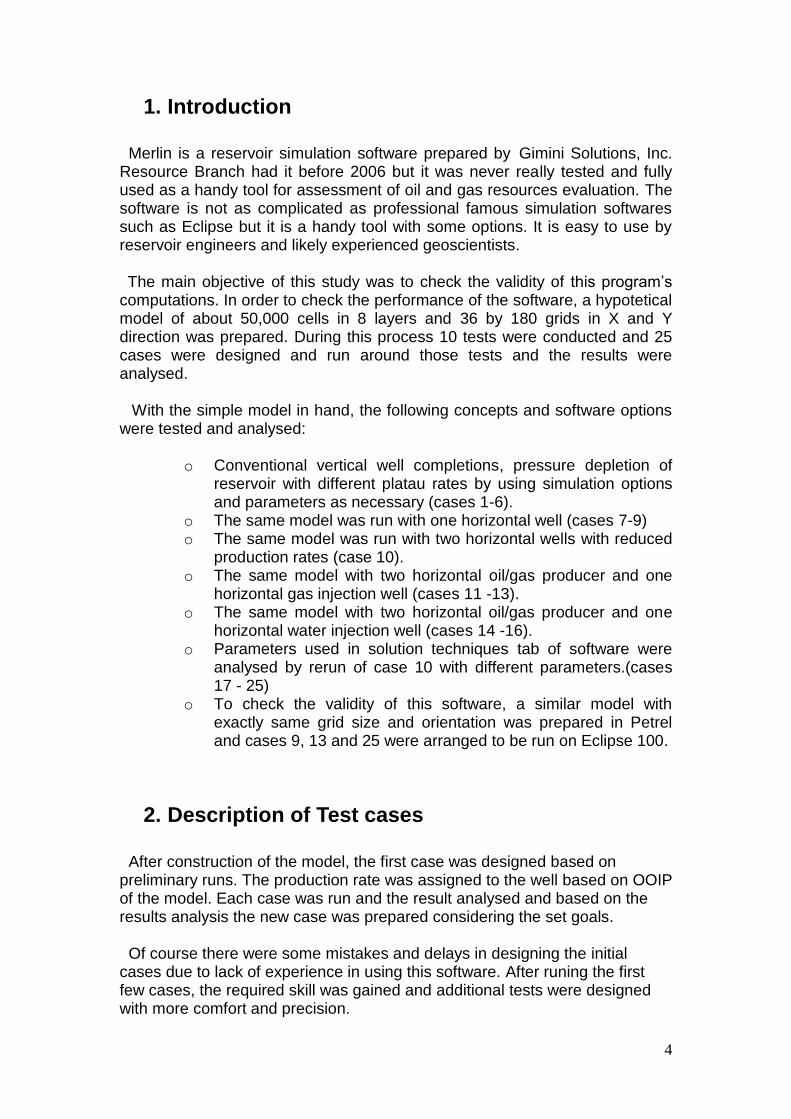
Table-1 Model parameters There is only one vertical well completed in x=19, y=85 and K=2-6, starting to produce 10000 B/D from beginning and flowing bottom hole pressure limit is set to 750psia. The test is run for 10 years.
Summary of results:
o Original in places for Oil, gas and water are: 284.863 MMB, 459.344 BCF and 589.912 MMB.
o The model produces for almost 800 days at 10,000B/D o Cum Oil, gas and water productions are 22.643 MMB, 207.746
BCF and 33.814 MMB respectively. The recovery factor is 7.95 %
Production profile data was exported to Merlin6Test1.xls file on test1 sheet. Chart1 in the xls file shows the test results.
Case P1 P2 P3 P4 P5 P6 UR %
1 Impes 1 2 7 30 0.01 7.95
7
Case 1 (chart-1): One vertical well – Merlin (2006)
Production Performance, One Vertical Well
Merlin(2006) Test 1
0
5000
10000
15000
20000
25000
30000
35000
40000
45000
50000
0 400 800 1200 1600 2000 2400 2800 3200 3600 4000
Time, Days
Da
ily r
ate
, B
bl
0
10000
20000
30000
40000
50000
60000
70000
80000
Ga
s r
ate
, M
sc
f/d
Qo bbl/d Qw, B/D
pressure*10, psia Qg, Mscf/D
Cum gas prod= 207.746 Bscf
Cum Oil Prod = 22.643 MMBbls
Cum Water Prod = 33.814 MMBbls
Recovery factor = 7.95 %
OOIP=284.863 MMB
OGIP=459.344 BCF
OWIP=589.912 MMB
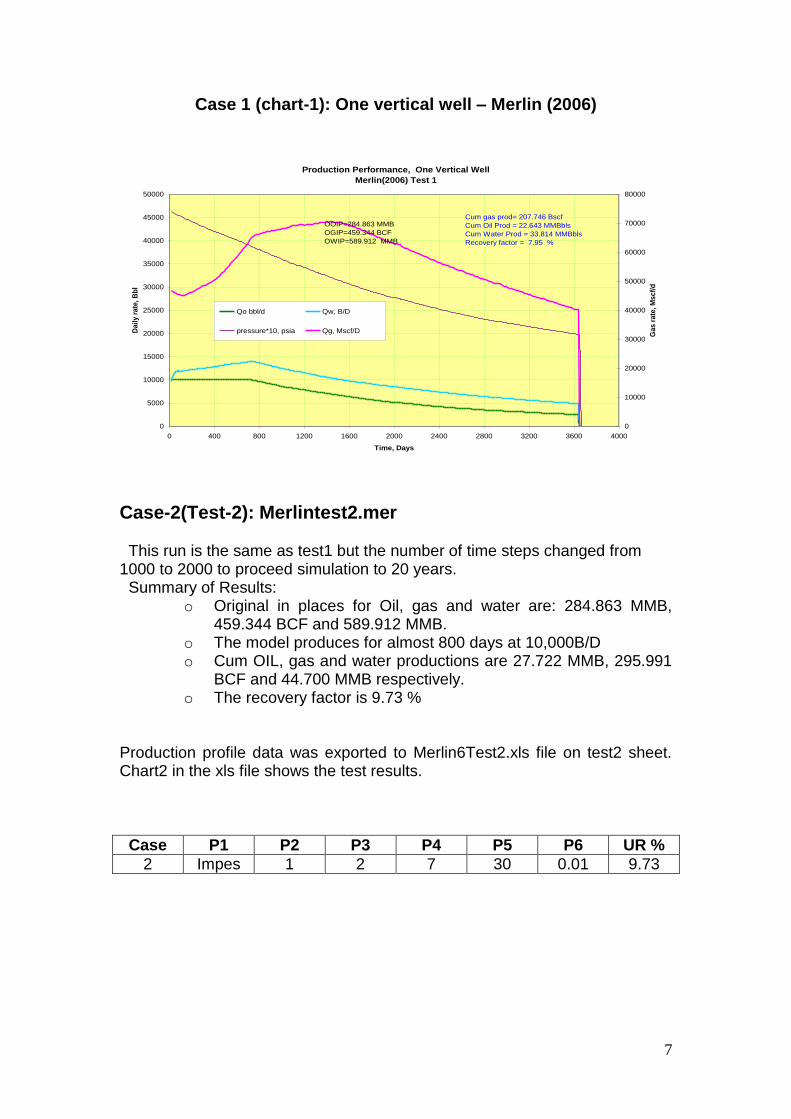
Case-2(Test-2): Merlintest2.mer This run is the same as test1 but the number of time steps changed from
1000 to 2000 to proceed simulation to 20 years. Summary of Results:
o Original in places for Oil, gas and water are: 284.863 MMB, 459.344 BCF and 589.912 MMB.
o The model produces for almost 800 days at 10,000B/D o Cum OIL, gas and water productions are 27.722 MMB, 295.991
BCF and 44.700 MMB respectively. o The recovery factor is 9.73 %
Production profile data was exported to Merlin6Test2.xls file on test2 sheet. Chart2 in the xls file shows the test results.
Case P1 P2 P3 P4 P5 P6 UR %
2 Impes 1 2 7 30 0.01 9.73

8
Case 2 (Chart2): One vertical well – Merlin (2006)
Production Performance, One Vertical Well
Merlin(2006) Test 2
0
5000
10000
15000
20000
25000
30000
35000
40000
45000
50000
0 800 1600 2400 3200 4000 4800 5600 6400 7200 8000
Time, Days
Daily r
ate
, B
bl
0
10000
20000
30000
40000
50000
60000
70000
80000
Gas r
ate
, M
scf/
d
Qo, B/D Qw, B/D
pressure*10, psia Qg, Mscf/D
Cum gas prod= 295.991 Bscf
Cum Oil Prod = 27.722 MMBbls
Cum Water Prod = 44.700 MMBbls
Recovery factor = 9.73 %
OOIP=284.863 MMB
OGIP=459.344 BCF
OWIP=589.912 MMB
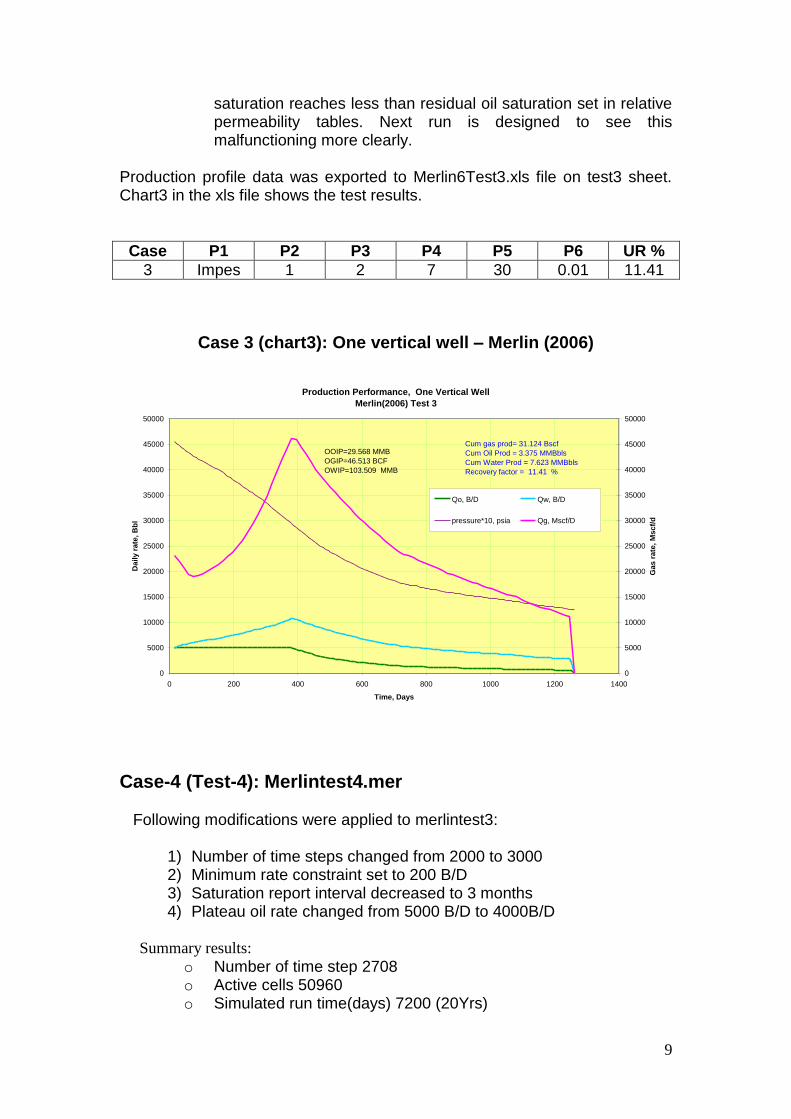
Case-3 (Test-3): Merlintest3.mer Following modifications were applied to merlintest2.mer:
o First 34 DXs changed from 300 to 100ft and last 2 changed from 300 to 500 ft.
o First 178 DYs changed from 300 to 100 ft and last 2 changed from 300 to 500 ft.
o The platue production rate was reduced to 5000B/D o In X direction, depth of grid blocks 31 to 36 was increased by
10ft each for the top layer. Thicknesses, porosity and permeabilities were kept as they were.
o Well was completed at same X, Y coordination but in layears 3-6 to reduce gas production.
Summary results:
o Cpu time 1,650 sec o Number of time step 2000 o Active cells 50960 o Simulated run time(days) 1268.935 (3.477 yrs) o o Original in places for Oil, gas and water are: 29.568 MMB,
46.513 BCF and 103.509 MMB. o The model produces for almost 400 days at 5,000B/D o Cum OIL, gas and water productions are 3.375 MMB, 31.124
BCF and 7.623 MMB respectively. o The recovery factor is 11.41 % o Some oil is moving into aquifer below WOC and also some oil is
moving into gas cap. The swept oil region next to WOC, oil
9
saturation reaches less than residual oil saturation set in relative permeability tables. Next run is designed to see this malfunctioning more clearly.
Production profile data was exported to Merlin6Test3.xls file on test3 sheet. Chart3 in the xls file shows the test results.
Case P1 P2 P3 P4 P5 P6 UR %
3 Impes 1 2 7 30 0.01 11.41
Case 3 (chart3): One vertical well – Merlin (2006)
Production Performance, One Vertical Well
Merlin(2006) Test 3
0
5000
10000
15000
20000
25000
30000
35000
40000
45000
50000
0 200 400 600 800 1000 1200 1400
Time, Days
Daily r
ate
, B
bl
0
5000
10000
15000
20000
25000
30000
35000
40000
45000
50000
Gas r
ate
, M
scf/
d
Qo, B/D Qw, B/D
pressure*10, psia Qg, Mscf/D
Cum gas prod= 31.124 Bscf
Cum Oil Prod = 3.375 MMBbls
Cum Water Prod = 7.623 MMBbls
Recovery factor = 11.41 %
OOIP=29.568 MMB
OGIP=46.513 BCF
OWIP=103.509 MMB
Case-4 (Test-4): Merlintest4.mer Following modifications were applied to merlintest3:
1) Number of time steps changed from 2000 to 3000 2) Minimum rate constraint set to 200 B/D 3) Saturation report interval decreased to 3 months 4) Plateau oil rate changed from 5000 B/D to 4000B/D
Summary results:
o Number of time step 2708 o Active cells 50960 o Simulated run time(days) 7200 (20Yrs)

10
o Original in places for Oil, gas and water are: 29.568 MMB, 46.513 BCF and 103.509 MMB.
o The model produces for almost 600 days at 4,000B/D o Cum OIL, gas and water productions are 3.713 MMB, 37.706
BCF and 9.272 MMB respectively. o The recovery factor is 12.56 % o Oil movement is almost the same as merlintest3. Some oil is
moving into aquifer below WOC and also some oil is moving into gas cap. The swept oil region next to WOC oil saturation reaches less than residual oil saturation set in relative permeability tables.
Production profile data was exported to Merlin6Test4.xls file on test4 sheet. Chart4 in the xls file shows the test results.
Case P1 P2 P3 P4 P5 P6 UR %
4 Impes 1 2 7 30 0.01 12.56
Case 4 (Chart4): One vertical well – Merlin (2006)
Production Performance, One Vertical Well
Merlin(2006) Test 4
0
5000
10000
15000
20000
25000
30000
35000
40000
45000
50000
0 200 400 600 800 1000 1200 1400 1600 1800 2000 2200 2400
Time, Days
Daily r
ate
, B
bl
0
5000
10000
15000
20000
25000
30000
35000
40000
45000
Gas r
ate
, M
scf/
d
Qo, B/D Qw, B/D
pressure*10, psia Qg, Mscf/D
Cum gas prod= 37.706 Bscf
Cum Oil Prod = 3.713 MMBbls
Cum Water Prod = 9.272 MMBbls
Recovery factor = 12.56 %
OOIP=29.568 MMB
OGIP=46.513 BCF
OWIP=103.509 MMB
Case-5 (Test-5): Merlintest5.mer (Merlin 2006) The modifications were:

11
1) Saturation report interval decreased to 3 months up to 2400 days Summary results:
o Cpu time 1826.05 sec o Number of time step 2171 o Active cells 50960 o Simulated run time(days) 2372.5(6Yrs) o The result is the same as case-4.
Production profile data was exported to Merlin6Test5.xls file on test5 sheet. Chart5 in the xls file shows the test results.
Case P1 P2 P3 P4 P5 P6 UR %
5 Impes 1 2 7 30 0.01 12.56
Case 5 (Chart5): One vertical well – Merlin (2006)
Production Performance, One Vertical Well
Merlin(2006) Test 5
0
1000
2000
3000
4000
5000
6000
7000
8000
9000
10000
0 250 500 750 1000 1250 1500 1750 2000 2250 2500
Time, Days
Daily r
ate
, B
bl
0
5000
10000
15000
20000
25000
30000
35000
40000
45000
50000
Gas r
ate
, M
scf/
d
Qo bbl/d Qw, B/D
pressure, psia Qg, Mscf/D
Cum gas prod= 37.49 Bscf
Cum Oil Prod = 3.682 MMBbls
Cum Water Prod = 9.223 MMBbls
Recovery factor = 12.45 %
OOIP=29.568 MMB
OGIP=46.513 BCF
OWIP=103.509 MMB
Case-6 (Test-5): Merlintest5.mer (Merlin 2008) This is the first case run by Merlin 2008 version.The following modification has no significant effect on results:
1) Saturation report interval decreased to 3 months up to 2400 days Summary results:
o Number of time step 2026 o Active cells 50960

12
o Simulated run time(days) 2372.5(6Yrs) o o Original in places for Oil, gas and water are: 32.571 MMB,
50.144 BCF and 98.519 MMB. o The model produces for almost 659 days at 4,000B/D o Cum Oil, gas and water productions are 4.001 MMB, 36.66 BCF
and 7.071 MMB respectively. o The recovery factor is 12.28 %
This case shows that two versions of Merlin use different logic for initialization and give different original fluid in places. Production profile data was exported to Merlin8Test5.xls file on test5 sheet. Chart5 in the xls file shows the test results.
Case P1 P2 P3 P4 P5 P6 UR %
6 Impes 1 2 7 30 0.01 12.28
Case 6 (Chart5): One vertical well – Merlin (2008)
Production Performance, One Vertical Well
Merlin(2008) Test 5
0
1000
2000
3000
4000
5000
6000
7000
8000
0 250 500 750 1000 1250 1500 1750 2000 2250 2500
Time, Days
Daily r
ate
, B
bl
0
5000
10000
15000
20000
25000
30000
35000
40000
45000
50000
Gas r
ate
, M
scf/
d
Qo bbl/d Qw, B/D
pressure, psia Qg, Mscf/D
Cum gas prod= 36.66 Bscf
Cum Oil Prod = 4.001 MMBbls
Cum Water Prod = 7.071 MMBbls
Recovery factor = 12.28 %
OOIP=32.571 MMB
OGIP=50.144 BCF
OWIP=98.519 MMB
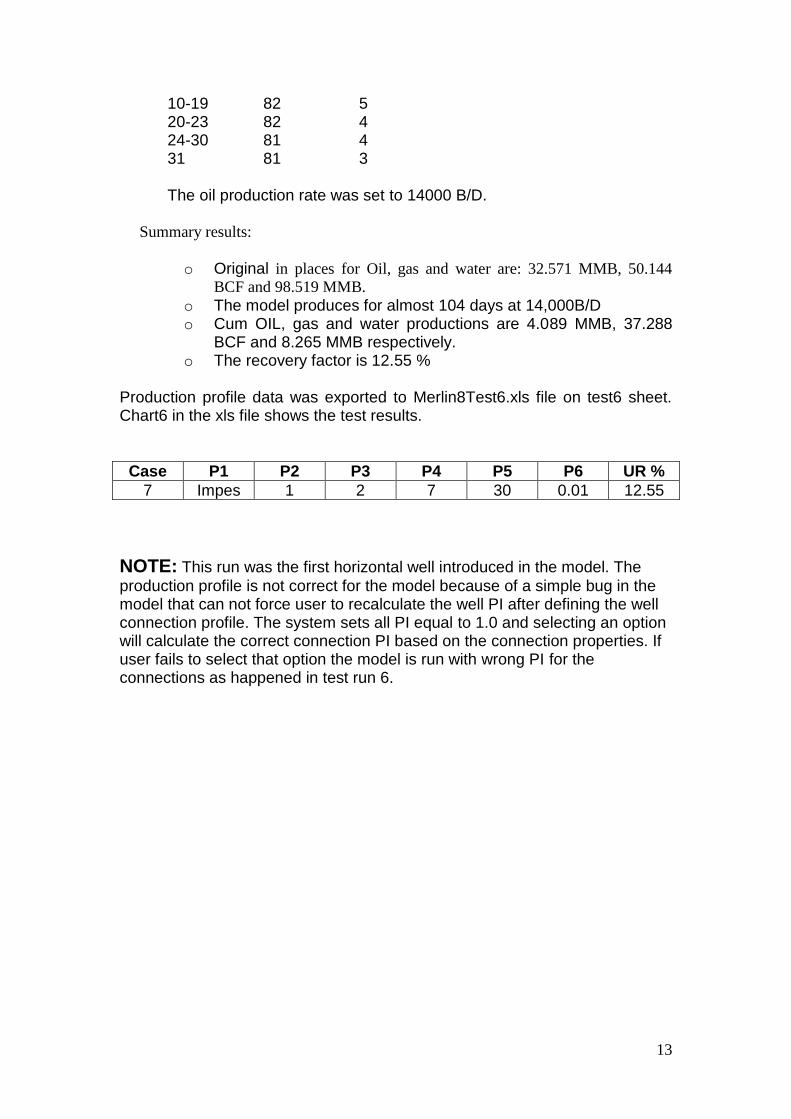
Case-7 (Test-6): Merlintest6.mer (Merlin 2008)
This is the first case run by Merlin 2008 version with horizontal well.The well was completed in X, Y and Z cells as follows: X Y Z ------- ----- ------ 3-9 83 5
13
10-19 82 5 20-23 82 4 24-30 81 4 31 81 3 The oil production rate was set to 14000 B/D.
Summary results:
o Original in places for Oil, gas and water are: 32.571 MMB, 50.144
BCF and 98.519 MMB.
o The model produces for almost 104 days at 14,000B/D o Cum OIL, gas and water productions are 4.089 MMB, 37.288
BCF and 8.265 MMB respectively. o The recovery factor is 12.55 %
Production profile data was exported to Merlin8Test6.xls file on test6 sheet. Chart6 in the xls file shows the test results.
Case P1 P2 P3 P4 P5 P6 UR %
7 Impes 1 2 7 30 0.01 12.55
NOTE: This run was the first horizontal well introduced in the model. The
production profile is not correct for the model because of a simple bug in the model that can not force user to recalculate the well PI after defining the well connection profile. The system sets all PI equal to 1.0 and selecting an option will calculate the correct connection PI based on the connection properties. If user fails to select that option the model is run with wrong PI for the connections as happened in test run 6.

14
Case 7 (Chart6): One Horizontal well with Wrong PI – Merlin (2008)
Production Performance, One Horizontal Well- Wrong PI
Merlin(2008) Test 6
0
10000
20000
30000
40000
50000
60000
70000
80000
90000
100000
0 100 200 300 400 500 600 700 800
Time, Days
Da
ily r
ate
, B
bl
0
10000
20000
30000
40000
50000
60000
70000
80000
90000
Ga
s r
ate
, M
sc
f/dQo bbl/d Qw, B/D
pressure(*10), psia Qg, Mscf/D
Cum gas prod= 37.288 Bscf
Cum Oil Prod = 4.089 MMBbls
Cum Water Prod = 8.265 MMBbls
Recovery factor = 12.55 %
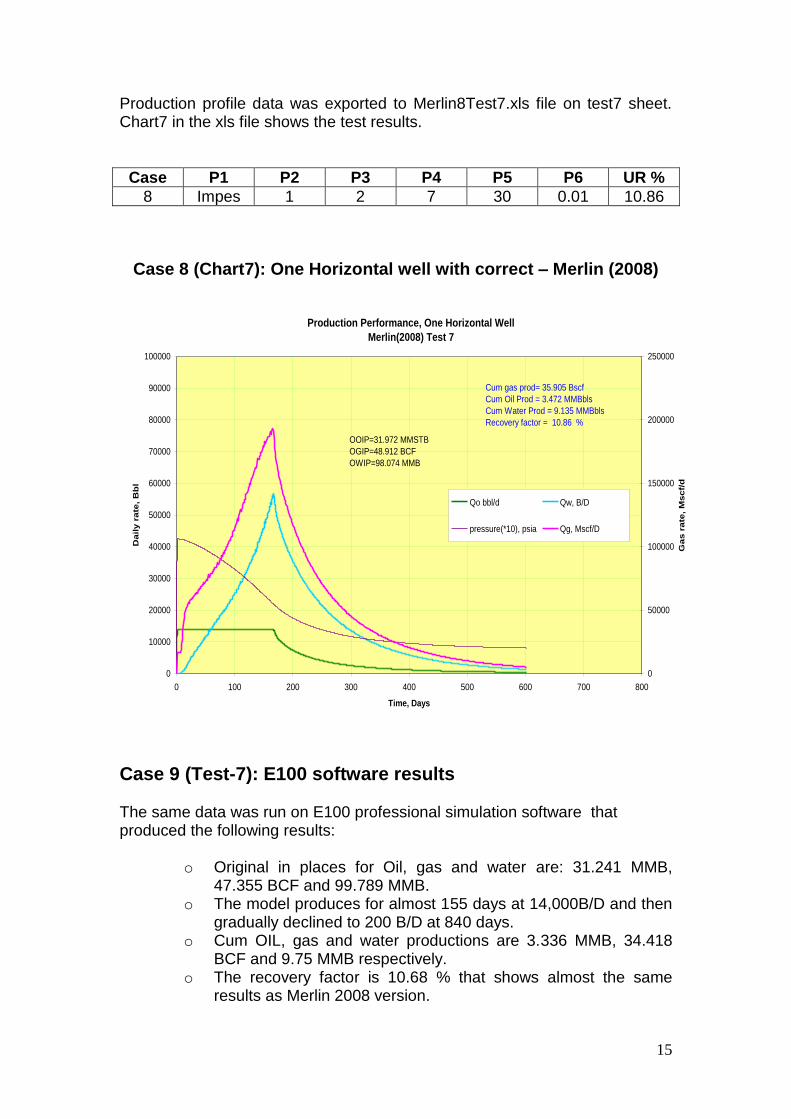
Case 8 (Test-7): Merlintest7.mer (Merlin 2008) This run is a repeatition of Testrun 6 with correct connection PI. Summary results:
o Original in places for Oil, gas and water are: 31.972 MMB, 48.912 BCF and 98.074 MMB.
o The model produces for almost 166 days at 14,000B/D and then gradually declined to 200 B/D at 844 days.
o Cum Oil, gas and water productions are 3.472 MMB, 35.905 BCF and 9.135 MMB respectively.
o The recovery factor is 10.86 % that shows sometimes lower PI may have higher recoveries by comparing test 6 with test 7.
15
Production profile data was exported to Merlin8Test7.xls file on test7 sheet. Chart7 in the xls file shows the test results.
Case P1 P2 P3 P4 P5 P6 UR %
8 Impes 1 2 7 30 0.01 10.86
Case 8 (Chart7): One Horizontal well with correct – Merlin (2008)
Production Performance, One Horizontal Well
Merlin(2008) Test 7
0
10000
20000
30000
40000
50000
60000
70000
80000
90000
100000
0 100 200 300 400 500 600 700 800
Time, Days
Da
ily r
ate
, B
bl
0
50000
100000
150000
200000
250000
Ga
s r
ate
, M
sc
f/d
Qo bbl/d Qw, B/D
pressure(*10), psia Qg, Mscf/D
Cum gas prod= 35.905 Bscf
Cum Oil Prod = 3.472 MMBbls
Cum Water Prod = 9.135 MMBbls
Recovery factor = 10.86 %
OOIP=31.972 MMSTB
OGIP=48.912 BCF
OWIP=98.074 MMB
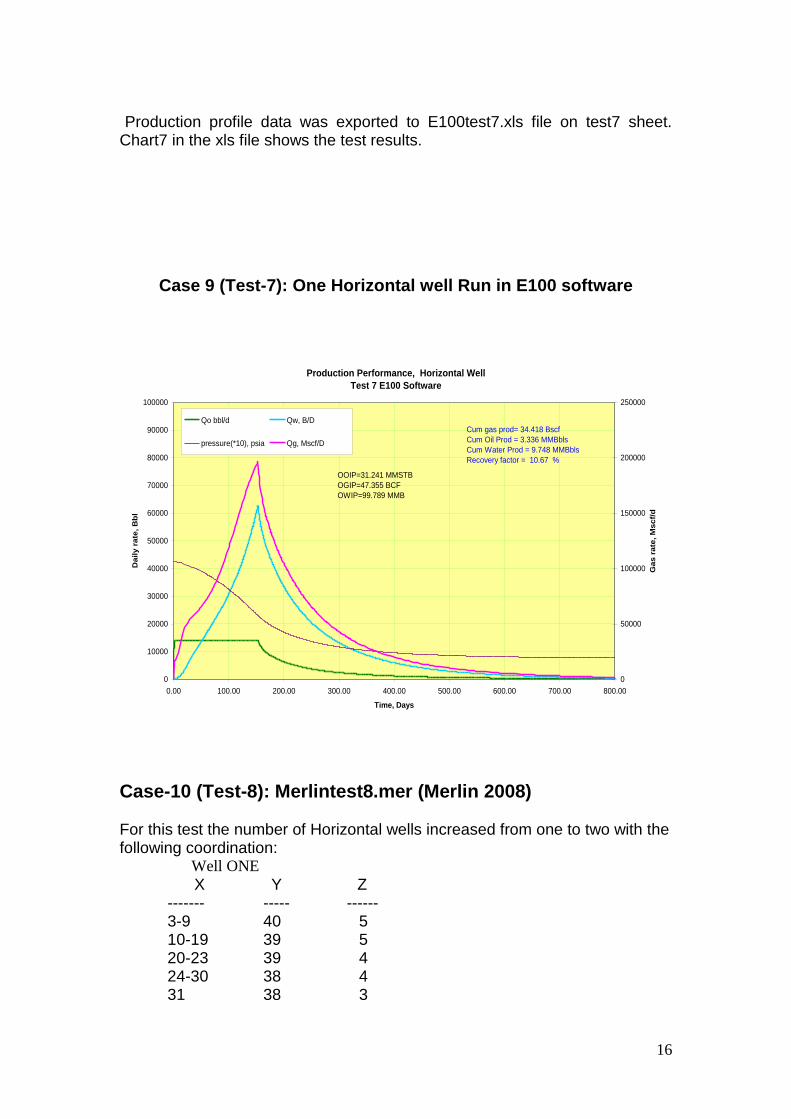
Case 9 (Test-7): E100 software results The same data was run on E100 professional simulation software that produced the following results:
o Original in places for Oil, gas and water are: 31.241 MMB, 47.355 BCF and 99.789 MMB.
o The model produces for almost 155 days at 14,000B/D and then gradually declined to 200 B/D at 840 days.
o Cum OIL, gas and water productions are 3.336 MMB, 34.418 BCF and 9.75 MMB respectively.
o The recovery factor is 10.68 % that shows almost the same results as Merlin 2008 version.
16
Production profile data was exported to E100test7.xls file on test7 sheet. Chart7 in the xls file shows the test results.
Case 9 (Test-7): One Horizontal well Run in E100 software
Production Performance, Horizontal Well
Test 7 E100 Software
0
10000
20000
30000
40000
50000
60000
70000
80000
90000
100000
0.00 100.00 200.00 300.00 400.00 500.00 600.00 700.00 800.00
Time, Days
Daily r
ate
, B
bl
0
50000
100000
150000
200000
250000
Gas r
ate
, M
scf/
d
Qo bbl/d Qw, B/D
pressure(*10), psia Qg, Mscf/D
Cum gas prod= 34.418 Bscf
Cum Oil Prod = 3.336 MMBbls
Cum Water Prod = 9.748 MMBbls
Recovery factor = 10.67 %
OOIP=31.241 MMSTB
OGIP=47.355 BCF
OWIP=99.789 MMB
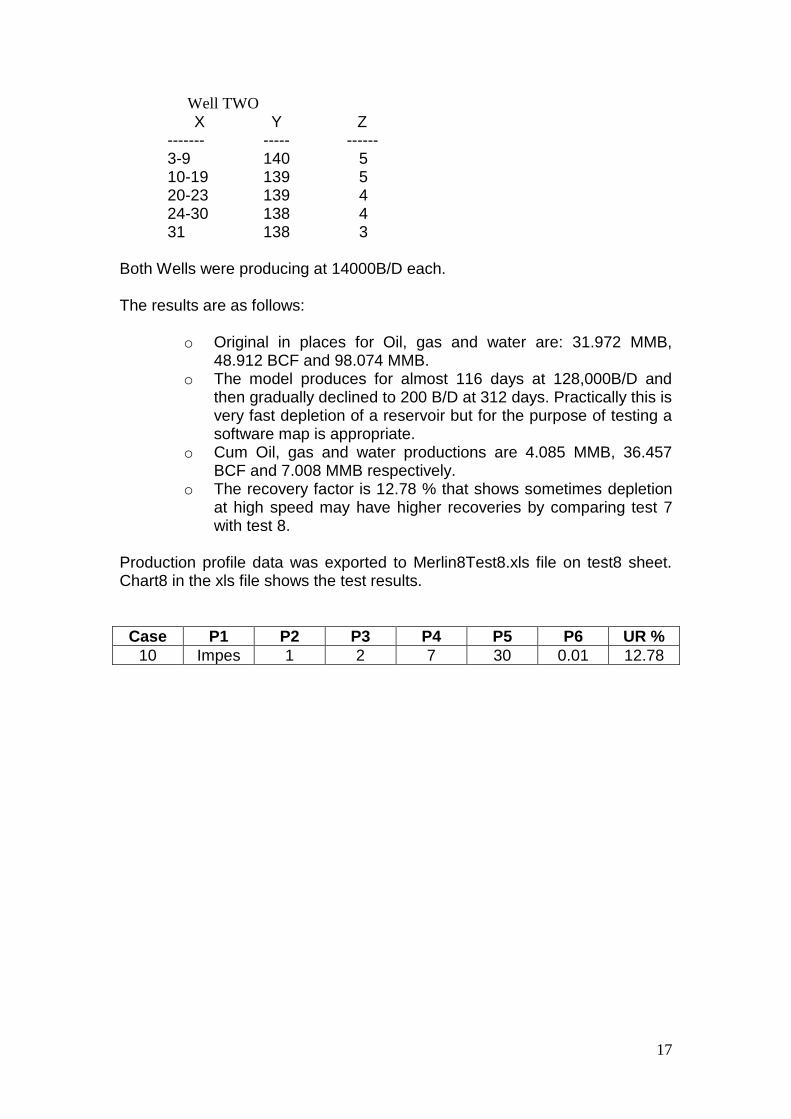
Case-10 (Test-8): Merlintest8.mer (Merlin 2008) For this test the number of Horizontal wells increased from one to two with the following coordination:
Well ONE
X Y Z ------- ----- ------ 3-9 40 5 10-19 39 5 20-23 39 4 24-30 38 4 31 38 3
17
Well TWO
X Y Z ------- ----- ------ 3-9 140 5 10-19 139 5 20-23 139 4 24-30 138 4 31 138 3
Both Wells were producing at 14000B/D each. The results are as follows:
o Original in places for Oil, gas and water are: 31.972 MMB, 48.912 BCF and 98.074 MMB.
o The model produces for almost 116 days at 128,000B/D and then gradually declined to 200 B/D at 312 days. Practically this is very fast depletion of a reservoir but for the purpose of testing a software map is appropriate.
o Cum Oil, gas and water productions are 4.085 MMB, 36.457 BCF and 7.008 MMB respectively.
o The recovery factor is 12.78 % that shows sometimes depletion at high speed may have higher recoveries by comparing test 7 with test 8.
Production profile data was exported to Merlin8Test8.xls file on test8 sheet. Chart8 in the xls file shows the test results.
Case P1 P2 P3 P4 P5 P6 UR %
10 Impes 1 2 7 30 0.01 12.78

18
Case 10 (Chart8): Two Horizontal wells – Merlin (2008)
Production Performance, Two Horizontal Wells
Merlin(2008) Test 8
0
10000
20000
30000
40000
50000
60000
70000
80000
90000
100000
0 50 100 150 200 250 300 350 400
Time, Days
Daily r
ate
, B
bl
0
50000
100000
150000
200000
250000
300000
350000
400000
450000
Gas r
ate
, M
scf/
d
Qo bbl/d Qw, B/D
pressure(*10), psia Qg, Mscf/D
Cum gas prod= 36.457 Bscf
Cum Oil Prod = 4.085 MMBbls
Cum Water Prod = 7.008 MMBbls
Recovery factor = 12.78 %
OOIP=31.972 MMSTB
GOIP=48.912 BCF
WOIP=98.074 MMB
Case-11 (Test-9): Merlintest9.mer (Merlin 2006) This case is modified test8 with a gas injector and reduced the rate of production for each well. The injector location is: Injector Well
X Y Z ------- ----- ------ 6-18 86 1
The production injection pattern is as follows: Time Well One Well Two Gas Injector Days B/D B/D MSCF/D
----------- ------------ ------------- --------------- 0 7000 7000 -50,000 91.25 -60,000 182.5 -80,000 270.75 -100,000 365.0 -120,000 600 4000 4000 -140,000 Production/Injection results are:
o Original in places for Oil, gas and water are: 28.98 MMB, 45.30 BCF and 103.16 MMB.

19
o The model produces for almost 420 days at 14,000B/D and then gradually declined to 3221 B/D at 800 days.
o Cum OIL, gas and water productions are 7.550 MMB, 107.99 BCF and 20.197 MMB respectively. During this time 82.583 BCF gas was injected into the reservoir.
o The recovery factor is 26.05 % that shows gas injection has significant effect on recovery.
Production profile data was exported to Merlin6Test9.xls file on test9 sheet. Chart9 in the xls file shows the test results.
Case P1 P2 P3 P4 P5 P6 UR %
11 Impes 1 2 7 30 0.01 26.05
Case 11 (Chart9): Two Horizontal wells – Merlin (2006)
Gas Injection
Production Performance, Gas Injection
Merlin(2006) Test 9
0
10000
20000
30000
40000
50000
60000
70000
80000
90000
100000
0 100 200 300 400 500 600 700 800
Time, Days
Da
ily r
ate
, B
bl
0
50000
100000
150000
200000
250000
300000
350000
400000
450000
Ga
s r
ate
, M
sc
f/d
Qo,B/D Qw, B/D
pressure(*10), psia Qg, Mscf/D
Qginj, Mscf/d
Cum gas prod= 78.86 Bscf
Cum gas Inj = 52.375 Bscf
Cum Oil Prod = 6.871 MMBbls
Cum Water Prod = 16.837 MMBbls
Recovery factor = 23.71 %OOIP=28.98 MMSTB
GOIP=45.30 BCF
WOIP=103.16 MMB
Case-12 (Test-9): Merlintest9.mer (Merlin 2008) The input data for this case is exactly the same as case 11 explained above. The Merlin version 2008 was used for simulation to compare the results. Production/Injection results are:

20
o Original in places for Oil, gas and water are: 31.972 MMB,
48.912 BCF and 98.074 MMB. o The model produces for almost 590 days at 14,000B/D and then
gradually declined to 3438 B/D at 800 days. o Cum Oil, gas and water productions are 9.301 MMB, 111.253
BCF and 16.762 MMB respectively. During this time 82.584 BCF gas was injected into the reservoir.
o The recovery factor is 29.09 % that shows Merlin Version 2008 is different from Version 2006.
Production profile data was exported to Merlin8Test9.xls file on test9 sheet. Chart9 in the xls file shows the test results.
Case P1 P2 P3 P4 P5 P6 UR %
12 Impes 1 2 7 30 0.01 29.09
Case 12 (Chart9): Two Horizontal wells – Merlin (2008)
Gas Injection
Production Performance, Gas Injection
Merlin(2008) Test 9
0
10000
20000
30000
40000
50000
60000
70000
80000
90000
100000
0 100 200 300 400 500 600 700 800
Time, Days
Da
ily r
ate
, B
bl;
Pre
ss
ure
*1
0,
ps
ia
0
50000
100000
150000
200000
250000
300000
350000
400000
450000
Ga
s r
ate
, M
sc
f/d
Qo bbl/d Qw, B/D
pressure(*10), psia Qg, Mscf/D
Qginj, Mscf/d
Cum gas prod= 111.253 Bscf
Cum gas Inj = 82.584 Bscf
Cum Oil Prod = 9.301 MMBbls
Cum Water Prod = 16.762 MMBbls
Recovery factor = 29.09 %OOIP= 31.972 MMSTB
GOIP=48.912 BCF
WOIP=98.074 MMB
Case 13 (Test-9): E100 software results The input data for this case is exactly the same as case 9 explained above. The E100 Software was used for simulation. Production/Injection results are:

21
o Original in places for Oil, gas and water are: 31.24 MMB, 47.35
BCF and 99.79 MMB. o The model produces for almost 588 days at 14,000B/D and then
gradually declined to 2972 B/D at 800 days. o Cum Oil, gas and water productions are 9.185 MMB, 109.877
BCF and 17.233 MMB respectively. During this time 82.79 BCF gas was injected into the reservoir.
o The recovery factor is 29.40 % that shows Merlin Version 2008 is producing the same results as E100 Software for this case.
Production profile data was exported to E100test9.xls file on test9 sheet. Chart9 in the xls file shows the test results.
Case 13 (Chart9): Two Horizontal wells – E100 Software
Gas Injection
Production Performance, Gas Injection
E100 software Test9
0
10000
20000
30000
40000
50000
60000
70000
80000
90000
100000
0 100 200 300 400 500 600 700 800
Time, Days
Daily r
ate
, B
bl;
Pre
ssu
re *
10, P
sia
0
50000
100000
150000
200000
250000
300000
350000
400000
450000
Gas r
ate
, M
scf/
d
Qo, B/D Qw, B/D
pressure(*10), psia Qg, Mscf/D
Qginj, Mscf/d
Cum gas prod= 109.877 Bscf
Cum gas Inj = 82.79 Bscf
Cum Oil Prod = 9.185 MMBbls
Cum Water Prod = 17.233 MMBbls
Recovery factor = 29.40 %
OOIP=31.24 MMSTB
GOIP=47.35 BCF
WOIP=99.79 MMB
The following Table compares 3 software results with the same input data:
Merlin 2006
Merlin 2008
E100 Software
OOIP, MMSTB 28.980 31.972 31.240

22
GOIP, BCF 45.300 48.912 47.350
WOIP, MMB 103.160 98.074 99.790
Cum Oil Prod, MMSTB 7.550 9.301 9.185
Cum Gas Prod, BCF 107.990 111.253 109.877
Cum Water Prod, MMB 20.197 16.762 17.233
Cum Gas Inj, BCF 82.583 82.584 82.790
Recovery Factor % 26.050 29.090 29.400
This table shows that the results of Merlin (2008) computations are very close to E100.
Case-14 (Test 10): Merlintest10.mer (Merlin 2006)
This test consists of the same static model with two oil producers and one water injection well. The well coordinations are:
Producer ONE
X Y Z ------- ----- ------ 6-10 40 4 11-24 39 4 25-31 38 4
Producer TWO
X Y Z ------- ----- ------ 6-10 140 4 11-24 139 4 25-30 138 4 31 138 3
Injector Well
X Y Z ------- ----- ------ 35 58-118 8
The production injection pattern is as follows: Time, Days Well One Well Two Water Injector Days B/D B/D B/D
----------- ------------ ------------- --------------- 0 7000 7000 -40,000 90.25 -60,000 182.5 -70,000

23
600 4000 4000 -70,000 Production/Injection results are:
o Original in places for Oil, gas and water are: 28.98 MMB, 45.30 BCF and 103.16 MMB.
o The model produces for almost 579 days at 14,000B/D and then gradually declined to 1919 B/D at 700 days. It stopped due to Number of time steps limitation (7000).
o Cum Oil, gas and water productions are 8.714 MMB, 37.635 BCF and 31.501 MMB respectively. During this time 45.961 MMB water was injected into the reservoir.
o The recovery factor is 30.07 % that shows Water injection has significant effect on recovery and seems to be more efficient than gas injection in this model.
Production profile data was exported to Merlin6Test10.xls file on test10 sheet. Chart10 in the xls file shows the test results.
Case P1 P2 P3 P4 P5 P6 UR %
14 Impes 1 2 7 30 0.01 30.07
Case 14 (Chart10): Two Horizontal wells – Merlin (2006)
Water Injection
Production Performance, Water Injection
Merlin(2006) Test 10
0
10000
20000
30000
40000
50000
60000
70000
80000
90000
100000
0 100 200 300 400 500 600 700 800
Time, Days
Da
ily r
ate
, B
bl
0
20000
40000
60000
80000
100000
120000
140000
160000
180000
200000
Ga
s r
ate
, M
sc
f/d
Qo, B/D Qw, B/D
Qginj, Mscf/d pressure(*10), psia
Qg, Mscf/D
Cum gas prod= 37.625 Bscf
Cum Water Inj = 45.932 MMBbls
Cum Oil Prod = 8.713 MMBbls
Cum Water Prod = 31.49 MMBbls
Recovery factor = 30.06 %

24
Case-15 (Test-10): Merlintest10.mer (Merlin 2008) The same input data with the following change in injection pattern was rerun on Merlin Version 2008:
The production injection pattern is as follows: Time, Days Well One Well Two Water Injector Days B/D B/D B/D
----------- ------------ ------------- --------------- 0 7000 7000 -15,000 182.5 -17,000 600 4000 4000 -10,000 The gas and water production rates had frequent flatuation. The production and recovery results were:
o Original in places for Oil, gas and water are: 31.972 MMB, 48.912 BCF and 98.074 MMB.
o The model produces for almost 600 days at 14,000B/D and then until 900 days produced 8000B/D and then production rate gradually declined to less than 500 B/D and then stopped.
o Cum OIL, gas and water productions are 11.110 MMB, 68.692 BCF and 11.618 MMB respectively. During this time 14.955 MMB water was injected into the reservoir.
o The recovery factor is 34.75 % that shows Water injection has significant effect on recovery and seems to be more efficient than gas injection in this model.
Production profile data was exported to Merlin8Test10.xls file on test10 sheet. Chart10 in the xls file shows the test results.
Case P1 P2 P3 P4 P5 P6 UR %
15 Impes 1 2 7 30 0.01 34.75
Case 15 (Chart10): Two Horizontal wells – Merlin (2008)
Water Injection

25
Production Performance, Water Injection
Merlin(2008) Test 10
0
10000
20000
30000
40000
50000
60000
0 200 400 600 800 1000 1200
Time, Days
Daily r
ate
, B
bl
0
20000
40000
60000
80000
100000
120000
140000
160000
180000
Gas r
ate
, M
scf/
d
Qo, B/D Qw, B/D
QWinj, MB/D pressure(*10), psia
Qg, Mscf/D
Cum gas prod= 68.692 Bscf
Cum Water Inj = 14.955 MMBbls
Cum Oil Prod = 11.110 MMBbls
Cum Water Prod = 11.618 MMBbls
Recovery factor = 34.75 %
Case-16 (Test 10A): Merlintest10A.mer (Merlin 2008) The Production/Injection profile was changed as: Time, Days Well One Well Two Water Injector Days B/D B/D B/D
----------- ------------ ------------- --------------- 0 5000 5000 -11,000 182.5 -13,000 600 4000 4000 -10,000 Fully implicit option was used to supress flactuations. The production and recovery results were:
o Original in places for Oil, gas and water are: 31.972 MMB, 48.912 BCF and 98.074 MMB.
o The model produces for almost 600 days at 14,000B/D and then until 1030 days produced 8000B/D and then production rate gradually declined to less than 500 B/D and then stopped.
o Cum Oil, gas and water productions are 9.713 MMB, 36.009 BCF and 12.919 MMB respectively. During this time 14.158 MMB water was injected into the reservoir.
o The recovery factor is 30.38 %. Production profile data was exported to Merlin8Test10A.xls file on test10A sheet. Chart10A in the xls file shows the test results.
Case P1 P2 P3 P4 P5 P6 UR %
16 F Imp 1 2 7 30 0.01 30.38

26
Case 16 (Chart10A): Two Horizontal wells – Merlin (2008)
Water Injection
Production Performance, Water Injection
Merlin(2008) Test 10A
0
10000
20000
30000
40000
50000
60000
0 200 400 600 800 1000 1200 1400
Time, Days
Daily r
ate
, B
bl
0
20000
40000
60000
80000
100000
120000
140000
160000
180000
Gas r
ate
, M
scf/
d
Qo, B/D Qw, B/D
QWinj, MB/D pressure(*10), psia
Qg, Mscf/D
Cum gas prod= 36.009 Bscf
Cum Water Inj = 14.158 MMBbls
Cum Oil Prod = 9.713 MMBbls
Cum Water Prod = 12.919 MMBbls
Recovery factor = 30.38 %
Initial prod rate 10,000B/D
Initial Water Injection 11,000B/D
Solution method: Fully Implicit
Case-17 (Test 10B): Merlintest10B.mer (Merlin 2008)
Input data same as case 15 but solution parameters changed. The production and recovery results were:
o Original in places for Oil, gas and water are: 31.972 MMB, 48.912 BCF and 98.074 MMB.
o The model produces for almost 600 days at 14,000B/D and then until 630 days produced 8000B/D and then production rate gradually declined to less than 500 B/D and then stopped.
o Cum Oil, gas and water productions are 9.228 MMB, 35.693 BCF and 12.827 MMB respectively. During this time 14.905 MMB water was injected into the reservoir.
o The recovery factor is 28.86 %.
Production profile data was exported to Merlin8Test10B.xls file on test10B sheet. Chart10B in the xls file shows the test results.
Case P1 P2 P3 P4 P5 P6 UR %
17 F Imp 1 2 10 30 0.01 28.86

27
Case 17 (Chart10B): Two Horizontal wells – Merlin (2008)
Water Injection
Production Performance, Water Injection
Merlin(2008) Test 10B
0
10000
20000
30000
40000
50000
60000
0 200 400 600 800 1000 1200
Time, Days
Daily r
ate
, B
bl
0
20000
40000
60000
80000
100000
120000
140000
160000
180000
Gas r
ate
, M
scf/
d
Qo, B/D Qw, B/DQWinj, MB/D pressure(*10), psiaQg, Mscf/D
Cum gas prod= 35.693 Bscf
Cum Water Inj = 14.905 MMBbls
Cum Oil Prod = 9.228 MMBbls
Cum Water Prod = 12.827 MMBbls
Recovery factor = 28.86 %
Solution Technique:-
P1= F Imp
P2=1
P3=2
P4=10
P5=30
P6=0.01
Case-18 (Test 10C): Merlintest10C.mer (Merlin 2008) Input data same as case 15 but solution parameters changed. The production and recovery results were:
o Original in places for Oil, gas and water are: 31.972 MMB, 48.912 BCF and 98.074 MMB.
o The model produces for almost 300 days at 14,000B/D and then production rate gradually declined to less than 500 B/D and then stopped.
o Cum OIL, gas and water productions are 4.725 MMB, 38.107 BCF and 8.016 MMB respectively. During this time 10.245 MMB water was injected into the reservoir.
o The recovery factor is 14.78 %.
Production profile data was exported to Merlin8Test10C.xls file on test10C sheet. Chart10C in the xls file shows the test results.
Case P1 P2 P3 P4 P5 P6 UR %
18 Impes 2 2 7 100 0.001 14.78

28
Case 18 (Chart10C): Two Horizontal wells – Merlin (2008)
Water Injection
Production Performance, Water Injection
Merlin(2008) Test 10C
0
10000
20000
30000
40000
50000
60000
0 200 400 600 800 1000 1200
Time, Days
Daily r
ate
, B
bl
0
20000
40000
60000
80000
100000
120000
140000
160000
180000
Gas r
ate
, M
scf/
d
Qo, B/D
Qw, B/D
QWinj, MB/D
pressure(*10), psia
Qg, Mscf/D
Cum gas prod= 38.107 Bscf
Cum Water Inj = 10.245 MMBbls
Cum Oil Prod = 4.725 MMBbls
Cum Water Prod = 8.016 MMBbls
Recovery factor = 14.78 %
Defaults Solution Technique:-
P1= Impes
P2=2
P3=2
P4=7
P5=100
P6=0.001
Case-19 (Test 10D): Merlintest10D.mer (Merlin 2008) Input data same as case 15 but solution parameters changed. The production and recovery results were:
o Original in places for Oil, gas and water are: 31.972 MMB, 48.912 BCF and 98.074 MMB.
o The model produces for almost 300 days at 14,000B/D and then production rate gradually declined to less than 500 B/D and then stopped.
o Cum Oil, gas and water productions are 4.933 MMB, 36.934 BCF and 8.334 MMB respectively. During this time 10.245 MMB water was injected into the reservoir.
o The recovery factor is 15.43 %.
Production profile data was exported to Merlin8Test10D.xls file on test10D sheet. Chart10D in the xls file shows the test results.
Case P1 P2 P3 P4 P5 P6 UR %
19 F Imp 2 2 7 100 0.01 15.43

29
Case 19 (Chart10D): Two Horizontal wells – Merlin (2008)
Water Injection
Production Performance, Water Injection
Merlin(2008) Test 10D
0
10000
20000
30000
40000
50000
60000
0 200 400 600 800 1000 1200
Time, Days
Daily r
ate
, B
bl
0
20000
40000
60000
80000
100000
120000
140000
160000
180000
Gas r
ate
, M
scf/
d
Qo, B/D
Qw, B/D
QWinj, MB/D
pressure(*10), psia
Qg, Mscf/D
Cum gas prod= 36.934 Bscf
Cum Water Inj = 10.245 MMBbls
Cum Oil Prod = 4.933 MMBbls
Cum Water Prod = 8.334 MMBbls
Recovery factor = 1543 %
Solution Technique:-
P1=F Imp
P2=2
P3=2
P4=7
P5=100
P6=0.001
Case-20 (Test 10E): Merlintest10E.mer (Merlin 2008) Input data same as case 15 but solution parameters changed. The production and recovery results were:
o Original in places for Oil, gas and water are: 31.972 MMB, 48.912 BCF and 98.074 MMB.
o The model produces for almost 300 days at 14,000B/D and then production rate gradually declined to less than 500 B/D and then stopped.
o Cum Oil, gas and water productions are 4.723 MMB, 38.070 BCF and 7.997 MMB respectively. During this time 10.185 MMB water was injected into the reservoir.
o The recovery factor is 14.77 %.
Production profile data was exported to Merlin8Test10E.xls file on test10E sheet. Chart10E in the xls file shows the test results.
Case P1 P2 P3 P4 P5 P6 UR %
20 Impes 2 2 7 100 0.01 14.77

30
Case 20 (Chart10E): Two Horizontal wells – Merlin (2008)
Water Injection
Production Performance, Water Injection
Merlin(2008) Test 10E
0
10000
20000
30000
40000
50000
60000
0 200 400 600 800 1000 1200
Time, Days
Daily r
ate
, B
bl
0
20000
40000
60000
80000
100000
120000
140000
160000
180000
Gas r
ate
, M
scf/
d
Qo, B/D
Qw, B/D
QWinj, MB/D
pressure(*10), psia
Qg, Mscf/D
Cum gas prod= 38.070 Bscf
Cum Water Inj = 10.185 MMBbls
Cum Oil Prod = 4.723 MMBbls
Cum Water Prod = 7.997 MMBbls
Recovery factor = 14.77 %
Solution Technique:-
P1=Impes
P2=2
P3=2
P4=7
P5=100
P6=0.01
Case- 21 (Test 10F): Merlintest10F.mer (Merlin 2008) Input data same as case 15 but solution parameters changed. The production and recovery results were:
o Original in places for Oil, gas and water are: 31.972 MMB, 48.912 BCF and 98.074 MMB.
o The model produces for almost 300 days at 14,000B/D and then production rate gradually declined to less than 500 B/D and then stopped.
o Cum Oil, gas and water productions are 4.723 MMB, 38.068 BCF and 7.996 MMB respectively. During this time 10.175 MMB water was injected into the reservoir.
o The recovery factor is 14.77 %.
Production profile data was exported to Merlin8Test10F.xls file on test10F sheet. Chart10F in the xls file shows the test results.
Case P1 P2 P3 P4 P5 P6 UR %
21 Impes 2 2 7 30 0.01 14.77

31
Case 21 (Chart10F): Two Horizontal wells – Merlin (2008)
Water Injection
Production Performance, Water Injection
Merlin(2008) Test 10F
0
10000
20000
30000
40000
50000
60000
0 200 400 600 800 1000 1200
Time, Days
Daily r
ate
, B
bl
0
20000
40000
60000
80000
100000
120000
140000
160000
180000
Gas r
ate
, M
scf/
d
Qo, B/D
Qw, B/D
QWinj, MB/D
pressure(*10), psia
Qg, Mscf/D
Cum gas prod= 38.068 Bscf
Cum Water Inj = 10.175 MMBbls
Cum Oil Prod = 4.723 MMBbls
Cum Water Prod = 7.996 MMBbls
Recovery factor = 14.77 %
Solution Technique:-
P1= IMPES
P2=2
P3 =2
P4=7
P5=30
P6= 0.01
Case-22 (Test 10G): Merlintest10G.mer (Merlin 2008) Input data same as case 15 but solution parameters changed. The Gas and water production profile is flactuating. The production and recovery results were:
o Original in places for Oil, gas and water are: 31.972 MMB, 48.912 BCF and 98.074 MMB.
o The model produces for almost 600 days at 14,000B/D and then until 780 days produced 8000B/D and then production rate gradually declined to less than 500 B/D and then stopped.
o Cum OIL, gas and water productions are 10.126 MMB, 64.098 BCF and 10.623 MMB respectively. During this time 13.835 MMB water was injected into the reservoir.
o The recovery factor is 31.67 %.
Production profile data was exported to Merlin8Test10G.xls file on test10G sheet. Chart10G in the xls file shows the test results.
Case P1 P2 P3 P4 P5 P6 UR %
22 Impes 3 2 7 30 0.01 31.67

32
Case 22 (Chart10G): Two Horizontal wells – Merlin (2008)
Water Injection
Production Performance, Water Injection
Merlin(2008) Test 10G
0
10000
20000
30000
40000
50000
60000
0 200 400 600 800 1000 1200
Time, Days
Daily r
ate
, B
bl
0
20000
40000
60000
80000
100000
120000
140000
160000
180000
Gas r
ate
, M
scf/
d
Qo, B/D Qw, B/D
QWinj, MB/D pressure(*10), psia
Qg, Mscf/D
Cum gas prod= 64.098 Bscf
Cum Water Inj = 13.835 MMBbls
Cum Oil Prod = 10.126 MMBbls
Cum Water Prod = 10.623 MMBbls
Recovery factor = 31.67 %
Solution Technique:-
P1= IMPES
P2=3
P3=2
P4=7
P5=30
P6= 0.01
Case-23 (Test 10GR): Merlintest10GR.mer (Merlin 2009) Input data same as case 15 but solution parameters changed. The Gas and water production profile is flactuating. The production and recovery results were:
o Original in places for Oil, gas and water are: 31.972 MMB, 48.912 BCF and 98.074 MMB.
o The model produces for almost 600 days at 14,000B/D and then until 790 days produced 8000B/D and then production rate gradually declined to less than 500 B/D and then stopped.
o Cum Oil, gas and water productions are 10.260 MMB, 69.194 BCF and 10.232 MMB respectively. During this time 13.835MMB water was injected into the reservoir.
o The recovery factor is 32.09 %.
Production profile data was exported to Merlin8Test10GR.xls file on test10GR sheet. Chart10GR in the xls file shows the test results.
Case P1 P2 P3 P4 P5 P6 UR %
23 Impes 3 2 7 30 0.01 32.09

33
Case 23 (Chart10GR): Two Horizontal wells – Merlin (2009)
Water Injection
Production Performance, Water Injection
Merlin(2009) Test 10GR
0
10000
20000
30000
40000
50000
60000
0 200 400 600 800 1000 1200
Time, Days
Da
ily
ra
te,
Bb
l
0
20000
40000
60000
80000
100000
120000
140000
160000
180000
Ga
s r
ate
, M
sc
f/d
Qo, B/D Qw, B/D
QWinj, MB/D pressure(*10), psia
Qg, Mscf/D
Cum gas prod= 69.194 Bscf
Cum Water Inj = 13.835 MMBbls
Cum Oil Prod = 10.260 MMBbls
Cum Water Prod = 10.232 MMBbls
Recovery factor = 32.09 %
Solution Technique:-
P1= IMPES
P2=3
P3 =2
P4 =7
P5=30
P6= 0.01
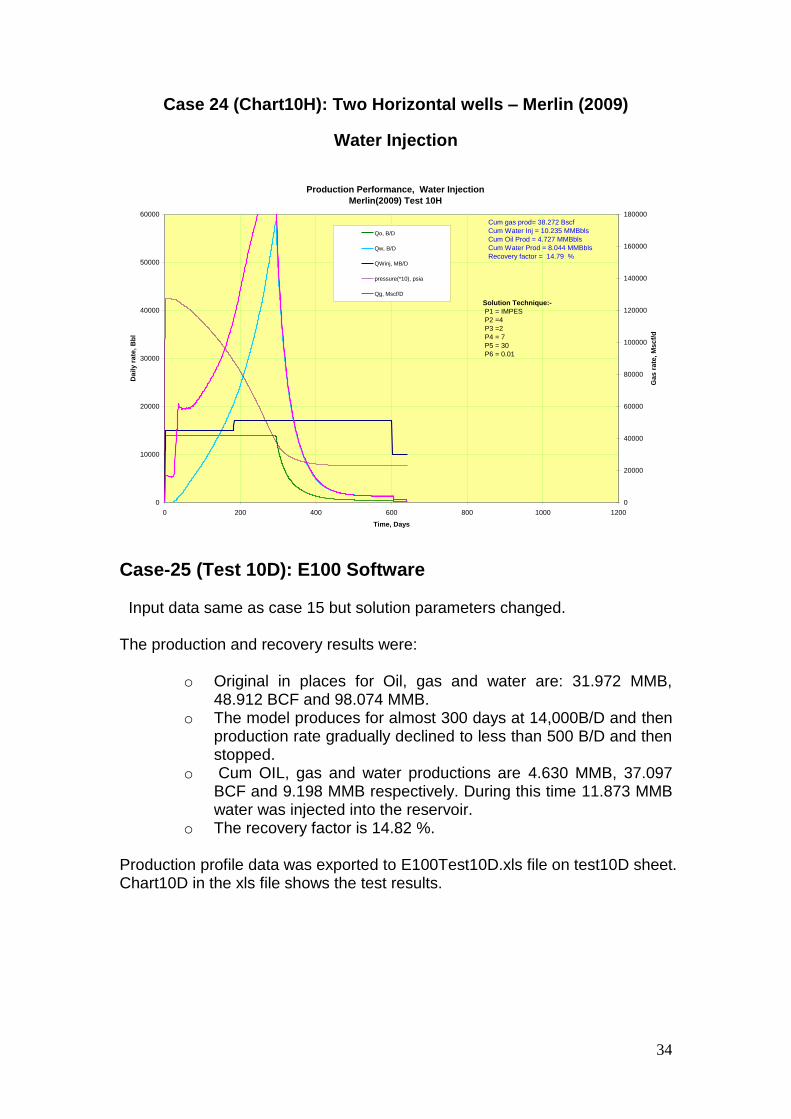
Case-24 (Test 10H): Merlintest10H.mer (Merlin 2009) Input data same as case 15 but solution parameters changed. The production and recovery results were:
o Original in places for Oil, gas and water are: 31.972 MMB, 48.912 BCF and 98.074 MMB.
o The model produces for almost 300 days at 14,000B/D and then production rate gradually declined to less than 500 B/D and then stopped.
o Cum Oil, gas and water productions are 4.727 MMB, 38.272 BCF and 8.044 MMB respectively. During this time 10.235 MMB water was injected into the reservoir.
o The recovery factor is 14.79 %.
Production profile data was exported to Merlin8Test10H.xls file on test10H sheet. Chart10H in the xls file shows the test results.
Case P1 P2 P3 P4 P5 P6 UR %
24 Impes 4 2 7 30 0.01 14.79
34
Case 24 (Chart10H): Two Horizontal wells – Merlin (2009)
Water Injection
Production Performance, Water Injection
Merlin(2009) Test 10H
0
10000
20000
30000
40000
50000
60000
0 200 400 600 800 1000 1200
Time, Days
Da
ily
ra
te,
Bb
l
0
20000
40000
60000
80000
100000
120000
140000
160000
180000
Ga
s r
ate
, M
sc
f/d
Qo, B/D
Qw, B/D
QWinj, MB/D
pressure(*10), psia
Qg, Mscf/D
Cum gas prod= 38.272 Bscf
Cum Water Inj = 10.235 MMBbls
Cum Oil Prod = 4.727 MMBbls
Cum Water Prod = 8.044 MMBbls
Recovery factor = 14.79 %
Solution Technique:-
P1 = IMPES
P2 =4
P3 =2
P4 = 7
P5 = 30
P6 = 0.01
Case-25 (Test 10D): E100 Software Input data same as case 15 but solution parameters changed. The production and recovery results were:
o Original in places for Oil, gas and water are: 31.972 MMB, 48.912 BCF and 98.074 MMB.
o The model produces for almost 300 days at 14,000B/D and then production rate gradually declined to less than 500 B/D and then stopped.
o Cum OIL, gas and water productions are 4.630 MMB, 37.097 BCF and 9.198 MMB respectively. During this time 11.873 MMB water was injected into the reservoir.
o The recovery factor is 14.82 %.
Production profile data was exported to E100Test10D.xls file on test10D sheet. Chart10D in the xls file shows the test results.

35
Case 25 (Chart10D): Two Horizontal wells – E100 software
Water Injection
Production Performance, Water Injection
E100 Software Test 10D
0
10000
20000
30000
40000
50000
60000
0.00 200.00 400.00 600.00 800.00 1000.00 1200.00
Time, Days
Da
ily
ra
te,
Bb
l
0
20000
40000
60000
80000
100000
120000
140000
160000
180000
Ga
s r
ate
, M
sc
f/d
Qo, B/D Qw, B/D
QWinj, MB/D pressure(*10), psia
Qg, Mscf/D
Cum gas prod= 37.097 Bscf
Cum Water Inj = 11.873 MMBbls
Cum Oil Prod = 4.630 MMBbls
Cum Water Prod = 9.198 MMBbls
Recovery factor = 14.82 %
Following table contains the summay of results of different solution technique parameters.
Case Test P1 P2 P3 P4 P5 P6 UR %
15 10 Impes 1 2 7 30 0.01 34.75
17 10B Fully Im 1 2 10 30 0.01 28.86
18 10C Impes 2 2 7 100 0.001 14.78
19 10D Fully Im 2 2 7 100 0.001 15.43
20 10E Impes 2 2 7 100 0.01 14.77
21 10F Impes 2 2 7 30 0.01 14.77
22 10G Impes 3 2 7 30 0.01 31.67
23 10GR Impes* 3 2 7 30 0.01 32.09
24 10H Impes* 4 2 7 30 0.01 14.79
25 10D** 14.82
*version 2009 received 17 July 2009 was used for tests 10GR and 10H ** E100 software was used The analysis of the above table consisting of 9 detail Merlin runs using version 2008 and 2009 demonstrates that parameter P2, Max Outer Iteration, is a crutial parameter and the system is only stable and perform comparable results with E100 software for P2 equal to Even Numbers, 2, 4, etc. The system will be unstable and produce erroneous results on numbers 1, 3, etc. This behaviour should be reported to the Merlin owner (Gemini Solutions). The E100 recovery factor is closer to case 24 but the trend of gas and water

36
production makes it similar to case 19 with higher recovery factor and fully implicit option with P2=2.
4. Simulation results The input data and simulation results and xls sheets demonstrating production profiles are saved on I: drive as: I:\Resources Branch\Software\Gemini_Merlin_Tests Each tests’ files are saved on a folder under 2006, 2008 and 2009 folder names. Production / Injection data exported in xls files are saved in folder “XLSGraphsV6V8V9”. All files except xls files are only accessable through Merlin simulation software.
5. Conclusions and recommendations:
We have designed and run 25 simulation cases on a conceptual model of about
50,000 grid cells in 8 layers with gas, oil and water present in the model. Three
versions of Merlin software (2006, 2008 and 2009 versions) were used for running
these tests. Out of these 25 cases, three were run on professional expensive
software for comparison. The comparison of the resultsof these 3 cases shows that
the difference between UR results is less than 5 per cent (1.6%, 1.05% and 4.1%).
Of course, the options availabe in expensive softwares are not comparable with
Merlin but the similar simple cases run on both softwares produce almost the same
results. The Merlin is simple to use and very user friendly and can be easily used
for simulation of new exploration fields and small to medium developed fields
with not too much complexity. It is very suitable for learning simulation processes
and concepts for unexprienced employed engineers.
It is recommended to maintain this software and provide incentives for young
engineers to use it for the purpose of acquiring necessary experience to be able to
use professional simulators.

37
6. Production performance plots


