Merger Vote; Reinstating SXL with Outperform REINSTATEMENT ...
39
DISCLOSURE APPENDIX AT THE BACK OF THIS REPORT CONTAINS IMPORTANT DISCLOSURES, ANALYST CERTIFICATIONS, LEGAL ENTITY DISCLOSURE AND THE STATUS OF NON-US ANALYSTS. US Disclosure: Credit Suisse does and seeks to do business with companies covered in its research reports. As a result, investors should be aware that the Firm may have a conflict of interest that could affect the objectivity of this report. Investors should consider this report as only a single factor in making their investment decision. 28 February 2017 Americas/United States Equity Research Master Limited Partnerships Energy Transfer 4Q16 Review (ETE | ETP | SXL | SUN) REINSTATEMENT Research Analysts John Edwards, CFA 713 890 1594 [email protected] Bhavesh Lodaya 212 325 2337 [email protected] Dylan Nassano 212 325 8375 [email protected] Strong Momentum Going Into The SXL/ETP Merger Vote; Reinstating SXL with Outperform View From the Top: February 2017 has been an interesting month for the Energy Transfer franchise. Two mega growth projects in Rover and DAPL received their final regulatory approvals and SXL/ETP announced a slate of new growth projects signifying a bullish outlook for the group. Earlier this month, SXL announced the construction start-up of the 275 Mbpd Mariner East 2 and now expects the 250 Mbpd Mariner East 2 expansion to go on the floors post completion of the open season. Apart from these Marcellus focused projects, SXL also announced development of the 300 Mbpd Permian Express III. Keeping in theme with additional Permian basin takeaway projects announced recently by SXL’s competitors to take advantage of the 400-500 Mbpd of annual crude oil production growth out of the basin. This project will take SXL’s aggregate Permian takeaway capacity to 1 MMbpd. Separately, ETP announced a new 200 MMcf/d Arrowhead processing plant in Reeves county and a fifth 120 Mbpd Lone Star NGL fractionator along with related infrastructure. These announcements are expected to provide added impetus to the prospects of the combined SXL/ETP going into the April merger vote, showcasing the growth potential of the combined enterprise. ETE is expected to be a direct beneficiary of this underlying growth as the combined MLPs would be able to capture additional growth projects and derive synergistic benefits of the combined asset platform. In our view, the success of the merger would ultimately come down to mgmt.’s ability to execute on its growth initiatives, extract synergies and manage the balance sheet to protect the I/G rating. With respect to SUN, the focus clearly moves to disciplined and efficient operations in order to rationalize costs and balance distribution coverage and leverage. On simplification, which seems to be the flavor of the season, ETE did indicate that an eventual roll-up cannot be ruled out but is presently premature. Individual stock-specific takeaways are detailed below. ■ Reinstating Coverage of SXL with Outperform; Reiterating Outperform on ETE / ETP / SUN: After being restricted since the announcement of the DAPL stake sale (in August 2016), we are now reinstating coverage of SXL with a $31 TP and Outperform rating (~32% total return). We are raising our TP for ETE to $22 (from $20) and reiterate our $45 TP for ETP and $30 TP for SUN. We remain at an Outperform rating for the three stocks. Our current valuations for SXL and ETP are based on their standalone operations without giving any effect to the proposed merger. Per our SXL+ETP merger accretion math (details inside), we derive a $34 valuation for the combined entity (at the SXL level) implying ~44% NTM total return supportive of an Outperform rating for SXL (ETP is expected to merge into SXL with SXL being the surviving entity).
Transcript of Merger Vote; Reinstating SXL with Outperform REINSTATEMENT ...

DISCLOSURE APPENDIX AT THE BACK OF THIS REPORT CONTAINS IMPORTANT DISCLOSURES, ANALYST CERTIFICATIONS, LEGAL ENTITY DISCLOSURE AND THE STATUS OF NON-US ANALYSTS. US Disclosure: Credit Suisse does and seeks to do business with companies covered in its research reports. As a result, investors should be aware that the Firm may have a conflict of interest that could affect the objectivity of this report. Investors should consider this report as only a single factor in making their investment decision.
28 February 2017Americas/United States
Equity ResearchMaster Limited Partnerships
Energy Transfer 4Q16 Review (ETE | ETP | SXL | SUN) REINSTATEMENTResearch Analysts
John Edwards, CFA713 890 1594
Bhavesh Lodaya212 325 2337
Dylan Nassano212 325 8375
Strong Momentum Going Into The SXL/ETP Merger Vote; Reinstating SXL with OutperformView From the Top: February 2017 has been an interesting month for the Energy Transfer franchise. Two mega growth projects in Rover and DAPL received their final regulatory approvals and SXL/ETP announced a slate of new growth projects signifying a bullish outlook for the group. Earlier this month, SXL announced the construction start-up of the 275 Mbpd Mariner East 2 and now expects the 250 Mbpd Mariner East 2 expansion to go on the floors post completion of the open season. Apart from these Marcellus focused projects, SXL also announced development of the 300 Mbpd Permian Express III. Keeping in theme with additional Permian basin takeaway projects announced recently by SXL’s competitors to take advantage of the 400-500 Mbpd of annual crude oil production growth out of the basin. This project will take SXL’s aggregate Permian takeaway capacity to 1 MMbpd. Separately, ETP announced a new 200 MMcf/d Arrowhead processing plant in Reeves county and a fifth 120 Mbpd Lone Star NGL fractionator along with related infrastructure. These announcements are expected to provide added impetus to the prospects of the combined SXL/ETP going into the April merger vote, showcasing the growth potential of the combined enterprise. ETE is expected to be a direct beneficiary of this underlying growth as the combined MLPs would be able to capture additional growth projects and derive synergistic benefits of the combined asset platform. In our view, the success of the merger would ultimately come down to mgmt.’s ability to execute on its growth initiatives, extract synergies and manage the balance sheet to protect the I/G rating. With respect to SUN, the focus clearly moves to disciplined and efficient operations in order to rationalize costs and balance distribution coverage and leverage. On simplification, which seems to be the flavor of the season, ETE did indicate that an eventual roll-up cannot be ruled out but is presently premature. Individual stock-specific takeaways are detailed below.■ Reinstating Coverage of SXL with Outperform; Reiterating Outperform
on ETE / ETP / SUN: After being restricted since the announcement of the DAPL stake sale (in August 2016), we are now reinstating coverage of SXL with a $31 TP and Outperform rating (~32% total return). We are raising our TP for ETE to $22 (from $20) and reiterate our $45 TP for ETP and $30 TP for SUN. We remain at an Outperform rating for the three stocks. Our current valuations for SXL and ETP are based on their standalone operations without giving any effect to the proposed merger. Per our SXL+ETP merger accretion math (details inside), we derive a $34 valuation for the combined entity (at the SXL level) implying ~44% NTM total return supportive of an Outperform rating for SXL (ETP is expected to merge into SXL with SXL being the surviving entity).

28 February 2017
Energy Transfer 4Q16 Review (ETE | ETP | SXL | SUN) 2
Stock-specific TakeawaysEnergy Transfer Equity (ETE)■ Earnings Debrief: ETE reported in line DCF of $299mm and it was positive to see
SG&A coming in substantially lower than prior quarters ($8mm for 4Q16 vs. $24mm/Q average for 9M16).
■ Estimates: Our net cash available for distribution forecasts for ETE move up by ~1%/2%/3% in 2017/18/19 driven by higher general partner distributions tied to higher equity issuance assumptions at ETP and SUN. We have not made any changes to our distribution forecasts for ETE and continue to expect distribution growth resumption in 2Q18.
■ Valuation: Our target price for ETE moves to $22 from $20, based on an equal weighted blend of P/DCF and 3-stage DDM. Our valuation implies a 23% upside supporting our Outperform rating on the stock.
Energy Transfer Partners (ETP)■ Earnings Debrief: ETP’s core business EBITDA of $960mm came in 4% below our
$999mm estimate, while overall EBITDA of $1,433mm was below us and the Street. This was primarily driven by weaker than expected performance of the midstream and interstate natural gas segments. ETP raised its 2017 growth capex guidance by ~$900mm to $2.8Bn, which reflects the addition of a fifth 120 Mbpd Lone Star fractionator with related infrastructure (September 2018 in service), a 200 MMcf/d Arrowhead natural gas processing plant (3Q17 in service) and full financing for the Rover pipeline. Frac 5 is fully subscribed by LT fee-based contracts. During 1Q17, ETP realized ~$1.8Bn of additional liquidity through the $1.2Bn proceeds from the Bakken pipeline stake sale and ~$570mm of equity issuance to ETE. Additional funding needs in 2017 are expected to be derived from ATM issuances and revolver borrowings. Rover pipeline – ETP has received 90% of tree clearing permits with the balance expected to be received this week. This should allow ETP to begin construction by March 1st and meet the July 2017 Phase 1 and November 2017 Phase 2 in service for the pipeline. Its 2017 capex budget includes full financing for the Rover pipeline and does not include any project financing. DAPL – the pipeline is 99% complete and ETP expects to place the pipe in service during 2Q17. ETP expects to start realizing full demand charges prior to June 1st from the project. With an open season currently underway, ETP is optimistic of contracting an additional 100 Mbpd on DAPL. Permian -- ETP’s midstream platform can realize 15-20% of volumetric growth driven by the ramp up in Permian production volumes. IDR Waivers -- During 2017, ETP benefits from $626mm in ETE IDR waivers before rolling off to $138mm/$128mm in 2018/19. The waivers during 2017 would be the highest for any fiscal year provided by ETE.
■ Estimates: Our EBITDA estimates move ~3%/2% lower in 2017/18, primarily driven by volumes which came in below forecast during Q4. We now model a full contribution from the Bakken pipeline (DAPL+ETCO) in 3Q17 and have added contribution from the Arrowhead plant and Frac 5 to our estimates. We have not made any changes to our distribution forecasts and continue to expect resumption of distribution growth beginning 1Q19, when leverage moves below 4.5x. We expect ETP to continue to make use of its ATM program and model $150mm of additional equity issuance in 2017 and $400mm/year in 2018/19. This would enable ETP to lower total debt leverage from ~5.5x in 4Q16, to 4.9x in 2017, 4.6x in 2018 and 4.4x in 2019. Higher than anticipated volumetric growth from additional Permian basin opportunities would move our EBITDA estimates higher and materially lower leverage to ~4x.
28 February 2017
Energy Transfer 4Q16 Review (ETE | ETP | SXL | SUN) 3
■ Valuation: We are reiterating our $45 target price and Outperform rating on ETP. Our target price implies ~31% NTM total return, above the median for our coverage group, supporting our Outperform rating. Our valuation is based on an equal weighted blend of EV/EBITDA, P/DCF and 3-stage DDM.
Sunoco Logistics Partners (SXL)■ Earnings Debrief: Although SXL reported earnings below the Street ($327mm vs.
$339mm), mgmt. provided insight into new growth projects that should drive ratable earnings growth. In October 2016, SXL fixed the cold box design issues at Mariner East 1 and was able to flow the full 70 Mbpd of capacity on the pipeline, up from 55 Mbpd in the prior quarters. SXL remains bullish on the prospects of US crude production out of the Permian and announced a new 300 Mbpd Permian Express III pipeline, which will take its aggregate Permian takeaway capacity to 1 MMbpd once complete. The pipeline is expected to come online in Phases with 100 Mbpd of Phase 1 capacity in mid-2017 and 200 Mbpd of Phase 2 capacity in 4Q18. SXL will be launching an open season for the pipeline in the next few months. SXL is well placed to capitalize on the incremental growth in the Permian following its JV with Exxon Mobil (XOM), that recently acquired 250,000 acres in the Delaware basin, close to SXL’s Delaware basin pipeline. SXL is XOM’s preferred midstream partner in the region. In order to cater to the growth in crude volumes, SXL plans to expand its Nederland terminal as well, that will include additional storage and dock enhancements. Other than the crude project, SXL confirmed it has enough commitments on the 250 Mbpd Mariner East 2 expansion project and we expect final details related to in-service timelines after completion of the ongoing open season for shipper commitments. The 275 Mbpd Mariner East 2 project received final permits and is under construction and expected to be complete in end-3Q17. This pipeline can be further expanded to 450 Mbpd. SXL would start deriving cash flows from DAPL in 2Q17 tied to its 15.30% stake. The $800mm cash infusion from the close of 49% of its stake in DAPL (was 30%) would enable SXL to de-lever and fund growth projects. ETE has provided SXL with an aggregate $60mm in IDR waivers, spread on a quarterly basis between 3Q16 through 2Q18.
■ Estimates: Coming off restriction we now expect SXL EBITDA of ~$1.65Bn/$1.95Bn/$2.2Bn in 2017/18/19, which includes the 3Q17 in service of the Mariner East 2 and Phase 1 of the Permian Express III projects. We forecast a 4Q18 in service for the Mariner East 2 expansion project. We expect SXL to grow distributions by ~10% annually and while SXL did not lay out capex guidance for 2017, we forecast total capex of ~$1.1Bn, including ~$84mm on maintenance. We forecast leverage of 4.3x/4.0x/3.8x for 2017/18/19 which includes 30%/70% equity and debt financing.
■ Valuation: We are reinstating coverage on SXL with a $31 target price and an Outperform rating, driven by ~32% NTM total return. Our valuation is based on an equal weighted blend of EV/EBITDA, P/DCF and 3-stage DDM.
Sunoco LP (SUN)■ Earnings Debrief: SUN’s $154mm 4Q16 EBITDA was substantially below us and the
Street. The weak 4Q performance was largely attributed to declining merchandise sales across its c-store footprint, although fuel sales/margins were ahead of estimates. Merchandise margins came in at 29.9% during 4Q16 vs. ~32% average during the year. Mgmt. attributed this to promotional activity at c-stores, which have now concluded and expect margins to move up to a more normalized 31-32%. Although SUN did not disclosed the actual promotional cost impact, we estimate this to be ~$10-12mm based on the merchandise gross profit during the quarter. While SUN has been

28 February 2017
Energy Transfer 4Q16 Review (ETE | ETP | SXL | SUN) 4
holding fuel market share among peers, mgmt. did acknowledge the fact that demand is expected to be flat going into 2017 and difficulties being faced by its stores in the oil producing regions of TX is expected to continue. This is primarily due to E&P efficiencies that requires lesser manpower than before negatively impacting customer counts at its C-stores. Mgmt.’s key initiatives during 2017 are focused on de-leveraging and distribution coverage management. These include ~$75mm in cost reductions, use of the $400mm ATM program, proceeds from sale of real estate (~100 C-stores/vacant land identified for sale), lower growth capex ($200mm target), lower maintenance capex than its $90mm target for 2017 and finally higher EBITDA from ~100 NTI sites opened since 2014. $27mm of the $75mm cost reduction includes $18mm in relocation costs and $9mm acquisition costs that would not appear in 2017. This leaves ~$48mm of costs to be eliminated during 2017. Growth capex during 2017 is expected to be spent on construction of just one NTI store and rebuilding/rebranding of stores along the Indiana toll road. While mgmt. has not specified the expected proceeds from the real estate sale, we expect it to generate ~$170-215mm. This is based on a 6-8x multiple on ~$0.35mm EBITDA per store (smaller than the newly developed ones) for the 65 C-stores and ~$1mm average assumed valuation for each of the 34 vacant properties. Our model assumes a 2Q sale at 7x for ~$193mm in proceeds ($350,000*65*7x) + ($1mm*34). SUN would be evaluating bids related to the sale over the next few weeks. With respect to sponsor support, ETE indicated that they remain open to supporting the growth at SUN but noted that the partnership had to work toward rationalizing its cost structure and operations.
■ Estimates: We continue to forecast normalized retail ($0.23-0.25/gal) and wholesale ($0.06-0.08/gal) margins. While our fuel volume and margin assumptions are relatively unchanged, our EBITDA forecasts move ~3% lower between 2017-19 due to 100bps lower merchandise margin estimates. We now forecast LT merchandise margins of 31.5% vs. 32.5%, based on mgmt.’s 31-32% guidance. Since, SUN indicated plans to make use of their $400mm ATM program, we now model ~$200mm of equity issuance in 2017, and $100mm/yr. in 2018/19. This should enable SUN to bring leverage down from 6.5x in 4Q16, to 5.5x in 2017, 5.1x in 2018 and 4.8x in 2019. We continue to forecast flat payouts at $0.8255/unit/Q for SUN due to the elevated leverage and do not foresee distribution growth until leverage moves to a 4-4.5x range in the long term.
■ Valuation: We are reiterating our $30 target price and Outperform rating on SUN. Our target price implies ~21% NTM total return, above the median for our coverage group, supporting our Outperform rating. Our valuation is based on an equal weighted blend of EV/EBITDA, P/DCF and 3-stage DDM.
SXL/ETP Merger Accretion MathSXL filed its second amendment to the S-4 a few weeks back. The record date for the merger has been set for 2/27, and mgmt. anticipates proxy to be mailed to unitholders in early March. The ETP unitholder vote and subsequent closure of merger is expected in mid-April. Per mgmt. integration teams are currently fully engaged in the integration, planning process, and are identifying cost and commercial synergies.
The accretion math, indicated below is based on our estimates for ETP and SXL.
■ Over the three years the merger is ~$0.75/unit or ~29% accretive to SXL unitholders and dilutive to ETE in year one (~10%) and year two (-6%) and ~3% accretive in year three. Importantly, the transaction consolidates the execution and funding of major Energy Transfer projects under one roof – Bakken pipeline, Rover pipeline, Revolution system and Mariner East 2/2X pipeline (~$6-8Bn combined capex for their share), all expected to be placed in service during 2017-18. This is expected to drive annual synergies of ~$200mm/yr. for the combination by 2019.

28 February 2017
Energy Transfer 4Q16 Review (ETE | ETP | SXL | SUN) 5
■ The combined pre-deal leverage improves from 4.9/4.6/4.4x (2017-19) to 4.9/4.3/4.0x post-merger with improvement from synergies and lower cost of equity financing (SXL yields ~8% vs. ~11% for ETP). We model 50% debt and equity financing for ETP related capex at the SXL level post the merger.
■ Post deal SXL’s total unit count is estimated to move up to ~1.1Bn, which includes the retirement of 67.1mm SXL units currently owned by ETP. We estimate distribution coverage of ~1.3x (year 2 post deal) vs. ~1.06x for SXL and ~1.03x for ETP based on our current estimates.
Figure 1: SXL ETP Merger Accretion
SXL Buys ETP Annual Accretion / (Dilution) 2017E 2018E 2019EETP common units o/s (mm) 551.6 DCF/unit $2.31 $2.60 $2.83SXL units o/s (mm) excl. Class B 332.4 LP Distribution per Unit $2.23 $2.47 $2.71ETP to SXL conversion ratio 1.50x %y/y growth 10% 11% 10%= New SXL units issued 827.3 GP Distribution per Unit $1.50 $1.78 $2.07- SXL units owned by ETP (retired) 67.1 Incremental LP Dist (adj. for retired units) $1,815 $1,934 $2,102= SXL units o/s (mm) 1,092.6 Incremental GP Dist (adj. for retired units) $1,220 $1,397 $1,602
SXL unit price (30-day avg VWAP) $26.52 ETP capex $2,800 $1,200 $800SXL unit price (Nov 18 2016 close) $26.19 Debt funded $1,400 $600 $400SXL yield (Nov 18 2016 close) 7.9% Equity funded ($mm) $1,400 $600 $400
Equity funded (mm units) 53.5 22.9 15.3ETP unit price (30-day avg VWAP) $36.13 Effective SXL units o/s 1,146.1 1,169.0 1,184.3ETP unit price (Nov 18 2016 close) $39.37ETP yield (Nov 18 2016 close) 10.7% ETP EBITDA $4,974 $5,620 $5,888
Effective multiple 9.3x 8.2x 7.8x= Effective ETP takeout price $39.29 - Maintenance Capex (ETP) $345 $355 $365Premium / discount (30-day avg) 8.7% = DCF (before financing) $4,629 $5,265 $5,523
Conversion ratio (30-day avg VWAP) 1.36x - Incremental Interest Expense (ETP debt) $1,159 $1,159 $1,159Premium / discount (Nov 18 2016 close) -0.2% - Incremental Interest Expense (new debt) $67 $29 $19
Conversion ratio (Nov 18 2016 close) 1.50x - Incremental LP Dist (adj. for retired units) $1,815 $1,934 $2,102- Incremental GP Dist (adj. for retired units) $1,220 $1,397 $1,602
= ETP equity value ($mm) $21,668 + Synergies ($200mm by 2019) $100 $150 $200ETP market cap (current) $20,464 + ETP DCF from unconsol affiliates $420 $420 $420
+ ETP IDR waivers flowing to SXL $626 $138 $128ETP Debt o/s (standalone) $24,403 + PTXP LP+GP distributions $34 $40 $46ETP Takeout EV $46,071 = Accretion / (Dilution) $1,548 $1,493 $1,435
ETP Capex Funding - GP Share of Accretion / (Dilution) $622 $626 $621% Debt Financed 50% GP Splits 40% 42% 43%% Equity Financed 50% = LP Accretion / (Dilution) $926 $867 $814Rate of interest 4.75%SXL unit issue price $26.19 = $ Accretion / (Dilution) per unit $0.81 $0.74 $0.69
= DCF % Accretion / (Dilution) per unit 34.9% 28.5% 24.3%DCF per unit (post deal) $3.12 $3.34 $3.52
SXL Accretion Analysis
Source: Company data, Credit Suisse estimates

28 February 2017
Energy Transfer 4Q16 Review (ETE | ETP | SXL | SUN) 6
Figure 2: Post deal leverage and distribution metrics for SXL
Figure 3: Change in LP cash distributions for ETP unitholders
Leverage Metrics 2017E 2018E 2019ESXL pre-deal EBITDA $1,648 $1,948 $2,198+ EBITDA from ETP acquisition $4,974 $5,620 $5,888SXL post-deal EBITDA $6,622 $7,568 $8,086
SXL Debt $7,157 $7,806 $7,821+ Debt from ETP acquistion $24,403 $24,403 $24,403+ ETP capex debt $1,400 $600 $400SXL post-deal Debt $32,960 $32,809 $32,624
Post Deal Leverage 4.9x 4.3x 4.0xPre Deal (SXL) 4.3x 4.0x 3.8xPre Deal (ETP standalone) 4.7x 4.4x 4.3xPre Deal (ETP + SXL) 4.9x 4.6x 4.4x
Distribution Coverage Metrics 2017E 2018E 2019ESXL DCF pre-deal $1,341 $1,621 $1,847SXL Distributions pre-deal $1,283 $1,527 $1,755SXL distribution coverage pre-deal 1.04x 1.06x 1.05xETP distribution coverage pre-deal 1.01x 1.03x 1.05x
SXL DCF post deal $5,298 $6,308 $6,857SXL Distributions post deal $3,692 $4,721 $5,331SXL + ETP combined post deal 1.43x 1.34x 1.29x
Distributions to ETP unitholders 2017E 2018E 2019EPre DealETP units o/s 551.6 551.6 551.6ETP unitholder Dist/unit $4.22 $4.22 $4.32ETP unitholder Distributions $2,328 $2,328 $2,383
Post DealSXL units issued in lieu of ETP units 827.3 827.3 827.3SXL unitholder Distribution/unit $2.23 $2.47 $2.71SXL unitholder Distributions $1,845 $2,043 $2,242Distributions Increase / (Decrease) -$483 -$284 -$141% Downside -21% -12% -6%
Source: Company data, Credit Suisse estimates Source: Company data, Credit Suisse estimates

28 February 2017
Energy Transfer 4Q16 Review (ETE | ETP | SXL | SUN) 7
ETE Accretion MathFigure 4: SXL ETP Merger Accretion – Impact to ETE Unitholders
ETP / SXL Ownership Annual Accretion / (Dilution) 2017E 2018E 2019EPre-deal ETP units owned 18.4 ETE DCF/LP unit $1.27 $1.73 $1.91
ETE Distribution / unit $1.14 $1.26 $1.58Pre-deal SXL units owned 0.0 ETP Distribution / unit $4.22 $4.22 $4.32Post-deal SXL units owned 27.6 SXL Distribution / unit $2.23 $2.47 $2.71
ETE units o/s (2017) 1,079.2 ETE AccretionETE units o/s (2018 and beyond) 1,158.2 Pre-deal DCF $1,368 $2,003 $2,208
ETP LP distributions $78 $78 $79ETP GP distributions $896 $1,405 $1,498ETP Class H (90% of SXL GP) $464 $576 $683- ETP cash flow prior to deal $1,438 $2,059 $2,260
SXL LP distributions $61 $68 $75100% SXL GP distrbutions (existing units) $516 $640 $759Incremental SXL GP Distributions (from deal) $1,220 $1,397 $1,602- ETP IDR waivers $626 $138 $128+ SXL cash flow post deal $1,172 $1,968 $2,308
= Post-deal DCF $1,103 $1,912 $2,255DCF per unit (post deal) $1.02 $1.65 $1.95
= $ Accretion / (Dilution) -$266 -$91 $47= DCF $ Accretion / (Dilution) per unit -$0.25 -$0.08 $0.04= DCF % Accretion / (Dilution) per unit -21.6% -6.2% 2.6%
Distribution Coverage Metrics 2017E 2018E 2019EETE distribution coverage pre-deal 1.36x 1.45x 1.20xETE distribution coverage post deal 0.90x 1.31x 1.23x
ETE Accretion Analysis
Source: Company data, Credit Suisse estimates

28 February 2017
Energy Transfer 4Q16 Review (ETE | ETP | SXL | SUN) 8
Implied Valuation for the Combined Entity
Figure 5: SXL Valuation post-Merger2019E Multiple EV
EBITDA Low Base High Low Base HighEV/EBITDA 8,086 10.5x 11.5x 12.5x 84,902 92,988 101,074Less: 2019 Net Debt 32,624 32,624 32,624Total Equity Value 52,278 60,364 68,450
Units TPAdd: SUN ownership 43.5 $30 1,305 1,305 1,305Net Equity Value 53,583 61,669 69,755SXL LP Take % 57% 57% 57%Units O/S 1,184 1,184 1,184Price/Unit - 2019 $26 $30 $33Discount Factor 0.84Price/Unit - NTM $22 $25 $28
2019E MultipleDCF/unit Low Base High Low Base High
Price/DCF $3.52 11.0x 12.0x 13.0x $39 $42 $46Discount Factor 0.84Price/Unit - NTM $33 $36 $39
Discount RateLow Base High Low Base High
3-Stage DDM 10.0% 9.0% 8.0% $38 $43 $50
Average Target Price - SXL+ ETP combined $31 $34 $39Distribution/unit (12-mo out) $2.32Yield (12-mo out) 6.8%Current Price $25.27Total Return (NTM) 44%
Metric
Source: Company data, Credit Suisse estimates
28 February 2017
Energy Transfer 4Q16 Review (ETE | ETP | SXL | SUN) 9
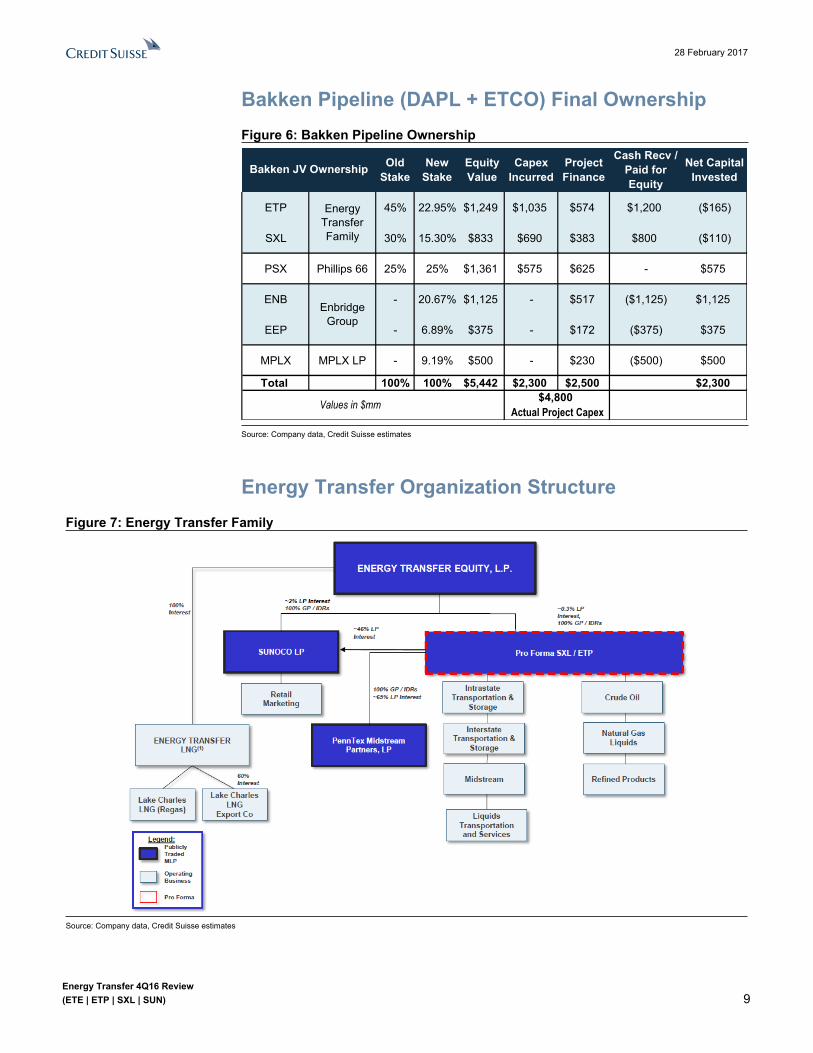
Bakken Pipeline (DAPL + ETCO) Final OwnershipFigure 6: Bakken Pipeline Ownership
Old Stake
New Stake
Equity Value
Capex Incurred
Project Finance
Cash Recv / Paid for Equity
Net Capital Invested
ETP 45% 22.95% $1,249 $1,035 $574 $1,200 ($165)
SXL 30% 15.30% $833 $690 $383 $800 ($110)
PSX Phillips 66 25% 25% $1,361 $575 $625 - $575
ENB - 20.67% $1,125 - $517 ($1,125) $1,125
EEP - 6.89% $375 - $172 ($375) $375
MPLX MPLX LP - 9.19% $500 - $230 ($500) $500
Total 100% 100% $5,442 $2,300 $2,500 $2,300
Energy Transfer Family
Bakken JV Ownership
Enbridge Group
$4,800Values in $mm Actual Project Capex
Source: Company data, Credit Suisse estimates
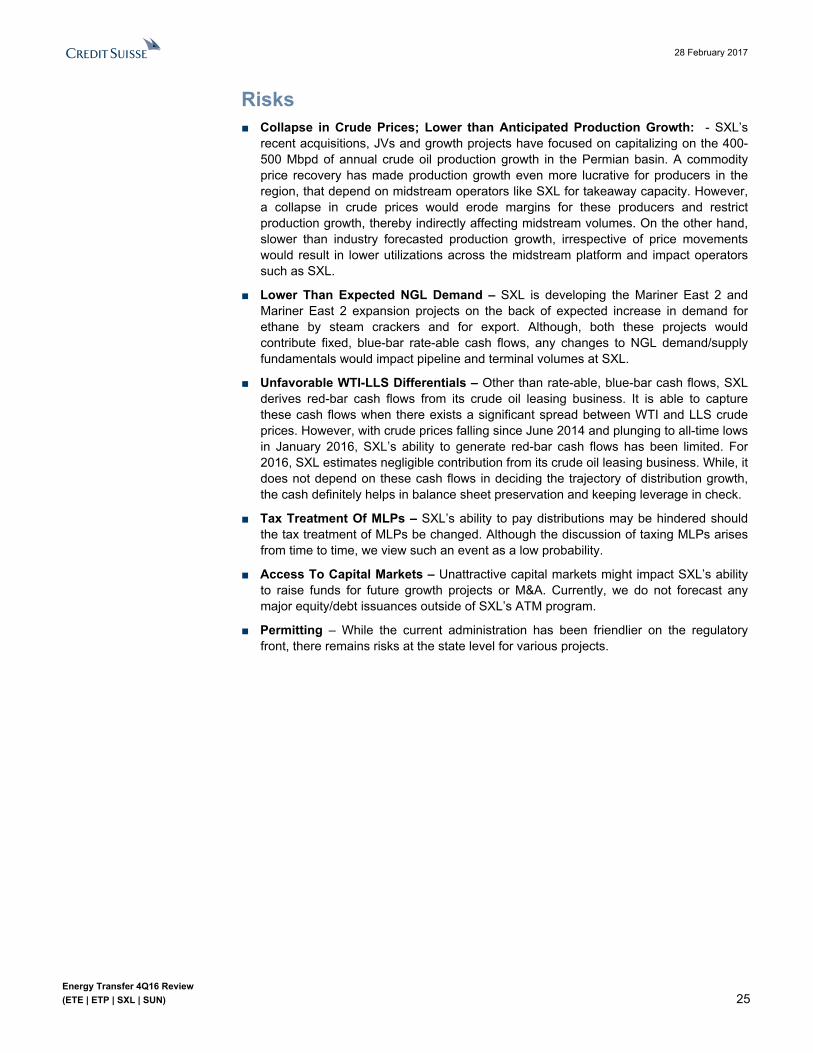
Energy Transfer Organization StructureFigure 7: Energy Transfer Family
Source: Company data, Credit Suisse estimates

28 February 2017
Energy Transfer 4Q16 Review (ETE | ETP | SXL | SUN) 10
Americas/United StatesMaster Limited Partnerships
Energy Transfer Equity, LP (ETE)Rating OUTPERFORM [V]Price (27-Feb-17, US$) 18.96Target price (US$) (from 20.00) 22.0052-week price range (US$) 19.86 - 6.45Market cap (US$ m) 19,850.12Adjusted EV -Target price is for 12 months.[V] = Stock Considered Volatile (see Disclosure Appendix)
Research Analysts
John Edwards, CFA713 890 1594
Bhavesh Lodaya212 325 2337
Dylan Nassano212 325 8375
Raising TP to $22; Reiterate Outperform■ Investment Thesis: ETE has four sources of cash flow: (1) LP + GP
distributions from ETP; (2) 90% of SXL GP + IDRs via ETP Class H units; (1) LP + GP distributions from SUN; (4) 100% ownership of the Lake Charles terminal business. ETP accounts for the majority of ETE’s DCF.
■ Estimates: Our net cash available for distribution forecasts for ETE move up by ~1%/2%/3% in 2017/18/19 driven by higher general partner distributions tied to higher equity issuance assumptions at ETP and SUN. We have not made any changes to our distribution forecasts for ETE and continue to expect distribution growth resumption in 2Q18.
■ Valuation: Our target price for ETE moves to $22 from $20, based on an equal weighted blend of P/DCF and 3-stage DDM. Our valuation implies a 23% upside supporting our Outperform rating on the stock.
■ Risks: Risks include subsidiary business risks, extension of IDR waivers, tax treatment of MLPs, Liquefaction Project Risks, volumetric slowdown resulting from a commodity price downturn and access and cost of capital.
Share price performance
ET E.N S& P 5 0 0 IN D EX
A p r - 1 6 Ju l - 1 6 O ct - 1 6 Jan - 1 75
1 0
1 5
2 0
On 27-Feb-2017 the S&P 500 INDEX closed at 2370.1Daily Feb26, 2016 - Feb27, 2017, 02/26/16 = US$6.81
DCF/LP Unit Q1 Q2 Q3 Q42016A 0.33 0.26 0.27 0.292017E 0.31 0.31 0.32 0.322018E 0.45 0.43 0.44 0.45
Financial and valuation metricsYear 12/16A 12/17E 12/18E 12/19EEBITDA (US$ m) 3,634 6,257 6,856 7,386Distribution/unit- DPU (US$ m) 1.14 1.14 1.26 1.58Earnings/unit - EPU (US$) 0.91 0.98 1.18 1.38Prev. Earnings/unit - EPU (US$) 0.97 1.33 1.54 1.67EPU - consensus (US$) 0.99 1.15 1.61 1.54Distribution coverage (x) 1.24 1.36 1.45 1.20P/DCF (x) 16.8 15.0 11.0 9.9Adj. current EV/EBITDA (x) - - - -
DPU (US$) 1.14 Distribution yld (%) 6.0Units outstanding (m) 1,047 GP take (%) -Net debt current (US$ m) 41,355.9 Net debt/EBITDA (x) -6-month ADV (000's) 1,419 Net debt/market cap. (%) -Free float (%) 72 Institutional ownership (%) -Source: Company data, Thomson Reuters, Credit Suisse estimates

28 February 2017
Energy Transfer 4Q16 Review (ETE | ETP | SXL | SUN) 11
Energy Transfer Equity, LP (ETE)Price (27 Feb 2017): US$18.96; Rating: OUTPERFORM [V]; Target Price: (from US$20.00) US$22.00; Analyst: John EdwardsMLP Distributable Cash Flow (DCF)
12/16A 12/17E 12/18E 12/19E
Adjusted EBITDA 3,633.8 6,256.5 6,855.8 7,386.3(-) Maintenance Capex - - - -(-) Cash Interest Expenses 1,832.0 1,887.2 1,956.1 1,981.4(+/-) Other Adjustments 595.7 3,000.8 2,896.5 3,197.1Total Distributable Cash Flow (US$) 1,206.1 1,368.5 2,003.1 2,207.8(-) General Partner Adjustments 0.0 0.0 0.0 0.0DCF to limited partners 1,206.07 1,368.49 2,003.11 2,207.80DCF per LP unit (US$) 1.15 1.27 1.73 1.91Cash Distribution Declared Per Unit (US$)Distribution coverage (x) 1.24 1.36 1.45 1.20DCF/LP Unit Q1 Q2 Q3 Q42016A 0.33 0.26 0.27 0.292017E 0.31 0.31 0.32 0.322018E 0.45 0.43 0.44 0.45Capex 12/16A 12/17E 12/18E 12/19EExpansion Capex - - - -Acquisitions (1,570.0) .0 .0 .0Maintenance capex - - - -Cash Flow 12/16A 12/17E 12/18E 12/19ENet income (US$) 758.8 1,058.3 1,329.0 1,599.6DD&A 2,359.0 2,712.3 2,779.9 2,822.8Change in working capital (61.0) .0 .0 .0Other cash & non-cash items 2,203.2 787.4 739.8 711.2Cash flow from operations 3,417.0 4,331.6 4,815.7 5,274.7Free cashflow to the firm (4,675.0) 986.6 3,100.7 3,949.7Other investment/(outflows) 152.0 116.0 116.0 116.0Cash flow from investments (9,467.0) (3,229.0) (1,599.0) (1,209.0)Net share issue/(repurchase) - - - -Dividends paid (1,022.0) (1,003.7) (1,233.6) (1,750.3)Change in debt 6,657.0 1,737.2 282.9 (49.4)Other financing inflows/outflows 292.0 (1,836.0) (2,266.0) (2,266.0)Cashflow from financing activities 5,927.0 (1,102.6) (3,216.7) (4,065.7)Movements in cash/eq. (123.0) (.0) .0 .0Balance Sheet (US$) 12/16A 12/17E 12/18E 12/19EAssetsCash & cash equivalents 483.0 483.0 483.0 483.0Account receivables 3,604.0 3,604.0 3,604.0 3,604.0Other current assets 607.0 607.0 607.0 607.0Total current assets 6,985.0 6,985.0 6,985.0 6,985.0Total fixed assets 55,438.0 54,347.2 52,978.6 51,190.8Other assets 3,858.0 3,858.0 3,858.0 3,858.0Total assets 79,011.0 77,920.2 76,551.6 74,763.8LiabilitiesAccounts payables 3,544.0 3,544.0 3,544.0 3,544.0Short-term debt .0 .0 .0 .0Other short term liabilities 3,733.0 3,733.0 3,733.0 3,733.0Total current liabilities 7,277.0 7,277.0 7,277.0 7,277.0Long-term debt 42,608.0 43,763.0 44,880.0 45,804.6Other liabilities 6,609.0 6,240.6 5,583.1 4,932.2Total liabilities 56,494.0 57,280.6 57,740.1 58,013.8Minority interests / other 24,211.0 22,029.9 19,994.6 18,105.0Total liabilities and equity 79,011.0 77,920.2 76,551.6 74,763.8Financing Metrics 12/16A 12/17E 12/18E 12/19EEquity issuance - - - -Debt issuance/(repayment) 6,657.0 1,737.2 282.9 (49.4)Leverage (x) - - - -Per share 12/16A 12/17E 12/18E 12/19ENo. of shares (EOP) 1,046 1,075 1,129 1,158Earnings / unit EPU (US$) 0.91 0.98 1.18 1.38DPS (US$) 1.14 1.14 1.26 1.58Book value per share (1.62) (1.29) (1.05) (1.17)Operating cash flow/share 3.27 4.03 4.27 4.55Valuation metrics 12/16A 12/17E 12/18E 12/19EDiv yield (%) 6.0 6.0 6.6 8.3FCF yield (%) (23.2) 4.8 14.5 18.0EV/EBITDA (x) 17.1 10.2 9.6 9.1P/E (x) 20.7 19.3 16.1 13.7Price to book (x) (11.7) (14.7) (18.1) (16.2)Credit ratios 12/16A 12/17E 12/18E 12/19ENet debt/equity (%) 187.1 209.7 236.0 270.6Interest coverage ratio (X) 0.7 1.9 2.1 2.3Dividend payout ratio (%) (10.2) (10.0) (12.3) (17.5)
Company BackgroundEnergy Transfer Equity, L.P. (ETE) is a limited partnership company. The Company has two segments: Investment in ETP and Investment in Regency. ETP injects and holds natural gas in its Bammel storage facility
Blue/Grey Sky Scenario
Our Blue Sky Scenario (US$) 25.00Our blue sky valuation assumes 1.0x higher P/DCF multiples relative to base case and 100bps lower discount rate relative to the base case 3-stage DDM methodology.
Our Grey Sky Scenario (US$) 13.00Our grey sky valuation assumes 1.0x lower P/DCF multiples relative to base case and 100bps higher discount rate relative to the base case 3-stage DDM methodology. Our valuation also takes into account flat distribution payouts and grey sky case for underlying subsidiaries and flat distributions at ETE.
Share price performance
ET E.N S& P 5 0 0 IN D EX
A p r - 1 6 Ju l - 1 6 O ct - 1 6 Jan - 1 75
1 0
1 5
2 0
On 27-Feb-2017 the S&P 500 INDEX closed at 2370.1Daily Feb26, 2016 - Feb27, 2017, 02/26/16 = US$6.81
Source: Company data, Thomson Reuters, Credit Suisse estimates

28 February 2017
Energy Transfer 4Q16 Review (ETE | ETP | SXL | SUN) 12
ETE ValuationOur $22 target price is based on an equal weighted blend P/DCF and 3-stage DDM. Our TP implies ~23% NTM total returns, supporting our Outperform rating on the stock
Figure 8: ETE Blended Valuation2018E Multiple
DCF/unit Low Base High Low Base HighPrice/DCF $1.73 9.0x 10.0x 11.0x $16 $17 $19
Discount RateLow Base High Low Base High
3-Stage DDM 10.5% 9.5% 8.5% $24 $27 $32
Average Target Price $20 $22 $25Distribution/unit (12-mo out) $1.14Yield (12-mo out) 5.2%Current Price $18.87Total Return (NTM) 23%
Source: Company data, Credit Suisse estimates
ETE Changes to EstimatesFigure 9: ETE Estimates Yr ending December 31($ millions, except per unit data)
1Q17E 2Q17E 3Q17E 4Q17E 2017E 2018E 2019E 1Q17E 2Q17E 3Q17E 4Q17E 2017E 2018E 2019EEPU $0.27 $0.32 $0.36 $0.39 $1.33 $1.54 $1.67 $0.18 $0.24 $0.27 $0.28 $0.98 $1.18 $1.38Average Units Outstanding 1,063 1,079 1,079 1,079 1,075 1,129 1,158 1,063 1,079 1,079 1,079 1,075 1,129 1,158
Cash Available for Dividends (DCF)Distributions from ETP
Limited Partner interest 19 19 19 19 78 78 79 19 19 19 19 78 78 79ETP Class H units (SXL 90.05% GP interest) 103 108 117 122 450 556 653 106 112 120 126 464 576 683General Partner interest +IDRs 234 229 227 217 907 1,394 1,477 230 225 225 216 896 1,405 1,498
Distributions from SUNLimited Partner interest 2 2 2 2 7 7 7 2 2 2 2 7 7 7General Partner interest +IDRs 20 20 20 20 81 81 83 21 22 22 22 88 92 94
Lake Charles LNG 45 45 45 45 180 180 180 45 46 45 46 182 182 182Gross Cash Available for Distributions 423 423 431 426 1,703 2,296 2,480 423 426 434 432 1,715 2,340 2,544SG&A Expenses, ex non-cash compensation expense 10 10 10 10 40 40 40 10 10 10 10 40 40 40Management incentive fee 0 0 0 0 0 0 0 0 0 0 0 0 0 0Interest expense, net of amortization 77 73 72 72 294 284 288 77 77 76 76 306 297 296Other expenses 0 0 0 0 0 0 0 0 0 0 0 0 0 0Net Cash Available for Distributions 336 340 348 344 1,369 1,973 2,151 336 339 347 346 1,368 2,003 2,208
Net Cash Available for Distributions per unit $0.31 $0.32 $0.32 $0.32 $1.27 $1.70 $1.86 $0.31 $0.31 $0.32 $0.32 $1.27 $1.73 $1.91
Cash Distribution Declared Per Unit $0.29 $0.29 $0.29 $0.29 $1.14 $1.26 $1.58 $0.29 $0.29 $0.29 $0.29 $1.14 $1.26 $1.58
Distribution Coverage (Total DCF/Total Distribution Declared) 1.34x 1.36x 1.39x 1.37x 1.36x 1.43x 1.17x 1.34x 1.35x 1.38x 1.38x 1.36x 1.45x 1.20x
Old Estimates New Estimates
Source: Company data, Credit Suisse estimates

28 February 2017
Energy Transfer 4Q16 Review (ETE | ETP | SXL | SUN) 13
ETE Risks■ Subsidiary Business Risks – ETE derives its cash flows from ownership of LP + GP
interests in ETP and SUN and ownership of GP interests in SXL. Any difficulties that affect the normal course of business at ETP/SXL/SUN will directly impact their distribution growth ability.
■ Project or financing delays - Further delays in growth project financing and execution at any of ETE’s underlying MLPs will limit their distribution growth potential. This will reduce cash flows for ETE and limit its distribution growth.
■ Extension of IDR Waivers – Currently, ETE provides IDR waivers only to ETP and SXL, which enables ETP/SXL to maintain distributions. Although, this results in a stable cash flow profile for ETE, it ultimately limits distribution growth at ETE. Any extension of waivers to ETP/SXL or provision of new IDR waivers to SUN will reduce distributable cash flow at ETE.
■ Liquefaction Project Risks – The next leg of growth at ETE is expected to be driven by the development of the Lake Charles LNG Liquefaction facility, in which ETE owns 60%. The project is expected to achieve FID in 2017 with first LNG production in 2021. We estimate this project to accrue ~$5/unit in value to ETE unitholders in 2021, though
we do not factor this in our estimated valuation. However, any delays in receipt of approvals or delays in execution will delay the realization of cash flows from the LNG business. Also, any changes in global LNG supply/demand fundamentals by the time the project is placed into service in 2020 could affect the economics of the project. Global LNG supply is expected to peak by the end of the decade.
■ Un-Simplified Cash Flow Source – Although, ETE and its subsidiaries operate within the broader MLP/GP structure, ETE does not operate as pure-play GP and its cash flow is derived from a web of intra company holdings within the Energy Transfer family. Due to this structure, ETE is not fully understood by the market. For example: (1) ETP owns the GP of SXL but accrues only 10% of GP cash flows. The balance 90% flows through ETE, which was made possible through issuance of a new class of ETP units held by ETE. (2) SUN is structured as an MLP but derives ~55% of EBITDA from retail operations which does not qualify as MLP income. SUN is able to stay as an MLP and keep taxes at a minimal level due to the PropCo structure which consolidates the retail c-stores business. Tax Treatment Of Underlying MLPs – ETP/SXL/SUN’s ability to pay distributions may be hindered should the tax treatment of MLPs be changed. Although the discussion of taxing MLPs arises from time to time, we view such an event as a low probability.
■ Commodity Price Risk: Like most of mid-stream there is a strong correlation between valuation multiples and the price of crude, particularly to the downside. With the collapse of talks at the OPEC technical conference a couple of weeks ago, there is significantly less confidence in a deal coming out of the upcoming Nov 30 meeting with respect to help contain global oversupply of crude, which could continue to put downward pressure on the price of crude. In turn, given the correlation of valuation multiples to crude in the midstream including members of the Energy Transfer family, there could be downward pressure on the valuation, negatively impacting the ability of Energy Transfer family members achieving their respective Target Prices over the next 12 months.

28 February 2017
Energy Transfer 4Q16 Review (ETE | ETP | SXL | SUN) 14
ETE 4Q16 Earnings4Q16 In Line Adjusting for ETE Units Issuance and ETP Units Purchase Prior to Declaration of Distribution for 4Q16■ DCF In Line with CS: Net cash available for distribution of $299mm came in slightly
below our $308mm estimate (adj.) and included an $8mm transaction expense. We have adjusted our DCF calculation to give effect to the ~32mm units issued by ETE and the consequent purchase of ~15.8mm units of ETP. These transactions were done prior to record date of 4Q distributions which had an impact on the quarter’s DCF.
■ Distribution of $0.285/unit was in line with us and the Street.
Figure 10: ETE 4Q16 VarianceYr ending December 31($ millions, except per unit data) 4Q16 4Q16 CS Diff Diff (%) 4Q15 Y/Y (%)
Actual Estimate ActualEPU $0.26 $0.26 $0.00 0% $0.30 -13%Average Units Outstanding 1,047 1,047 (0) 0% 1,054 -1%
Cash Available for Dividends (DCF)Distributions from ETP
Limited Partner interest 20 19 1 7% 3 567%ETP Class H units (SXL 90.05% GP interest) 94 97 (3) -3% 77 22%General Partner interest +IDRs 221 235 (14) -6% 304 -27%
Distributions from SUNLimited Partner interest 2 2 0 0% 0 NMGeneral Partner interest +IDRs 20 20 0 0% 17 20%
Lake Charles LNG 46 45 1 2% 49 -6%Gross Cash Available for Distributions 403 418 (15) -4% 450 -10%SG&A Expenses, ex non-cash compensation expense 8 10 (2) -20% 12 -33%Management incentive fee 24 23 1 4% 24 0%Interest expense, net of amortization 80 77 3 3% 75 7%Other expenses 8 0 8 NM 4 100%Net Cash Available for Distributions 299 308 (8) -3% 343 -13%
Net Cash Available for Distributions per unit $0.29 $0.28 $0.01 3% $0.33 -13%
Cash Distribution Declared Per Unit $0.285 $0.285 $0.00 0% $0.29 0%
Distribution Coverage (Total DCF/Total Distribution Declared) 1.19x 1.21x -0.01x -1% 1.15x 4%Source: Company data, Credit Suisse estimates

28 February 2017
Energy Transfer 4Q16 Review (ETE | ETP | SXL | SUN) 15
Americas/United StatesMaster Limited Partnerships
Energy Transfer Partners, LP (ETP)Rating OUTPERFORMPrice (27-Feb-17, US$) 37.68Target price (US$) 45.0052-week price range (US$) 42.85 - 26.40Market cap (US$ m) 20,447.74Adjusted EV -Target price is for 12 months.
Research Analysts
John Edwards, CFA713 890 1594
Bhavesh Lodaya212 325 2337
Dylan Nassano212 325 8375
Reiterate $45 TP and Outperform■ Investment Thesis: ETP is largest MLP under the ET Umbrella with ~46%
stake in SUN and owns SXL's GP and ~24% LP interest in SXL. We expect ETP distributions to stay flat through 2018, as it builds coverage and de-levers to ~4.5x while placing its ~$9Bn of projects in service through end-2017. The current set of IDR waivers provided by ETE expires in 2019.
■ Estimates: Our EBITDA estimates move ~3%/2% lower in 2017/18, primarily driven by volumes which came in below forecast during Q4. We now model a full contribution from the Bakken pipeline (DAPL+ETCO) in 3Q17 and have added contribution from the Arrowhead plant and Frac 5 to our estimates. We have not made any changes to our distribution forecasts and continue to expect resumption of distribution growth beginning 1Q19, when leverage moves below 4.5x. We expect ETP to continue to make use of its ATM program and model $150mm of additional equity issuance in 2017 and $400mm/year in 2018/19. This would enable ETP to lower total debt leverage from ~5.5x in 4Q16, to 4.9x in 2017, 4.6x in 2018 and 4.4x in 2019. Higher than anticipated volumetric growth from additional Permian basin opportunities would move our EBITDA estimates higher and materially lower leverage to ~4x.
■ Valuation: We are reiterating our $45 target price and Outperform rating on ETP. Our target price implies ~31% NTM total return, above the median for our coverage group, supporting our Outperform rating. Our valuation is based on an equal weighted blend of EV/EBITDA, P/DCF and 3-stage DDM.
■ Risks: Risks include delay in growth projects, high leverage, ETE IDR waivers expiration in 2019, tax treatment of MLPs, slower SXL and SUN distribution growth and access and cost of capital.
Share price performance
ET P.N S& P 5 0 0 IN D EX
A p r - 1 6 Ju l - 1 6 O ct - 1 6 Jan - 1 72 5
3 0
3 5
4 0
4 5
On 27-Feb-2017 the S&P 500 INDEX closed at 2370.1Daily Feb26, 2016 - Feb27, 2017, 02/26/16 = US$26.62
DCF/LP Unit Q1 Q2 Q3 Q42016A 0.79 0.87 0.77 0.912017E 0.83 0.96 1.20 1.352018E 1.06 1.09 1.15 1.15
Financial and valuation metricsYear 12/16A 12/17E 12/18E 12/19EEBITDA (US$ m) 5,605 6,622 7,568 8,086Distribution/unit- DPU (US$ m) 4.22 4.22 4.22 4.32Earnings/unit - EPU (US$) -2.01 0.76 0.96 1.39Prev. Earnings/unit - EPU (US$) (0.53) 1.29 1.62 1.70EPU - consensus (US$) -0.39 1.63 2.42 1.71Distribution coverage (x) 0.86 1.01 1.03 1.05P/DCF (x) 10.7 8.7 8.5 8.0Adj. current EV/EBITDA (x) - - - -
DPU (US$) 4.22 Distribution yld (%) 11.2Units outstanding (m) 543 GP take (%) 31.2Net debt current (US$ m) 30,683.4 Net debt/EBITDA (x) 5.76-month ADV (000's) 825 Net debt/market cap. (%) -Free float (%) 106 Institutional ownership (%) -Source: Company data, Thomson Reuters, Credit Suisse estimates

28 February 2017
Energy Transfer 4Q16 Review (ETE | ETP | SXL | SUN) 16
Energy Transfer Partners, LP (ETP)Price (27 Feb 2017): US$37.68; Rating: OUTPERFORM; Target Price: US$45.00; Analyst: John EdwardsMLP Distributable Cash Flow (DCF)
12/16A 12/17E 12/18E 12/19E
Adjusted EBITDA 5,605.0 6,621.8 7,567.8 8,085.9(-) Maintenance Capex (368.0) (427.4) (452.4) (474.9)(-) Cash Interest Expenses 1,317.0 1,377.7 1,462.3 1,489.7(+/-) Other Adjustments 410.0 351.5 333.2 328.7Total Distributable Cash Flow (US$) 3,510.0 4,465.2 5,320.0 5,792.6(-) General Partner Adjustments 1817.5 2074.5 2830.8 3116.9DCF to limited partners 1,692.47 2,390.66 2,489.17 2,675.70DCF per LP unit (US$) 3.34 4.34 4.44 4.70Cash Distribution Declared Per Unit (US$)
3.18 2.77 3.72 3.78Distribution coverage (x) .86 1.01 1.03 1.05DCF/LP Unit Q1 Q2 Q3 Q42016A 0.79 0.87 0.77 0.912017E 0.83 0.96 1.20 1.352018E 1.06 1.09 1.15 1.15Capex 12/16A 12/17E 12/18E 12/19EExpansion Capex (7,182.0) (2,717.6) (1,102.6) (690.1)Acquisitions (1,227.0) .0 .0 .0Maintenance capex (368.0) (427.4) (452.4) (474.9)Cash Flow 12/16A 12/17E 12/18E 12/19ENet income (US$) (1,010.0) 421.0 540.0 791.9DD&A 1,986.0 2,340.0 2,429.9 2,486.3Change in working capital (117.0) .0 .0 .0Other cash & non-cash items 1,618.0 743.9 836.2 889.4Cash flow from operations 3,303.0 3,639.8 4,450.0 4,945.2Free cashflow to the firm 2,935.0 3,212.4 3,997.6 4,470.3Other investment/(outflows) 2,387.0 1,282.5 135.0 135.0Cash flow from investments (6,390.0) (1,862.5) (1,420.0) (1,030.0)Net share issue/(repurchase) 1,098.0 718.0 400.0 400.0Dividends paid (3,542.0) (3,647.3) (4,171.7) (4,558.1)Change in debt 4,221.0 1,740.0 1,329.7 830.9Other financing inflows/outflows 1,143.0 (588.0) (588.0) (588.0)Cashflow from financing activities 2,920.0 (1,777.3) (3,030.0) (3,915.2)Movements in cash/eq. (167.0) (.0) (.0) (.0)Balance Sheet (US$) 12/16A 12/17E 12/18E 12/19EAssetsCash & cash equivalents 360.0 360.0 360.0 360.0Account receivables 3,211.0 3,211.0 3,211.0 3,211.0Other current assets 446.0 446.0 446.0 446.0Total current assets 5,729.0 5,729.0 5,729.0 5,729.0Total fixed assets 50,917.0 50,522.0 49,647.1 48,325.8Other assets 4,952.0 5,689.0 6,450.5 7,231.8Total assets 70,191.0 70,533.1 70,419.6 69,879.7LiabilitiesAccounts payables 2,943.0 2,943.0 2,943.0 2,943.0Short-term debt .0 .0 .0 .0Other short term liabilities 3,260.0 3,260.0 3,260.0 3,260.0Total current liabilities 6,203.0 6,203.0 6,203.0 6,203.0Long-term debt 31,741.0 33,481.0 34,810.6 35,641.5Other liabilities 5,672.0 5,672.0 5,672.0 5,672.0Total liabilities 43,616.0 45,356.0 46,685.6 47,516.5Minority interests / other 7,885.0 7,681.0 7,477.0 7,273.0Total liabilities and equity 70,143.0 70,485.1 70,371.6 69,831.7Financing Metrics 12/16A 12/17E 12/18E 12/19EEquity issuance 1,098.0 718.0 400.0 400.0Debt issuance/(repayment) 4,221.0 1,740.0 1,329.7 830.9Leverage (x) 5.8 4.9 4.6 4.4Per share 12/16A 12/17E 12/18E 12/19ENo. of shares (EOP) 518 543 560 569Earnings / unit EPU (US$) (2.01) 0.76 0.96 1.39DPS (US$) 4.22 4.22 4.22 4.32Book value per share 36.01 32.16 28.94 26.42Operating cash flow/share 6.38 6.71 7.95 8.69Valuation metrics 12/16A 12/17E 12/18E 12/19EDiv yield (%) 11.2 11.2 11.2 11.5FCF yield (%) 15.8 15.7 18.9 20.8EV/EBITDA (x) 10.5 9.3 9.0 8.6P/E (x) (18.7) 49.7 39.1 27.1Price to book (x) 1.0 1.2 1.3 1.4Credit ratios 12/16A 12/17E 12/18E 12/19ENet debt/equity (%) 118.3 131.8 145.4 158.1Interest coverage ratio (X) 1.4 2.1 2.5 2.7Dividend payout ratio (%) (35.4) (36.5) (41.7) (45.6)
Company BackgroundEnergy Transfer Partners, L.P. is a ltd partnership based in the US engaged in natural gas operations, managed by the general partner, Energy Transfer Partners GP, L.P., which in turn is managed by its general partner, Energy Transfer Partners, L.L.C..
Blue/Grey Sky Scenario
Our Blue Sky Scenario (US$) 52.00Our blue sky valuation assumes 1.0x higher EV/EBITDA and P/DCF multiples relative to base case and 100bps lower discount rate relative to the base case 3-stage DDM methodology.
Our Grey Sky Scenario (US$) 37.00Our grey sky valuation assumes 1.0x lower EV/EBITDA and P/DCF multiples relative to base case and 100bps higher discount rate relative to the base case 3-stage DDM methodology. Our valuation also takes into account flat distribution payouts and grey sky case for underlying subsidiaries and flat distributions at ETP.
Share price performance
ET P.N S& P 5 0 0 IN D EX
A p r - 1 6 Ju l - 1 6 O ct - 1 6 Jan - 1 72 5
3 0
3 5
4 0
4 5
On 27-Feb-2017 the S&P 500 INDEX closed at 2370.1Daily Feb26, 2016 - Feb27, 2017, 02/26/16 = US$26.62
Source: Company data, Thomson Reuters, Credit Suisse estimates

28 February 2017
Energy Transfer 4Q16 Review (ETE | ETP | SXL | SUN) 17
ETP ValuationOur $45 target price is based on an equal weighted blend of EV/EBITDA, P/DCF and 3-stage DDM. Our TP implies ~31% NTM total returns, supporting our Outperform rating on the stock
Figure 11: ETP Blended Valuation2017E Multiple EV
EBITDA Low Base High Low Base HighEV/EBITDAETP consolidated EBITDA 6,622Less: SXL EBITDA 1,648EBITDA attributable to ETP 4,974 9.0x 10.0x 11.0x 44,762 49,735 54,709
ETP Net consolidated debt 32,499Less: SXL net debt 7,116Net debt attributable to ETP 25,383 25,383 25,383 25,383
Total Equity Value 19,379 24,352 29,326ETP LP Take % 71% 71% 71%ETP LP share 13,788 17,327 20,865
SXL EV/EBITDA 10.5x 11.5x 12.5xTotal SXL Equity Value 10,192 11,840 13,488GP Take % 39% 39% 39%SXL GP stake (ETP Class H) 10% 10% 10%ETP share in SXL GP 400 465 530
Units TPAdd: SXL ownership 67.1 $31 2,079 2,079 2,079Add: SUN ownership 43.5 $30 1,305 1,305 1,305Net ETP Equity value 17,572 21,175 24,779Units O/S 552 552 552Price/Unit $32 $38 $45
2017E MultipleDCF/unit Low Base High Low Base High
Price/DCF $4.34 9.0x 10.0x 11.0x $39 $43 $48
Discount RateLow Base High Low Base High
3-Stage DDM 10.0% 9.0% 8.0% $48 $54 $61
Average Target Price $40 $45 $51Distribution/unit (12-mo out) $4.22Yield (12-mo out) 9.4%Current Price $37.71Total Return (NTM) 31%
Metric
Source: Company data, Credit Suisse estimates

28 February 2017
Energy Transfer 4Q16 Review (ETE | ETP | SXL | SUN) 18
ETP Changes to EstimatesFigure 12: ETP Estimates Yr ending December 31($ millions, except per unit data)
1Q17E 2Q17E 3Q17E 4Q17E 2017E 2018E 2019E 1Q17E 2Q17E 3Q17E 4Q17E 2017E 2018E 2019E
Intrastate Natural Gas Transportation And Storage EBITDA 140 142 145 147 575 597 619 143 146 149 151 588 606 617Interstate Natural Gas Transportation And Storage EBITDA 277 280 317 365 1,239 1,454 1,454 267 270 307 357 1,202 1,434 1,453Midstream EBITDA 297 309 322 331 1,260 1,353 1,370 290 302 316 326 1,234 1,343 1,396NGL Transportation And Services EBITDA 313 352 376 402 1,443 1,774 1,840 294 335 393 418 1,441 1,711 1,879Investment In Sunoco Logistics EBITDA 394 424 452 480 1,750 1,982 2,167 366 389 438 454 1,648 1,948 2,198All Other EBITDA 120 126 122 122 490 513 534 123 132 128 126 508 526 543Segment EBITDA 1,561 1,653 1,754 1,867 6,836 7,755 8,069 1,484 1,573 1,732 1,833 6,622 7,568 8,086Core EBITDA (Excl SXL, PTXP, Retail and Other) 1,027 1,084 1,160 1,245 4,516 5,179 5,283 995 1,052 1,166 1,253 4,465 5,094 5,344
Adjusted EBITDANet income (loss) 430 528 627 758 2,343 3,126 3,364 375 488 606 703 2,172 2,917 3,375Interest expense, net of interest capitalized 361 353 356 351 1,422 1,414 1,448 351 338 343 346 1,378 1,462 1,490Depreciation and amortization 566 572 577 571 2,286 2,327 2,378 582 578 586 594 2,340 2,430 2,486Income tax expense from continuing operations (20) (25) (30) (36) (112) (149) (160) (18) (23) (29) (33) (103) (139) (161)Adjusted EBITDA related to unconsolidated affiliates 268 269 270 268 1,075 1,098 1,120 249 253 254 250 1,007 1,024 1,041Equity in earnings of unconsolidated affiliates (82) (83) (85) (84) (334) (358) (380) (76) (80) (83) (80) (320) (345) (365)Other, net 38 39 39 39 155 296 300 20 20 55 55 150 219 219Adj. EBITDA 1,561 1,653 1,754 1,867 6,836 7,755 8,069 1,484 1,573 1,732 1,833 6,622 7,568 8,086
EPU $0.05 $0.23 $0.39 $0.62 $1.29 $1.62 $1.70 ($0.10) $0.10 $0.29 $0.47 $0.76 $0.96 $1.39Average Units Outstanding 550 557 557 557 550 557 562 541 552 553 555 543 560 569
Distributable Cash Flow (DCF)Adjusted EBITDA 1,561 1,653 1,754 1,867 6,836 7,755 8,069 1,484 1,573 1,732 1,833 6,622 7,568 8,086Adjusted EBITDA related to unconsolidated affiliates (268) (269) (270) (268) (1,075) (1,098) (1,120) (249) (253) (254) (250) (1,007) (1,024) (1,041)Distributions from unconsolidated affiliates (109) (101) (124) (111) (445) (445) (445) (137) (129) (152) (134) (552) (552) (552)Maintenance Capex (111) (113) (115) (116) (455) (469) (480) (105) (106) (108) (109) (427) (452) (475)Cash Interest Expenses (361) (353) (356) (351) (1,422) (1,414) (1,448) (351) (338) (343) (346) (1,378) (1,462) (1,490)Other Adjustments 1,242 1,244 1,203 1,213 4,903 4,924 5,046 1,119 1,112 1,078 1,108 4,417 4,635 4,747Total Distributable Cash Flow 950 1,044 1,168 1,278 4,440 5,367 5,627 933 1,029 1,207 1,296 4,465 5,320 5,793DCF Not Attributable to ETP 172 192 203 221 788 854 896 147 163 199 206 714 850 936Distributable Cash Flow Attributable to ETP 779 852 965 1,058 3,653 4,514 4,731 786 866 1,009 1,090 3,751 4,470 4,857Cash Paid to General Partner (GP) 234 229 227 217 907 1,394 1,477 230 225 225 216 896 1,405 1,498Class H units payments to general partner 103 108 117 122 450 556 653 106 112 120 126 464 576 683DCF to Limited Partners 442 515 621 718 2,296 2,564 2,601 451 529 663 748 2,391 2,489 2,676
DCF per LP unit $0.8052 $0.9240 $1.1133 $1.2880 $4.1304 $4.5990 $4.6269 $0.8336 $0.9573 $1.1986 $1.3487 $4.3381 $4.4441 $4.6985
Cash Distribution Declared Per Unit $1.0550 $1.0550 $1.0550 $1.0550 $4.2200 $4.2200 $4.3200 $1.0550 $1.0550 $1.0550 $1.0550 $4.2200 $4.2200 $4.3200
Distribution Coverage (Total DCF/Total Distribution Declared) 0.84x 0.92x 1.03x 1.14x 0.98x 1.05x 1.04x 0.86x 0.94x 1.08x 1.17x 1.01x 1.03x 1.05x
Capital Expenditures & AcquisitionsGrowth Capex 475 475 475 475 1,900 1,000 800 700 700 700 700 2,800 1,200 800Maintenance Capex 88 88 88 88 350 350 350 86 86 86 86 345 355 365Acquisitions 0 0 0 0 0 0 0 0 0 0 0 0 0 0Total Capital Expenditures & Acquisitions 563 563 563 563 2,250 1,350 1,150 786 786 786 786 3,145 1,555 1,165
Operating MetricsIntrastate Natural Gas Transportation And Storage
Natural gas transported (MMBtu/d) 8,218,813 8,268,613 8,368,213 8,467,813 8,330,863 8,696,783 9,049,908 7,942,467 8,040,867 8,139,267 8,237,667 8,090,067 8,354,465 8,522,812
Interstate Natural Gas Transportation And StorageNatural gas transported (MMBtu/d): 5,412,607 5,439,670 6,447,170 8,148,004 6,361,863 8,148,004 8,148,004 5,348,701 5,375,445 6,382,945 8,083,778 6,297,717 8,185,332 8,350,271Natural gas sold (MMBtu/d) - ETP Legacy Assets: 19,478 19,478 19,478 19,478 19,478 19,478 19,478 17,190 17,190 17,190 17,190 17,190 17,406 17,757
MidstreamGathered volumes (MMBtu/d): 10,375,316 10,700,316 11,025,316 11,340,316 10,860,316 11,690,316 11,840,316 10,018,728 10,343,728 10,718,728 11,083,728 10,541,228 11,521,228 11,978,757NGLs Produced including Equity NGLs (Bbl/d): 494,063 509,539 525,015 540,015 517,158 556,682 563,825 477,082 492,558 510,416 527,797 501,963 548,630 570,417
NGL Transportation And ServicesNGL transportation volumes (Bbl/d) 892,188 1,003,609 1,086,146 1,191,230 1,043,293 1,221,310 1,270,900 778,891 889,180 970,572 1,072,189 927,708 1,099,263 1,143,897NGL fractionation volumes (Bbl/d) 418,237 458,237 458,237 458,237 448,237 469,808 488,884 433,663 473,663 473,663 473,663 463,663 495,624 617,257
Old Estimates New Estimates
Source: Company data, Credit Suisse estimates

28 February 2017
Energy Transfer 4Q16 Review (ETE | ETP | SXL | SUN) 19
ETP 4Q16 Earnings4Q16 Mixed; Core EBITDA and Overall EBITDA Below CS and Street■ Total EBITDA Below Us and the Street: EBITDA of $1,433mm came in 5% below our
$1,510mm estimate and 3% below the Street’s $1,480mm estimate. The variance was primarily driven by the interstate natural gas and midstream segments. Details on ETP’s core business segments below -
− Intrastate Transportation EBITDA Beat on Higher Margins: $152mm EBITDA came in above our $142mm estimate (+7%). Volumes of 7,913 Bbtu/d missed our 8,169 Bbtu/d estimate (-3%), but were offset by higher gross margins ($0.26/Mmbtu vs. our $0.23/MMBtu estimate), which drove the EBITDA higher.
− Interstate Transportation EBITDA Missed on Lower Volumes: $269mm EBITDA came in below our $280mm estimate (-4%). Natural gas transportation volumes of 5,322 Bbtu/d were 1% below our 5,386 Bbtu/d estimate and natural gas sales volumes of ~17.2 Bbtu/d were 12% below our ~19.5 Bbtu/d estimate.
− Midstream EBITDA Missed on Lower Volumes and Margins: $258mm EBITDA came in 12% below our $294mm estimate. Gathering volumes of 9,694 Bbtu/d were 4% below our 10,050 Bbtu/d estimate and NGL production volumes of 459 MBbl/d were 4% below our 479 MBbl/d estimate. Gross margins of 32% were below our 36% estimate.
− Liquids Transportation and Services EBITDA In Line: $281mm EBITDA was in line with our $283mm estimate. Lower NGL transportation volumes were offset by higher NGL fractionation volumes and healthier margins. NGL transportation volumes of 670 Mbbl/d were lower than our 782 Mbbl/d estimate (-14%) and NGL fractionation volumes of 394 Mbbl/d were higher than our 378 Mbbl/d (+4%).
■ DCF Above CS: $906mm DCF came in 2% above our $888mm estimate. Lower interest expenses were offset by higher than forecast maintenance capex. ETP ended the quarter with a 0.89x coverage. Marks the 6th straight quarter of below 1x coverage (excl. 4Q15 income tax gain which kept coverage above 1.0x).
■ Distribution of $1.055/unit was in line with us and the Street.

28 February 2017
Energy Transfer 4Q16 Review (ETE | ETP | SXL | SUN) 20
Figure 13: ETP 4Q16 VarianceYr ending December 31($ millions, except per unit data) 4Q16 4Q16 CS Diff Diff (%) 4Q15 Y/Y (%)
Actual Estimate Actual
Intrastate Natural Gas Transportation And Storage EBITDA 152 142 10 7% 122 25%Interstate Natural Gas Transportation And Storage EBITDA 269 280 (11) -4% 283 -5%Midstream EBITDA 258 294 (36) -12% 264 -2%NGL Transportation And Services EBITDA 281 283 (2) -1% 222 27%Investment In Sunoco Logistics EBITDA 327 356 (29) -8% 317 3%All Other EBITDA 146 135 11 8% 152 -4%Segment EBITDA 1,433 1,510 (155) -5% 1,360 5%Core EBITDA (Excl SXL, PTXP, Retail and Other) 960 999 (39) -4% 891 8%
Adjusted EBITDANet income (loss) (362) 399 (761) -191% 21 -1824%Interest expense, net of interest capitalized 336 349 (13) -4% 312 8%Depreciation and amortization 517 559 (42) -8% 478 8%Income tax expense from continuing operations (55) (19) (36) 189% (103) -47%Adjusted EBITDA related to unconsolidated affiliates 235 263 (28) -11% 226 4%Equity in earnings of unconsolidated affiliates 201 (80) 281 -352% (81) -348%Other, net 561 23 538 NM 507 11%Adj. EBITDA 1,433 1,510 (77) -5% 1,360 5%
EPU ($1.47) $0.01 ($1.48) NM ($0.68) 116%Average Units Outstanding 523 536 (13) -2% 486 8%
Distributable Cash Flow (DCF)Adjusted EBITDA 1,433 1,510 (77) -5% 1,360 5%Adjusted EBITDA related to unconsolidated affiliates (235) (263) 28 -11% (226) 4%Distributions from unconsolidated affiliates (134) (111) (23) 21% (214) -37%Maintenance Capex (134) (121) (13) 10% (177) -24%Cash Interest Expenses (336) (349) 13 -4% (312) 8%Other Adjustments 1,098 1,244 (146) -12% 775 42%Total Distributable Cash Flow 906 888 18 2% 1,086 -17%DCF Not Attributable to ETP 110 143 (33) -23% 127 -13%Distributable Cash Flow Attributable to ETP 796 745 51 7% 959 -17%Cash Paid to General Partner (GP) 237 235 3 1% 320 -26%Class H units payments to general partner 94 97 (3) -3% 77 22%DCF to Limited Partners 465 413 52 13% 562 -17%
DCF per LP unit $0.8893 $0.7704 $0.12 15% $1.1124 -20%
Cash Distribution Declared Per Unit $1.0550 $1.0550 $0.00 0% $1.0550 0%
Distribution Coverage (Total DCF/Total Distribution Declared) 0.89x 0.82x 0.06x 8% 1.07x -17%
Capital Expenditures & AcquisitionsGrowth Capex 628 250 378 151% 1,267 -50%Maintenance Capex 111 100 11 11% 142 -22%Acquisitions 640 640 0 0% 200 220%Total Capital Expenditures & Acquisitions 1,379 990 389 39% 1,609 -14%
Operating MetricsIntrastate Natural Gas Transportation And Storage
Natural gas transported (MMBtu/d) 7,913,134 8,169,013 (255,879) -3% 7,926,907 0%
Interstate Natural Gas Transportation And StorageNatural gas transported (MMBtu/d): 5,322,091 5,385,679 (63,588) -1% 5,739,157 -7%Natural gas sold (MMBtu/d) - ETP Legacy Assets: 17,190 19,478 (2,288) -12% 18,665 -8%
MidstreamGathered volumes (MMBtu/d): 9,693,728 10,050,316 (356,588) -4% 10,051,612 -4%NGLs Produced including Equity NGLs (Bbl/d): 459,604 478,586 (18,982) -4% 473,178 -3%
NGL Transportation And ServicesNGL transportation volumes (Bbl/d) 669,694 781,869 (112,175) -14% 473,656 41%NGL fractionation volumes (Bbl/d) 393,663 378,237 15,426 4% 249,566 58%
Source: Company data, Credit Suisse estimates

28 February 2017
Energy Transfer 4Q16 Review (ETE | ETP | SXL | SUN) 21
Americas/United StatesMaster Limited Partnerships
Sunoco Logistics Partners, LP (SXL)Rating OUTPERFORMPrice (27-Feb-17, US$) 25.23Target price (US$) 31.0052-week price range (US$) 31.47 - 22.52Market cap (US$ m) 8,363.01Adjusted EV -Target price is for 12 months.
Research Analysts
John Edwards, CFA713 890 1594
Bhavesh Lodaya212 325 2337
Dylan Nassano212 325 8375
Reinstating with $31 TP and Outperform■ Investment Thesis: SXL is growing its NGLs business with the ~600 Mbpd
(expandable to 800 Mbpd) Mariner East (ME) franchise. The 70 Mbpd ME1 is already in service, the 275 Mbpd ME2 is expected to be placed into service in 2H17 and the 250 Mbpd ME2X currently under development. We expect SXL to grow it distribution at ~10-12%/yr., and maintain coverage at ~1.05x
■ Estimates: Coming off restriction we now expect SXL EBITDA of ~$1.65Bn/$1.95Bn/$2.2Bn in 2017/18/19, which includes the 3Q17 in service of the Mariner East 2 and Phase 1 of the Permian Express III projects. We forecast a 4Q18 in service for the Mariner East 2 expansion project. We expect SXL to grow distributions by ~10% annually and while SXL did not lay out capex guidance for 2017, we forecast total capex of ~$1.1Bn, including ~$84mm on maintenance. We forecast leverage of 4.3x/4.0x/3.8x for 2017/18/19 which includes 30%/70% equity and debt financing.
■ Valuation: We are reinstating coverage on SXL with a $31 target price and an Outperform rating, driven by ~32% NTM total return. Our valuation is based on an equal weighted blend of EV/EBITDA, P/DCF and 3-stage DDM.
■ Risks: Lower than expected NGL demand is primary risk for SXL as it is developing the Mariner East 2 and Mariner East 2 expansion projects. Other risks include, unfavorable WTI-LLS differentials, tax treatment of MLPs and growth and access and cost of capital.
Share price performance
SXL.N S& P 5 0 0 IN D EX
A p r - 1 6 Ju l - 1 6 O ct - 1 6 Jan - 1 72 22 42 62 83 03 2
On 27-Feb-2017 the S&P 500 INDEX closed at 2370.1Daily Feb26, 2016 - Feb27, 2017, 02/26/16 = US$24.39
DCF/LP Unit Q1 Q2 Q3 Q42016A 0.58 0.37 0.47 0.462017E 0.53 0.56 0.61 0.622018E 0.63 0.66 0.66 0.65
Financial and valuation metricsYear 12/16A 12/17E 12/18E 12/19EEBITDA (US$ m) 1,233 1,648 1,948 2,198Distribution/unit- DPU (US$ m) 2.02 2.23 2.47 2.71Earnings/unit - EPU (US$) 1.02 0.99 1.29 1.58Prev. Earnings/unit - EPU (US$) 0.88 1.14 1.35 1.54EPU - consensus (US$) 0.98 0.99 1.35 1.66Distribution coverage (x) 0.92 1.04 1.06 1.05P/DCF (x) 12.7 10.9 9.7 8.9Adj. current EV/EBITDA (x) - - - -
DPU (US$) 2.14 Distribution yld (%) 8.5Units outstanding (m) 331 GP take (%) 39.7Net debt current (US$ m) 6,645.1 Net debt/EBITDA (x) 5.66-month ADV (000's) 629 Net debt/market cap. (%) -Free float (%) 86 Institutional ownership (%) 45.6Source: Company data, Thomson Reuters, Credit Suisse estimates

28 February 2017
Energy Transfer 4Q16 Review (ETE | ETP | SXL | SUN) 22
Sunoco Logistics Partners, LP (SXL)Price (27 Feb 2017): US$25.23; Rating: OUTPERFORM; Target Price: $31.00; Analyst: John EdwardsMLP Distributable Cash Flow (DCF)
12/16A 12/17E 12/18E 12/19E
Adjusted EBITDA 1,233.0 1,648.3 1,947.8 2,198.3(-) Maintenance Capex - - - -(-) Cash Interest Expenses 157.0 161.0 165.3 177.6(+/-) Other Adjustments 133.0 146.4 161.4 173.9Total Distributable Cash Flow (US$) 943.0 1,340.9 1,621.0 1,846.8(-) General Partner Adjustments 365.1 544.5 687.2 804.9DCF to limited partners 577.94 796.36 933.79 1,041.88DCF per LP unit (US$) 1.89 2.31 2.60 2.83Cash Distribution Declared Per Unit (US$)
3.96 4.02 4.19 4.32Distribution coverage (x) .92 1.04 1.06 1.05DCF/LP Unit Q1 Q2 Q3 Q42016A 0.58 0.37 0.47 0.462017E 0.53 0.56 0.61 0.622018E 0.63 0.66 0.66 0.65Capex 12/16A 12/17E 12/18E 12/19EExpansion Capex - - - -Acquisitions (786.0) .0 .0 .0Maintenance capex - - - -Cash Flow 12/16A 12/17E 12/18E 12/19ENet income (US$) 312.0 340.4 462.0 579.3DD&A 446.0 476.0 476.0 476.0Change in working capital (85.0) .0 .0 .0Other cash & non-cash items 328.0 351.0 346.7 334.4Cash flow from operations 888.0 1,344.9 1,593.7 1,832.0Free cashflow to the firm (1,061.0) 262.5 496.3 922.0Other investment/(outflows) (1,089.0) 800.0 .0 .0Cash flow from investments (3,824.0) (282.4) (1,097.4) (909.9)Net share issue/(repurchase) 1,388.0 324.7 329.2 273.0Dividends paid (966.0) (1,231.1) (1,474.4) (1,710.2)Change in debt - (156.1) 648.9 515.2Other financing inflows/outflows - .0 .0 .0Cashflow from financing activities 422.0 (1,062.5) (496.3) (922.0)Movements in cash/eq. (2,514.0) .0 .0 .0Balance Sheet (US$) 12/16A 12/17E 12/18E 12/19EAssetsCash & cash equivalents 41.0 41.0 41.0 41.0Account receivables 1,900.0 1,900.0 1,900.0 1,900.0Other current assets 31.0 31.0 31.0 31.0Total current assets 2,906.0 2,906.0 2,906.0 2,906.0Total fixed assets 12,324.0 12,930.4 13,551.8 13,985.7Other assets 1,033.0 1,033.0 1,033.0 1,033.0Total assets 18,849.0 19,455.4 20,076.8 20,510.7LiabilitiesAccounts payables 1,813.0 1,813.0 1,813.0 1,813.0Short-term debt .0 .0 .0 .0Other short term liabilities 325.0 325.0 325.0 325.0Total current liabilities 2,138.0 2,138.0 2,138.0 2,138.0Long-term debt 7,313.0 7,156.9 7,805.8 8,320.9Other liabilities 705.0 705.0 705.0 705.0Total liabilities 10,156.0 9,999.9 10,648.8 11,163.9Minority interests / other 33.0 33.0 33.0 33.0Total liabilities and equity 18,849.0 19,455.4 20,076.8 20,510.7Financing Metrics 12/16A 12/17E 12/18E 12/19EEquity issuance 1,388.0 324.7 329.2 273.0Debt issuance/(repayment) - (156.1) 648.9 515.2Leverage (x) 5.9 4.3 4.0 3.8Per share 12/16A 12/17E 12/18E 12/19ENo. of shares (EOP) 307 344 359 367Earnings / unit EPU (US$) 1.02 0.99 1.29 1.58DPS (US$) 2.02 2.23 2.47 2.71Book value per share 28.22 27.39 26.17 25.34Operating cash flow/share 2.89 3.91 4.44 4.99Valuation metrics 12/16A 12/17E 12/18E 12/19EDiv yield (%) 8.0 8.8 9.8 10.7FCF yield (%) (14.4) 3.0 5.5 9.9EV/EBITDA (x) 15.8 13.1 12.0 11.2P/E (x) 24.9 25.6 19.6 16.0Price to book (x) 0.9 0.9 1.0 1.0Credit ratios 12/16A 12/17E 12/18E 12/19ENet debt/equity (%) 83.7 75.3 82.4 88.6Interest coverage ratio (X) 4.1 6.2 7.5 8.4Dividend payout ratio (%) (9.7) (12.3) (14.7) (17.1)
Company BackgroundSunoco Logistics Partners L.P. owns & operates a logistics business, consisting of a geographically diverse portfolio of complementary pipeline, terminalling, & crude oil acquisition & marketing assets.
Blue/Grey Sky Scenario
Our Blue Sky Scenario (US$) 35.00Our blue sky valuation assumes 1.0x higher EV/EBITDA and P/DCF multiples relative to base case and 100bps lower discount rate relative to the base case 3-stage DDM methodology.
Our Grey Sky Scenario (US$) 23.00Our grey sky valuation assumes 1.0x lower EV/EBITDA and P/DCF multiples relative to base case and 100bps higher discount rate relative to the base case 3-stage DDM methodology. Our valuation also takes into account flat distribution payouts by SXL.
Share price performance
SXL.N S& P 5 0 0 IN D EX
A p r - 1 6 Ju l - 1 6 O ct - 1 6 Jan - 1 72 22 42 62 83 03 2
On 27-Feb-2017 the S&P 500 INDEX closed at 2370.1Daily Feb26, 2016 - Feb27, 2017, 02/26/16 = US$24.39
Source: Company data, Thomson Reuters, Credit Suisse estimates

28 February 2017
Energy Transfer 4Q16 Review (ETE | ETP | SXL | SUN) 23
SXL ValuationOur $31 target price is based on an equal weighted blend of EV/EBITDA, P/DCF and 3-stage DDM. Our TP implies ~32% NTM total returns, supporting our Outperform rating on the stock.
Figure 14: SXL Blended Valuation2017E Multiple EV
EBITDA Low Base High Low Base HighEV/EBITDA 1,648 10.5x 11.5x 12.5x 17,308 18,956 20,604Less: 2017 Net Debt 7,116 7,116 7,116Total Equity Value 10,192 11,840 13,488SXL LP Take % 61% 61% 61%Units O/S 332 332 332Price/Unit $19 $22 $25
2017E MultipleDCF/unit Low Base High Low Base High
Price/DCF $2.31 11.0x 12.0x 13.0x $25 $28 $30
Discount RateLow Base High Low Base High
3-Stage DDM 10.0% 9.0% 8.0% $38 $43 $50
Average Target Price $27 $31 $35Distribution/unit (12-mo out) $2.32Yield (12-mo out) 7.5%Current Price $25.27Total Return (NTM) 32%
Metric
Source: Company data, Credit Suisse estimates

28 February 2017
Energy Transfer 4Q16 Review (ETE | ETP | SXL | SUN) 24
SXL Changes to EstimatesFigure 15: SXL EstimatesYr ending December 31
1Q17E 2Q17E 3Q17E 4Q17E 2017E 2018E 2019ECrude Oil 213 231 272 285 1,001 1,181 1,355Natural Gas Liquids 91 95 102 104 392 495 554Refined Products 62 63 64 65 254 271 290
Segment EBITDA 366 389 438 454 1,648 1,948 2,198
Net Income 182 207 232 248 869 1,118 1,356Interest cost, net of capitalized interest 41 40 40 40 161 165 178Depreciation and amortization 119 119 119 119 476 476 476Provision for income taxes 7 7 7 7 28 28 28Other items 17 17 40 40 114 161 161
Adjusted EBITDA 366 389 438 454 1,648 1,948 2,198
EPU $0.18 $0.24 $0.27 $0.29 $0.99 $1.29 $1.58Average Units Outstanding 335 338 350 353 344 359 367
Distributable Cash Flow (DCF)Adjusted EBITDA 366 389 438 454 1,648 1,948 2,198
Interest cost, net of capitalized interest 41 40 40 40 161 165 178Maintenance Capex 18 19 22 23 82 97 110Provision for income taxes 7 7 7 7 28 28 28Less: Other items 9 9 9 9 36 36 36
Total Distributable Cash Flow 291 314 360 375 1,341 1,621 1,847(-) General Partner (GP) Interest in DCF 115 126 148 155 545 687 805
DCF to Limited Partners 176 188 212 220 796 934 1,042
DCF per LP unit $0.5258 $0.5566 $0.6061 $0.6232 $2.3118 $2.6006 $2.8350
Cash Distribution Declared Per Unit $0.5350 $0.5500 $0.5650 $0.5800 $2.2300 $2.4700 $2.7100
Distribution Coverage (Total DCF/Total Distribution Declared) 0.98x 1.01x 1.09x 1.09x 1.04x 1.06x 1.05x
Operating MetricsCrude Oil
Pipeline throughput (Mbpd) 2,667 2,787 2,912 3,043 2,852 3,120 3,247Terminal throughput (Mbpd) 1,733 1,811 1,893 1,978 1,854 2,028 2,110
Natural Gas LiquidsPipeline throughput (Mbpd) 310 313 316 319 315 328 341Terminal throughput (Mbpd) 264 266 269 272 268 278 290
Refined ProductsPipeline throughput (Mbpd) 683 690 696 703 693 721 750Terminal throughput (Mbpd) 614 621 627 633 624 649 675
Capital Expenditures & AcquisitionsGrowth Capex 250 250 250 250 1,000 1,000 800Maintenance Capex 18 19 22 23 82 97 110Acquisitions 0 0 0 0 0 0 0
Total Capital Expenditures & Acquisitions 268 269 272 273 1,082 1,097 910
New Estimates
Source: Company data, Credit Suisse estimates
28 February 2017
Energy Transfer 4Q16 Review (ETE | ETP | SXL | SUN) 25
Risks■ Collapse in Crude Prices; Lower than Anticipated Production Growth: - SXL’s
recent acquisitions, JVs and growth projects have focused on capitalizing on the 400-500 Mbpd of annual crude oil production growth in the Permian basin. A commodity price recovery has made production growth even more lucrative for producers in the region, that depend on midstream operators like SXL for takeaway capacity. However, a collapse in crude prices would erode margins for these producers and restrict production growth, thereby indirectly affecting midstream volumes. On the other hand, slower than industry forecasted production growth, irrespective of price movements would result in lower utilizations across the midstream platform and impact operators such as SXL.
■ Lower Than Expected NGL Demand – SXL is developing the Mariner East 2 and Mariner East 2 expansion projects on the back of expected increase in demand for ethane by steam crackers and for export. Although, both these projects would contribute fixed, blue-bar rate-able cash flows, any changes to NGL demand/supply fundamentals would impact pipeline and terminal volumes at SXL.
■ Unfavorable WTI-LLS Differentials – Other than rate-able, blue-bar cash flows, SXL derives red-bar cash flows from its crude oil leasing business. It is able to capture these cash flows when there exists a significant spread between WTI and LLS crude prices. However, with crude prices falling since June 2014 and plunging to all-time lows in January 2016, SXL’s ability to generate red-bar cash flows has been limited. For 2016, SXL estimates negligible contribution from its crude oil leasing business. While, it does not depend on these cash flows in deciding the trajectory of distribution growth, the cash definitely helps in balance sheet preservation and keeping leverage in check.
■ Tax Treatment Of MLPs – SXL’s ability to pay distributions may be hindered should the tax treatment of MLPs be changed. Although the discussion of taxing MLPs arises from time to time, we view such an event as a low probability.
■ Access To Capital Markets – Unattractive capital markets might impact SXL’s ability to raise funds for future growth projects or M&A. Currently, we do not forecast any major equity/debt issuances outside of SXL’s ATM program.
■ Permitting – While the current administration has been friendlier on the regulatory front, there remains risks at the state level for various projects.

28 February 2017
Energy Transfer 4Q16 Review (ETE | ETP | SXL | SUN) 26
SXL 4Q16 Earnings4Q16 EBITDA Misses the StreetDue to Credit Suisse’s involvement in the Bakken pipeline stake sale transaction related to SXL, we do not have comparable estimates. The stake sale closed last week, on February 15th and we are in the process of publishing new estimates and a TP/Rating for SXL.
■ EBITDA Below The Street: EBITDA of $327mm came in 4% below the Street’s $339mm estimate.
− Crude Oil Segment EBITDA came in at $184mm. SXL reported pipeline throughput of 2,552 Mbpd (+1% q/q) and terminal throughput of 1,633 Mbpd (+5% q/q).
− NGL Segment EBITDA came in at $88mm. SXL reported pipeline throughput of 307 Mbpd (+6% q/q) and terminal throughput of 253 Mbpd (flat q/q).
− Refined Products Segment EBITDA came in at $55mm. SXL reported pipeline throughput of 676 Mbpd (+11% q/q) and terminal throughput of 565 Mbpd (-1% q/q).
■ DCF: SXL reported DCF of $247mm and distribution coverage was 0.87x for the quarter.
■ Distribution/unit of $0.52 was in line with us and the Street.

28 February 2017
Energy Transfer 4Q16 Review (ETE | ETP | SXL | SUN) 27
Americas/United StatesMaster Limited Partnerships
Sunoco, LP (SUN)Rating OUTPERFORMPrice (27-Feb-17, US$) 26.52Target price (US$) 30.0052-week price range (US$) 36.33 - 21.21Market cap (US$ m) 2,969.61Adjusted EV -Target price is for 12 months.
Research Analysts
John Edwards, CFA713 890 1594
Bhavesh Lodaya212 325 2337
Dylan Nassano212 325 8375
Reiterating $30 TP and Outperform■ Investment Thesis: Since Oct-2014, SUN has completed ~$7Bn in M&A,
including ~$5.7Bn of dropdowns from ETP. SUN's business now includes retail and wholesale fuel distribution, convenience stores, supply & trading, racing fuels and terminals. It’s operations are spread across 30 states. Brands include Sunoco motor fuel, Stripes stores, Laredo Taco, Aplus, MACS, Tigermarket, and Aloha. Third-party acquisitions of wholesale/retail fuel distributors will act as a growth catalyst for SUN.
■ Estimates: We continue to forecast normalized retail ($0.23-0.25/gal) and wholesale ($0.06-0.08/gal) margins. While our fuel volume and margin assumptions are relatively unchanged, our EBITDA forecasts move ~3% lower between 2017-19 due to 100bps lower merchandise margin estimates. We now forecast LT merchandise margins of 31.5% vs. 32.5%, based on mgmt.’s 31-32% guidance. Since, SUN indicated plans to make use of their $400mm ATM program, we now model ~$200mm of equity issuance in 2017, and $100mm/yr. in 2018/19. This should enable SUN to bring leverage down from 6.5x in 4Q16, to 5.5x in 2017, 5.1x in 2018 and 4.8x in 2019. We continue to forecast flat payouts at $0.8255/unit/Q for SUN due to the elevated leverage and do not foresee distribution growth until leverage moves to a 4-4.5x range in the long term.
■ Valuation: We are reiterating our $30 target price and Outperform rating on SUN. Our target price implies ~21% NTM total return, above the median for our coverage group, supporting our Outperform rating. Our valuation is based on an equal weighted blend of EV/EBITDA, P/DCF and 3-stage DDM.
■ Risks: Improving vehicle mileage and/or newer fuel tech could lower gasoline demand, tax treatment of MLPs, and access and cost of capital.
Share price performance
SUN .N S& P 5 0 0 IN D EX
A p r - 1 6 Ju l - 1 6 O ct - 1 6 Jan - 1 72 0
2 5
3 0
3 5
4 0
On 27-Feb-2017 the S&P 500 INDEX closed at 2370.1Daily Feb26, 2016 - Feb27, 2017, 02/26/16 = US$30.82
DCF/LP Unit Q1 Q2 Q3 Q42016A 0.89 0.79 0.96 0.632017E 0.83 0.87 0.87 0.822018E 0.83 0.90 0.90 0.85
Financial and valuation metricsYear 12/16A 12/17E 12/18E 12/19EEBITDA (US$ m) 666 750 793 835Distribution/unit- DPU (US$ m) 3.29 3.30 3.30 3.30Earnings/unit - EPU (US$) -4.34 1.65 2.21 2.65Prev. Earnings/unit - EPU (US$) 2.22 1.81 2.52 3.09EPU - consensus (US$) 1.63 1.47 1.71 2.64Distribution coverage (x) 0.98 1.04 1.09 1.14P/DCF (x) 8.4 8.0 7.7 7.5Adj. current EV/EBITDA (x) - - - -
DPU (US$) 3.30 Distribution yld (%) 12.5Units outstanding (m) 112 GP take (%) 20.4Net debt current (US$ m) 4,382.0 Net debt/EBITDA (x) 5.86-month ADV (000's) 157 Net debt/market cap. (%) -Free float (%) 89 Institutional ownership (%) -Source: Company data, Thomson Reuters, Credit Suisse estimates

28 February 2017
Energy Transfer 4Q16 Review (ETE | ETP | SXL | SUN) 28
Sunoco, LP (SUN)Price (27 Feb 2017): US$26.52; Rating: OUTPERFORM; Target Price: US$30.00; Analyst: John EdwardsMLP Distributable Cash Flow (DCF)
12/16A 12/17E 12/18E 12/19E
Adjusted EBITDA 666.0 750.4 792.5 834.8(-) Maintenance Capex - - - -(-) Cash Interest Expenses 189.0 203.4 197.2 195.4(+/-) Other Adjustments 86.0 102.1 111.3 116.5Total Distributable Cash Flow (US$) 391.1 445.0 484.1 523.0(-) General Partner Adjustments 77.9 97.0 110.8 126.1DCF to limited partners 313.11 348.01 373.31 396.82DCF per LP unit (US$) 3.19 3.31 3.44 3.55Cash Distribution Declared Per Unit (US$)
2.04 2.05 2.05 2.05Distribution coverage (x) .98 1.04 1.09 1.14DCF/LP Unit Q1 Q2 Q3 Q42016A 0.89 0.79 0.96 0.632017E 0.83 0.87 0.87 0.822018E 0.83 0.90 0.90 0.85Capex 12/16A 12/17E 12/18E 12/19EExpansion Capex - - - -Acquisitions .0 .0 .0 -Maintenance capex - - - -Cash Flow 12/16A 12/17E 12/18E 12/19ENet income (US$) (406.2) 168.1 236.3 291.4DD&A 319.0 322.7 300.3 286.8Change in working capital (25.0) .0 .0 .0Other cash & non-cash items 834.0 123.3 107.2 95.4Cash flow from operations 560.8 506.8 552.6 594.3Free cashflow to the firm 121.8 306.8 392.6 434.3Other investment/(outflows) (51.0) .0 .0 .0Cash flow from investments (473.0) (6.8) (160.0) (160.0)Net share issue/(repurchase) 132.0 200.0 100.0 100.0Dividends paid (436.0) (418.9) (442.2) (456.0)Change in debt 2,027.0 47.0 .0 .0Other financing inflows/outflows 778.6 (328.2) (50.5) (78.3)Cashflow from financing activities 2,501.6 (500.1) (392.6) (434.3)Movements in cash/eq. 2,589.4 (.0) (.0) (.0)Balance Sheet (US$) 12/16A 12/17E 12/18E 12/19EAssetsCash & cash equivalents 119.0 119.0 119.0 119.0Account receivables 539.0 539.0 539.0 539.0Other current assets 158.0 158.0 158.0 158.0Total current assets 1,389.0 1,389.0 1,389.0 1,389.0Total fixed assets 3,373.0 3,057.1 2,916.7 2,789.9Other assets 66.0 66.0 66.0 66.0Total assets 8,701.0 8,385.1 8,244.7 8,117.9LiabilitiesAccounts payables 616.0 616.0 616.0 616.0Short-term debt 5.0 5.0 5.0 5.0Other short term liabilities 573.0 573.0 573.0 573.0Total current liabilities 1,194.0 1,194.0 1,194.0 1,194.0Long-term debt 4,509.0 4,227.8 4,177.3 4,099.0Other liabilities 807.0 807.0 807.0 807.0Total liabilities 6,510.0 6,228.8 6,178.3 6,100.0Minority interests / other - - - -Total liabilities and equity 8,706.0 8,390.1 8,249.7 8,122.9Financing Metrics 12/16A 12/17E 12/18E 12/19EEquity issuance 132.0 200.0 100.0 100.0Debt issuance/(repayment) 2,027.0 47.0 0.0 0.0Leverage (x) 5.8 5.7 5.2 4.9Per share 12/16A 12/17E 12/18E 12/19ENo. of shares (EOP) 94 102 107 110Earnings / unit EPU (US$) (4.34) 1.65 2.21 2.65DPS (US$) 3.29 3.30 3.30 3.30Book value per share 0.00 0.00 0.00 0.00Operating cash flow/share 5.99 4.99 5.17 5.40Valuation metrics 12/16A 12/17E 12/18E 12/19EDiv yield (%) 12.4 12.5 12.5 12.5FCF yield (%) 4.8 11.4 13.9 14.9EV/EBITDA (x) 11.4 10.0 9.6 9.2P/E (x) (6.1) 16.0 12.0 10.0Price to book (x)Credit ratios 12/16A 12/17E 12/18E 12/19ENet debt/equity (%) 200.4 190.6 196.4 197.2Interest coverage ratio (X) (1.3) 1.9 2.3 2.6Dividend payout ratio (%) (4.4) (4.2) (4.4) (4.6)
Company BackgroundSusser Holdings Corporation (Susser) is a non-refining operator of convenience store in Texas, and a non-refining motor fuel distributor. Its operations include retail convenience stores and wholesale motor fuel distribution.
Blue/Grey Sky Scenario
Our Blue Sky Scenario (US$) 34.00Our blue sky valuation assumes 1.0x higher EV/EBITDA and P/DCF multiples relative to base case and 100bps lower discount rate relative to the base case 3-stage DDM methodology.
Our Grey Sky Scenario (US$) 26.00Our grey sky valuation assumes 1.0x lower EV/EBITDA and P/DCF multiples relative to base case and 100bps higher discount rate relative to the base case 3-stage DDM methodology. Our valuation also takes into account flat distribution payouts by SUN.
Share price performance
SUN .N S& P 5 0 0 IN D EX
A p r - 1 6 Ju l - 1 6 O ct - 1 6 Jan - 1 72 0
2 5
3 0
3 5
4 0
On 27-Feb-2017 the S&P 500 INDEX closed at 2370.1Daily Feb26, 2016 - Feb27, 2017, 02/26/16 = US$30.82
Source: Company data, Thomson Reuters, Credit Suisse estimates

28 February 2017
Energy Transfer 4Q16 Review (ETE | ETP | SXL | SUN) 29
SUN ValuationOur $30 target price is based on an equal weighted blend of EV/EBITDA, P/DCF and 3-stage DDM. Our TP implies ~21% NTM total returns; supporting our Outperform rating on the stock.
Figure 16: SUN Blended Valuation2017E Multiple EV
EBITDA Low Base High Low Base HighEV/EBITDA 750 9.0x 10.0x 11.0x 6,761 7,512 8,262Less: 2017 Net Debt 4,114 4,114 4,114Total Equity Value 2,648 3,398 4,148SUN LP Take % 79% 79% 79%Units O/S 98 98 98Price/Unit $21 $27 $34
2017E MultipleDCF/unit Low Base High Low Base High
Price/DCF $3.31 9.0x 10.0x 11.0x $30 $33 $36
Discount RateLow Base High Low Base High
3-Stage DDM 12.0% 11.0% 10.0% $28 $30 $33
Average Target Price $26 $30 $34Distribution/unit (12-mo out) $3.30Yield (12-mo out) 11.0%Current Price $27.51Total Return (NTM) 21%
Metric
Source: Company data, Credit Suisse estimates

28 February 2017
Energy Transfer 4Q16 Review (ETE | ETP | SXL | SUN) 30
SUN Changes to EstimatesFigure 17: SUN Estimates
Yr ending December 31($ millions, except per unit data)
1Q17E 2Q17E 3Q17E 4Q17E 2017E 2018E 2019E 1Q17E 2Q17E 3Q17E 4Q17E 2017E 2018E 2019EGross profit 538.5 544.5 546.3 539.1 2,168.4 2,291.2 2,409.0 501.0 525.5 529.0 505.4 2,060.8 2,157.4 2,254.5
Adjusted EBITDANet income (loss) 38.3 40.9 47.5 45.5 172.2 240.4 299.5 31.7 42.7 50.9 42.8 168.1 236.3 291.4Interest (income) expense, net 51.8 52.2 51.7 51.2 206.9 206.6 206.3 51.7 51.6 50.5 49.6 203.4 197.2 195.4Depreciation and amortization expense 86.1 85.5 80.1 79.6 331.2 312.5 300.9 84.3 83.5 77.8 77.1 322.7 300.3 286.8Taxes 3.0 3.0 3.0 3.0 12.0 12.0 12.0 3.0 3.0 3.0 3.0 12.0 12.0 12.0Other 10.1 10.1 10.1 10.1 40.3 42.8 45.3 11.1 11.1 11.1 11.1 44.2 46.7 49.2Adj. EBITDA 189.2 191.6 192.4 189.5 762.7 814.3 863.9 181.8 191.8 193.3 183.6 750.4 792.5 834.8
EPU $0.40 $0.43 $0.50 $0.48 $1.81 $2.52 $3.09 $0.32 $0.42 $0.50 $0.41 $1.65 $2.21 $2.65Average Units Outstanding 95.3 95.3 95.3 95.3 95.3 95.3 96.9 99.1 100.8 102.5 104.3 101.7 106.8 110.1
Distributable Cash Flow (DCF)Adjusted EBITDA 189.2 191.6 192.4 189.5 762.7 814.3 863.9 181.8 191.8 193.3 183.6 750.4 792.5 834.8(-) Maintenance Capex 26.5 28.7 28.9 26.5 110.6 118.2 125.4 21.8 23.0 23.2 22.0 90.1 99.3 104.5(-) Cash Interest Expenses 51.8 52.2 51.7 51.2 206.9 206.6 206.3 51.7 51.6 50.5 49.6 203.4 197.2 195.4(+) Other Adjustments 3.0 3.0 3.0 3.0 12.0 12.0 12.0 3.0 3.0 3.0 3.0 12.0 12.0 12.0Total Distributable Cash Flow 107.9 107.7 108.8 108.7 433.1 477.5 520.3 105.3 114.2 116.5 109.0 445.0 484.1 523.0(-) Cash Paid to General Partner (GP) 20.3 20.3 20.3 20.3 81.4 81.4 83.0 21.3 21.7 22.1 22.4 87.5 91.5 94.4(-) GP Portion of Surplus Cash Flow / (Cash Flow Deficit)* 78.7 78.7 78.7 78.7 314.8 314.8 321.1 82.5 83.9 85.4 86.8 338.6 354.1 365.1DCF to Limited Partners 83.1 83.0 83.6 83.5 333.3 355.5 379.2 83.2 88.2 89.9 86.7 348.0 373.3 396.8
DCF per LP unit $0.8721 $0.8709 $0.8766 $0.8761 $3.4957 $3.7285 $3.8546 $0.8329 $0.8677 $0.8696 $0.8242 $3.3098 $3.4414 $3.5491
Cash Distribution Declared Per Unit $0.8255 $0.8255 $0.8255 $0.8255 $3.3020 $3.3020 $3.3020 $0.8255 $0.8255 $0.8255 $0.8255 $3.3020 $3.3020 $3.3020
Distribution Coverage (Total DCF/Total Distribution Declared) 1.09x 1.09x 1.10x 1.10x 1.09x 1.21x 1.29x 1.01x 1.08x 1.08x 1.00x 1.04x 1.09x 1.14x
Leverage 6.2x 6.0x 6.0x 5.9x 5.9x 5.6x 5.1x 6.3x 5.8x 5.7x 5.5x 5.5x 5.1x 4.8x
Capital Expenditures & AcquisitionsGrowth Capex 62.5 62.5 62.5 62.5 250.0 200.0 180.0 50.0 50.0 50.0 50.0 200.0 160.0 160.0Maintenance Capex 26.5 28.7 28.9 26.5 110.6 118.2 125.4 21.8 23.0 23.2 22.0 90.1 99.3 104.5Acquisitions 0.0 0.0 0.0 0.0 0.0 0.0 0.0 0.0 0.0 0.0 0.0 0.0 0.0 0.0Total Capital Expenditures & Acquisitions 89.0 91.2 91.4 89.0 360.6 318.2 305.4 71.8 73.0 73.2 72.0 290.1 259.3 264.5
Operating MetricsMotor fuel gallons sold ('000 gallons):Retail 612,184 663,199 663,199 612,184 2,550,765 2,601,780 2,679,834 618,542 670,087 670,087 618,542 2,577,260 2,628,805 2,681,381Wholesale 1,273,768 1,379,915 1,379,915 1,273,768 5,307,367 5,466,588 5,630,585 1,292,192 1,399,875 1,399,875 1,292,192 5,384,134 5,491,817 5,601,653Total 1,885,952 2,043,114 2,043,114 1,885,952 7,858,132 8,068,368 8,310,419 1,910,735 2,069,962 2,069,962 1,910,735 7,961,394 8,120,622 8,283,034
Motor fuel gross profit ($/Gal):Retail $0.260 $0.247 $0.244 $0.256 $0.252 $0.250 $0.248 $0.244 $0.252 $0.253 $0.244 $0.249 $0.250 $0.250Wholesale $0.081 $0.079 $0.079 $0.080 $0.080 $0.082 $0.081 $0.076 $0.080 $0.080 $0.080 $0.079 $0.080 $0.080Volume weighted average for all gallons $0.139 $0.134 $0.132 $0.137 $0.136 $0.136 $0.135 $0.131 $0.136 $0.136 $0.133 $0.134 $0.135 $0.135
Retail Merchandise Margin 32.0% 32.0% 32.0% 32.0% 32.0% 32.5% 32.5% 31.0% 31.0% 31.0% 31.0% 31.0% 31.5% 31.5%
Old Estimates New Estimates
Source: Company data, Credit Suisse estimates

28 February 2017
Energy Transfer 4Q16 Review (ETE | ETP | SXL | SUN) 31
SUN 4Q16 Earnings4Q16 Misses on Lower Retail Segment Performance■ EBITDA Below Us and the Street: EBITDA of $154mm came in 13% below our
$177mm estimate and 10% below the Street’s $170mm estimate. Overall, motor fuel sales of ~1.985 Bn gallons beat our 1.83 Bn gallons estimate (+8%). SUN generated a combined gross profit of $0.143/gal, 3% above our $0.139/gal estimate.
− Retail Operations: SUN sold 626mm gallons of retail fuel through 1,345 outlets, 4% above our 600mm gallons estimate. Retail fuel margins of $0.257/gal came in line with our $0.255/gal estimate. Retail merchandise margins of 29.9% were below our 32% estimate.
− Wholesale Operations: SUN sold ~1.36 Bn gallons of wholesale fuel, 10% above our ~1.23 Bn gallons estimate. Wholesale fuel margins of $0.09/gal came in 9% above our $0.082/gal estimate.
■ DCF Below CS: $63mm DCF came in 37% below our $101mm estimate. This was primarily driven by higher than forecast maintenance capex, interest expenses and cash taxes. It ended the quarter with 0.6x coverage.
■ Distribution/unit of $0.8255 was in line with us and just below the Street’s $0.83 estimate.

28 February 2017
Energy Transfer 4Q16 Review (ETE | ETP | SXL | SUN) 32
Figure 18: SUN 4Q16 VarianceYr ending December 31($ millions, except per unit data) 4Q16 4Q16 CS Diff Diff (%) 4Q15 Diff (%)
Actual Estimate ActualGross profit 562.0 523.5 38.5 7% 333.2 69%
Adjusted EBITDANet income (loss) (585.0) 33.1 (618.1) -1867% 11.8 -5079%Interest (income) expense, net 56.0 48.7 7.3 15% 29.9 87%Depreciation and amortization expense 85.0 83.1 1.9 2% 56.9 49%Taxes (40.0) 3.0 (43.0) -1433% 3.4 -1272%Other 638.0 9.3 628.7 NM 10.8 5820% $677mm impairment and $39mm inventory adjustmentAdj. EBITDA 154.0 177.2 (23.2) -13% 112.7 37%
EPU ($6.25) $0.35 ($6.60) -1899% $0.15 -4153%Average Units Outstanding 93.6 95.3 (1.7) -2% 50.3 86%
Distributable Cash Flow (DCF)Adjusted EBITDA 154.0 177.2 (23.2) -13% 112.7 37%(-) Maintenance Capex 33.0 24.8 8.2 33% 15.9 107%(-) Cash Interest Expenses 53.0 48.7 4.3 9% 26.6 99%(+) Other Adjustments 5.0 3.0 2.0 NM (20.4) -124%Total Distributable Cash Flow 63.0 100.7 (37.7) -37% 90.6 -31%(-) Cash Paid to General Partner (GP) 21.0 20.3 0.6 3% 16.5 27%(-) GP Portion of Surplus Cash Flow / (Cash Flow Deficit)* 81.0 78.7 2.3 3% 70.0 16%DCF to Limited Partners 61.5 79.5 (18.0) -23% 72.1 -15%
DCF per LP unit $0.6269 $0.8341 ($0.2072) -25% $0.8248 -24%
Cash Distribution Declared Per Unit $0.8255 $0.8255 $0.0000 0% $0.8013 3%
Distribution Coverage (Total DCF/Total Distribution Declared) 0.62x 1.02x -0.40x -39% 1.05x -41%
Leverage
Capital Expenditures & AcquisitionsGrowth Capex 115.1 150.0 (34.9) -23% 91.3 26%Maintenance Capex 33.0 24.8 8.2 33% 15.9 107%Acquisitions 53.0 53.0 0.0 0% 118.0 -55%Total Capital Expenditures & Acquisitions 201.1 227.8 (26.7) -12% 225.2 -11%
Operating MetricsMotor fuel gallons sold ('000 gallons):Retail 626,000 600,025 25,975 4% 354,028 77%Wholesale 1,359,000 1,233,220 125,780 10% 1,241,019 10%Total 1,985,000 1,833,245 151,755 8% 1,861,053 7%
Motor fuel gross profit ($/Gal):Retail $0.257 $0.255 $0.002 1% $0.224 15%Wholesale $0.090 $0.082 $0.008 9% $0.098 -8%Volume weighted average for all gallons $0.143 $0.139 $0.004 3% $0.114 25%
Retail Merchandise Margin 29.9% 32.0% -2.1% -7% 33.1% -10%
Comments
Source: Company data, Credit Suisse estimates

28 February 2017
Energy Transfer 4Q16 Review (ETE | ETP | SXL | SUN) 33
Companies Mentioned (Price as of 27-Feb-2017)Energy Transfer Equity, LP (ETE.N, $18.96, OUTPERFORM[V], TP $22.0)Energy Transfer Partners, LP (ETP.N, $37.68, OUTPERFORM, TP $45.0)Sunoco Logistics Partners, LP (SXL.N, $25.23, OUTPERFORM, TP $31.0)Sunoco, LP (SUN.N, $26.52, OUTPERFORM, TP $30.0)
Disclosure AppendixAnalyst Certification John Edwards, CFA, and Bhavesh Lodaya each certify, with respect to the companies or securities that the individual analyzes, that (1) the views expressed in this report accurately reflect his or her personal views about all of the subject companies and securities and (2) no part of his or her compensation was, is or will be directly or indirectly related to the specific recommendations or views expressed in this report.
3-Year Price and Rating History for Energy Transfer Equity, LP (ETE.N)
ETE.N Closing Price Target Price Date (US$) (US$) Rating 28-Apr-14 23.37 R 02-May-14 23.40 26.00 O 06-May-14 23.64 27.50 08-May-14 24.70 28.00 25-Jun-14 29.08 30.00 26-Jun-14 29.00 32.00 02-Sep-14 30.36 33.50 06-Nov-14 29.90 36.50 19-Nov-14 31.95 39.50 05-Jan-15 27.00 39.00 15-Jul-15 32.26 R 16-Jul-15 32.26 39.00 O 05-Aug-15 27.94 39.00 * 07-Aug-15 27.39 38.00 28-Sep-15 20.29 R 26-Jul-16 16.49 20.00 O * Asterisk signifies initiation or assumption of coverage.
Target Price Closing Price ETE.N
01- Jan- 2015 01- Jan- 2016 01- Jan- 20174
14
24
34
44
REST RIC T EDO U T PERFO RM

28 February 2017
Energy Transfer 4Q16 Review (ETE | ETP | SXL | SUN) 34
3-Year Price and Rating History for Energy Transfer Partners, LP (ETP.N)
ETP.N Closing Price Target Price Date (US$) (US$) Rating 28-Apr-14 55.23 R 02-May-14 55.44 58.00 N 08-May-14 56.52 60.00 07-Aug-14 56.36 62.00 15-Aug-14 57.56 R 02-Sep-14 57.05 64.00 N 22-Oct-14 63.66 R 05-Nov-14 63.24 64.00 N 06-Nov-14 63.47 68.00 19-Nov-14 67.75 78.00 02-Jan-15 65.65 R 08-Jan-15 64.10 78.00 N 21-Jan-15 64.15 77.00 O 15-Jul-15 53.03 R 16-Jul-15 53.03 77.00 O 05-Aug-15 46.33 77.00 * 07-Aug-15 46.87 67.00 06-Nov-15 42.01 68.00 21-Dec-15 28.41 51.00 20-Jan-16 21.50 42.00 01-Mar-16 26.40 40.00 06-May-16 35.38 42.00 07-Jul-16 37.54 R 08-Jul-16 37.54 42.00 O 26-Jul-16 39.75 49.00 05-Aug-16 42.28 52.00 20-Oct-16 36.45 50.00 25-Oct-16 36.24 R 14-Nov-16 38.68 50.00 O 25-Jan-17 38.63 45.00 * Asterisk signifies initiation or assumption of coverage.
Target Price Closing Price ETP.N
01- Jan- 2015 01- Jan- 2016 01- Jan- 201710
35
60
85
REST RIC T EDN EU T RA L
O U T PERFO RM
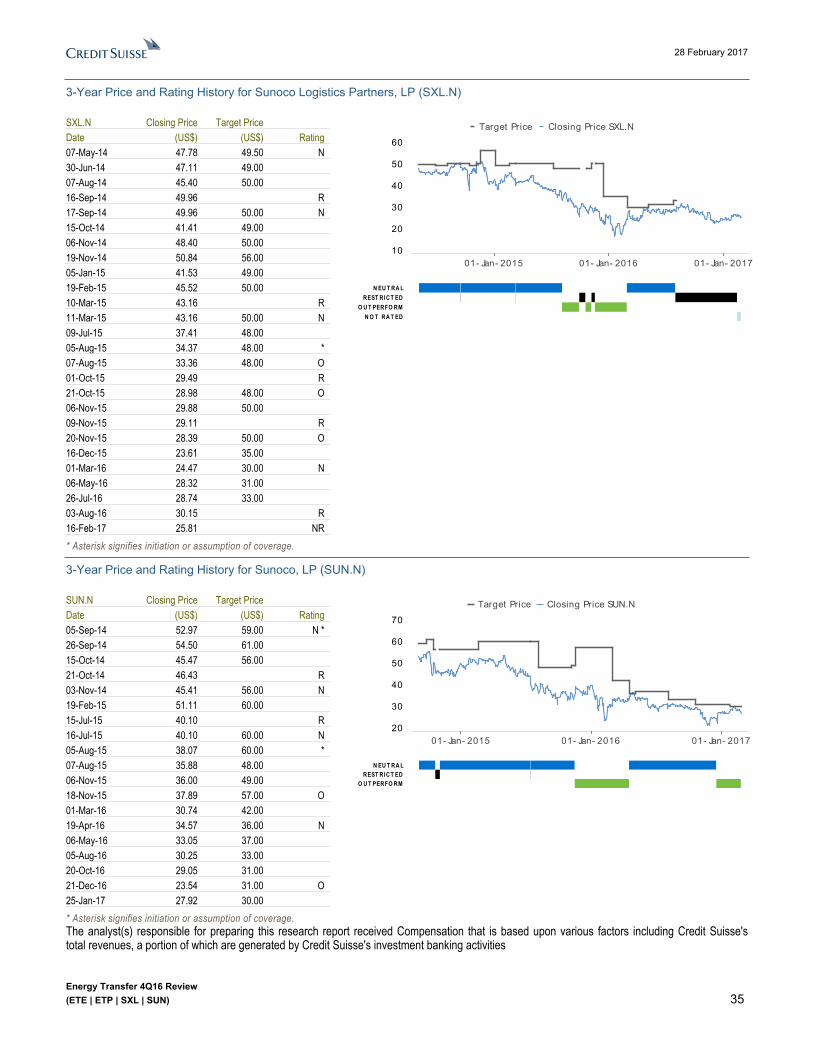
28 February 2017
Energy Transfer 4Q16 Review (ETE | ETP | SXL | SUN) 35
3-Year Price and Rating History for Sunoco Logistics Partners, LP (SXL.N)
SXL.N Closing Price Target Price Date (US$) (US$) Rating 07-May-14 47.78 49.50 N 30-Jun-14 47.11 49.00 07-Aug-14 45.40 50.00 16-Sep-14 49.96 R 17-Sep-14 49.96 50.00 N 15-Oct-14 41.41 49.00 06-Nov-14 48.40 50.00 19-Nov-14 50.84 56.00 05-Jan-15 41.53 49.00 19-Feb-15 45.52 50.00 10-Mar-15 43.16 R 11-Mar-15 43.16 50.00 N 09-Jul-15 37.41 48.00 05-Aug-15 34.37 48.00 * 07-Aug-15 33.36 48.00 O 01-Oct-15 29.49 R 21-Oct-15 28.98 48.00 O 06-Nov-15 29.88 50.00 09-Nov-15 29.11 R 20-Nov-15 28.39 50.00 O 16-Dec-15 23.61 35.00 01-Mar-16 24.47 30.00 N 06-May-16 28.32 31.00 26-Jul-16 28.74 33.00 03-Aug-16 30.15 R 16-Feb-17 25.81 NR * Asterisk signifies initiation or assumption of coverage.
Target Price Closing Price SXL.N
01- Jan- 2015 01- Jan- 2016 01- Jan- 201710
20
30
40
50
60
N EU T RA LREST RIC T ED
O U T PERFO RMN O T RA T ED
3-Year Price and Rating History for Sunoco, LP (SUN.N)
SUN.N Closing Price Target Price Date (US$) (US$) Rating 05-Sep-14 52.97 59.00 N * 26-Sep-14 54.50 61.00 15-Oct-14 45.47 56.00 21-Oct-14 46.43 R 03-Nov-14 45.41 56.00 N 19-Feb-15 51.11 60.00 15-Jul-15 40.10 R 16-Jul-15 40.10 60.00 N 05-Aug-15 38.07 60.00 * 07-Aug-15 35.88 48.00 06-Nov-15 36.00 49.00 18-Nov-15 37.89 57.00 O 01-Mar-16 30.74 42.00 19-Apr-16 34.57 36.00 N 06-May-16 33.05 37.00 05-Aug-16 30.25 33.00 20-Oct-16 29.05 31.00 21-Dec-16 23.54 31.00 O 25-Jan-17 27.92 30.00 * Asterisk signifies initiation or assumption of coverage.
Target Price Closing Price SUN.N
01- Jan- 2015 01- Jan- 2016 01- Jan- 201720
30
40
50
60
70
N EU T RA LREST RIC T ED
O U T PERFO RM
The analyst(s) responsible for preparing this research report received Compensation that is based upon various factors including Credit Suisse's total revenues, a portion of which are generated by Credit Suisse's investment banking activities

28 February 2017
Energy Transfer 4Q16 Review (ETE | ETP | SXL | SUN) 36
As of December 10, 2012 Analysts’ stock rating are defined as follows:Outperform (O) : The stock’s total return is expected to outperform the relevant benchmark* over the next 12 months.Neutral (N) : The stock’s total return is expected to be in line with the relevant benchmark* over the next 12 months.Underperform (U) : The stock’s total return is expected to underperform the relevant benchmark* over the next 12 months. *Relevant benchmark by region: As of 10th December 2012, Japanese ratings are based on a stock’s total return relative to the analyst's coverage universe which consists of all companies covered by the analyst within the relevant sector, with Outperforms representing the most attractive, Neutrals the less attractive, and Underperforms the least attractive investment opportunities. As of 2nd October 2012, U.S. and Canadian as well as European ratings are based on a stock’s total return relative to the analyst's coverage universe which consists of all companies covered by the analyst within the relevant sector, with Outperforms representing the most attractive, Neutrals the less attractive, and Underperforms the least attractive investment opportunities. For Latin American and non-Japan Asia stocks, ratings are based on a stock’s total return relative to the average total return of the relevant country or regional benchmark; prior to 2nd October 2012 U.S. and Canadian ratings were based on (1) a stock’s absolute total return potential to its current share price and (2) the relative attractiveness of a stock’s total return potential within an analyst’s coverage universe. For Australian and New Zealand stocks, the expected total return (ETR) calculation includes 12-month rolling dividend yield. An Outperform rating is assigned where an ETR is greater than or equal to 7.5%; Underperform where an ETR less than or equal to 5%. A Neutral may be assigned where the ETR is between -5% and 15%. The overlapping rating range allows analysts to assign a rating that puts ETR in the context of associated risks. Prior to 18 May 2015, ETR ranges for Outperform and Underperform ratings did not overlap with Neutral thresholds between 15% and 7.5%, which was in operation from 7 July 2011.Restricted (R) : In certain circumstances, Credit Suisse policy and/or applicable law and regulations preclude certain types of communications, including an investment recommendation, during the course of Credit Suisse's engagement in an investment banking transaction and in certain other circumstances.Not Rated (NR) : Credit Suisse Equity Research does not have an investment rating or view on the stock or any other securities related to the company at this time.Not Covered (NC) : Credit Suisse Equity Research does not provide ongoing coverage of the company or offer an investment rating or investment view on the equity security of the company or related products.Volatility Indicator [V] : A stock is defined as volatile if the stock price has moved up or down by 20% or more in a month in at least 8 of the past 24 months or the analyst expects significant volatility going forward.Analysts’ sector weightings are distinct from analysts’ stock ratings and are based on the analyst’s expectations for the fundamentals and/or valuation of the sector* relative to the group’s historic fundamentals and/or valuation:Overweight : The analyst’s expectation for the sector’s fundamentals and/or valuation is favorable over the next 12 months.Market Weight : The analyst’s expectation for the sector’s fundamentals and/or valuation is neutral over the next 12 months.Underweight : The analyst’s expectation for the sector’s fundamentals and/or valuation is cautious over the next 12 months. *An analyst’s coverage sector consists of all companies covered by the analyst within the relevant sector. An analyst may cover multiple sectors.
Credit Suisse's distribution of stock ratings (and banking clients) is:
Global Ratings DistributionRating Versus universe (%) Of which banking clients (%)Outperform/Buy* 45% (64% banking clients)Neutral/Hold* 39% (60% banking clients)Underperform/Sell* 14% (53% banking clients)Restricted 2%*For purposes of the NYSE and FINRA ratings distribution disclosure requirements, our stock ratings of Outperform, Neutral, and Underperform most closely correspond to Buy, Hold, and Sell, respectively; however, the meanings are not the same, as our stock ratings are determined on a relative basis. (Please refer to definitions above.) An investor's decision to buy or sell a security should be based on investment objectives, current holdings, and other individual factors.
Important Global Disclosures Credit Suisse’s research reports are made available to clients through our proprietary research portal on CS PLUS. Credit Suisse research products may also be made available through third-party vendors or alternate electronic means as a convenience. Certain research products are only made available through CS PLUS. The services provided by Credit Suisse’s analysts to clients may depend on a specific client’s preferences regarding the frequency and manner of receiving communications, the client’s risk profile and investment, the size and scope of the overall client relationship with the Firm, as well as legal and regulatory constraints. To access all of Credit Suisse’s research that you are entitled to receive in the most timely manner, please contact your sales representative or go to https://plus.credit-suisse.com . Credit Suisse’s policy is to update research reports as it deems appropriate, based on developments with the subject company, the sector or the market that may have a material impact on the research views or opinions stated herein.Credit Suisse's policy is only to publish investment research that is impartial, independent, clear, fair and not misleading. For more detail please refer to Credit Suisse's Policies for Managing Conflicts of Interest in connection with Investment Research: https://www.credit-suisse.com/sites/disclaimers-ib/en/managing-conflicts.html . Credit Suisse does not provide any tax advice. Any statement herein regarding any US federal tax is not intended or written to be used, and cannot be used, by any taxpayer for the purposes of avoiding any penalties.
Target Price and RatingValuation Methodology and Risks: (12 months) for Energy Transfer Equity, LP (ETE.N)
Method: Our $22 target price is based on an equal weighted blend of P/DCF and 3-stage DDM. Our TP implies ~23% NTM total returns, keeping us at Outperform.
Risk: Risk to our $22 target price and Outperform rating for ETE include: Subsidiary Business Risks – ETE derives its cash flows from ownership of LP + GP interests in ETP and SUN and ownership of GP interests in SXL. Any difficulties that affect the normal course of
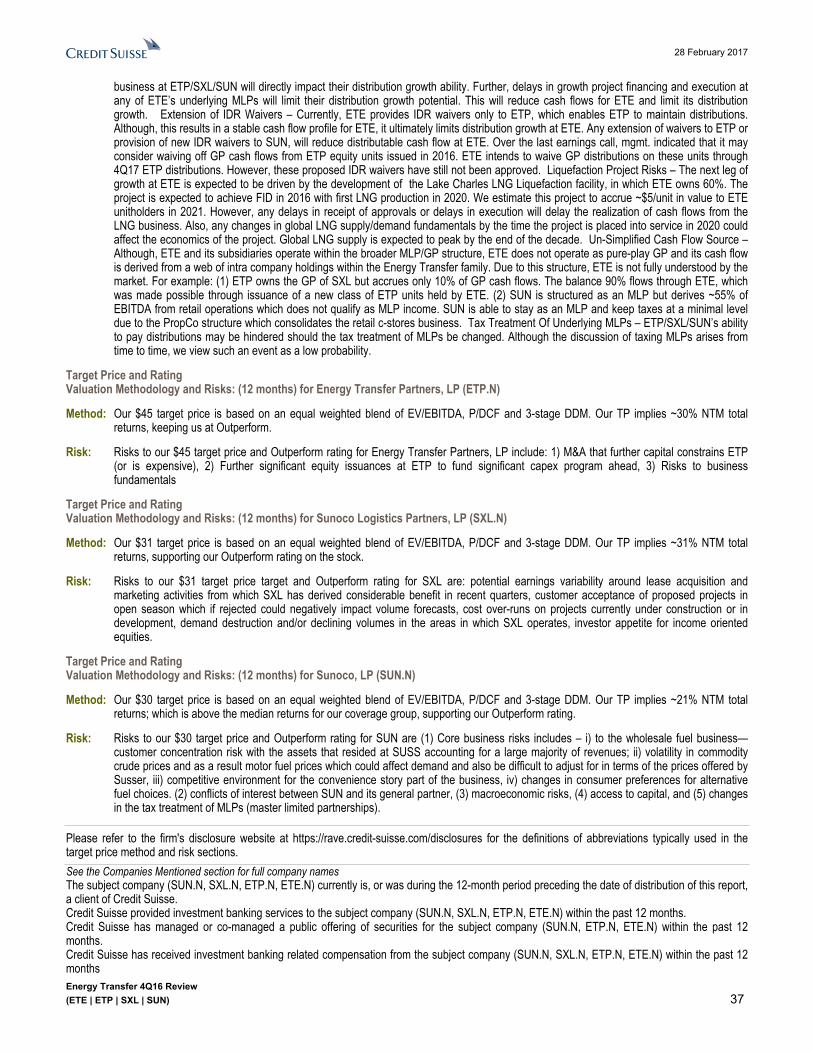
28 February 2017
Energy Transfer 4Q16 Review (ETE | ETP | SXL | SUN) 37
business at ETP/SXL/SUN will directly impact their distribution growth ability. Further, delays in growth project financing and execution at any of ETE’s underlying MLPs will limit their distribution growth potential. This will reduce cash flows for ETE and limit its distribution growth. Extension of IDR Waivers – Currently, ETE provides IDR waivers only to ETP, which enables ETP to maintain distributions. Although, this results in a stable cash flow profile for ETE, it ultimately limits distribution growth at ETE. Any extension of waivers to ETP or provision of new IDR waivers to SUN, will reduce distributable cash flow at ETE. Over the last earnings call, mgmt. indicated that it may consider waiving off GP cash flows from ETP equity units issued in 2016. ETE intends to waive GP distributions on these units through 4Q17 ETP distributions. However, these proposed IDR waivers have still not been approved. Liquefaction Project Risks – The next leg of growth at ETE is expected to be driven by the development of the Lake Charles LNG Liquefaction facility, in which ETE owns 60%. The project is expected to achieve FID in 2016 with first LNG production in 2020. We estimate this project to accrue ~$5/unit in value to ETE unitholders in 2021. However, any delays in receipt of approvals or delays in execution will delay the realization of cash flows from the LNG business. Also, any changes in global LNG supply/demand fundamentals by the time the project is placed into service in 2020 could affect the economics of the project. Global LNG supply is expected to peak by the end of the decade. Un-Simplified Cash Flow Source – Although, ETE and its subsidiaries operate within the broader MLP/GP structure, ETE does not operate as pure-play GP and its cash flow is derived from a web of intra company holdings within the Energy Transfer family. Due to this structure, ETE is not fully understood by the market. For example: (1) ETP owns the GP of SXL but accrues only 10% of GP cash flows. The balance 90% flows through ETE, which was made possible through issuance of a new class of ETP units held by ETE. (2) SUN is structured as an MLP but derives ~55% of EBITDA from retail operations which does not qualify as MLP income. SUN is able to stay as an MLP and keep taxes at a minimal level due to the PropCo structure which consolidates the retail c-stores business. Tax Treatment Of Underlying MLPs – ETP/SXL/SUN’s ability to pay distributions may be hindered should the tax treatment of MLPs be changed. Although the discussion of taxing MLPs arises from time to time, we view such an event as a low probability.
Target Price and RatingValuation Methodology and Risks: (12 months) for Energy Transfer Partners, LP (ETP.N)
Method: Our $45 target price is based on an equal weighted blend of EV/EBITDA, P/DCF and 3-stage DDM. Our TP implies ~30% NTM total returns, keeping us at Outperform.
Risk: Risks to our $45 target price and Outperform rating for Energy Transfer Partners, LP include: 1) M&A that further capital constrains ETP (or is expensive), 2) Further significant equity issuances at ETP to fund significant capex program ahead, 3) Risks to business fundamentals
Target Price and RatingValuation Methodology and Risks: (12 months) for Sunoco Logistics Partners, LP (SXL.N)
Method: Our $31 target price is based on an equal weighted blend of EV/EBITDA, P/DCF and 3-stage DDM. Our TP implies ~31% NTM total returns, supporting our Outperform rating on the stock.
Risk: Risks to our $31 target price target and Outperform rating for SXL are: potential earnings variability around lease acquisition and marketing activities from which SXL has derived considerable benefit in recent quarters, customer acceptance of proposed projects in open season which if rejected could negatively impact volume forecasts, cost over-runs on projects currently under construction or in development, demand destruction and/or declining volumes in the areas in which SXL operates, investor appetite for income oriented equities.
Target Price and RatingValuation Methodology and Risks: (12 months) for Sunoco, LP (SUN.N)
Method: Our $30 target price is based on an equal weighted blend of EV/EBITDA, P/DCF and 3-stage DDM. Our TP implies ~21% NTM total returns; which is above the median returns for our coverage group, supporting our Outperform rating.
Risk: Risks to our $30 target price and Outperform rating for SUN are (1) Core business risks includes – i) to the wholesale fuel business—customer concentration risk with the assets that resided at SUSS accounting for a large majority of revenues; ii) volatility in commodity crude prices and as a result motor fuel prices which could affect demand and also be difficult to adjust for in terms of the prices offered by Susser, iii) competitive environment for the convenience story part of the business, iv) changes in consumer preferences for alternative fuel choices. (2) conflicts of interest between SUN and its general partner, (3) macroeconomic risks, (4) access to capital, and (5) changes in the tax treatment of MLPs (master limited partnerships).
Please refer to the firm's disclosure website at https://rave.credit-suisse.com/disclosures for the definitions of abbreviations typically used in the target price method and risk sections. See the Companies Mentioned section for full company names The subject company (SUN.N, SXL.N, ETP.N, ETE.N) currently is, or was during the 12-month period preceding the date of distribution of this report, a client of Credit Suisse.Credit Suisse provided investment banking services to the subject company (SUN.N, SXL.N, ETP.N, ETE.N) within the past 12 months.Credit Suisse has managed or co-managed a public offering of securities for the subject company (SUN.N, ETP.N, ETE.N) within the past 12 months.Credit Suisse has received investment banking related compensation from the subject company (SUN.N, SXL.N, ETP.N, ETE.N) within the past 12 months

28 February 2017
Energy Transfer 4Q16 Review (ETE | ETP | SXL | SUN) 38
Credit Suisse expects to receive or intends to seek investment banking related compensation from the subject company (SUN.N, SXL.N, ETP.N, ETE.N) within the next 3 months.As of the end of the preceding month, Credit Suisse beneficially own 1% or more of a class of common equity securities of (ETE.N).Credit Suisse beneficially holds >0.5% long position of the total issued share capital of the subject company (ETP.N, ETE.N).Credit Suisse has a material conflict of interest with the subject company (ETE.N) . Credit Suisse is acting as financial advisor to Energy Transfer Equity (ETE) on its announced acquisition of The Williams Companies (WMB).For date and time of production, dissemination and history of recommendation for the subject company(ies) featured in this report, disseminated within the past 12 months, please refer to the link: https://rave.credit-suisse.com/disclosures/view/report?i=286001&v=3yw1ybqrfv7dd0xhfv9409wkg . Important Regional Disclosures Singapore recipients should contact Credit Suisse AG, Singapore Branch for any matters arising from this research report.The analyst(s) involved in the preparation of this report may participate in events hosted by the subject company, including site visits. Credit Suisse does not accept or permit analysts to accept payment or reimbursement for travel expenses associated with these events.Restrictions on certain Canadian securities are indicated by the following abbreviations: NVS--Non-Voting shares; RVS--Restricted Voting Shares; SVS--Subordinate Voting Shares.Individuals receiving this report from a Canadian investment dealer that is not affiliated with Credit Suisse should be advised that this report may not contain regulatory disclosures the non-affiliated Canadian investment dealer would be required to make if this were its own report.For Credit Suisse Securities (Canada), Inc.'s policies and procedures regarding the dissemination of equity research, please visit https://www.credit-suisse.com/sites/disclaimers-ib/en/canada-research-policy.html.Credit Suisse has acted as lead manager or syndicate member in a public offering of securities for the subject company (SUN.N, SXL.N, ETP.N, ETE.N) within the past 3 years.Principal is not guaranteed in the case of equities because equity prices are variable.Commission is the commission rate or the amount agreed with a customer when setting up an account or at any time after that.This research report is authored by:Credit Suisse Securities (USA) LLC .................................................................................John Edwards, CFA ; Bhavesh Lodaya ; Dylan NassanoFor Credit Suisse disclosure information on other companies mentioned in this report, please visit the website at https://rave.credit-suisse.com/disclosures or call +1 (877) 291-2683.

28 February 2017
Energy Transfer 4Q16 Review (ETE | ETP | SXL | SUN) 39
This report is produced by subsidiaries and affiliates of Credit Suisse operating under its Global Markets Division. For more information on our structure, please use the following link: https://www.credit-suisse.com/who-we-are This report may contain material that is not directed to, or intended for distribution to or use by, any person or entity who is a citizen or resident of or located in any locality, state, country or other jurisdiction where such distribution, publication, availability or use would be contrary to law or regulation or which would subject Credit Suisse or its affiliates ("CS") to any registration or licensing requirement within such jurisdiction. All material presented in this report, unless specifically indicated otherwise, is under copyright to CS. None of the material, nor its content, nor any copy of it, may be altered in any way, transmitted to, copied or distributed to any other party, without the prior express written permission of CS. All trademarks, service marks and logos used in this report are trademarks or service marks or registered trademarks or service marks of CS or its affiliates.The information, tools and material presented in this report are provided to you for information purposes only and are not to be used or considered as an offer or the solicitation of an offer to sell or to buy or subscribe for securities or other financial instruments. CS may not have taken any steps to ensure that the securities referred to in this report are suitable for any particular investor. CS will not treat recipients of this report as its customers by virtue of their receiving this report. The investments and services contained or referred to in this report may not be suitable for you and it is recommended that you consult an independent investment advisor if you are in doubt about such investments or investment services. Nothing in this report constitutes investment, legal, accounting or tax advice, or a representation that any investment or strategy is suitable or appropriate to your individual circumstances, or otherwise constitutes a personal recommendation to you. CS does not advise on the tax consequences of investments and you are advised to contact an independent tax adviser. Please note in particular that the bases and levels of taxation may change. Information and opinions presented in this report have been obtained or derived from sources believed by CS to be reliable, but CS makes no representation as to their accuracy or completeness. CS accepts no liability for loss arising from the use of the material presented in this report, except that this exclusion of liability does not apply to the extent that such liability arises under specific statutes or regulations applicable to CS. This report is not to be relied upon in substitution for the exercise of independent judgment. CS may have issued, and may in the future issue, other communications that are inconsistent with, and reach different conclusions from, the information presented in this report. Those communications reflect the different assumptions, views and analytical methods of the analysts who prepared them and CS is under no obligation to ensure that such other communications are brought to the attention of any recipient of this report. Some investments referred to in this report will be offered solely by a single entity and in the case of some investments solely by CS, or an associate of CS or CS may be the only market maker in such investments. Past performance should not be taken as an indication or guarantee of future performance, and no representation or warranty, express or implied, is made regarding future performance. Information, opinions and estimates contained in this report reflect a judgment at its original date of publication by CS and are subject to change without notice. The price, value of and income from any of the securities or financial instruments mentioned in this report can fall as well as rise. The value of securities and financial instruments is subject to exchange rate fluctuation that may have a positive or adverse effect on the price or income of such securities or financial instruments. Investors in securities such as ADR's, the values of which are influenced by currency volatility, effectively assume this risk. Structured securities are complex instruments, typically involve a high degree of risk and are intended for sale only to sophisticated investors who are capable of understanding and assuming the risks involved. The market value of any structured security may be affected by changes in economic, financial and political factors (including, but not limited to, spot and forward interest and exchange rates), time to maturity, market conditions and volatility, and the credit quality of any issuer or reference issuer. Any investor interested in purchasing a structured product should conduct their own investigation and analysis of the product and consult with their own professional advisers as to the risks involved in making such a purchase. Some investments discussed in this report may have a high level of volatility. High volatility investments may experience sudden and large falls in their value causing losses when that investment is realised. Those losses may equal your original investment. Indeed, in the case of some investments the potential losses may exceed the amount of initial investment and, in such circumstances, you may be required to pay more money to support those losses. Income yields from investments may fluctuate and, in consequence, initial capital paid to make the investment may be used as part of that income yield. Some investments may not be readily realisable and it may be difficult to sell or realise those investments, similarly it may prove difficult for you to obtain reliable information about the value, or risks, to which such an investment is exposed. This report may provide the addresses of, or contain hyperlinks to, websites. Except to the extent to which the report refers to website material of CS, CS has not reviewed any such site and takes no responsibility for the content contained therein. Such address or hyperlink (including addresses or hyperlinks to CS's own website material) is provided solely for your convenience and information and the content of any such website does not in any way form part of this document. Accessing such website or following such link through this report or CS's website shall be at your own risk.
This report is issued and distributed in European Union (except Switzerland): by Credit Suisse Securities (Europe) Limited, One Cabot Square, London E14 4QJ, England, which is authorised by the Prudential Regulation Authority and regulated by the Financial Conduct Authority and the Prudential Regulation Authority. Germany: Credit Suisse Securities (Europe) Limited Niederlassung Frankfurt am Main regulated by the Bundesanstalt fuer Finanzdienstleistungsaufsicht ("BaFin"). United States and Canada: Credit Suisse Securities (USA) LLC; Switzerland: Credit Suisse AG; Brazil: Banco de Investimentos Credit Suisse (Brasil) S.A or its affiliates; Mexico: Banco Credit Suisse (México), S.A. (transactions related to the securities mentioned in this report will only be effected in compliance with applicable regulation); Japan: by Credit Suisse Securities (Japan) Limited, Financial Instruments Firm, Director-General of Kanto Local Finance Bureau ( Kinsho) No. 66, a member of Japan Securities Dealers Association, The Financial Futures Association of Japan, Japan Investment Advisers Association, Type II Financial Instruments Firms Association; Hong Kong: Credit Suisse (Hong Kong) Limited; Australia: Credit Suisse Equities (Australia) Limited; Thailand: Credit Suisse Securities (Thailand) Limited, regulated by the Office of the Securities and Exchange Commission, Thailand, having registered address at 990 Abdulrahim Place, 27th Floor, Unit 2701, Rama IV Road, Silom, Bangrak, Bangkok10500, Thailand, Tel. +66 2614 6000; Malaysia: Credit Suisse Securities (Malaysia) Sdn Bhd; Singapore: Credit Suisse AG, Singapore Branch; India: Credit Suisse Securities (India) Private Limited (CIN no.U67120MH1996PTC104392) regulated by the Securities and Exchange Board of India as Research Analyst (registration no. INH 000001030) and as Stock Broker (registration no. INB230970637; INF230970637; INB010970631; INF010970631), having registered address at 9th Floor, Ceejay House, Dr.A.B. Road, Worli, Mumbai - 18, India, T- +91-22 6777 3777; South Korea: Credit Suisse Securities (Europe) Limited, Seoul Branch; Taiwan: Credit Suisse AG Taipei Securities Branch; Indonesia: PT Credit Suisse Securities Indonesia; Philippines:Credit Suisse Securities (Philippines ) Inc., and elsewhere in the world by the relevant authorised affiliate of the above.Additional Regional DisclaimersHong Kong: Credit Suisse (Hong Kong) Limited ("CSHK") is licensed and regulated by the Securities and Futures Commission of Hong Kong under the laws of Hong Kong, which differ from Australian laws. CSHKL does not hold an Australian financial services licence (AFSL) and is exempt from the requirement to hold an AFSL under the Corporations Act 2001 (the Act) under Class Order 03/1103 published by the ASIC in respect of financial services provided to Australian wholesale clients (within the meaning of section 761G of the Act). Research on Taiwanese securities produced by Credit Suisse AG, Taipei Securities Branch has been prepared by a registered Senior Business Person. Australia (to the extent services are offered in Australia): Credit Suisse Securities (Europe) Limited (“CSSEL”) and Credit Suisse International (“CSI”) are authorised by the Prudential Regulation Authority and regulated by the Financial Conduct Authority (“FCA”) and the Prudential Regulation Authority under UK laws, which differ from Australian Laws. CSSEL and CSI do not hold an Australian Financial Services Licence (“AFSL”) and are exempt from the requirement to hold an AFSL under the Corporations Act (Cth) 2001 (“Corporations Act”) under Class Order 03/1099 published by the Australian Securities and Investments Commission (“ASIC”), in respect of the financial services provided to Australian wholesale clients (within the meaning of section 761G of the Corporations Act). This material is not for distribution to retail clients and is directed exclusively at Credit Suisse's professional clients and eligible counterparties as defined by the FCA, and wholesale clients as defined under section 761G of the Corporations Act. Credit Suisse (Hong Kong) Limited (“CSHK”) is licensed and regulated by the Securities and Futures Commission of Hong Kong under the laws of Hong Kong, which differ from Australian laws. CSHKL does not hold an AFSL and is exempt from the requirement to hold an AFSL under the Corporations Act under Class Order 03/1103 published by the ASIC in respect of financial services provided to Australian wholesale clients (within the meaning of section 761G of the Corporations Act). Credit Suisse Securities (USA) LLC (CSSU) and Credit Suisse Asset Management LLC (CSAM LLC) are licensed and regulated by the Securities Exchange Commission of the United States under the laws of the United States, which differ from Australian laws. CSSU and CSAM LLC do not hold an AFSL and is exempt from the requirement to hold an AFSL under the Corporations Act under Class Order 03/1100 published by the ASIC in respect of financial services provided to Australian wholesale clients (within the meaning of section 761G of the Corporations Act). Malaysia: Research provided to residents of Malaysia is authorised by the Head of Research for Credit Suisse Securities (Malaysia) Sdn Bhd, to whom they should direct any queries on +603 2723 2020. Singapore: This report has been prepared and issued for distribution in Singapore to institutional investors, accredited investors and expert investors (each as defined under the Financial Advisers Regulations) only, and is also distributed by Credit Suisse AG, Singapore Branch to overseas investors (as defined under the Financial Advisers Regulations). Credit Suisse AG, Singapore Branch may distribute reports produced by its foreign entities or affiliates pursuant to an arrangement under Regulation 32C of the Financial Advisers Regulations. Singapore recipients should contact Credit Suisse AG, Singapore Branch at +65-6212-2000 for matters arising from, or in connection with, this report. By virtue of your status as an institutional investor, accredited investor, expert investor or overseas investor, Credit Suisse AG, Singapore Branch is exempted from complying with certain compliance requirements under the Financial Advisers Act, Chapter 110 of Singapore (the “FAA”), the Financial Advisers Regulations and the relevant Notices and Guidelines issued thereunder, in respect of any financial advisory service which Credit Suisse AG, Singapore Branch may provide to you. UAE: This information is being distributed by Credit Suisse AG (DIFC Branch), duly licensed and regulated by the Dubai Financial Services Authority (“DFSA”). Related financial services or products are only made available to Professional Clients or Market Counterparties, as defined by the DFSA, and are not intended for any other persons. Credit Suisse AG (DIFC Branch) is located on Level 9 East, The Gate Building, DIFC, Dubai, United Arab Emirates. EU: This report has been produced by subsidiaries and affiliates of Credit Suisse operating under its Global Markets Division In jurisdictions where CS is not already registered or licensed to trade in securities, transactions will only be effected in accordance with applicable securities legislation, which will vary from jurisdiction to jurisdiction and may require that the trade be made in accordance with applicable exemptions from registration or licensing requirements. Non-US customers wishing to effect a transaction should contact a CS entity in their local jurisdiction unless governing law permits otherwise. US customers wishing to effect a transaction should do so only by contacting a representative at Credit Suisse Securities (USA) LLC in the US. Please note that this research was originally prepared and issued by CS for distribution to their market professional and institutional investor customers. Recipients who are not market professional or institutional investor customers of CS should seek the advice of their independent financial advisor prior to taking any investment decision based on this report or for any necessary explanation of its contents. This research may relate to investments or services of a person outside of the UK or to other matters which are not authorised by the Prudential Regulation Authority and regulated by the Financial Conduct Authority and the Prudential Regulation Authority or in respect of which the protections of the Prudential Regulation Authority and Financial Conduct Authority for private customers and/or the UK compensation scheme may not be available, and further details as to where this may be the case are available upon request in respect of this report. CS may provide various services to US municipal entities or obligated persons ("municipalities"), including suggesting individual transactions or trades and entering into such transactions. Any services CS provides to municipalities are not viewed as "advice" within the meaning of Section 975 of the Dodd-Frank Wall Street Reform and Consumer Protection Act. CS is providing any such services and related information solely on an arm's length basis and not as an advisor or fiduciary to the municipality. In connection with the provision of the any such services, there is no agreement, direct or indirect, between any municipality (including the officials,management, employees or agents thereof) and CS for CS to provide advice to the municipality. Municipalities should consult with their financial, accounting and legal advisors regarding any such services provided by CS. In addition, CS is not acting for direct or indirect compensation to solicit the municipality on behalf of an unaffiliated broker, dealer, municipal securities dealer, municipal advisor, or investment adviser for the purpose of obtaining or retaining an engagement by the municipality for or in connection with Municipal Financial Products, the issuance of municipal securities, or of an investment adviser to provide investment advisory services to or on behalf of the municipality. If this report is being distributed by a financial institution other than Credit Suisse AG, or its affiliates, that financial institution is solely responsible for distribution. Clients of that institution should contact that institution to effect a transaction in the securities mentioned in this report or require further information. This report does not constitute investment advice by Credit Suisse to the clients of the distributing financial institution, and neither Credit Suisse AG, its affiliates, and their respective officers, directors and employees accept any liability whatsoever for any direct or consequential loss arising from their use of this report or its content. Principal is not guaranteed. Commission is the commission rate or the amount agreed with a customer when setting up an account or at any time after that. Copyright © 2017 CREDIT SUISSE AG and/or its affiliates. All rights reserved. Investment principal on bonds can be eroded depending on sale price or market price. In addition, there are bonds on which investment principal can be eroded due to changes in redemption amounts. Care is required when investing in such instruments. When you purchase non-listed Japanese fixed income securities (Japanese government bonds, Japanese municipal bonds, Japanese government guaranteed bonds, Japanese corporate bonds) from CS as a seller, you will be requested to pay the purchase price only.