Merger Between Edgefront REIT and Nobel REITApril-2017).pdf · NEXUS INVESTOR PRESENTATION | APRIL...
21
BUILDING THE FOUNDATION FOR THE NEXT CANADIAN “BLUE CHIP” REIT INVESTOR PRESENTATION April 2017 NEXUS REAL ESTATE INVESTMENT TRUST
Transcript of Merger Between Edgefront REIT and Nobel REITApril-2017).pdf · NEXUS INVESTOR PRESENTATION | APRIL...
BUILDING THE FOUNDATION FOR
THE NEXT CANADIAN “BLUE CHIP” REIT
INVESTOR PRESENTATION
April 2017 NEXUS REAL ESTATE INVESTMENT TRUST

2 INVESTOR PRESENTATION | APRIL 2017 NEXUS
This presentation is confidential and is being supplied to you solely for your information and may not be reproduced or distributed to any other person or published, in whole or in part, for any purpose. No reliance may be placed for any purpose whatsoever on the information contained in this presentation or the completeness or accuracy of such information. No representation or warranty, express or implied, is given by or on behalf of Nexus REIT (the “REIT”), or its unitholders, trustees, officers or employees or any other person as to the accuracy or completeness of the information or opinions contained in this presentation, and no liability is accepted for any such information or opinions.
This presentation contains forward-looking statements which reflect the REIT’s current expectations and projections about future results. Often, but not always, forward-looking statements can be identified by the use of words such as “plans”, “expects” or “does not expect”, “is expected”, “estimates”, “intends”, “anticipates” or “does not anticipate”, or “believes”, or variations of such words and phrases or state that certain actions, events or results “may”, “could”, “would”, “might” or “will” be taken, occur or be achieved. Forward-looking statements involve known and unknown risks, uncertainties and other factors which may cause the actual results, performance or achievements of the REIT to be materially different from any future results, performance or achievements expressed or implied by the forward-looking statements. Actual results and developments are likely to differ, and may differ materially, from those expressed or implied by the forward-looking statements contained in this presentation. Such forward-looking statements are based on a number of assumptions that may prove to be incorrect, including, but not limited to: the ability of the REIT to obtain necessary financing or to be able to implement its business strategies; satisfy the requirements of the TSX Venture Exchange with respect to the plan of arrangement; obtain unitholder approval with respect to the plan of arrangement; the level of activity in the retail, office and industrial commercial real estate markets in Canada, the real estate industry generally (including property ownership and tenant risks, liquidity of real estate investments, competition, government regulation, environmental matters, and fixed costs, recent market volatility and increased expenses) and the economy generally. While the REIT anticipates that subsequent events and developments may cause its views to change, the REIT specifically disclaims any obligation to update these forward-looking statements. These forward-looking statements should not be relied upon as representing the REIT’s views as of any date subsequent to the date of this presentation. Although the REIT has attempted to identify important factors that could cause actual actions, events or results to differ materially from those described in forward-looking statements, there may be other factors that cause actions, events or results not to be as anticipated, estimated or intended. There can be no assurance that forward-looking statements will prove to be accurate, as actual results and future events could differ materially from those anticipated in such statements. Accordingly, readers should not place undue reliance on forwardlooking statements. The factors identified above are not intended to represent a complete list of the factors that could affect the REIT.
This presentation includes industry data and forecasts obtained from independent industry publications, market research and analyst reports, surveys and other publicly available sources and in certain cases, information is based on the REIT’s own analysis and information or its analysis of third-party information. Although the REIT believes these sources to be generally reliable, market and industry data is subject to interpretation and cannot be verified with complete certainty due to limits on the availability and reliability of raw data, the voluntary nature of the data gathering process and other limitations and uncertainties inherent in any statistical survey. Accordingly, the accuracy and completeness of this data is not guaranteed. The REIT has not independently verified any of the data from third party sources referred to in this presentation nor ascertained the underlying assumptions relied upon by such sources.
All figures in C$ unless otherwise noted.
Safe Harbour
3 INVESTOR PRESENTATION | APRIL 2017 NEXUS
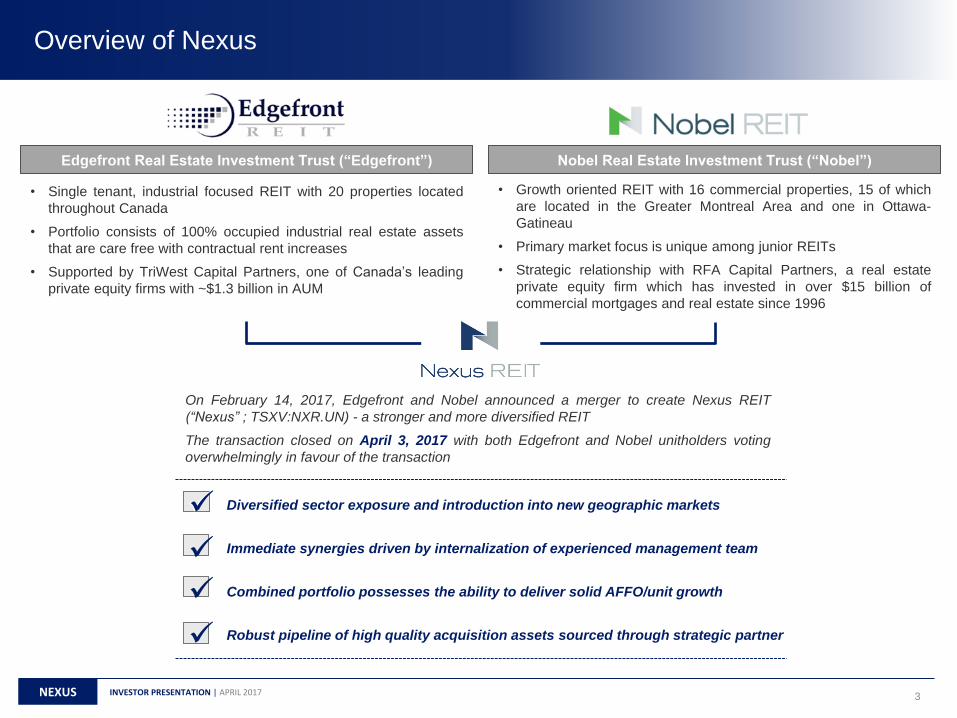
• Diversified sector exposure and introduction into new geographic markets
• Immediate synergies driven by internalization of experienced management team
• Combined portfolio possesses the ability to deliver solid AFFO/unit growth
• Robust pipeline of high quality acquisition assets sourced through strategic partner
Overview of Nexus
• Single tenant, industrial focused REIT with 20 properties located
throughout Canada
• Portfolio consists of 100% occupied industrial real estate assets
that are care free with contractual rent increases
• Supported by TriWest Capital Partners, one of Canada’s leading
private equity firms with ~$1.3 billion in AUM
• Growth oriented REIT with 16 commercial properties, 15 of which
are located in the Greater Montreal Area and one in Ottawa-
Gatineau
• Primary market focus is unique among junior REITs
• Strategic relationship with RFA Capital Partners, a real estate
private equity firm which has invested in over $15 billion of
commercial mortgages and real estate since 1996
On February 14, 2017, Edgefront and Nobel announced a merger to create Nexus REIT
(“Nexus” ; TSXV:NXR.UN) - a stronger and more diversified REIT
The transaction closed on April 3, 2017 with both Edgefront and Nobel unitholders voting
overwhelmingly in favour of the transaction
Nobel Real Estate Investment Trust (“Nobel”) Edgefront Real Estate Investment Trust (“Edgefront”)

4 INVESTOR PRESENTATION | APRIL 2017 NEXUS
Building the Foundation for the Next Canadian “Blue Chip” REIT
• Combined entity has been renamed Nexus REIT (TSXV:NXR.UN)
• Larger combined scale better positions Nexus for the capital markets with potential for
increased analyst coverage, trading liquidity and broader retail / institutional investor support
• Graduation to TSX (main board) anticipated in 2017
Well Positioned For
Capital Market
Opportunities
• Access to a robust acquisition pipeline from RFA Capital and TriWest Capital Partners
• Potential for lower cost of capital via increased access to debt and equity financing
• Greater financing flexibility could provide for more opportunities to pursue growth pipeline
Greater Access to
Financing and
Acquisition Pipelines
• Pro forma combined NOI of $21.5(1) million
• 36 properties, with GLA of ~2.1M sq. ft.(2) located across Canada (6 provinces and 1 territory)
• Greater geographic and sector diversification
Enhanced Scale &
Attractive Portfolio
Characteristics
• Internalization and full integration of a highly experienced management team
• Synergies realized from the elimination of external asset and property management, as well
as redundant public company costs
• Expected G&A synergies of ~$0.9 million on a run-rate basis
Synergies from
Internalization of
Management
• High single-digit accretion to AFFO per unit(1) on a stabilized run-rate basis
• Accretion driven through G&A synergies, organic growth and a lease-up strategy with respect
to a quality downtown Montreal office property
Accretive to both
Unitholders
1) After stabilization of 2045 Stanley
2) Including 100% of GLA from partially owned properties (i.e. 2045 Stanley and 72 Rue Laval)

5 INVESTOR PRESENTATION | APRIL 2017 NEXUS
40.0%
37.7%
6.4%
6.2%
5.9%3.4% 0.4%
AB QC BC SK ON NWT PEI
76.7%
16.3%
4.9% 2.1%
Industrial Office Mixed-Use Retail
1
2
3 8
4 2
2
7 1
6
Edgefront Properties
Industrial
Office
Retail
Mixed-Use
Nobel Properties
Nexus consists of a diversified portfolio of 36 properties located
across Canada, combining Nobel’s asset diversity with Edgefront’s
geographic diversity
16
20
NOI by Sector(1)
NOI by Province/Territory(1)
1) After stabilization of 2045 Stanley
Nationwide Asset Base

6 INVESTOR PRESENTATION | APRIL 2017 NEXUS
Lease Expiry Schedule (Sq. Ft. ‘000s)
Principal Repayment Schedule ($M)
% of Total
Debt
% of Total
Leased GLA
Balanced Debt Maturities and Lease Expiries
48
145 120
199
64
147
8
115
736
325
2017 2018 2019 2020 2021 2022 2023 2024 2025 2026+
Nobel
Edgefront
2.5% 7.6% 6.3% 10.5% 3.4% 7.7% 0.4% 6.1% 38.6% 17.1%
$11.9 $8.6
$68.4
$26.1
$6.1
$41.1
2017 2018 2019 2020 2021 2022+
Nobel Mortgages
Edgefront Credit Facility
Edgefront Mortgages
7.3% 5.3% 42.1% 16.1% 3.8% 25.3%
1) As at December 31, 2016
2) 5 and 10 year GCAN bond yields as at April 7, 2017; Avison Young Debt Market Monitor (April 2017) commercial mortgage spreads
Weighted Average Term(1)3.9 years
Weighted Average Interest Rate(1)3.96%
5 yr Loan Term Rate(2)2.81% - 3.21%
10 yr Loan Term Rate(2)3.44% - 3.94%

7 INVESTOR PRESENTATION | APRIL 2017 NEXUS
Industrial77.9%
Office15.7%
Mixed-Use3.5%
Retail2.8%
QC42.6%
AB26.1%
ON12.6%
BC7.9%
SK7.6%
NWT3.0%
PEI0.2%
$7.9
$3.0
$1.1 $12.0
Edgefront Nexus
$13.4
$7.0 $1.1 $21.5
Edgefront Nexus
Tenant Location Remaining Lease
Term (years) Sq. Ft.
% of
Total GLA
Various (Alberta) 9.4 436,412 21%
Lethbridge, AB 13.0 229,000 11%
Montreal, QC 8.3 91,068 4%
Montreal, QC 7.5 60,786 3%
Various (Quebec) 4.6 55,800 3%
1) After stabilization of 2045 Stanley
2) Based on sq. ft. shown at 100% interests
(2)
(1) (1)
Nobel portfolio Stabilization of
2045 Stanley
Nobel portfolio
& G&A
synergies
Stabilization of
2045 Stanley
Nobel portfolio
& G&A
synergies
Stabilized NOI ($M)
Pro Forma GLA by Sector Key Tenants
Stabilized AFFO ($M) GLA (M Sq. Ft.) Pro Forma GLA by Province/Territory
1.2
0.9 2.1
Edgefront Nexus
Robust, Diversified Portfolio with Broad Tenant Base
8 INVESTOR PRESENTATION | APRIL 2017 NEXUS
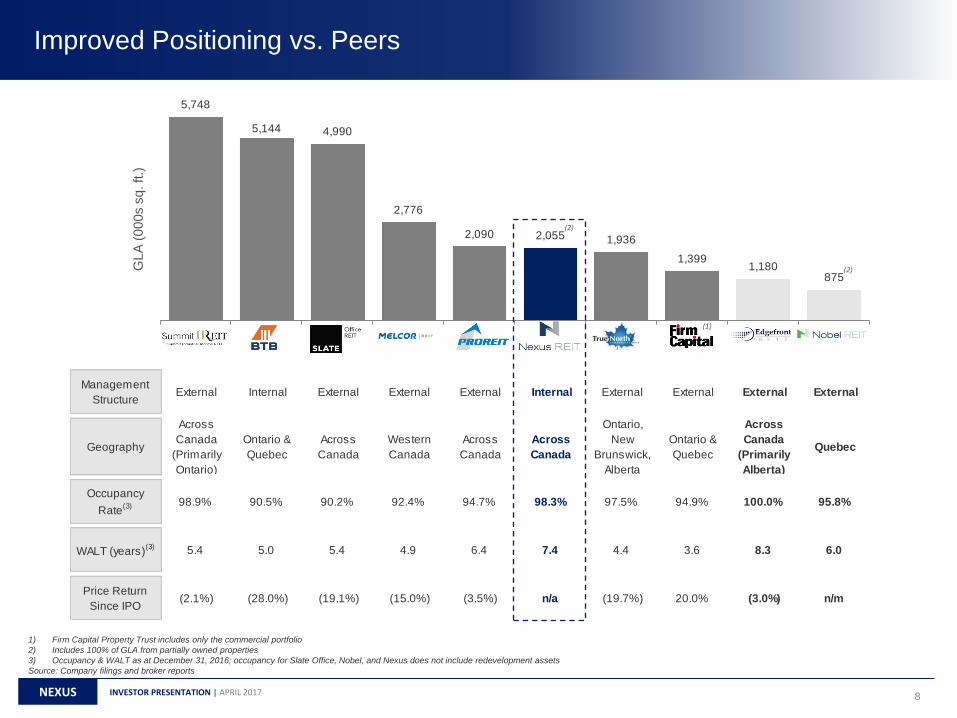
Management
StructureExternal Internal External External External Internal External External External External
Geography
Across
Canada
(Primarily
Ontario)
Ontario &
Quebec
Across
Canada
Western
Canada
Across
Canada
Across
Canada
Ontario,
New
Brunswick,
Alberta
Ontario &
Quebec
Across
Canada
(Primarily
Alberta)
Quebec
Occupancy
Rate(3) 98.9% 90.5% 90.2% 92.4% 94.7% 98.3% 97.5% 94.9% 100.0% 95.8%
WALT (years)(3) 5.4 5.0 5.4 4.9 6.4 7.4 4.4 3.6 8.3 6.0
Price Return
Since IPO(2.1%) (28.0%) (19.1%) (15.0%) (3.5%) n/a (19.7%) 20.0% (3.0%) n/m
5,748
5,144 4,990
2,776
2,090 2,055 1,936
1,399 1,180
875
Summit BTB Slate Office Melcor Pro REIT Nexus True North Firm CapitalProperty Trust
Edgefront Nobel
1) Firm Capital Property Trust includes only the commercial portfolio
2) Includes 100% of GLA from partially owned properties
3) Occupancy & WALT as at December 31, 2016; occupancy for Slate Office, Nobel, and Nexus does not include redevelopment assets
Source: Company filings and broker reports
GL
A (
00
0s s
q. ft.)
Improved Positioning vs. Peers
(2)
(2)
(1)

9 INVESTOR PRESENTATION | APRIL 2017 NEXUS
1) As at April 4, 2017
2) EBITDA After stabilization of 2045 Stanley
3) Based on consensus analyst estimates as of April 2017
Source: December 31, 2016 financial statements, pro forma includes all publicly announced subsequent events as of April 4, 2017
Pro Forma Financial Metrics
Unit Price(1) (C$) $1.94
Basic Units Outstanding (M) 59.7
Market Capitalization(1) (C$M) $115.8
Cash and Credit Facility Availability (C$M) $5.5
Debt (C$M) $165.3
Enterprise Value (C$M) $281.1
Gross Book Value (C$M) $297.0
Debt to Gross Book Value (%) 55.7%
Debt to EBITDA(2) multiple 8.7x
Interest Coverage(2) multiple 3.1x
Annual Distribution per Unit ($) $0.16
Yield (%) 8.2%
Analyst Consensus Information(3)
Consensus Target Price ($) $2.33
Consensus NAV per Unit ($) $2.28
Consensus 2017E AFFO Payout Ratio (%) 78.0%
10 INVESTOR PRESENTATION | APRIL 2017 NEXUS
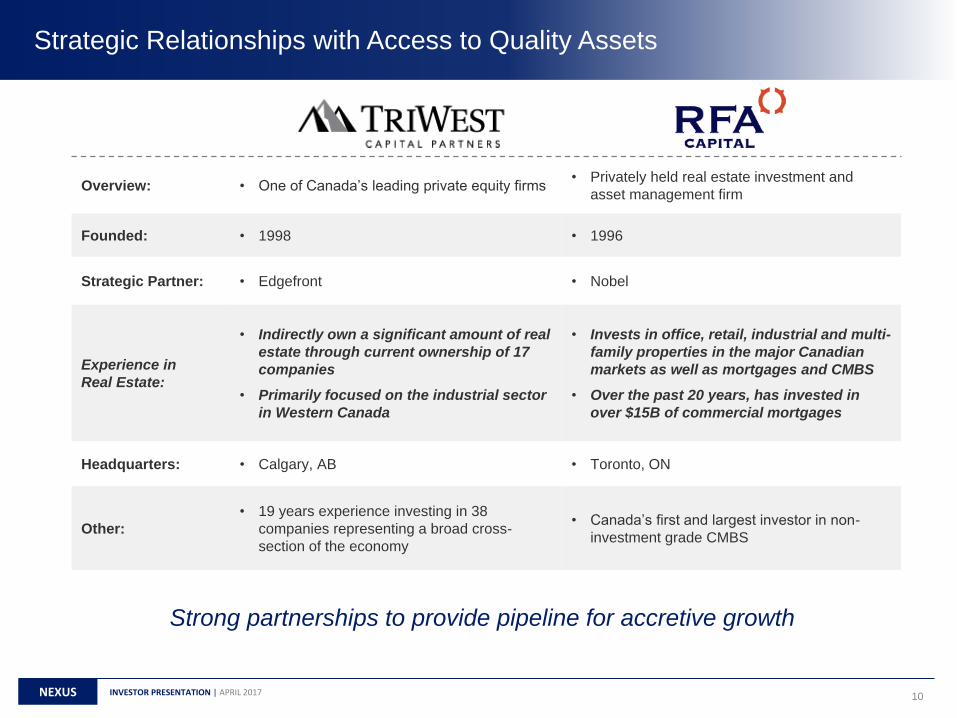
Overview: • One of Canada’s leading private equity firms • Privately held real estate investment and
asset management firm
Founded: • 1998 • 1996
Strategic Partner: • Edgefront • Nobel
Experience in
Real Estate:
• Indirectly own a significant amount of real
estate through current ownership of 17
companies
• Primarily focused on the industrial sector
in Western Canada
• Invests in office, retail, industrial and multi-
family properties in the major Canadian
markets as well as mortgages and CMBS
• Over the past 20 years, has invested in
over $15B of commercial mortgages
Headquarters: • Calgary, AB • Toronto, ON
Other:
• 19 years experience investing in 38
companies representing a broad cross-
section of the economy
• Canada’s first and largest investor in non-
investment grade CMBS
Strong partnerships to provide pipeline for accretive growth
Strategic Relationships with Access to Quality Assets

11 INVESTOR PRESENTATION | APRIL 2017 NEXUS
Overview
• Nobel acquired a 50% interest in 2045 Rue Stanley, a 113k sq. ft. office
building, in April 2016 for $12.8M
• The Chambre des Notaires, a professional order of more than 3,900
notaries, indirectly controls the remaining 50% of the building
• Manulife, the main tenant at time of acquisition, vacated the building in
December 2016, as planned
Opportunity
• The property will be redeveloped during 2017 - lease offer in place for
44% of the building with the Chambre des Notaires, which will use the
property as their head office under a 20-year lease commencing January
1, 2018
• “The Stanley Property is a 14-floor office property located in the heart of
Downtown Montreal that represents a tremendous opportunity to
significantly grow NOI. We expect the Stanley Property to be 85%
occupied by 2018.” – Jean Teasdale, CEO of Nobel
• The property has been appraised by Altus at a value of $30.0M, which
represents a $0.04 (2%) increase to Nexus’ NAV per unit
Property Type: Retail / Industrial
Construction: 1998
GLA: 37,455(1)
Property Type: Office
Construction: 1977
GLA: 113,714
2045 Rue Stanley, Montreal 41 Saint-Jean-Baptiste, Chateauguay
Overview
• Nobel acquired this 37,455 sq. ft., single tenant property in August 2014
for $6.3M – the building is 100% occupied by Rona
• Well-located within the Greater Montreal Area, with excess land available
Opportunity
• In January 2016, RONA completed a building expansion of 15,696 square
feet and a complete renovation of the facility at no cost to the REIT, a
project cost of ~$1.7M
• RONA has exercised their first 5 year renewal option immediately (i.e. a
new eleven 11 year term)
1) Pre-expansion
Nobel Case Study: Adding Value to the Portfolio

12 INVESTOR PRESENTATION | APRIL 2017 NEXUS
Name Title
Board of Trustees Management Team
Experience
1) Also serves as a trustee
2) Chair of the board of trustees of Nexus
Kelly
Hanczyk(1) Co-CEO
• Current CEO of Edgefront REIT
• Former CEO and Trustee of TransGlobe
Apartment REIT
• Extensive experience in all disciplines of
industrial, commercial and residential real
estate
Jean
Teasdale(1) Co-CEO
• Current CEO of Nobel REIT
• CEO and Founder of Maestri Terra, a real
estate management and development
company
• Served as VP, Real Estate and Commercial
Services at Aeroport de Montreal
• Extensive experience in real estate
development, management and financing
Robert
Chiasson CFO
• Current CFO of Edgefront REIT
• Former Corporate Controller of InStorage
REIT
• Former Director of Accounting and Finance
of Samuel Manu-Tech
• Obtained the CPA, CA designation while
articling with KPMG
Lorne
Jacobson(2) Edgefront
• Co-founder and Vice Chairman of TriWest
Capital Partners
• Former partner of Bennett Jones LLP
Mario
Forgione Edgefront
• Principal and Managing Partner of
Windermere Realty Corp.
• President and Co-Founder of Edgemere
Capital
• Former Managing Partner and Governor to
the OHL, of the Mississauga Ice Dogs
Brad Cutsey Edgefront
• President of InterRent REIT
• Former Managing Director, Real Estate
Investment Banking at Dundee Capital
Markets
Ben Rodney Nobel
• Principal and Managing Partner of RFA
Capital
• Has structured and closed over $15B of
Canadian real estate and mortgage
transactions
Nick
Lagopoulos n/a
• Principal and Managing Partner of RFA
Capital
• Previously with GE Capital and Credit
Suisse
Name Former
Board Experience
Nexus Leadership Team
13 INVESTOR PRESENTATION | APRIL 2017 NEXUS
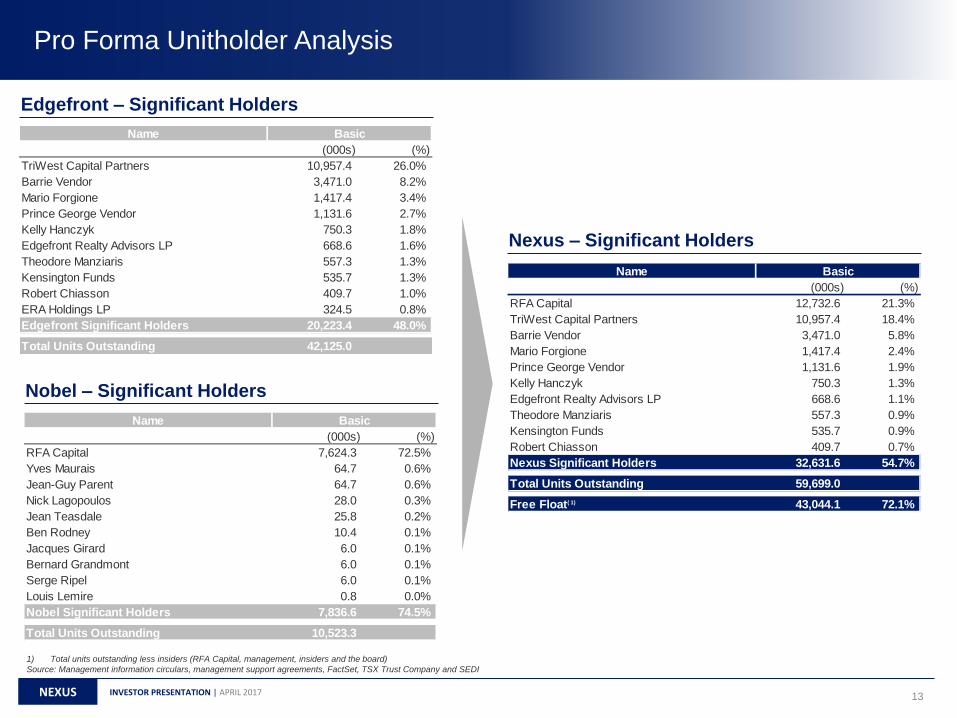
Pro Forma Unitholder Analysis
Edgefront – Significant Holders
Nobel – Significant Holders
Nexus – Significant Holders
1) Total units outstanding less insiders (RFA Capital, management, insiders and the board)
Source: Management information circulars, management support agreements, FactSet, TSX Trust Company and SEDI
Name Basic
(000s) (%)
TriWest Capital Partners 10,957.4 26.0%
Barrie Vendor 3,471.0 8.2%
Mario Forgione 1,417.4 3.4%
Prince George Vendor 1,131.6 2.7%
Kelly Hanczyk 750.3 1.8%
Edgefront Realty Advisors LP 668.6 1.6%
Theodore Manziaris 557.3 1.3%
Kensington Funds 535.7 1.3%
Robert Chiasson 409.7 1.0%
ERA Holdings LP 324.5 0.8%
Edgefront Significant Holders 20,223.4 48.0%
Total Units Outstanding 42,125.0
Name Basic
(000s) (%)
RFA Capital 7,624.3 72.5%
Yves Maurais 64.7 0.6%
Jean-Guy Parent 64.7 0.6%
Nick Lagopoulos 28.0 0.3%
Jean Teasdale 25.8 0.2%
Ben Rodney 10.4 0.1%
Jacques Girard 6.0 0.1%
Bernard Grandmont 6.0 0.1%
Serge Ripel 6.0 0.1%
Louis Lemire 0.8 0.0%
Nobel Significant Holders 7,836.6 74.5%
Total Units Outstanding 10,523.3
Name Basic
(000s) (%)
RFA Capital 12,732.6 21.3%
TriWest Capital Partners 10,957.4 18.4%
Barrie Vendor 3,471.0 5.8%
Mario Forgione 1,417.4 2.4%
Prince George Vendor 1,131.6 1.9%
Kelly Hanczyk 750.3 1.3%
Edgefront Realty Advisors LP 668.6 1.1%
Theodore Manziaris 557.3 0.9%
Kensington Funds 535.7 0.9%
Robert Chiasson 409.7 0.7%
Nexus Significant Holders 32,631.6 54.7%
Total Units Outstanding 59,699.0
Free Float( 1) 43,044.1 72.1%
14 INVESTOR PRESENTATION | APRIL 2017 NEXUS
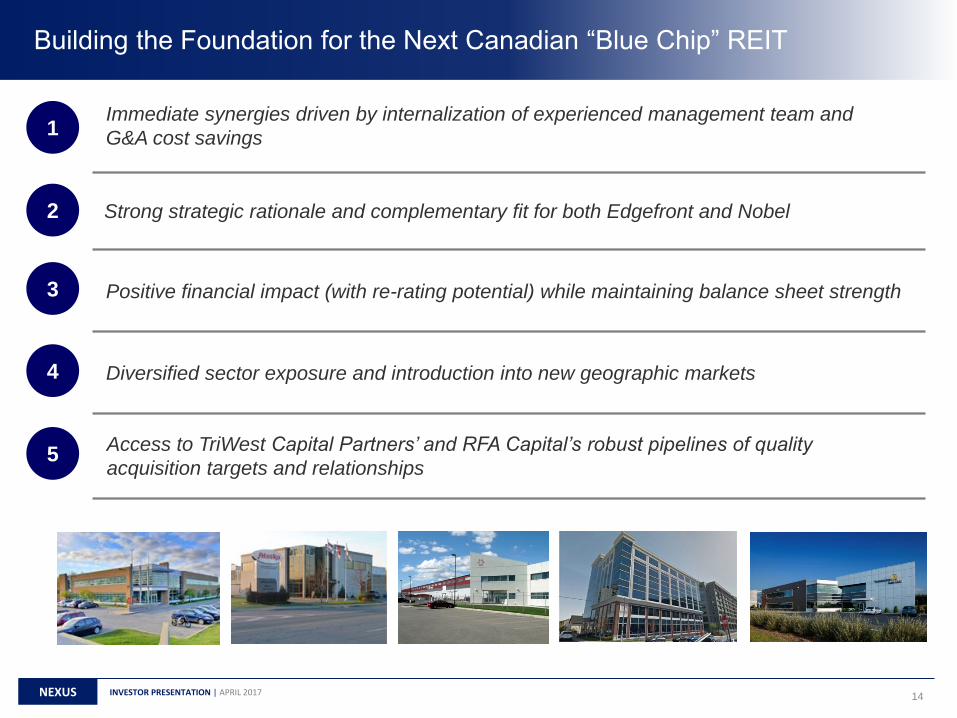
Positive financial impact (with re-rating potential) while maintaining balance sheet strength
1
2
3
4
5
Strong strategic rationale and complementary fit for both Edgefront and Nobel
Access to TriWest Capital Partners’ and RFA Capital’s robust pipelines of quality
acquisition targets and relationships
Diversified sector exposure and introduction into new geographic markets
Immediate synergies driven by internalization of experienced management team and
G&A cost savings
Building the Foundation for the Next Canadian “Blue Chip” REIT

15 INVESTOR PRESENTATION | APRIL 2017 NEXUS
Industry Fundamentals
4) CBRE Canada Industrial MarketView Q3 2016
5) PWC Emerging Trends in Real Estate 2017
Land Constraints: Development of large industrial buildings near major transportation hubs is increasingly
expensive and difficult, forcing demand further outside of major markets(4)
Strong Economic Conditions: Depreciation of the Canadian dollar is expected to stimulate Montreal’s export-
oriented economy (2.0% GDP growth expected in 2017)(3)
Large Market: 48% of Quebec’s population and 2nd largest city in Canada by GDP(1)(2)
Favourable Conditions for Manufacturing: Continually low interest rates and the depreciation of the Canadian
dollar have set ideal conditions for a resurgence of Canada’s manufacturing industry
Growth of E-Commerce: The growth of online shopping has created increasing demand for distribution and
logistics hubs, which has pushed up demand for all industrial property(5)
Favourable Business Environment: Home to 13 of Canada’s 50 largest companies, including SNC-Lavalin, CN
Rail, and Bell
Canadian Industrial
Greater Montreal
1) Statscan
2) Brookings Global Metro Monitor, 2014
3) Conference Board of Canada
Diversified exposure to high income, single-tenant industrial and Greater Montreal commercial

APPENDIX
Select Edgefront and Nobel Properties, Case Studies, Contact Information, and
Comparable Companies

17 INVESTOR PRESENTATION | APRIL 2017 NEXUS
3501 Griffen Rd. North – Lethbridge, AB 4700 & 4750 102 Avenue – Calgary, AB
455 Welham Road – Barrie, ON 12104 & 12110, 17th Street – Edmonton, AB
Acquired on July 15, 2014 and leased under a long-term lease to Triple M
housing that expires on July 14, 2029. Located in close proximity to
Highway 3.
Located in close proximity to Highway 2 and acquired on August 25, 2015,
this property is leased under a long-term lease to Canada Cartage that
expires on December 31, 2024
Located in close proximity to Highway 400 and acquired on July 17, 2015,
this property is leased under a long-term lease to Prodomax Automation
that expires on June 16, 2025
Acquired on January 14, 2014 and leased under a long-term lease to
Westcan Bulk Transport that expires on November 14, 2025. Located in
close proximity to Highway 100.
GLA (sq ft): 229,000
Land (acres): 31.4
Occupancy: 100%
Built/Ren: 2008 / 2012
GLA (sq ft): 29,471
Land (acres): 13.5
Occupancy: 100%
Built/Ren: 2009
GLA (sq ft): 109,366
Land (acres): 7.3
Occupancy: 100%
Built/Ren: 1998 / 2015
GLA (sq ft): 116,582
Land (acres): 34.0
Occupancy: 100%
Built/Ren: 1973 / 2011
Select Edgefront Properties
18 INVESTOR PRESENTATION | APRIL 2017 NEXUS
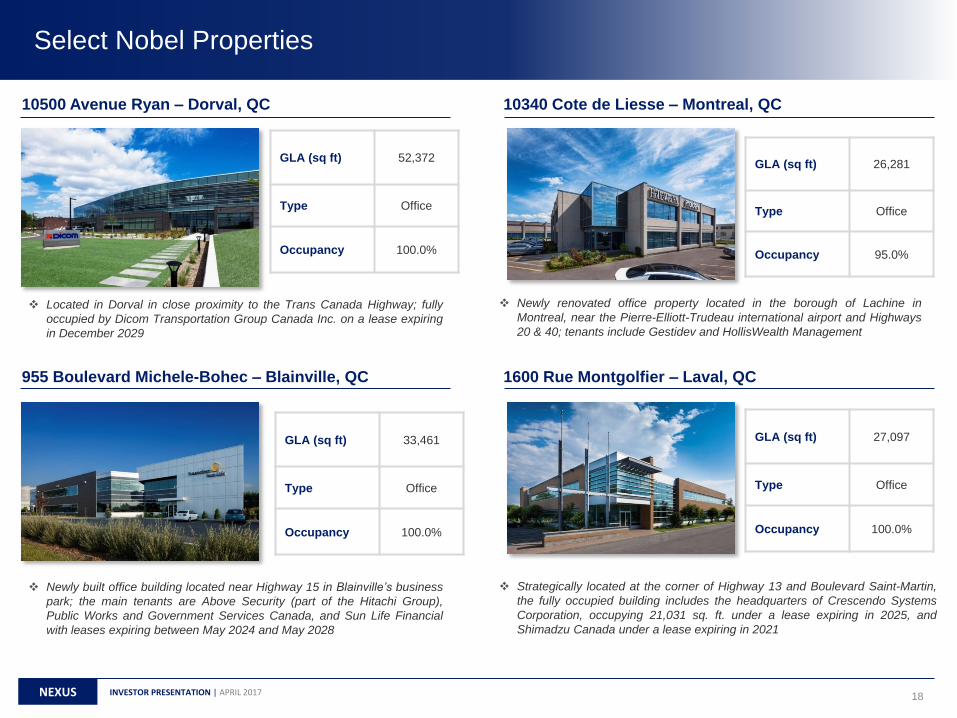
10500 Avenue Ryan – Dorval, QC 10340 Cote de Liesse – Montreal, QC
955 Boulevard Michele-Bohec – Blainville, QC 1600 Rue Montgolfier – Laval, QC
Located in Dorval in close proximity to the Trans Canada Highway; fully
occupied by Dicom Transportation Group Canada Inc. on a lease expiring
in December 2029
Newly renovated office property located in the borough of Lachine in
Montreal, near the Pierre-Elliott-Trudeau international airport and Highways
20 & 40; tenants include Gestidev and HollisWealth Management
Newly built office building located near Highway 15 in Blainville’s business
park; the main tenants are Above Security (part of the Hitachi Group),
Public Works and Government Services Canada, and Sun Life Financial
with leases expiring between May 2024 and May 2028
Strategically located at the corner of Highway 13 and Boulevard Saint-Martin,
the fully occupied building includes the headquarters of Crescendo Systems
Corporation, occupying 21,031 sq. ft. under a lease expiring in 2025, and
Shimadzu Canada under a lease expiring in 2021
GLA (sq ft) 52,372
Type Office
Occupancy 100.0%
GLA (sq ft) 26,281
Type Office
Occupancy 95.0%
GLA (sq ft) 33,461
Type Office
Occupancy 100.0%
GLA (sq ft) 27,097
Type Office
Occupancy 100.0%
Select Nobel Properties

19 INVESTOR PRESENTATION | APRIL 2017 NEXUS
1) Peer average is the simple average of Pro REIT, BTB REIT, True North Commercial REIT, Summit Industrial Income REIT, and Melcor REIT (where data is available)
2) AFFO payout ratio adjusted for unit based asset management and trustee fees
Weighted Average Lease Term (years)
Occupancy AFFO Payout Ratio
Debt to Assets
(1)
(1) (1)
(1)
Edgefront Case Study: Consistent Financial & Operating Performance
59% 60%
58%
49%
51%
49%
2014 2015 2016
Peer Average
Edgefront
95%
92%
94% 95%
92%
83%
2014 2015 2016
Peer Average
Edgefront(2)
5.9 5.4
5.2
11.9
9.8
8.3
2014 2015 2016
Peer Average
Edgefront
95% 95%
95%
100% 100% 100%
2014 2015 2016
Peer Average
Edgefront

20 INVESTOR PRESENTATION | APRIL 2017 NEXUS
Comparable Valuation
1) Based on management forecasts; 2018E estimates and payout ratio include the stabilization of 2045 Stanley; payout ratio based on 2017E AFFO is 84%
Source: FactSet, company filings and broker research
(1)
P / FFO P / AFFO
2017E 2018E 2017E 2018E
Large Cap REITs
H&R REIT $23.32 $7,039 $13,708 5.8% 12.8x 12.5x 14.9x 14.5x 86.4% 6.7% 46% 6.3% (6.3%) $293 7.8%
CREIT $49.38 $3,616 $5,785 3.7% 15.1x 14.8x 17.6x 17.2x 65.3% 5.7% 39% 5.3% 5.1% $260 9.4%
Cominar REIT $14.55 $2,653 $7,092 10.1% 9.4x 9.2x 10.7x 10.5x 108.4% 9.3% 53% 6.7% (6.7%) $158 76.8%
Artis REIT $13.33 $2,004 $5,203 8.1% 9.2x 9.2x 11.4x 11.5x 92.1% 8.8% 51% 6.7% (8.7%) $202 10.2%
Average 6.9% 11.6x 11.4x 13.7x 13.4x 88.0% 7.6% 47% 6.3% (4.2%) $228 26.0%
Average (Excl. High/Low) 6.9% 11.1x 10.8x 13.1x 13.0x 89.2% 7.8% 49% 6.5% (6.5%) $231 9.8%
Small Cap REITs
Agellan $11.42 $374 $728 6.8% 9.1x 8.6x 11.6x 10.9x 78.6% 8.6% 50% 8.9% (5.5%) $124 9.4%
Slate Office $8.09 $373 $973 9.3% 8.6x 8.0x 10.2x 9.4x 94.2% 9.8% 59% 7.6% (6.7%) $195 90.2%
Summit Industrial $6.56 $278 $522 7.7% 10.5x 10.1x 11.7x 11.3x 90.0% 8.5% 51% 8.0% (2.5%) $91 100.0%
Melcor $8.50 $219 $569 7.9% 8.3x 8.2x 9.8x 9.7x 77.6% 10.2% 53% 7.4% (15.6%) $205 60.0%
True North Comm. $6.09 $204 $427 9.8% 9.6x 9.2x 10.4x 9.9x 101.8% 9.6% 54% 8.0% 0.4% $221 100.0%
BTB REIT $4.77 $202 $630 8.8% 9.7x n/a 11.5x n/a 101.6% 8.7% 66% 7.0% 7.2% $122 100.0%
Pro REIT $2.22 $109 $259 9.5% 10.6x 9.7x 11.1x 9.9x 105.0% 9.0% 58% 7.4% (5.9%) $124 100.0%
Firm Capital PT $6.00 $73 $161 7.3% n/a n/a n/a n/a n/a n/a 53% n/a n/a $115 84.0%
Average 8.4% 9.5x 8.9x 10.9x 10.2x 92.7% 9.2% 56% 7.7% (4.1%) $150 80.4%
Average (Excl. High/Low) 8.4% 9.5x 8.9x 11.0x 10.1x 93.3% 9.1% 55% 7.7% (4.1%) $148 89.0%
Nexus $1.94 $116 $281 8.2% 9.7x 9.1x 10.2x 9.6x 79.5% 9.8% 56% 7.6% (10.2%) $143 31.1%
Return of
Capital
2017E AFFO
Payout RatioCompany Price
Mkt Cap
($M)EV ($M)
Dist.
Yield
Price Per
Sq. Ft.
Debt /
GBV
Premium
(Discount) /
NAV
Implied
Cap Rate
2017E
AFFO Yield
(2)

21 INVESTOR PRESENTATION | APRIL 2017 NEXUS
Kelly Hanczyk Co-CEO
Phone: (416) 906-2379
Email: [email protected]
Jean Teasdale Co-CEO
Phone: (514) 840-9339
Email: [email protected]
Contact Information
Rob Chiasson CFO
Phone: (403) 817-9496
Email: [email protected]