Merged Modules MATHS for IGCSE
143
IGCSE REVISION 2
description
IGCSE MATHS questions answers
Transcript of Merged Modules MATHS for IGCSE

IGCSE
REVISION 2

4m + n = 2 and 2m – 3n = 8 [ 4 marks]
2. Calculate the values of m and n that satisfy the simultaneous linear equations:
21
m - 3n = 10
5m + 6n = -8 [ 4 marks]
3. Calculate the values of m and n that satisfy the simultaneous linear equations: 2m – n = 7 m – 2n = 5 [ 4 marks]
TOPIC : SIMULTANEOUS LINEAR EQUATIONS TIME : 2 HOUR
1. Calculate the values of m and n that satisfy the simultaneous linear equations:
A-PDF Merger DEMO : Purchase from www.A-PDF.com to remove the watermark
1
1

4. Calculate the values of p and q that satisfy the simultaneous linear equations:
p + 2q = 6
23
p – q = -7
[ 4 marks]
5. Calculate the values of m and n that satisfy the simultaneous linear equations: 4m - 3n = 7 and m + 6n = 4 [ 4 marks]
6. Calculate the values of p and q that satisfy the simultaneous linear equations: 2p - 3q = 13 4p + q = 5 [ 4 marks]

7. Calculate the values of p and q that satisfy the simultaneous linear equations:
21
p – 2q = 13
3p + 4q = -2 [ 4 marks]
8. Calculate the values of k and w that satisfy the simultaneous linear equations: 2k – 3w = 10 and 4k + w = -1 [ 4 marks]
9. Calculate the values of m and n that satisfy the simultaneous linear equations: 2m - 5n = -12 and 3m + n = -1 [ 4 marks]

10. Calculate the values of x and y that satisfy the simultaneous linear equations: x – 3y = 5 3x – y = 3 [ 4 marks]
11. Calculate the values of s and t that satisfy the simultaneous linear equations: 8s + 3t = 12 6s – 9t = 24 [ 4 marks]
12. Calculate the values of m and n that satisfy the simultaneous linear equations: m - 3n = 6 and 2m – n = 7 [ 4 marks]

13. Calculate the values of k and h that satisfy the simultaneous linear equations: 4k - 3h = 10 2k – 5h = 12 [ 4 marks]
14. Calculate the values of m and n that satisfy the simultaneous linear equations: 2m + 3n = 9
31
m – n = 2 [ 4 marks]
15. Calculate the values of m and n that satisfy the simultaneous linear equations: 2m – n = 2 4m – 3n = 5 [ 4 marks]

MODULE 1- ANSWERS
TOPIC: SIMULTENOUS LINEAR EQUATIONS
1. Calculate the values of m and n that satisfy the simultaneous linear equations: 4m + n = 2 and 2m – 3n = 8 [ 4 marks]
12m + 3n = 6 1 2m – 3n = 8 14m = 14 1 m = 1 1 n = -2 1
2. Calculate the values of m and n that satisfy the simultaneous linear equations:
21
m - 3n = 10
5m + 6n = -8 [ 4 marks]
m - 6n = 20 1 5m + 6n = -8 6m = 12 1 m = 2 1 n = - 2 1
3. Calculate the values of m and n that satisfy the simultaneous linear equations: 2m – n = 7 m – 2n = 5 [ 4 marks]
2m – n = 7
2m – 4n = 10 1 3n = -3 1 n = -1 1 m = 3 1
4. Calculate the values of p and q that satisfy the simultaneous linear equations: p + 2q = 6
23
p – q = -7
[ 4 marks]
p + 2q = 6 3p – 2q = -14 1
4p= -8 1 p = -2 1 q = 4 1

5. Calculate the values of m and n that satisfy the simultaneous linear equations: 4m - 3n = 7 and m + 6n = 4 [ 4 marks]
4m - 3n = 7 4m + 24n = 16 1 -27n = -9 1
n = 31
1
m = 2 1
6. Calculate the values of p and q that satisfy the simultaneous linear equations: 2p - 3q = 13 4p + q = 5 [ 4 marks]
4p - 6q = 26 1
4p + q = 5 -7q = 21 1 q = -3 1 p = 2 1
7. Calculate the values of p and q that satisfy the simultaneous linear equations:
21
p – 2q = 13
3p + 4q = -2 [ 4 marks]
p – 4q = 26 1 3p + 4q = -2 4p = 24 1 p = 6 1 q = -5 1
8. Calculate the values of k and w that satisfy the simultaneous linear equations: 2k – 3w = 10 and 4k + w = -1 [ 4 marks]
4k – 6w = 20 1 4k + w = -1
-7w = 21 1 w = -3 1
k = 21
1

9. Calculate the values of m and n that satisfy the simultaneous linear equations: 2m - 5n = -12 and 3m + n = -1 [ 4 marks]
2m - 5n = -12 15m + 5n = -5 1 17m = 17 1 m = -1 1 n = 2 1
10. Calculate the values of x and y that satisfy the simultaneous linear equations: x – 3y = 5 3x – y = 3 [ 4 marks]
3x – 9y = 15 1
3x – y = 3 -8y = 12 1
y = -23
1
x = 21
1
11. Calculate the values of s and t that satisfy the simultaneous linear equations:
8s + 3t = 12 6s – 9t = 24 [ 4 marks]
24s + 9t = 36 1
6s – 9t = 24 30s = 60 1 s = 2 1
t = -34
1
12. Calculate the values of m and n that satisfy the simultaneous linear equations:
m - 3n = 6 and 2m – n = 7 [ 4 marks] 2m - 6n = 12 1 2m - n = 7 -5n = 5 1 n = -1 1 m = 3 1

13. Calculate the values of k and h that satisfy the simultaneous linear equations:
4k - 3h = 10 2k – 5h = 12 [ 4 marks]
4k - 3h = 10 4k – 10h = 24 1 -7h = -14 1 h = 2 1 k = 4 1
14. Calculate the values of m and n that satisfy the simultaneous linear equations: 2m + 3n = 9
31
m – n = 2 [ 4 marks]
2m + 3n = 9
m – 3n = 6 1 3m = 15 1 m = 5 1
n = 31
1
15. Calculate the values of m and n that satisfy the simultaneous linear equations: 2m – n = 2 4m – 3n = 5 [ 4 marks]
6m – 3n = 6 1
4m – 3n = 5 2m = 1 1
m = 21
1
n = 1 1

1
1.
DIAGRAM 1
Diagram 1 shows a solid formed by joining a cuboid and a half-cylinder. Using π = 722
,
calculate the volume, in cm3, of the solid. [4 marks] Answer:
MODULE 2 TOPIC: SOLID GEOMETRY
TIME: 2 HOURS

2
2.
DIAGRAM 2 Diagram 2 shows a solid pyramid. A small pyramid (shaded region) with base square 6cm and height 4 cm is taken out of the solid. Calculate the volume, in cm3, of the remaining solid. [4 marks] Answer:

3
3. Diagram 3 shows a solid formed from a cone and hemisphere.
DIAGRAM 3 The diameters of the cone and the hemisphere are 21cm each. The volume of the solid
is 4 042.5 cm3. Using π = 722
, calculate the height of the cone in cm. [4 marks]
Answer:

4
4. Diagram 4 shows a solid formed by joining a right pyramid and a cuboid.
DIAGRAM 4 The volume of the solid is 1 100 cm3. Calculate the height of the pyramid. [4 marks] Answers:

5
5. Diagram 5 shows a solid formed by joining a cone and a cylinder.
DIAGRAM 5 The diameter of the cylinder and the diameter of the base of the cone are both 7 cm.
The volume of the solid is 231 cm3 . By using π = 722
, calculate the height, in cm, of
the cone. [4 marks] Answer:

6
6. Diagram 6 shows a solid cylinder of height 20cm and diameter 14 cm. A cone with radius 7 cm and height 9 cm is taken out of the solid. Calculate the volume in cm3 of
the remaining solid. (Use π = 722
). `[4 marks]
DIAGRAM 6 Answer:

7
7. Diagram 7 shows a solid formed by combining a right prism with a half cylinder on the rectangular plane DEFG.
DIAGRAM 7
DE = 14 cm, EJ = 8 cm, °=∠ 90DEJ and the height of the prism is 6 cm. Calculate the
volume, in cm3, of the solid. (Use 722
=π )
[4 mark Answer:

8
MODULE 2 – ANSWERS TOPIC : SOLID GEOMETRY
1. Volume of solid = Volume of cuboid + volume of half-cylinder
= 14 x 6 x 4 + 21
x 722
x 32 x 14
= 336 cm3 + 197.92cm3 = 533.92 cm3
≈ 534 cm3 2. Volume of remaining solid = volume of big pyramid - volume of small pyramid
= (31
x 152 x 18 ) - (31
x 62 x 4 )
= (31
x 225 x 18 ) - (31
x 36 x 4 )
= (1350 - 48) = 1302 cm3 3. Volume of solid = Volume of cone + Volume of hemisphere
32 πr34
21hπr
31
××+=
⎥⎥⎦
⎤
⎢⎢⎣
⎡⎟⎠⎞
⎜⎝⎛×××+
⎥⎥⎦
⎤
⎢⎢⎣
⎡×⎟
⎠⎞
⎜⎝⎛××=
32
221
722
34
21h
221
722
3154042.
4042.5 = 115.5 h + 2425.5
h = 14 cm 4. Volume of pyramid = volume of solid – volume of cuboid = )81010(1100 3 ××−cm = 1100 - 800 = 300 cm3
Volume of pyramid = 31
x Area of base x h
= 31
x (10 x 10) x h
= 3
100 x h

9
3
100h = 300
= 300 x 100
3
= 9 cm 5. Volume of cylinder = πr2h
= 722
x 25.3 x 4
= 154 cm3
Volume of cone = 31
πr2h
= 31
x 722
x 25.3 x t
= 21
5.269t cm3
Volume of solid = 231 cm3
154 + 21
5.269t = 231
269.5 t = 1617
t = 5.269
1617
= 6 cm

10
6. Volume of remaining solid = Volume of cylinder – volume of cone
= πr2h - 31
πr2h
= [722
x 7 x 7 x 20] – [31
x 722
x 7 x 7 x 9]
= 3080 – 462 = 2618 cm3
7. Volume of solid = Volume of half – cylinder + volume of prism
Volume of half – cylinder = 21
x πr2h
Volume of prism = area of base x height Volume of solid = Volume of half – cylinder + volume of prism
= [21
x 722
x (2
14 2) x 6] + [21
x 14 x 8 x 6]
= 462 + 336
= 798 cm2

1. Solve the quadratic equation
(a) 2
1)3x(x −= x + 6
(b) (w – 1)2 – 32 = 0
(c) 2a2 = 3(1 + a) + 2
(d) p1
3p5p2
+
+= 4
TOPIC: QUADRATIC EXPRESSIONS AND EQUATIONS. TIME : 2 HOURS

(e) 2
3t2
= 7t – 4
(f) x2 – 2 = 4
511x −
(g) m5
62m=
−
(h) (2x + 1)(x – 2)=7
(i) 3p
2p2p
−
+=+

(j) 3x(2x – 1)+ 8x = 1
(k) 5
23y2− = y
(l) (r –1)(r + 3) = 5(r + 3)
(m) 7p – 2p2 = 2(1 + p)
(n) 5x = 2
25x2 +

(o) 6
5p2 += p
(p) 4(5x – 1) = x
1)3(5x −−
(q) d
6d7d
−=
(r) 21m
5m22m=
+
+
(s) 21m
1)3m(m=
+
−

(t) y2 + 9y – 1 = 3(y – 2)

MODULE 4 - ANSWERS TOPIC: QUADRATIC EXPRESSIONS AND EQUATIONS.
Answer:
(a) 2
1)3x(x −= x + 6
3x2 –x – 12 = 0 ………..1
(3x+ 4)(x – 3) =0 ……….1
x= 34
x= 3 …………….1,1
(b) (w – 1)2 – 32 = 0
w2– 2w – 8= 0 …………..1
(w+2)(w–4)=0 …………..1
w=4 w= –2 ……………1,1
(c) 2a2 = 3(1 + a) + 2
2a2– 3a – 5 = 0 …………1
(a+1)(2a – 5) = 0………..1
a= –1 x = 25
…………..1,1
(d) p1
3p5p2
+
+= 4
5p2– p – 4 = 0 …………1
(5p– 4)(p+1) = 0…….....1
p = 54
p = – 1………..1,1
(e) 2
3t2
= 7t – 4
3t2+ 14t – 8 = 0 ………..1
(3t – 2)(t – 4)=0 ………..1

t = 32
t = 4 …………1,1
(g) x2 – 2 = 4
511x −
4x2– 11x – 5 = 0 ………1
(4x+1)(x - 3) = 0 ………1
x = 41
x = 3
(g) m5
62m=
−
m2– 5m – 6 = 0 ………..1
(m - 6)(m + 1) = 0………1
m = 6 m= -1 …………1,1
(i) (2x + 1)(x – 2)=7
2x2– 3x – 9 = 0 …………1
(x+3)(x - 3) = 0 …………1
x = -3 x = 3 ……………. 1,1
(i) 3p
2p2p
−
+=+
p2 – 2p – 8 = 0 …………1
(p+2)(p– 4)=0 ………….1
p= –2 p = 4……………1,1
(k) 3x(2x – 1)+ 8x = 1
6x2+ 5x – 1 = 0 …………1
(x+1)(6x - 1) = 0 ………..1
x = -1 x = 61
…………..1,1

(k) 5
23y2− = y
3y2 – 5y – 2 = 0………………1
(y+1)(y– 2)=0 ………………..1
y= -1 y = 2 …………………1,1
(o) (r –1)(r + 3) = 5(r + 3)
r2 – 3yr– 18 = 0 ……………..1
(r+6)(r– 3)=0 ………………..1
y= -6 y = 3 ……………….1,1
(p) 7p – 2p2 = 2(1 + p)
2p2– 5p + 2 = 0 …………..1
(2p– 1)(2p+5) = 0 ………..1
p = 21
p = 25−
…………1,1
(q) 5x = 2
252 +x
x2 – 10x + 25 = 0 …………1
(x-5)(x-5)=0……………….1
x=5 ………………………..1
(o) 6
5p2 += p
p2– 6p + 5 = 0 ………….1
(p– 1)(p+5) = 0 …………..1
p = 1 p = -5……………..1,1
(q) 4(5x – 1) = x
1)3(5x −−
20x2– 11x -3 = 0 ……….1
(5x+ 1)(4x-3) = 0 ………..1
x = -51
x =41
………….1,1

(q) d
6d7d
−=
d2+ 6d -7 = 0 ………..1
(d– 1)(d+7) = 0 ………1
x = 1 x = -7 ……….1,1
(r) 21m
5m22m=
+
+
2m2+ 3m -2 = 0 ……….1
(2m– 1)(m+1) = 0………1
x = -2 x = 21
………….1,1
(s) 21m
1)3m(m=
+
−
3m2- 5m -2 = 0 …………..1
(3m+1)(m-2) = 0 ………….1
x = 2 x = - 31
…………1,1
(u) y2 + 9y – 1 = 3(y – 2)
y2+ 6y+5 = 0 ……………1
(y+1)(y+5) = 0 ………….1
x = -1 x = -5 ………….1,1

1 On the graph provided, shade the region which satisfies the three inequalities 123 +−≤ xy , 4−>y and 4−≤ xy .
[3 marks] Answer:
2. On the graph in the answer space, shade the region which satisfies the three inequalities 3 12,y x≤ + 2 4y x≥ − + and 2x < .
[3 marks]
Answer :
y
x
y = −3x+12
O
y = x−4
2 4y x= − +
3 12y x= +
O x
y
TOPIC : INEQUALITIES 1 Hour

2y – x= –6
X= –2
3 On the graph, shade the region that satisfies all three inequalities : y > x, x + y ≤ 5 and x ≥ 0. [ 3 marks ] Answer :
y
5
4
3
2
1
0
1 2 3 4 5 x
4. On the graph in the answer space, draw the line x + y = 3. Hence, shade the region which satisfies the three inequalities x + y ≤3, 2y – x 6−≥ and x> -2
x + y = 5
x
y
2 4 6 -2 -4 -2
-4
2
4
y
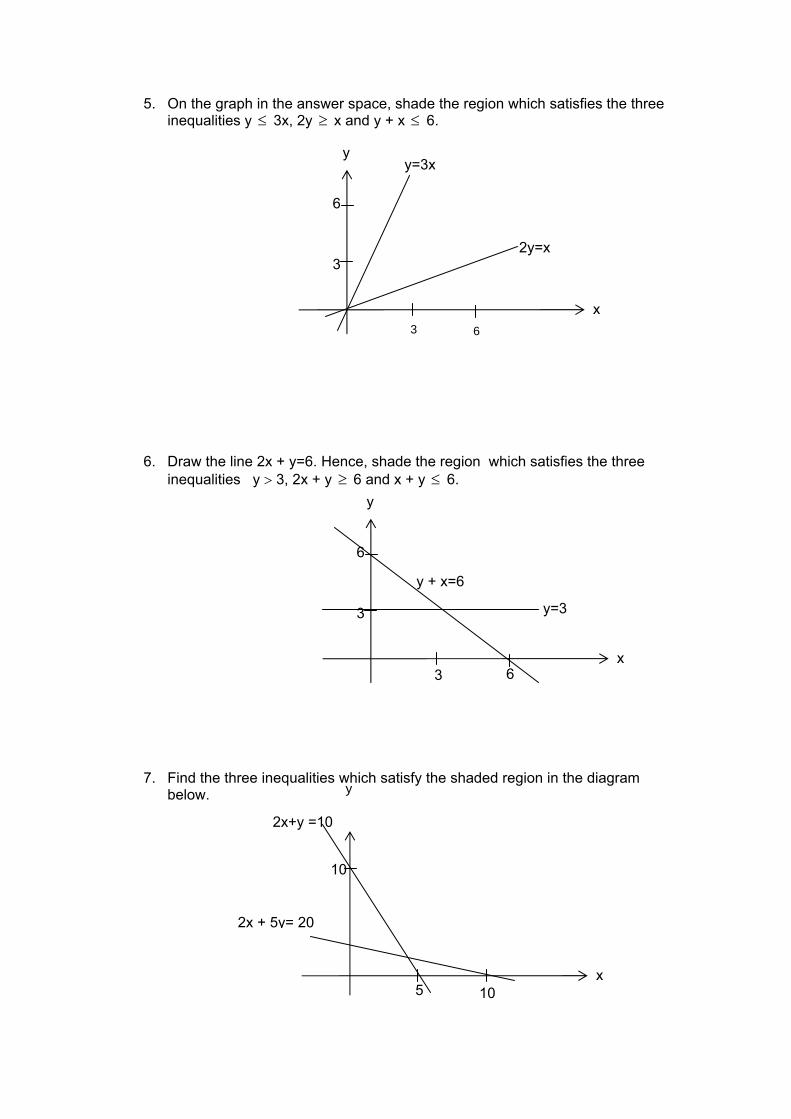
5. On the graph in the answer space, shade the region which satisfies the three inequalities y ≤ 3x, 2y ≥ x and y + x ≤ 6.
6. Draw the line 2x + y=6. Hence, shade the region which satisfies the three inequalities y > 3, 2x + y ≥ 6 and x + y ≤ 6.
7. Find the three inequalities which satisfy the shaded region in the diagram below.
y
x 3 6
3
y + x=6
y=3
6
3 6
y
x
3 2y=x
6
y=3x
x
10
2x+y =10
5 10
2x + 5y= 20

y = x − 4
x y = −4 y = − 3x + 12
1
2
3
2
Straight line 2=x drawn correctly. Region shaded correctly. Notes:
1. Region satisfies two inequalities give P1. 2. Deduct one mark from K1P2 if 2=x is a solid line.
1 2
3
42 +−= xy
R
123 += xy
2=x
y
x

PPR Maths nbk
y = x
3
y
5
4
3
2
1
0
1 2 3 4 5 x
1 2
3
x + y = 5

1. The Venn diagram in the answer space shows the universal set ξ, sets P, Q and R. The universal set ξ = P ∪ Q ∪ R. On the diagram in the answer space, shade the region for (a) P ∩ Q, (b) P ∩ ( Q ∪ R )’.
[3 marks] Answer: (a) (b)
ξ
ξ
P Q
R
P Q
R
TOPIC : SETS 1 hour

2. The Venn diagram in the answer space shows sets J ,K and L. In the answer space, shade (a) J ∩ L’ (b) (K ∪ L)∩ J’
[3 marks] Answer: (a) (b)
J K
L
J L

3 The Venn diagram in the answer space shows set P, set Q and set R with the
universal set ξ = P ∪ Q ∪ R.
On the diagram in the answer space, shade (a) P ∪ Q ∩ R (b) P ∩ ( Q ∪ R) ′
[3 marks]
Answer:
(a)
(b)
R Q
P
Q
P R

4. Diagram 4 shows an incomplete Venn diagram that represents the number of students from a class of 30, according to the subjects they have studied. Each student studied at least one of the three subjects Physics, Chemistry and Biology.
Given the universal set, ξ = P ∪ C ∪ B, P = {students who studied Physics} C = {students who studied Chemistry} B = {students who studied Biology}
DIAGRAM 4
20 students studied Chemistry and 12 students studied Biology. Based on this
information, find (a) the number of students who studied Chemistry and Biology but not Physics.
(b) the number of students who studied Biology only.
(c) the number of students who studied Physics.
[4 marks] Answer:
(a) (b) (c)
C P
B
1
6
2 5

5. (a) Given that ξ = { x: x is an integer and 7 ≤ x ≤ 15}, A = { x: x is a multiple of 3 }, B = {x : x is an odd number} and C = { x: 10 ≤ x ≤ 13 }.
(a). List the elements of the set C ′ . (b). Find n(A ∪B).
[3 marks]
6. Given that n(ξ) = 50. G and H are two sets for which n( G ∩ H) = 6, n(G) = 18 and n(H) = 14.
(a). Draw a Venn diagram to represent the relationship between sets G and H and write the number of elements in each region. (b). Find n(G ∪ H)′. [3 marks]
Answer:
(a)
(b)

7. If ξ = {x : 1 ≤ x ≤ 10 , x is an integer}
E = {x : x is a multiple of 4} F = {x : x is a factor of 20}
(a) List all the elements in set E, (b) Find ( )∪n E F .
[3 marks]
8. The Venn diagram in the answer space shows set P, set Q dan set R. On the diagram, shade
(a) P ∩ Q’
(b) R ∩ (P’ ∪ Q) [ 3 marks ]
Answer :
(a)
(b)
Q
P R
ξ
Q
P R
ξ

MODULE 5 – ANSWERS TOPIC: SETS
1 (a)
(b)
1 2
2
(a)
(b)
LJ ′∩
J K ( ) JLK ′∩∪ J K L
1 2
3
3
(a)
(b)
1 2
3
ξ P Q R
ξ P Q R
R Q
P
Q
P R

4 (a)
(b)
(c)
5 30 –(5 + 6 + 2 + 1 ) 16 9
1 1 1 1
4
5
(a)
(b)
{ }13,12,11,10
{ }{ }
{ }15,13,12,11,9,715,13,11,9,7
15,12,9
=∪==
BABA
N(AUB)=6
1 1 1
3
6 (a)
(b)
24
2 1
3
7
(a) { 4 , 8 } Note: Accept without bracket. (b) 6
1 2
3
G H
612 824
ξ

8
1 2
3
Q
P R
ξ
Q
P R

1
TOPIC: THE STRAIGHT LINE TIME : 2 HOURS
1. The diagram below shows the straight lines PQ and SRT are parallel.
DIAGRAM 1
Find
(a) the gradient of the line PQ.
[ 2 marks ]
(b) the equation of the line SRT.
[ 2 marks ]
(c) the x- intercept of the line SRT. [ 1 mark ]
Answers: (a) (b) (c)
2
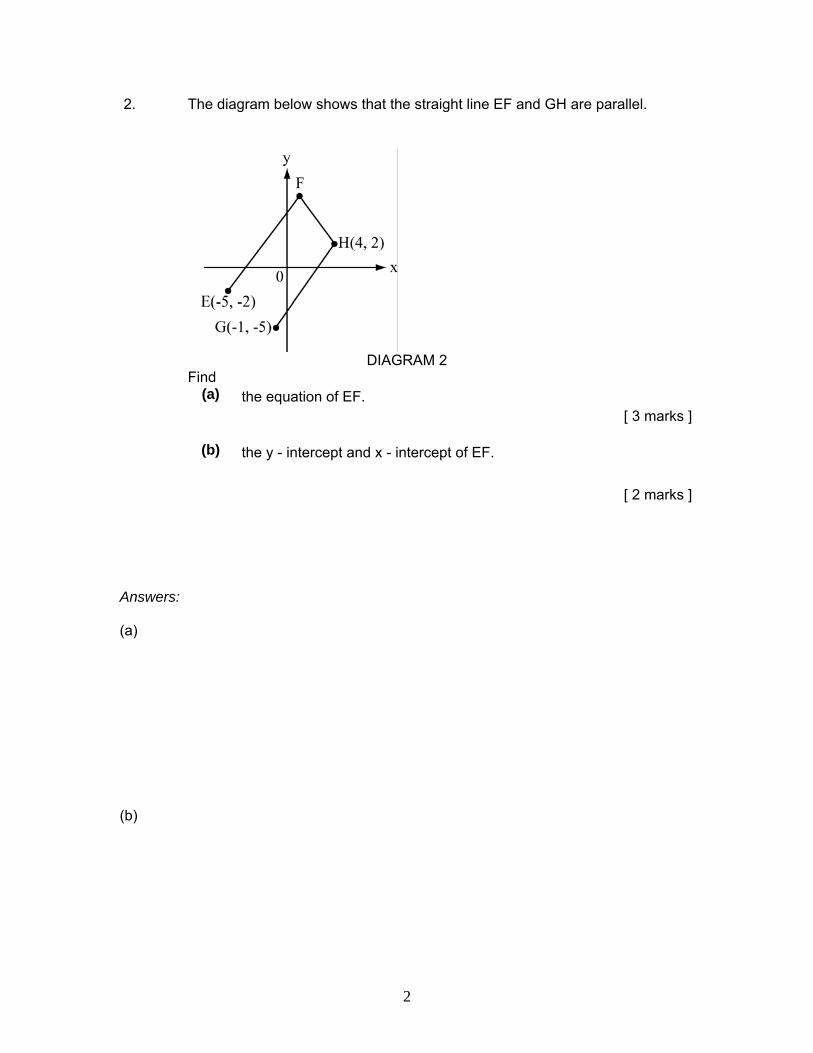
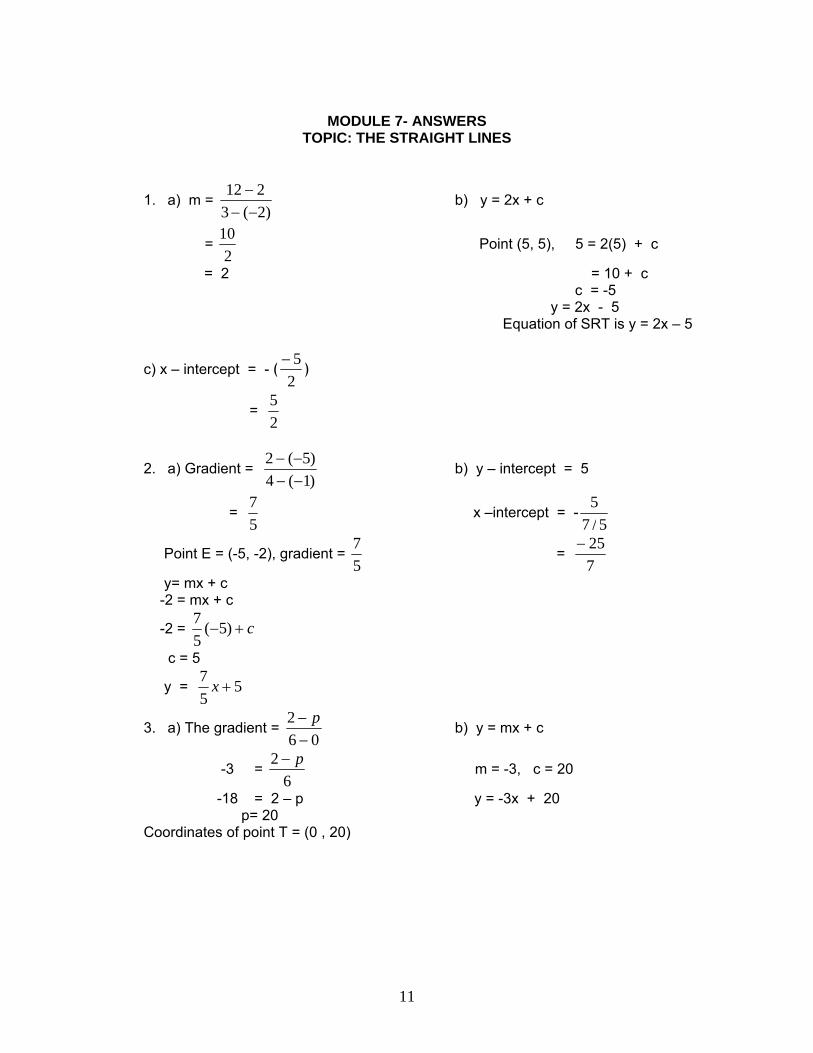
2. The diagram below shows that the straight line EF and GH are parallel.
DIAGRAM 2
Find (a) the equation of EF. [ 3 marks ]
(b) the y - intercept and x - intercept of EF.
[ 2 marks ]
Answers:
(a) (b)

3
3. The diagram below shows STUV is a trapezium.
DIAGRAM 3
Given that gradient of TU is -3, find
(a) the coordinates of point T. [2 marks ]
(b) the equation of straight line TU. [ 1 mark ]
(c) the value of p, if the equation of straight line TU is 18
312 += xy
[ 2 marks ]
Answers: (a) (b) (c)

4
4. The diagram below shows a straight line EFG.
DIAGRAM 4
Find (a) the gradient of straight line EFG. [ 1 mark ]
(b) the value of q. [ 2 marks ]
(c) the gradient of straight line DF [ 2 marks ]
Answers: (a) (b) (c)

5
5. The diagram below shows that EFGH is parallelogram.
DIAGRAM 5 Find
(a) the equation of the straight line GH.
[ 3 marks ]
(b) the x - intercept of the straight line FG. [2 marks ]
Answer: (a) (b)

6
6. The diagram below shows that EFGH is a trapezium.
DIAGRAM 6
Find
(a) the value of z. [ 2 marks ]
(b) the equation of the line EF. [ 2 marks ]
(c) the x - intercept pf the line EF. [ 1 mark ]
Answers: (a) (b) (c)

7
7 The diagram below shows that EFGH and HIJ are straight lines.
DIAGRAM 7
(a) state the gradient of EFGH. [ 1 mark ]
(b) if the gradient of HIJ is 5, find the x - intercept.
[ 1 mark ]
(c) find the equation of HIJ. [ 3 marks ]
Answers: (a) (b) (c)

8
8. The diagram below shows that PQR and RS are straight lines.
DIAGRAM 8
Given that x-intercept of PQR and RS are -8 and 6 respectively.
(a) Find the gradient of PQR.
[ 2 marks ]
(b) Find the y-intercept of PQR.
[ 2 marks ]
(c) Hence, find the gradient of RS.
[ 1 mark ]
Answers: (a) (b) (c)

9
9. The diagram below shows that EFG, GHJK and KL are straight lines.
DIAGRAM 9
Given that the gradient of EFG is 2.
(a) Find the equation of (i) LK
[ 1 mark ] (ii) EFG [ 1 mark ]
(b) Find the equation of GHJK. Hence, find the coordinates of H and J.
[2 marks]
Answers:
(a) (i) (ii) (b)

10
10. Find the point of intersection for each pair of straight line by solving the
simultaneous equations.
(a) 3y - 6x = 3 4x = y - 7
[ 2 marks ]
(b) y =
32
x + 3
y = 34
x + 1
[ 3 marks ]
Answers: (a) (b)
11
MODULE 7- ANSWERS
TOPIC: THE STRAIGHT LINES
1. a) m = )2(3
212−−−
b) y = 2x + c
= 2
10 Point (5, 5), 5 = 2(5) + c
= 2 = 10 + c c = -5 y = 2x - 5 Equation of SRT is y = 2x – 5
c) x – intercept = - ﴾25−﴿
= 25
2. a) Gradient = )1(4)5(2
−−−−
b) y – intercept = 5
= 57
x –intercept = -5/7
5
Point E = (-5, -2), gradient = 57
= 725−
y= mx + c -2 = mx + c
-2 = c+− )5(57
c = 5
y = 557
+x
3. a) The gradient = 06
2−− p
b) y = mx + c
-3 = 6
2 p− m = -3, c = 20
-18 = 2 – p y = -3x + 20 p= 20 Coordinates of point T = (0 , 20)

12
c) 2y = 31
x + 18
y = 961
+x
The value of p = 9, gradient =61
4. a) m = 41
36−−−
b) m = - 53
= - 53
-53
= q−
−4
03
-3 (4 – q) = 3(5) -12 + 3q = 15 3q = 27 q = 9 c) D = (-1 , 0) , F = (4 , 3)
m = )1(4
03−−−
= 53
5. a) Gradient = )4(0)8(0
−−−−
b) x-intercept = - 2
10
= 48
= -5
= 2 y = mx + c 6 = 2(-2) + c 6 = -4 + c c = 10 y = 2x + 10

13
5. a) Gradient = 0503
−−
b) gradient = 53
, E = (-2 , 4)
= 53
y = mx + c
10
4−z =
53
4 = - 56
+ c
5z - 20 = 30 c = 526
5z = 50 Equation of line EF is y = 53
x + 526
z = 10
c) x – intercept of line EF = - 526
53
= 326
−
7. a) F = (0,4) , G = (-4 , 0) b) x-intercept of HIJ = )53(−−
Gradient = )4(0
04−−−
= 53
= 44
c) y = mx + c
= 1 y = 5x - 3
8. a) P = (-8, 0) , Q = (-5 , )49
b) Q = (-5 , 49
), gradient M = 43
m= 49
- 0 y = mx + c
-5 – (- 8) c+−= )5(43
49
= 49
c = 49
415
+
3 c = 6
= 49
x 31
y-intercept = 6
= 43

14
c) R = (0, 6) , S = (6, 0)
m = 0660
−−
= 66−
= -1
9. a) i) Equation of LK is x = 7
ii) y = mx + c 8 = 2(-2) + c 8 = -4 + c
12 = c Equation of EFG is y = 2x + 12
b) m = 72)4(8
−−−−
= 9
12−
= 34
−
y = mx + c
8 = c+−− )2(34
c=3
16
y=3
1634
+− x
Coordinates of H = (0, )3
16,
Coordinates of J is (x, 0) , y=3
1634
+− x
316
34
+− x = 0
-4x + 16 = 0 -4x = -16 X = 4 Therefore coordinates of J = (4, 0)

15
10 a). 3y – 6x = 3 -----------------(1) 4x = y – 7 y = 4x + 7 _________(2) Substitute (2) into (1) 3(4x + 7) - 6x = 3 12x + 21 - 6x = 3 6x = 3 – 21 6x = -18 x = -3 y = 4(-3) + 7 = -12 + 7 = -5 Point of intersection is (-3, -5)
b) y = 332
+x ---------------------(1)
y = 134
+x ---------------------(2)
(1) to (2)
332
+x = 134
+x
1332
34
−=− xx
232
=x
x = 3
y = 3)3(32
+
= 2 + 3 = 5 Point of intersection is (3, 5)

TIME : 2 HOURS
1. The data in Diagram 1 shows the body masses, in kg, of 40 children in a kindergarten.
16 24 34 26 30 40 35 30 26 33 18 20 29 31 30 40 34 36 35 32 33 34 37 35 35 38 39 41 25 25 25 26 27 28 21 23 31 31 38 33
a) Based on the data in Diagram 1 and using a class interval of 5 kg,
complete Table 1 in the answer space. b) Based on your table in a)
i) state the modal class, ii) find the number of children who have a body mass of not less than
35 kg, iii) calculate the mean body mass and give your answer correct to 2
decimal places.
c) For this part of the question, use the graph paper provided. By using a scale of 2 cm to 5 kg on the horizontal axis and 2 cm to 2 children on the vertical axis, draw a histogram to represent the above data.
d) Hence, on the same axes, draw a frequency polygon for the data.
TOPIC : STATISTICS

Answer: a)
Body mass(kg) Midpoint Lower boundary Upper boundary Frequency 15-19
20-24
Table 1
b) i)
ii) iii)

2. The data in Diagram 2 shows the marks for a Mathematics monthly test for
40 pupils.
28 35 22 40 29 30 32 23 19 27 32 32 37 33 35 40 35 39 34 38 45 21 34 30 44 14 22 39 33 31 28 27 28 38 26 22 17 26 24 20
a) Based on the data in Diagram 2 and using a class interval of 5 marks,
complete Table 2 in the answer space. b) For this part of the question, use the graph paper provided.
By using a scale of 2 cm to 5 marks on the horizontal axis and 2 cm to 5 pupils on the vertical axis, draw an ogive for the data.
c) From the ogive, i) find the upper quartile, ii) hence, explain briefly the meaning of the upper quartile.

Answer: a)
Marks Frequency Cumulative frequency 11-15 16-20
Table 2
c) i)
ii)

3. The data in Diagram 3 shows the ages of members of a golf club.
45 53 48 54 46 53 55 43 47 52 63 57 50 40 52 45 49 61 54 56 51 41 56 51 61 50 53 48 51 44 57 53 47 55 46 54 42 57 58 63 42 64 50 49 52 47 55 52 45 51
a) Based on the data in Diagram 3 and using a class interval of 5 years,
complete Table 3 in the answer space. b) Based on the table in a), calculate the estimated mean age of the
members of the golf club. c) By using a scale of 2 cm to 5 years on the x-axis and 2 cm to 2 persons
on the y-axis, draw a histogram based on the data.
d) State one piece of information obtained based on the histogram in c).

Answer: a)
Age Frequency Midpoint 40-44 45-49
Table 3
b) d)
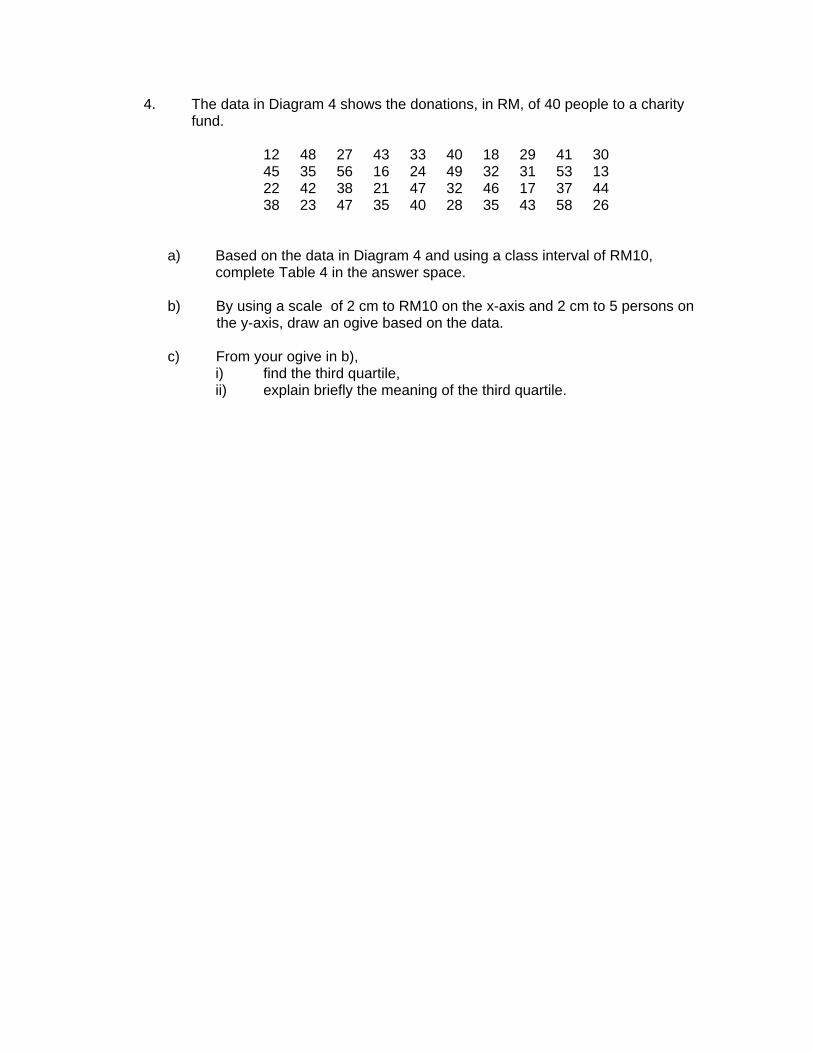
4. The data in Diagram 4 shows the donations, in RM, of 40 people to a charity fund.
12 48 27 43 33 40 18 29 41 30 45 35 56 16 24 49 32 31 53 13 22 42 38 21 47 32 46 17 37 44 38 23 47 35 40 28 35 43 58 26
a) Based on the data in Diagram 4 and using a class interval of RM10,
complete Table 4 in the answer space. b) By using a scale of 2 cm to RM10 on the x-axis and 2 cm to 5 persons on the y-axis, draw an ogive based on the data.
c) From your ogive in b),
i) find the third quartile, ii) explain briefly the meaning of the third quartile.

Answer: a)
Donation (RM) Frequency Cumulative frequency 10-19
20-29
Table 4
c) i)
ii)

5. The data in Diagram 5 shows the mass, in kg, of 40 pupils in a class.
36 55 46 45 55 35 39 59 41 50 50 39 41 52 40 41 38 39 33 45 48 52 35 51 40 42 47 36 41 36 49 32 42 40 37 44 48 48 43 43
a) Based on the data in Diagram 5 and using a class interval of 5 kg,
complete Table 5 in the answer space.
b) From the table in a), i) State the modal class,, ii) Calculate the estimated mean mass of the pupils.
c) By using a scale of 2 cm to 5 kg on the x-axis and 1 cm to 1 pupil on the y-axis, draw a frequency polygon based on the data.

Answer: a)
Mass(kg) Frequency Midpoint 30-34
Table 5
b) i) ii)

6. The data in Diagram 6 shows the monthly pocket money, in RM, received by 40 students.
32 41 46 56 42 48 51 39 36 47 54 59 34 54 52 48 49 51 62 58 38 63 49 43 56 44 60 64 52 53 55 35 45 38 48 57 44 49 46 40
a) Based on the data in Diagram 6 and using a class interval of RM5,
complete Table 6 in the answer space.
b) From the table in a), iii) State the modal class,, iv) Calculate the mean monthly pocket money of the students.
c) By using a scale of 2 cm to RM5 on the x-axis and 2cm to 1 student on the y-axis, draw a histogram and a frequency polygon based on the data.

Answer: a)
Pocket money(RM) Frequency Midpoint 31-35
36-40
Table 6
d) i) ii)

MODULE 8 – ANSWERS TOPIC: STATISTICS
1) a)
Body mass(kg) Midpoint Lower boundary Upper boundary Frequency 15-19 17 14.5 19.5 2
20-24 22 19.5 24.5 4
25-29 27 24.5 29.5 9
30-34 32 29.5 34.5 13
35-39 37 34.5 39.5 9
40-44 42 39.5 44.5 3
b) i) Modal class 30-34 kg
ii)9+3=12 iii)Mean= (17x2)+(22x4)+(27x9)+(32x13)+(37x9)+(42x3) 40 = 1240/40 = 31 kg
c) graph d) graph
2) a)
Marks freq Cumulative freq 11-15 1 1
16-20 3 4
21-25 6 10
26-30 10 20
31-35 11 31
36-40 7 38
41-45 2 40
b) graph c) i) upper quartile ¾ x 40 = 30 = 35
iii) 30 students scored less than 35

3) a)
Age Frequency Midpoint 40-44 6 42 45-49 12 47 50-54 18 52 55-59 9 57 60-64 5 62
b) Mean age = 51.5 d) The modal age is 50-54 years old c) graph
4)
a) Donation (RM) Frequency Cumulative frequency
10-19 5 5
20-29 8 13
30-39 11 24
40-49 13 37
50-59 3 40
c) i) RM43.50
ii) There are 10 persons who donated RM43,50 or more b) graph 5)
a)
Mass(kg) Frequency Midpoint 30-34 2 32
35-39 10 37
40-44 12 42
45-49 8 47
50-54 5 52
55-59 3 57

b) i) 40-44 kg ii) (32x2)+(37x10)+(42x12)+(47x8)+(52x5)+(57x3) 40
= 1745/40 = 43.625 kg c) graph 6)
a) Pocket money(RM) Frequency Midpoint
31-35 3 33
36-40 5 38
41-45 6 43
46-50 9 48
51-55 8 53
56-60 6 58
61-65 3 63
b) i) 46-50
ii) mean = (33x3)+(38x5)+(43x6)+(48x9)+(53x8)+(58x6)+(63x3) 40 = 1940/40 = 48.5 c) graph

TIME: 2 HOURS
1 Diagram 2 shows a prism with cross section BCRQ. Given T and U are the midpoint of AD and BC respectively, P and Q are right above T and U respectively and PQRS is a square.
Calculate the angle between plane PBC and plane BCRQ.
[4 marks] Answer :
DIAGRAM 2
U T
C
9 cm
B A
D
R
Q P
S
15 cm
12 cm
MODULE 9 TOPIC: LINES AND PLANES IN 3-DIMENSIONS

Calculate the angle between plane PRV and plane QRVU.
[4 marks ]
Answer :
R
Q
S
P
T U
V W
5 cm
12 cm
4 cm
DIAGRAM 2
2 Diagram 2 shows a cuboid with base TUVW.

3 Diagram 3 shows a right prism with horizontal rectangle base. Right triangle
RSW and UTV are the uniform cross section of the prism. Calculate the angle between plane SRV and plane RSTU.
[4 marks] Answer :
5 cm
T
U
V
W
S
R
10 cm 12 cm
DIAGRAM 3

the midpoints of sides AB and CD respectively. The height of the pyramid is 6 cm. DIAGRAM 4 Calculate the angle between the line VT and the base ABCD.
[4 marks]
Answer :
A B
CD
V
• U
• T
8cm
4 Diagram 4 shows a pyramid with a horizontal square base ABCD. T and U are

DIAGRAM 5
J is the midpoint of DG. QR = RS = 12 cm and FR = 8cm. Calculate the angle between the plane JRS and the plane RSGF.
[4 marks] Answer :
Q
R
S
P
E
D
G F
J
5 Diagram 5 shows a cuboid PQRSDEFG with a horizontal square base PQRS.

isosceles triangle STU is the uniform cross-section of the prism.
ST = SU and W is the midpoint of TU. Calculate the angle between the line PW and the base STU.
[4 marks] Answer :
•W
13 cm
10 cm 12 cm
P Q
R
S T
U
DIAGRAM 6
6 Diagram 6 shows a right prism with an isosceles triangle base, STU. The

7 Diagram 7 shows a right prism with a horizontal rectangular base PQRS. VUQR is a trapezium. M and N are the midpoints of PS and QR respectively.
Calculate the angle between the line TR and the base PQRS.
[4 marks]
T
U
W
V
P
Q
R
S M
N
•
• 8 cm
6 cm
12 cm
5 cm
DIAGRAM 2

section of the prism.
DIAGRAM 8 (a) Name the angle between the plane STP and the plane STQR, (b) Calculate the angle between the plane STP and the plane STQR.
[4 marks]
Answer :
(a) (b)
P
Q R
S T
U
9 cm18 cm
12 cm
8 Diagram 8 shows a right prism. Right angled triangle PQR is the uniform cross-
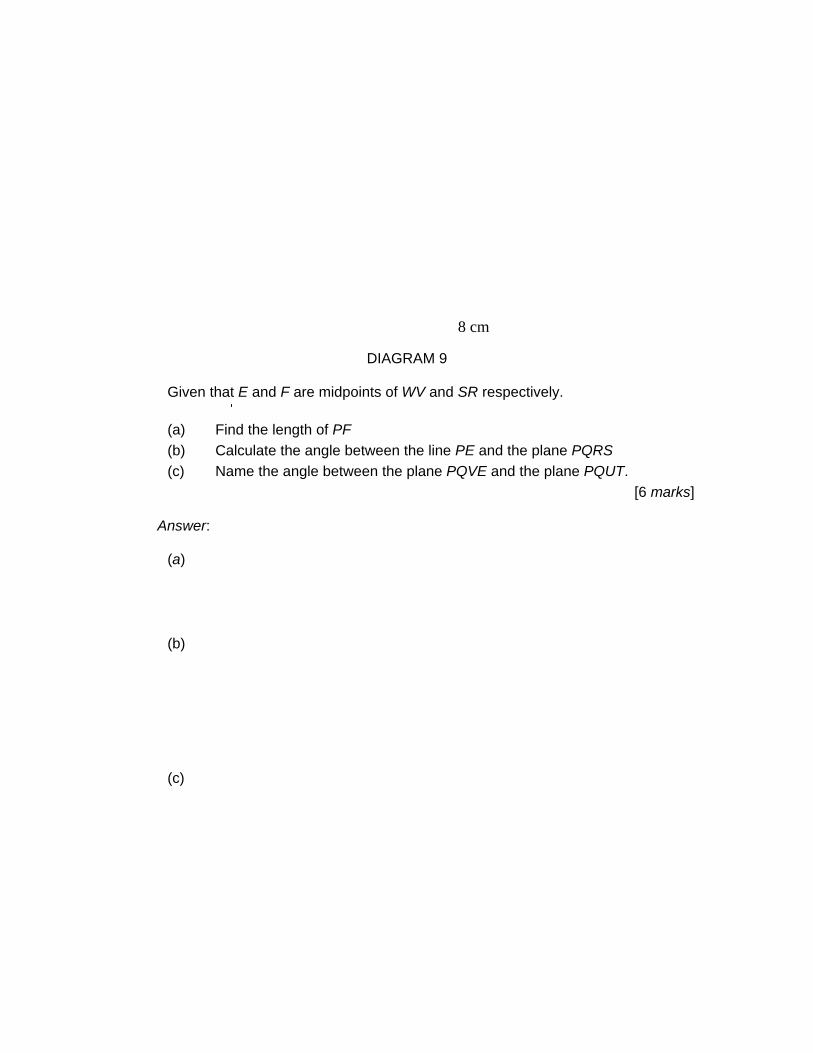
DIAGRAM 9
Given that E and F are midpoints of WV and SR respectively.
(a) Find the length of PF (b) Calculate the angle between the line PE and the plane PQRS (c) Name the angle between the plane PQVE and the plane PQUT.
[6 marks]
Answer: (a) (b) (c)
8 cm
5 cm 7 cm
12 cm
P
Q R
U
W
T
E
F
S
V
9 Diagram 9 shows a right prism with a horizontal rectangular base PQRS.

midpoints of TU and PQ respectively.
DIAGRAM 10
(a) Calculate the length of SN
(b) Calculate the angle between the line SM and the plane TUVW
(c) Name the angle between the plane SRUM and the plane PQUT [6 marks]
Answer :
(a)
(b)
(c)
P
24 cm
7 cm
5 cm
T M U
Q
R
N
W
S
V
10 Diagram 10 shows a cuboid with a rectangular base PQRS.. M and N are

MODULE 9 - ANSWERS TOPIC: LINES AND PLANES IN 3-DIMENSIONS
1 Identify PUQ∠ @ SCR∠
129tan =∠PUQ
PUQ∠ = 360 52’ @ 36.870
2 Identify PRQ∠
5
12tan =∠PRQ
PRQ∠ = 67.380 or 670 22’
3 Identify ∠VST
tan ∠VST = 125
22.60 or 220 37’
4 Identify ∠VTU
tan ∠VTU = 46
∠VTU = 56⋅31° or 56°18’ 5 Identify ∠ GSJ
tan ∠ GSJ = 86
36.87° or 36° 52’ 6 Identify ∠PWS
tan ∠PWS = 22 610
13
−
∠PWS = 58⋅39° or 58⋅4° or 58°24’ 7 Identify ∠ TRM
Tan ∠ TRM = 22 68
5+
∠ TRM = 26.57° or 26 ° 34 ′
8 Identify ∠PTQ or ∠QTP
tan ∠PTQ = 129

9 a) 10 b) Identify ∠EPF
Tan ∠EPF = 107
340 59’ c) ∠UQV 10 a) 13 cm b) Identify ∠SMW
tan ∠SMW = 137
28.30 or 28018’
c) ∠RUQ or ∠QUR
∠PTQ = 36052’ or 36.90

TIME : 2 HOURS 1. a) Complete Table 1 in the answer space for the equation y = 2x2 – 5x – 3.
b) For this part, use a graph paper. By using a scale 2 cm to 1 unit on the x-axis and 2 cm to 5 units on the y-axis, draw the graph of y = 2x2 – 5x – 3 for -3 ≤ x ≤ 5.
c) From your graph, find
i) the value of y when x = -2.4, ii) the value of x when 2x2 – 5x – 3 = 0.
d) Draw a suitable straight line on your graph to find all the values of x which
satisfy the equation 2x2 – 8x = 7 for -3 ≤ x ≤ 5. State these values of x.
Answer: a)
X -3 -2 -1 0 0.5 1 2 3 4 5 Y 30 4 -3 -6 -5 0 9 22
Table 1 c) i) y = ii) x = d) x =
TOPIC : GRAPHS OF FUNCTIONS
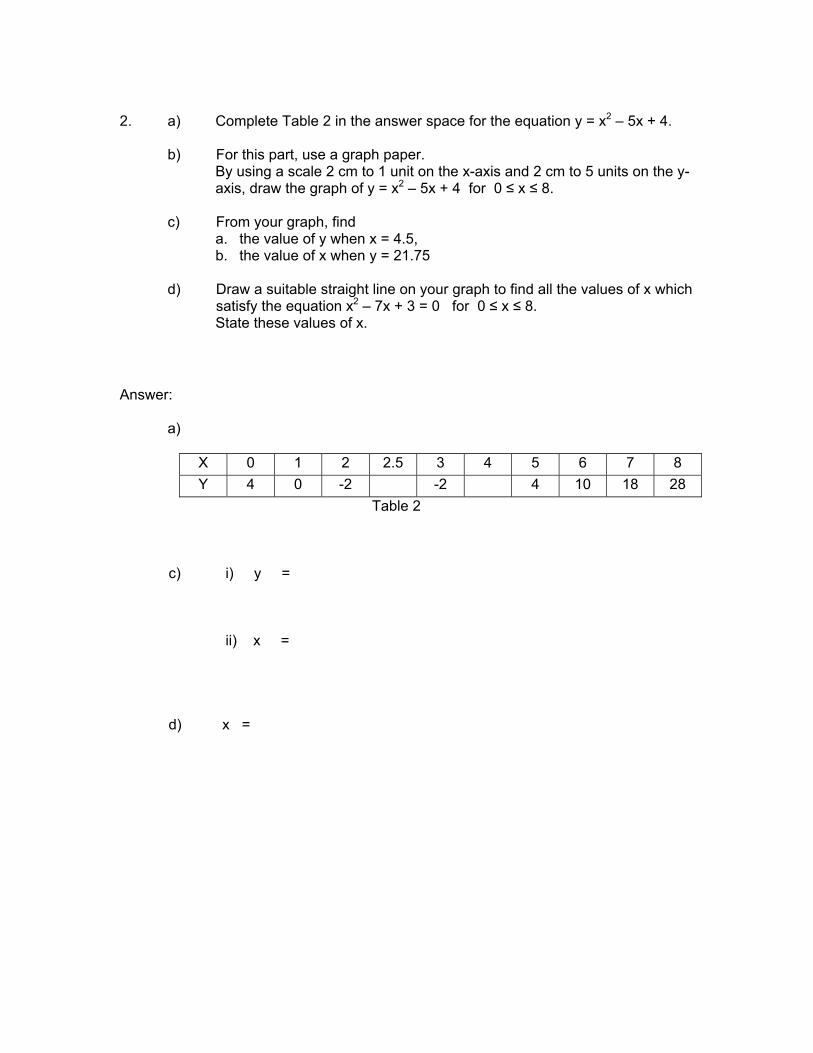
2. a) Complete Table 2 in the answer space for the equation y = x2 – 5x + 4.
b) For this part, use a graph paper. By using a scale 2 cm to 1 unit on the x-axis and 2 cm to 5 units on the y-axis, draw the graph of y = x2 – 5x + 4 for 0 ≤ x ≤ 8.
c) From your graph, find
a. the value of y when x = 4.5, b. the value of x when y = 21.75
d) Draw a suitable straight line on your graph to find all the values of x which
satisfy the equation x2 – 7x + 3 = 0 for 0 ≤ x ≤ 8. State these values of x.
Answer: a)
X 0 1 2 2.5 3 4 5 6 7 8 Y 4 0 -2 -2 4 10 18 28
Table 2 c) i) y = ii) x = d) x =

3. a) Complete Table 3 in the answer space for the equation y = .x5
b) For this part, use a graph paper.
By using a scale 2 cm to 1 unit on the x-axis and 2 cm to 2 units on the
y-axis, draw the graph of y = x5
for -5 ≤ x ≤ 5.
c) From your graph, find
a. the value of y when x = 1.8, b. the value of x when y = -6.
d) From your graph, find all the values of x with the condition that the value of y is three times the value of x.
Answer: a)
X -5 -3 -2 -1 -0.5 0.5 0.9 1.5 2.5 5 Y -1 -1.7 -2.5 -10 10 5.6 3.3 1
Table 3 c) i) y = ii) x = d) x =

4. a) Complete Table 4 in the answer space for the equation y = x2
b) For this part, use a graph paper.
By using a scale 2 cm to 1 unit on the x-axis and 2 cm to 1 units on the y-
axis, draw the graph of y = x2
for -4 ≤ x ≤ 4.
c) From your graph, find
a. the value of y when x = -1.5, b. the value of x when y = 1.2.
d) Draw a suitable straight line on your graph to find all the values of x which
satisfy the equation x2
= 43
x - 2 for -4 ≤ x ≤ 4.
State these values of x. Answer: a)
X -4 -2.5 -2 -1 -0.5 0.5 1 2 2.5 4 Y -0.5 -0.8 -2 -4 4 2 1 0.5
Table 4 c) i) y = ii) x = d) x =

5. a) Complete Table 5 in the answer space for the equation y = x3 – 13x + 18 .
b) For this part, use a graph paper. By using a scale 2 cm to 1 unit on the x-axis and 2 cm to 5 units on the y-axis, draw the graph of y = x3 – 13x + 18 for -4 ≤ x ≤ 4.
c) From your graph, find
a. the value of y when x = -1.5, b. the value of x when y = 25.
d) Draw a suitable straight line on your graph to find all the values of x which satisfy the equation x3 – 11x – 2 = 0 for -4 ≤ x ≤ 4.
State these values of x.
Answer: a)
X -4 -3 -2 -1 0 1 2 3 4 Y 6 36 30 18 6 6 30
Table 5 c) i) y = ii) x = d) x =

6. a) Complete Table 6 in the answer space for the equation y = x3 + x2 – 12x – 5.
b) For this part, use a graph paper. By using a scale 2 cm to 1 unit on the x-axis and 2 cm to 5 units on the y-axis, draw the graph of y = x3 + x2 – 12x – 5 for -4 ≤ x ≤ 4.
c) From your graph, find
a. the value of y when x = 0.5, b. the value of x when 11.9.
d) Draw a suitable straight line on your graph to find all the values of x which satisfy the equation x3 + x2 – 10x = 0 for -4 ≤ x ≤ 4.
State these values of x. Answer: a)
X -4 -3 -2 -1 0 1 2 3 4 Y -5 13 7 -5 -15 -17 27
Table 6 c) i) y = ii) x = d) x =

MODULE 10 – ANSWERS TOPIC: GRAPHS OF FUNCTIONS
1. a) x=-2 y=15 x=0.5 y= -5 x=3 y=0 b) graph c) i) x=-2.4 y= 20.5 ii) when 2x2 – 5x – 3 = 0 y = 0 Then the values of x is -0.5 and 3
e) y=2x2-5x-3 0=2x2-8x-7 (-) ----------------------- Y= 3x + 4 X 0 3 Y 4 13 From the graph x= -0.75 and 4.75
40
35
30
25
20
15
10
5
-5
-10
-10 -5 5 10-0.75 4.75
20.5
-2.4
y x( ) = 3⋅x+4
y x( ) = 2⋅x2-5⋅x-3

2. a)x=2.5 y=-2.25 x=4 y=0 b)graph 2 c) i) y=1.75 ii) x=7.4
e) straight line y=2x+1 x=0.45 and 6.55
3. a) x=-1 y=-5 x=2.5 y=2 b)graph c) i) x=1.8 y= 2.8 ii) y=-6 x=-0.8
e) The graph is y=3x X 0 2 Y 0 6 The values of x= -1.3 and 1.3
16
14
12
10
8
6
4
2
-2
-4
-6
-8
-10
-12
-14
-5 -4 -3 -2 -1 1 2 3 4 5
B
C
y x( ) = 3⋅x
y x( ) = 5
x
A

4. a) x=-2 y=-1 x=2.5 y=0.8 b) graph c) i) y=-1.3 ii) x=1.7
e) The straight line is y=43
x – 2
The values of x = -0.75 and 3.45
5. a) x=-3 y=30 x=2 y=0 b) graph c) i) x=-1.5 y=34 ii) y=25 x=3.85
e) y=x3-13x+18 0=x3-11x-2 (-) -------------------------- Y= -2x+20 X 0 4 Y 20 12
45
40
35
30
25
20
15
10
5
-5
-6 -4 -2 2 4 6
y=x^3-13x+18
y=-2x+20
3.85
34
3.35
-0.25-3.2

X= -3.2, -0.25 and 3.35 6. a) x=-2 y=15 x=3 y=-5 b) graph 6 c) i) y=10.75 ii) x=-1.5
e) y=-12x-5
x=-3.6, 0 and 2.75

2
-2 -4 0 2 4
-2
-4
1. (a) Diagram 1 shows two points, M and N, on a Cartesian plane. y
N x M DIAGRAM 1
Transformation Y is a translation ⎟⎟⎠
⎞⎜⎜⎝
⎛−−
33
.
Transformation P is a reflection in the x-axis. (i) State the coordinates of the image of point N under transformation Y. (ii) State the coordinates of image of point M under the following transformation:
(a) Y2 (b) YP [3 marks]
Answer: (a) (i) (ii) (a) (b)
TOPIC : TRANSFORMATIONS TIME : 2 HOUR

(b) Diagram 2 shows three trapezium ABCD, EFGH and PQRS on a Cartesian plane. 6 4 2 O 2 4 6 8 10 DIAGRAM 2 Trapezium ABCD is the image of trapezium PQRS under transformation M. Trapezium EFGH is the image of trapezium ABCD under transformation N. (i) Describe in full transformation : (a) M (b) N [6 marks] (ii) Calculate the area of trapezium EFGH, if the area of trapezium ABCD is 25 unit2. [3 marks] Answer: (b) (i) (a) (b) (ii)
A B
CD
P Q
R
S F G
HE

2. (a) Diagram 3 shows the point K on a Cartesian plane. DIAGRAM 3 The transformation R represents a 90 0 anticlockwise rotation about the center
(3, 2). The transformation T represents a translation ⎟⎟⎠
⎞⎜⎜⎝
⎛32
. State the coordinates
of the image of the point K under the following transformations. (i) R (ii) RT [3 marks] Answer: (a) (i) (ii)
y
x 0
4
2
2 4 6
-2
-4
-2 -4
K

(b) Diagram 4 shows three quadrilateral EFGH, ABCD and OFJK on a Cartesian plane. EFGH is the image of ABCD under the transformation U and OFJK is the image of EFGH under the transformation V . DIAGRAM 4 (i) Describe completely the transformation,
(a) U, (b) V. [6 marks]
(ii) Given that the shaded area is 120 unit 2 , find the area of ABCD. [3 marks] Answer: (b) (i) (a) (b) (ii)
y
x O
4
2
2 4 6
-2
-4
-2-4
A
B
C
D
H
E F
G
JK

3. (a) Diagram 5 shows the point K on a Cartesian plane. DIAGRAM 5
Transformation S is a translation ⎟⎟⎠
⎞⎜⎜⎝
⎛− 25
.
Transformation T is a reflection in the x = 9. (i) State the coordinates of the image of point F under transformation S. (ii) State the coordinates of image of point F under transformation TS. [3 marks] Answer: (a) (i) (ii)
x
y
2 4 6 8 10 12 14 16
2
4
6
8
10
0
F

(b) Diagram 6 shows three triangle PQR, ACG and EFG on a Cartesian plane. DIAGRAM 2 Triangle ACG is the image of triangle PQR under transformation V. Trapezium EFG is the image of triangle ACG under transformation W. (i) Describe in full transformation : (a) V (b) W [3 marks] (ii) Given that the area of triangle EFG represents a region of area 72 unit2. Calculate the area, in unit2, of the region represented by triangle PQR. [6 marks] [ Answer: (b) (i) (a) (b) (ii)
x
y
E
2 4 6 8 10 12 14 16
2
4
6
8
10
O
F
C
A
GP
R Q

4. (a) Diagram 7 shows the point M on a Cartesian plane. DIAGRAM 7 Transformation P is a reflection in the line x= -3. Transformation R is a rotation of 90o clockwise about the origin. State the coordinates of the image of point M under the following transformation: (i) P (ii) RP [3 marks] Answer: (a) (i) (ii)
y
-12 42O-2 -4-6-8-10x
2
4
6
8
10
M

(b) Diagram 8 shows three trapezium ABCD, RSTU and WSYX on a Cartesian plane. DIAGRAM 8 WSYX is the image of ABCD under combined transformation UV. (i) Describe in full transformation : (a) U (b) V [5 marks] (ii) Given that the area of shaded region WXYTUR represents a region of area 150 cm2. Calculate the area, in cm2, of the region represented by RSTU. [4 marks] Answer: (b) (i) (a) (b) (ii)
-12 42O-2 -4-6-8-10x
2
4
6
8
10
6
C
BA
D
SRW
U T
YX
y

5. (a) Transformation R is a 90° clockwise rotation at centre (2, 2).
Transformation T is a translation ⎟⎟⎠
⎞⎜⎜⎝
⎛− 34
.
State the coordinate of the image for coordinate (6 , 4) under the following transformations:
(i) R2.
(ii) TR. [4 marks] Answer: (a) (i) (ii) (b) Diagram 9 shows quadrilateral , ABCD, PQRS and EFGH, drawn on a Cartesian
plane.
DIAGRAM 9
PQRS is the image of ABCD under transformation S and EFGH is the image of
PQRS under transformation Q.
(i) Describe in full transformation :
-12 -10 -8 -6 -4 -2 2 4 6 8 F
E
G H
S
Q P
D C
B A
y
x O
R
6
4
2
- 2
- 4
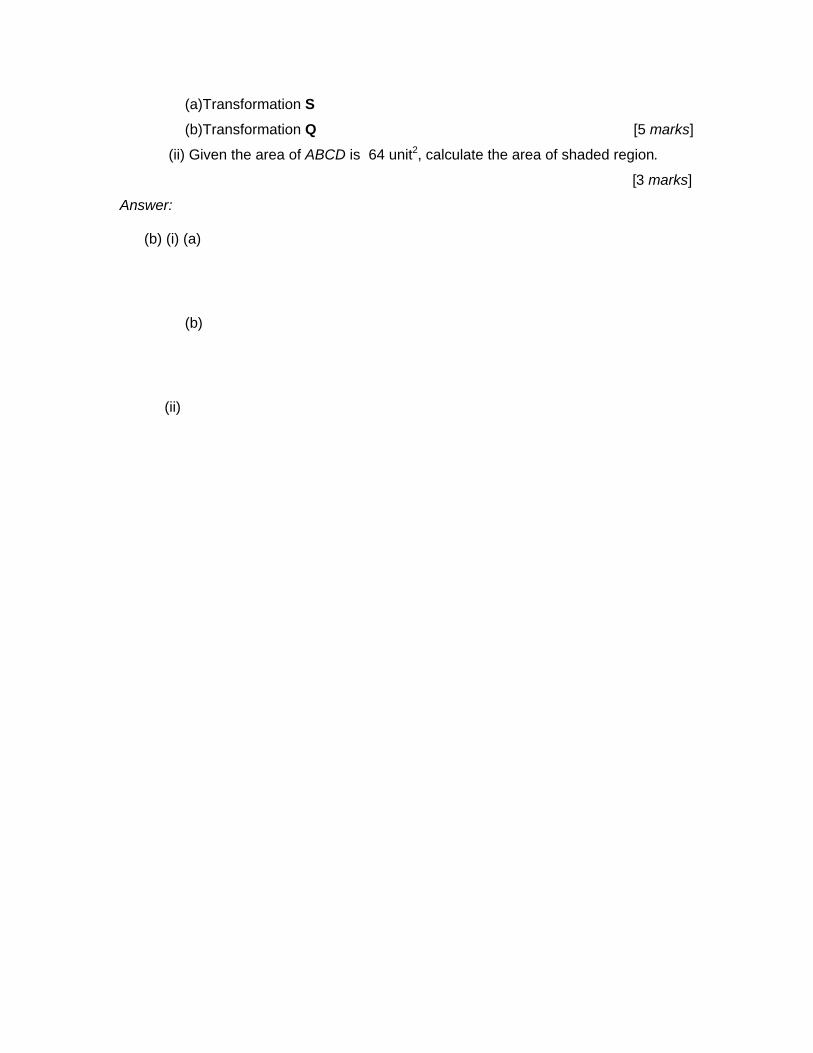
(a)Transformation S
(b)Transformation Q [5 marks]
(ii) Given the area of ABCD is 64 unit2, calculate the area of shaded region.
[3 marks]
Answer: (b) (i) (a) (b) (ii)

1 (a) (i) (0, -1) 1 (ii)(a) (-3, -4) 1 (b) (-1, -2) 1 (b)(i)(a) M is a rotation of 90o clockwise about point (1,3) 3 (b) N is an enlargement with centre at (2,0) and a scale factor of 2 3 (ii) Area EFGH = k2(Area ABCD)
= 22(25) = 100 unit2
3
2 (a)(i) (4, -2) 1 (ii) (1, 0) 2 (b)(i)(a) U is a rotation of 90o clockwise about the point (1, 1) 3 (b) V is an enlargement with centre at (4, 0) and scale factor of 2 3 (ii) Area OFJK = k2(Area ABCD)
120 + Area ABCD = 22(Area ABCD) Area ABCD = 40 unit2
3
3 (a)(i) (12, 7) 1 (ii) (6, 7) 2 (b)(i)(a) V is a rotation of 90o clockwise about point (7, 0) 3 (b) W is an enlargement with centre at (7, 3) and scale factor of 3 3 (ii) Area EFG = k2(Area PQR)
72 = 32(Area PQR) Area PQR = 8 unit2
3
4 (a)(i) (-3, 6) 1 (ii) (6, 11) 2 (b)(i)(a)
U is a translation ⎟⎟⎠
⎞⎜⎜⎝
⎛−38
1
(b) V is an enlargement with centre at (-3, 8) and scale factor of 2. 3 (ii) Area WXYS = k2(Area RSTU)
150 + RSTU = 22(Area RSTU) Area RSTU = 50 cm2
4
5 (a)(i) (-3, 0) 2 (ii) (4, 4) 2 (b)(i)(a) S is a reflection in the line x =1 2 Q is an enlargement with centre at (-11, 2) and scale factor of 2. 3 (ii) Area ABCD + Area of shaded region= k2(Area ABCD)
64 + Area of shaded region = 22(64) Area of shaded region = (256 – 64) cm2 Area of the shaded region = 192 cm2
3
ANSWERSTOPIC : TRANSFORMATIONS


1. (a) The inverse matrix of is m Find the value of m and of n.
(b) Hence, using matrices, solve the following simultaneous equations : 3x – 2y = 8 5x – 4y = 13
Answer : (a) (b)
⎟⎟⎠
⎞⎜⎜⎝
⎛−−
4523
⎜⎜⎝
⎛−−
54
⎟⎟⎠
⎞3n
MODULE 12 TOPIC : MATRICES
TIME : 2 HOURS

2. (a) Given that G = and the inverse matrix of G is find the value of m and of n.
(b) Hence, using matrices, calculate the value of p and of q that satisfies the following equation :
Answer :
(a)
(b)
⎟⎟⎠
⎞⎜⎜⎝
⎛n
m2
3,
234
141
⎟⎟⎠
⎞⎜⎜⎝
⎛−
−m
⎟⎟⎠
⎞⎜⎜⎝
⎛−
=⎟⎟⎠
⎞⎜⎜⎝
⎛8
1qp
G

3. (a) Given that find matrix A.
(b) Hence, using the matrix method, find the value of r and s which satisfy the simultaneous equations below. -r + 2s = -4 -3r + 5s = -9
Answer : (a) (b)
,1001
5321
⎟⎟⎠
⎞⎜⎜⎝
⎛=⎟⎟
⎠
⎞⎜⎜⎝
⎛−−
A

4. Given matrix P = and matrix PQ =
(a) Find the matrix Q. (b) Hence, calculate by using the matrix method, the values of m and n that
satisfy the following simultaneous linear equations : 4m + 5n = 7 6m + 8n = 10
Answer : (a) (b)
⎟⎟⎠
⎞⎜⎜⎝
⎛8654
⎟⎟⎠
⎞⎜⎜⎝
⎛1001

5. Given the matrix P is , (a) Find the matrix Q so that PQ = (b) Hence, calculate the values of h and k, which satisfy the matrix equation: Answer :
(a) (b)
⎟⎟⎠
⎞⎜⎜⎝
⎛−−
5834
⎟⎟⎠
⎞⎜⎜⎝
⎛−−
=⎟⎟⎠
⎞⎜⎜⎝
⎛⎟⎟⎠
⎞⎜⎜⎝
⎛−−
117
5834
kh
⎟⎟⎠
⎞⎜⎜⎝
⎛1001
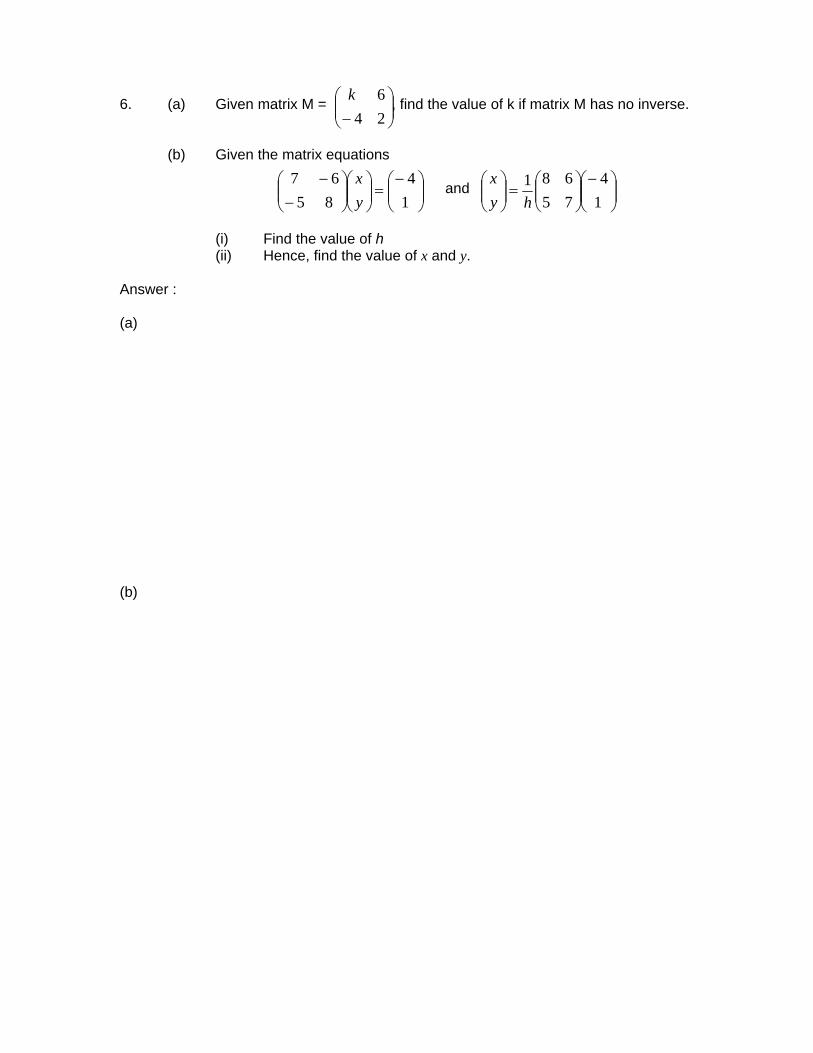
6. (a) Given matrix M = , find the value of k if matrix M has no inverse. (b) Given the matrix equations and
(i) Find the value of h (ii) Hence, find the value of x and y.
Answer : (a) (b)
⎟⎟⎠
⎞⎜⎜⎝
⎛− 24
6k
⎟⎟⎠
⎞⎜⎜⎝
⎛−=⎟⎟
⎠
⎞⎜⎜⎝
⎛⎟⎟⎠
⎞⎜⎜⎝
⎛−
−14
8567
yx
⎟⎟⎠
⎞⎜⎜⎝
⎛−⎟⎟⎠
⎞⎜⎜⎝
⎛=⎟⎟
⎠
⎞⎜⎜⎝
⎛14
75681
hyx

7. It is given that matrix P = does not have an inverse matrix.
(a) Find the value of k. (b) If k = 1, find the inverse matrix of P and hence, using matrices, find the
values of x and y that satisfy the following simultaneous linear equations.
2x + 5y = 13 x - 2y = -7
Answer : (a) (b)
⎟⎟⎠
⎞⎜⎜⎝
⎛− 252
k

8. (a) Find matrix M such that (b) Using matrices, calculate the values of x and y that satisfy the following
matrix equation.
Answer : (a) (b)
⎟⎟⎠
⎞⎜⎜⎝
⎛=⎟⎟
⎠
⎞⎜⎜⎝
⎛3142
3142
M
⎟⎟⎠
⎞⎜⎜⎝
⎛=⎟⎟
⎠
⎞⎜⎜⎝
⎛⎟⎟⎠
⎞⎜⎜⎝
⎛56
3142
yx

9. (a) Find the inverse of matrix .
(b) Hence, using matrices, calculate the values of d and e that satisfy the following simultaneous equations : 2d – e = 7 5d – e = 16
Answer : (a) (b)
⎟⎟⎠
⎞⎜⎜⎝
⎛−−
2513
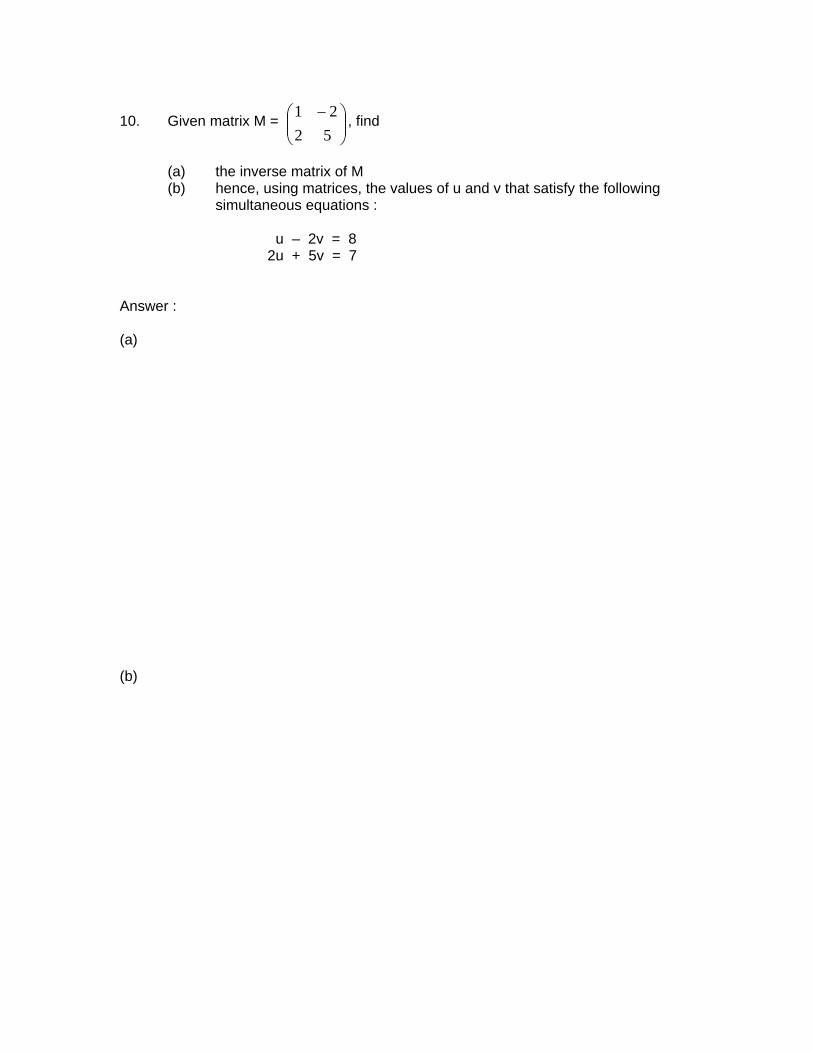
10. Given matrix M = , find
(a) the inverse matrix of M (b) hence, using matrices, the values of u and v that satisfy the following
simultaneous equations :
u – 2v = 8 2u + 5v = 7
Answer : (a) (b)
⎟⎟⎠
⎞⎜⎜⎝
⎛ −5221

MODULE 12 - ANSWERS TOPIC : MATRICES
1. (a) m = 1m n = 2 1m (b) = 1m 1m x = 3 1m
y = 1m 2. (a) n = 4 1m m = 5 1m (b) 1m 1m p = 2 1m q = -3 1m 3. (a) A = 2m
(b) 1m
1m
r = -2 1m s = -3 1m 4. (a) P = 1m
21
−
⎜⎜⎝
⎛53
⎟⎟⎠
⎞−−
42
⎟⎟⎠
⎞⎜⎜⎝
⎛yx
⎟⎟⎠
⎞⎜⎜⎝
⎛138
⎜⎜⎝
⎛−−
=⎟⎟⎠
⎞⎜⎜⎝
⎛54
21
yx
⎟⎟⎠
⎞⎜⎜⎝
⎛⎟⎟⎠
⎞138
32
21
−
⎜⎜⎝
⎛25
⎟⎟⎠
⎞43
=⎟⎟⎠
⎞⎜⎜⎝
⎛qp
⎟⎟⎠
⎞⎜⎜⎝
⎛− 81
⎟⎟⎠
⎞⎜⎜⎝
⎛−⎟⎟
⎠
⎞⎜⎜⎝
⎛−
−=⎟⎟
⎠
⎞⎜⎜⎝
⎛8
15234
141
qp
⎜⎜⎝
⎛35
⎟⎟⎠
⎞−−
12
⎜⎜⎝
⎛−−
31
⎟⎟⎠
⎞52
⎟⎟⎠
⎞⎜⎜⎝
⎛−−
=⎟⎟⎠
⎞⎜⎜⎝
⎛94
sr
⎟⎟⎠
⎞⎜⎜⎝
⎛−−
⎟⎟⎠
⎞⎜⎜⎝
⎛−−
=⎟⎟⎠
⎞⎜⎜⎝
⎛94
1325
11
sr
⎟⎟⎠
⎞⎜⎜⎝
⎛−
−− 46
583032
1
= 1m (b) 1m
1m
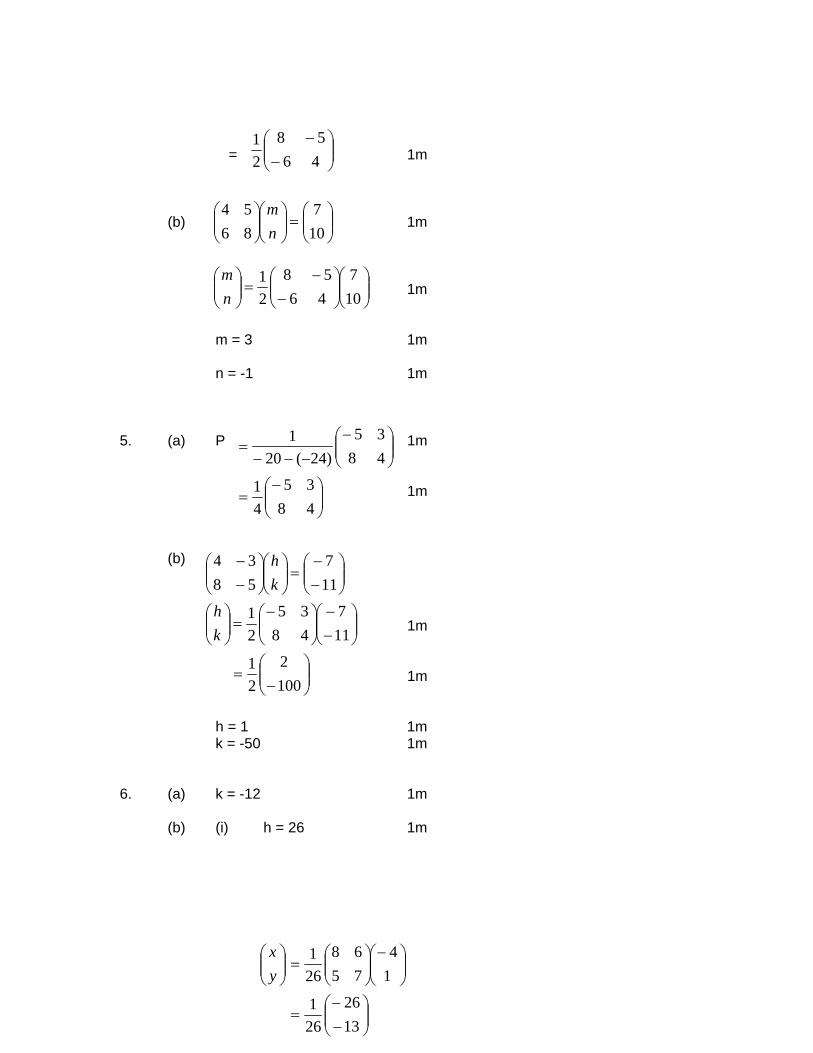
m = 3 1m n = -1 1m 5. (a) P 1m 1m (b) 1m 1m h = 1 1m k = -50 1m 6. (a) k = -12 1m (b) (i) h = 26 1m
⎟⎟⎠
⎞⎜⎜⎝
⎛−
−4658
21
⎟⎟⎠
⎞⎜⎜⎝
⎛=⎟⎟
⎠
⎞⎜⎜⎝
⎛⎟⎟⎠
⎞⎜⎜⎝
⎛107
8654
nm
⎟⎟⎠
⎞⎜⎜⎝
⎛⎟⎟⎠
⎞⎜⎜⎝
⎛−
−=⎟⎟
⎠
⎞⎜⎜⎝
⎛107
4658
21
nm
⎟⎟⎠
⎞⎜⎜⎝
⎛−=
⎟⎟⎠
⎞⎜⎜⎝
⎛−−−−
=
4835
41
4835
)24(201
⎟⎟⎠
⎞⎜⎜⎝
⎛−−
⎟⎟⎠
⎞⎜⎜⎝
⎛−=⎟⎟
⎠
⎞⎜⎜⎝
⎛
⎟⎟⎠
⎞⎜⎜⎝
⎛−−
=⎟⎟⎠
⎞⎜⎜⎝
⎛⎟⎟⎠
⎞⎜⎜⎝
⎛−−
117
4835
21
117
5834
kh
kh
⎟⎟⎠
⎞⎜⎜⎝
⎛−
=1002
21
⎟⎟⎠
⎞⎜⎜⎝
⎛yx
⎟⎟⎠
⎞⎜⎜⎝
⎛−−
=
⎟⎟⎠
⎞⎜⎜⎝
⎛−⎟⎟⎠
⎞⎜⎜⎝
⎛=
1326
261
14
7568
261

(ii) 1m
1m x = -1 1m
y = 1m 7. (a) - 4 – 5k = 0 1m 5k = -4 k = 1m (b)
1m 1m x = -1 1m y = 3 1m 8. (a) M = 2m (b) 1m 1m x = -1 1m y = 2 1m
21
−
54
−
⎟⎟⎠
⎞⎜⎜⎝
⎛−
=⎟⎟⎠
⎞⎜⎜⎝
⎛⎟⎟⎠
⎞⎜⎜⎝
⎛− 7
1321
52yx
⎟⎟⎠
⎞⎜⎜⎝
⎛−⎟⎟
⎠
⎞⎜⎜⎝
⎛−
−−−=⎟⎟
⎠
⎞⎜⎜⎝
⎛7
132152
91
yx
⎟⎟⎠
⎞⎜⎜⎝
⎛1001
⎟⎟⎠
⎞⎜⎜⎝
⎛⎟⎟⎠
⎞⎜⎜⎝
⎛−
−−
=⎟⎟⎠
⎞⎜⎜⎝
⎛56
2143
461
yx
⎟⎟⎠
⎞⎜⎜⎝
⎛−=
⎟⎟⎠
⎞⎜⎜⎝
⎛⎟⎟⎠
⎞⎜⎜⎝
⎛−
−=
42
21
56
2143
21

9. (a) 1m 1m (b) 1m 1m d = 5 1m e = 3 1m 10. (a) 1m 1m
(b) 1m
1m 1m 1m
⎟⎟⎠
⎞⎜⎜⎝
⎛−−
+− 3512
561
⎟⎟⎠
⎞⎜⎜⎝
⎛−−
−=
3512
11
⎟⎟⎠
⎞⎜⎜⎝
⎛=
⎟⎟⎠
⎞⎜⎜⎝
⎛−−
−=
⎟⎟⎠
⎞⎜⎜⎝
⎛⎟⎟⎠
⎞⎜⎜⎝
⎛−−
−=⎟⎟
⎠
⎞⎜⎜⎝
⎛
⎟⎟⎠
⎞⎜⎜⎝
⎛=⎟⎟
⎠
⎞⎜⎜⎝
⎛⎟⎟⎠
⎞⎜⎜⎝
⎛−−
35
35
11
167
2513
11
167
3512
ed
ed
⎟⎟⎠
⎞⎜⎜⎝
⎛−
=
⎟⎟⎠
⎞⎜⎜⎝
⎛−−−
1225
91
1225
)4(51
161
6
954
91
78
1225
91
78
5221
−==
⎟⎟⎠
⎞⎜⎜⎝
⎛−
=
⎟⎟⎠
⎞⎜⎜⎝
⎛−
=
⎟⎟⎠
⎞⎜⎜⎝
⎛⎟⎟⎠
⎞⎜⎜⎝
⎛−
=⎟⎟⎠
⎞⎜⎜⎝
⎛
⎟⎟⎠
⎞⎜⎜⎝
⎛=⎟⎟
⎠
⎞⎜⎜⎝
⎛⎟⎟⎠
⎞⎜⎜⎝
⎛ −
vu
vu
vu

1 Diagram 1 shows the speed-time graph of a particle for a period of 15 s.
DIAGRAM 1
(a) State the distance, in m, the particle moves with constant speed. (b) Calculate the rate of change of speed, in ms-2, in the first 6 s. (c) Calculate the value of k, if the total distance travelled in the first 15 s is 139m.
[6 marks] Answer: (a) (b) (c)
Speed (ms-1)
Time (s)
23
k
5
0 6 10 15
TOPIC : GRADIENT AND AREA UNDER A GRAPH
1 hr

2. Diagram 2 shows the speed-time graph of two particles, α and β for a period of 8s.
DIAGRAM 2 The graph OKNM represents the movement of particle α and the graph JKL represents the movement of particle β.Both particles start moving at the same time.
(a) State the length of time, in s, that particle α moves with uniform speed. (b) Calculate the rate of change of speed, in ms-2, of particle α in the first
6 s. (c) Calculate the difference in distance, in m, of particle α and particle β
for a period of 8 s. [6 marks]
Answer: (a) (b) (c)
Time (s)
Speed (ms-1)
O
4
8
K
N M
8
L
6
J
3

3. Diagram 3 shows the distance-time graph of the journeys taken by Ali and Fuad. DIAGRAM 3 The straight line OB represents Ali’s journey from town X to town Y, while the straight line FG represents Fuad’s journey from town Y to town X. Ali and Fuad uses the same route. (a) State the distance, in km, of town Y from town X. (b) Find the time Ali and Fuad meet each other during their journey. (c) Find the distance when they meet from town Y. (d) Calculate Fuad’s speed.
[6 marks] Answer: (a) (b) (c) (d)
Distance (km)
Time
105
60
O0700 0730 0800 0830 0900 0930
F
G
B

4. Diagram 4 shows the speed-time graph of a motorcyclist in a period of 30 seconds. Given that the total distance travelled by the motorcyclist is 525 m.
Calculate,
(a) the rate of change of speed in the last 5 second, (b) the duration of uniform speed, (c) the value of v.
[6 marks] Answer: (a) (b) (c)
time (s)
Speed (m s-1)
20
v
10 25 30
DIAGRAM 4

5. Diagram 5 shows a velocity-time graph for a particle. velocity ( m s-1) 20
(a) State the time, in s, the particle moves with constant velocity. (b) Calculate the accleration, in m s-2, of the particle in the last 5
seconds. (c) Find the value of u if the total distance travelled after 15 seconds is
190 m. [ 6 marks ]
Answer: (a) (b) (c)
15 25 30 time (s)
u
O
DIAGRAM 5

6. Diagram 6 shows a displacement – time graph for the journey of a car from town A
to town C passing town B and then back to town A.
DIAGRAM 6
(a) Calculate the speed in km/h for the journey from town A to town B.
(b) State the time taken for the car to stop at town C.
(c) Calculate the average speed in km/h for the total distance of the car.
[ 6 marks ]
Answer: (a) (b) (c)
Time (min) 0 20 55 64 95
B
Displacement (km)
45
60
A
C

Answer: (a) (b)
8 Diagram 8 shows the speed-time graph of a particle for a period of time 45 seconds.
(a) Calculate the rate of change of speed, in cm 2− , in the first 10 seconds. (b) Calculate the value of v, if the total distance traveled in the last 35 seconds is 725 m.
Speed (ms-1)
Time 0
15
10 30
20
45
Diagram 8
v

Answer: (a) (b) (c)
9. Diagram 9 shows the speed-time graph of a particle for a period of 17 seconds.
(a) Calculate the value of u, if the total distance traveled in the first 8 seconds is 164 meters.
(b) State the length of time, in s, that particle move with uniform speed.
(c) Calculate the rate of change of speed, in m s 2− , for a period of 20 second.
Time (s)
Speed (m/s)
0
u
8 12
25
20Diagram 9

Answer: (a) (b)
10 Diagram 10 shows the speed-time the speed-time graph of a particle for a period of 90 seconds. (a). Calculate the value of v (b). Calculate the distance for the first 50 seconds
Speed(m/s)
Time(s) 0
v
20 90
Diagram 10

MODULE 13 - ANSWERS TOPIC : GRADIENT AND AREA UNDER A GRAPH
1
(a)
(b)
(c)
20
60523
−−
−3 atau nyahpecutan 3 atau awapecutan 3
( ) ( ) 139k5521545236
21
=+×+×++×
k = 9
1 1 1 2 1
2(a)
(b)
(c)
2 saat
0608
−−
34
atau setara
( )82821
+×
( ) 8482821
×−+×
8
1
1
1
1
1
1
6
3
(a)
(b)
(c)
(d)
105 km 0800 a.m
105 – 60 = 45km
jkm /425.2
105=
1
1
1 1 1 1
6

4
(a)
2530200−−
24 −− ms (b) 5 s
(c) ( ) ( ) 525201520212010
21
=+××++×× v
112 −= msv
1 1 1 2 1
6
.
5
(b) 15
(b) 3025020
−−
4−
(c) 1902052110)20(
21
=××+×+× u
u = 8
1 1 1 2 1
6
6 (a)
(b)
(c)
20
60523
−−
−3 atau nyahpecutan 3 atau awapecutan 3
( ) ( ) 139k5521545236
21
=+×+×++×
k = 9
1 1 1 2 1

7
(c) =
6020
45135 jamkm
(b) 9 minit @ 203
jam @ 0.15 jam
(c) jamkm79.75120
6095
=
1 - 1 1 2- 1
6

1. A box contains 5 green marbles, 4 blue marbles and 6 red marbles. A marble is
picked at random. Without replacing the first marble, another marble is taken from the box. Calculate the probability that (a) the first marble green and the second marble red (b) two marbles are the same colour.
Answer: (a) (b)
2. Table 1 shows the number of members of two sport societies, Rugby and
Football, who are planning trips to Melaka and Pahang.
(a) If two members are chosen at random from the Rugby, calculate the probability that both of them will be going to Melaka.
(b) If two members are chosen at random from the group to Pahang, calculate the probability that both of them are from the same society.
Answer: (a) (b)
Number of members State to be visited Rugby Football Melaka 17 13 Pahang 9 15
Table 1
MODULE 14 TOPIC : PROBABILITY
TIME : 2 HOURS

3. Table 2 shows the number of students of the class that leave at two residential areas. (a) If two students are chosen at random from the Taman Penawar, calculate
the probability that one of the students is girl and the other one is boy. (b) If two students are chosen at random from boy group, calculate the
probability that both of the students are from the same residential area. Answer: (a) (b)
4. In a quiz contest, there are three categories of questions consisting of 5 questions on Chemistry, 3 questions on Biology and 7 questions on Physic. Each question is placed inside an envelope. All of the envelopes are similar and put inside a box. All the participants of the quiz contest are requested to pick at random two envelopes from the box. Find the probability that the first participant picks (a) the first envelope with a Chemistry question and the second envelope
with an Biology question. (b) two envelopes with question at the same category.
Number of students Residential area Boy Girl
Taman Desaru 7 3
Taman Penawar 5 4
Table 2

Answer:
(a) (b) 5. A group of 5 boys and 4 girls take part in science exhibitions. Each day, two
pupils are chosen at random to give presentation.
(a) Calculate the probability that both pupils chosen to give presentation on the first day are boys. (b) Two boys do give presentation on the first day. They are then exempted from giving presentation on the second day. Calculate the probability that both pupils chosen to give presentation on the second day are of the same gander.
Answer: (a) (b)

6. Diagram 1 shows the route of a van which carries a group of volunteers. The
group consists of 8 males and 4 females who are dropped of at random to give aid at various towns along the routes.
STARTING KOTA TINGGI SEGAMAT OTHERS POINT TOWNS
(a) If two volunteers are dropped off at Kota Tinggi, calculate the probability
that both are males. (b) Two volunteers of different gender are dropped off at Kota Tinggi. If two
other volunteers are then dropped at Segamat, calculate the probability that at least one of them is female.
Answer: (a) (b)
7. Diagram 2 shows the route for cross country event.
Diagram 1
Station C
⊗
⊗
⊗⊗
⊗
Start/Finish
Station A
Station B Station D
⊗Station E

Diagram 2
The group 7 boys and 3 girls from KRS squad are chosen for duty on cross country day. Each station, two pupils are chosen at random at each station to perform their duties.
(a) If two of the pupils are selected to duty at Station A. Calculate the probability
that both are girls. (b) Two boys from that group are duty at Station A. Another two pupils are
selected at random to be on duty at Station B. Calculate the probability that both pupils chosen for Station B are of different gender.
Answer: (a) (b) 8. Diagram 3 show twelve labelled cards which are placed in an empty box.
Diagram 3 (a) If a card is chosen at random from the box, calculate the probability that
the card labelled ‘L’ is chosen. (b) If a card is chosen at random from the box, calculate the probability that
the card labelled ‘L’ or the card labelled ‘C’ are chosen. Answer: (a)
P
C
CIO L E
STED A

(b)
9. Table 3 which is incomplete shows, the probability of spending the weekend among two classmate Azmi and Faizal.
Table 3 Calculate the probability that (a) Azmi going shopping (b) They both doing the same activities Answer: (a) (b)
Probability Students Gardening Fishing Shopping Azmi
61
43
Faizal
52
101
21

10. Table 4 shows the numbers of students in Form 3 Maju and 3 Bestari who
entitles to receive school t-shirts.
Table 4 Two students from the group are chosen atrandom to receive a school t-shirt
each. Find the probability that both student chosen
(a) are boys, (b) are girls from the same class.
Answer: (a) (b)
Gender Form Boy Girl
3 Maju 3 5 3 Bestari 6 2

Answer:
1. (a) =31
155=
(b) = ⎟⎠⎞
⎜⎝⎛ ++⎟
⎠⎞
⎜⎝⎛ ×+⎟
⎠⎞
⎜⎝⎛ ×
145
156
143
154
144
155
=10531
2. (a) =325136
2516
2617
=×
(b) = ⎟⎠⎞
⎜⎝⎛ ×+⎟
⎠⎞
⎜⎝⎛ ×
2314
2415
238
249
=9247
3. (a) =95
85
94
84
95
=⎟⎠⎞
⎜⎝⎛ ×+⎟
⎠⎞
⎜⎝⎛ ×
(b) = ⎟⎠⎞
⎜⎝⎛ ×+⎟
⎠⎞
⎜⎝⎛ ×
114
125
116
127
=6631
4. (a) =141
143
155
=⎟⎠⎞
⎜⎝⎛ ×
(b) = ⎟⎠⎞
⎜⎝⎛ ×+⎟
⎠⎞
⎜⎝⎛ ×+⎟
⎠⎞
⎜⎝⎛ ×
146
157
142
153
144
155
=10534
5. (a) =84
95×
=185
(b) = ⎟⎠⎞
⎜⎝⎛ ×+⎟
⎠⎞
⎜⎝⎛ ×
63
74
62
73
MODULE 8: ANSWERS TOPIC : PROBABILITY

=73
6. (a) =117
128×
=3314
(b) = ⎟⎠⎞
⎜⎝⎛ ×+⎟
⎠⎞
⎜⎝⎛ ×+⎟
⎠⎞
⎜⎝⎛ ×
92
103
93
107
97
103
=158
7. (a) =92
103+
=151
(b) = ⎟⎠⎞
⎜⎝⎛ ++⎟
⎠⎞
⎜⎝⎛ ×
95
103
93
105
=31
8. (a) =121
(b) =122
121+
=123
9. (a) = 1 - ⎟⎠⎞
⎜⎝⎛ +
43
61
=121
(b) = ⎟⎠⎞
⎜⎝⎛ ×+⎟
⎠⎞
⎜⎝⎛ ×+⎟
⎠⎞
⎜⎝⎛ ×
21
121
101
43
52
61
=6011
10. (a) = 158
169×
=103

(b) = ⎟⎠⎞
⎜⎝⎛ ×+⎟
⎠⎞
⎜⎝⎛ ×
151
162
154
165
=12011