
Merck & Co., Inc. Financial Highlights Package First...
9
Merck & Co., Inc. Financial Highlights Package First Quarter 2017 Table of Contents Table 1: GAAP P&L........................................................................1 Table 1a: GAAP P&L – Current Year and Prior Year by Quarter.....2 Table 2a: GAAP to Non-GAAP P&L Reconciliation 1Q17 ...............3 Table 2b: GAAP to Non-GAAP P&L Reconciliation 1Q16 ...............4 Table 3: Sales – Current Year and Prior Year by Quarter .............5 Table 3a: Sales – U.S. / Ex- U.S. 1Q17 ...........................................6 Table 3b: Sales – Pharmaceutical Geographic Split ........................7 Table 4: Other (Income) Expense ..................................................8 Supplement to 1Q 2017 Earnings Release
Transcript of Merck & Co., Inc. Financial Highlights Package First...

Merck & Co., Inc.
Financial Highlights Package
First Quarter 2017
Table of Contents
Table 1: GAAP P&L ........................................................................1
Table 1a: GAAP P&L – Current Year and Prior Year by Quarter .....2
Table 2a: GAAP to Non-GAAP P&L Reconciliation 1Q17 ...............3
Table 2b: GAAP to Non-GAAP P&L Reconciliation 1Q16 ...............4
Table 3: Sales – Current Year and Prior Year by Quarter .............5
Table 3a: Sales – U.S. / Ex- U.S. 1Q17 ...........................................6
Table 3b: Sales – Pharmaceutical Geographic Split ........................7
Table 4: Other (Income) Expense ..................................................8
Supplement to 1Q 2017
Earnings Release

Sales 9,434$ 9,312$ 1%
Costs, Expenses and Other
Materials and production (1) 3,015 3,572 -16%
Marketing and administrative (1) 2,411 2,318 4%
Research and development (1) 1,796 1,659 8%
Restructuring costs (2) 151 91 66%
Other (income) expense, net (1) 58 48 21%
Income Before Taxes 2,003 1,624 23%
Taxes on Income 447 494
Net Income 1,556 1,130 38%
Less: Net Income Attributable to Noncontrolling Interests 5 5
Net Income Attributable to Merck & Co., Inc. 1,551$ 1,125$ 38%
Earnings per Common Share Assuming Dilution 0.56$ 0.40$ 40%
Average Shares Outstanding Assuming Dilution 2,766 2,795
Tax Rate 22.3% 30.4%
MERCK & CO., INC.CONSOLIDATED STATEMENT OF INCOME - GAAP
(AMOUNTS IN MILLIONS, EXCEPT PER SHARE FIGURES)(UNAUDITED)
Table 1
(1) Amounts include the impact of acquisition and divestiture-related costs, restructuring costs and certain other items. See accompanying tables for details.
(2) Represents separation and other related costs associated with restructuring activities under the company's formal restructuring programs.
1Q161Q17
GAAP
% Change
1
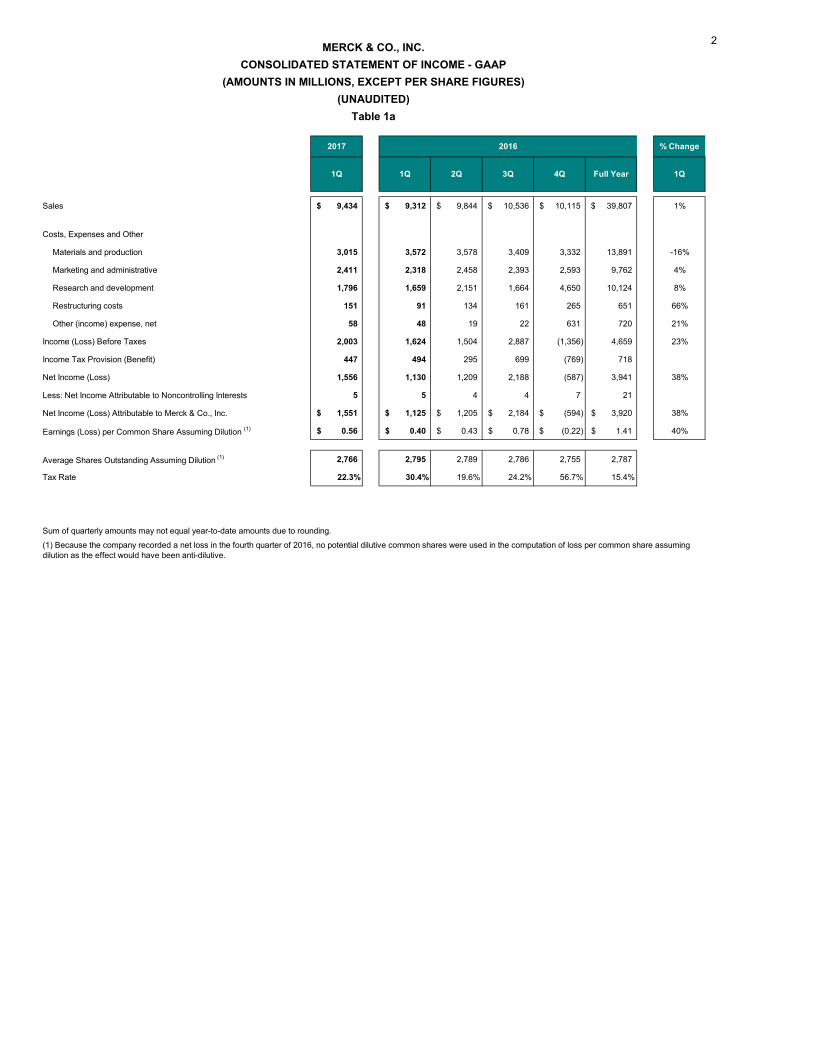
. .Sales 9,434$ 9,312$ 9,844$ 10,536$ 10,115$ 39,807$ 1%
Costs, Expenses and Other
Materials and production 3,015 3,572 3,578 3,409 3,332 13,891 -16%
Marketing and administrative 2,411 2,318 2,458 2,393 2,593 9,762 4%
Research and development 1,796 1,659 2,151 1,664 4,650 10,124 8%
Restructuring costs 151 91 134 161 265 651 66%
Other (income) expense, net 58 48 19 22 631 720 21%
Income (Loss) Before Taxes 2,003 1,624 1,504 2,887 (1,356) 4,659 23%
Income Tax Provision (Benefit) 447 494 295 699 (769) 718
Net Income (Loss) 1,556 1,130 1,209 2,188 (587) 3,941 38%
Less: Net Income Attributable to Noncontrolling Interests 5 5 4 4 7 21
Net Income (Loss) Attributable to Merck & Co., Inc. 1,551$ 1,125$ 1,205$ 2,184$ (594)$ 3,920$ 38%
Earnings (Loss) per Common Share Assuming Dilution (1) 0.56$ 0.40$ 0.43$ 0.78$ (0.22)$ 1.41$ 40%
Average Shares Outstanding Assuming Dilution (1) 2,766 2,795 2,789 2,786 2,755 2,787
Tax Rate 22.3% 30.4% 19.6% 24.2% 56.7% 15.4%
Sum of quarterly amounts may not equal year-to-date amounts due to rounding.
(1) Because the company recorded a net loss in the fourth quarter of 2016, no potential dilutive common shares were used in the computation of loss per common share assuming dilution as the effect would have been anti-dilutive.
MERCK & CO., INC.CONSOLIDATED STATEMENT OF INCOME - GAAP
(AMOUNTS IN MILLIONS, EXCEPT PER SHARE FIGURES)(UNAUDITED)
Table 1a
% Change2017
1Q 3Q 1Q
2016
1Q 4Q2Q Full Year
2

Materials and production 3,015$ 855 63 918 2,097$
Marketing and administrative 2,411 20 1 21 2,390
Research and development 1,796 11 11 1,785
Restructuring costs 151 151 151 -
Other (income) expense, net 58 (3) (9) (12) 70
Income Before Taxes 2,003 (883) (215) 9 (1,089) 3,092
Income Tax Provision (Benefit) 447 (158) (3) (48) (3) 3 (3) (203) 650
Net Income 1,556 (725) (167) 6 (886) 2,442
Net Income Attributable to Merck & Co., Inc. 1,551 (725) (167) 6 (886) 2,437
Earnings per Common Share Assuming Dilution 0.56$ (0.26) (0.06) - (0.32) 0.88$
Tax Rate 22.3% 21.0%
Only the line items that are affected by non-GAAP adjustments are shown.
Merck is providing certain non-GAAP information that excludes certain items because of the nature of these items and the impact they have on the analysis of underlying business performance and trends. Management believes that providing this information enhances investors’ understanding of the company’s results as it permits investors to understand how management assesses performance. Management uses these measures internally for planning and forecasting purposes and to measure the performance of the company along with other metrics. Senior management’s annual compensation is derived in part using non-GAAP income and non-GAAP EPS. This information should be considered in addition to, but not as a substitute for or superior to, information prepared in accordance with GAAP.
(1) Amounts included in materials and production costs primarily reflect $773 million of expenses for the amortization of intangible assets recognized as a result of acquisitions, as well as intangible asset impairment charges of $76 million. Amounts included in marketing and administrative expenses reflect integration, transaction and certain other costs related to business acquisitions, including severance costs which are not part of the company's formal restructuring programs, as well as transaction and certain other costs related to business divestitures. Amounts included in research and development expenses primarily reflect changes in the estimated fair value measurement of liabilities for contingent consideration.
(2) Amounts primarily include employee separation costs and accelerated depreciation associated with facilities to be closed or divested related to activities under the company's formal restructuring programs.
Adjustment Subtotal Non-GAAPGAAP
Acquisition and Divestiture-Related
Costs (1)
Restructuring Costs (2)
Certain Other Items
(3) Represents the estimated tax impact on the reconciling items based on applying the statutory rate of the originating territory of the non-GAAP adjustments.
Table 2a
MERCK & CO., INC.GAAP TO NON-GAAP RECONCILIATION
FIRST QUARTER 2017(AMOUNTS IN MILLIONS, EXCEPT PER SHARE FIGURES)
(UNAUDITED)
3

Materials and production 3,572$ 1,386 47 1,433 2,139$
Marketing and administrative 2,318 2 3 5 2,313
Research and development 1,659 35 55 90 1,569
Restructuring costs 91 91 91 -
Other (income) expense, net 48 48
Income Before Taxes 1,624 (1,423) (196) (1,619) 3,243
Income Tax Provision (Benefit) 494 (209) (3) (43) (3) (252) 746
Net Income 1,130 (1,214) (153) (1,367) 2,497
Net Income Attributable to Merck & Co., Inc. 1,125 (1,214) (153) (1,367) 2,492
Earnings per Common Share Assuming Dilution 0.40$ (0.43) (0.06) (0.49) 0.89$
Tax Rate 30.4% 23.0%
Only the line items that are affected by non-GAAP adjustments are shown.
Merck is providing certain non-GAAP information that excludes certain items because of the nature of these items and the impact they have on the analysis of underlying business performance and trends. Management believes that providing this information enhances investors’ understanding of the company’s results as it permits investors to understand how management assesses performance. Management uses these measures internally for planning and forecasting purposes and to measure the performance of the company along with other metrics. Senior management’s annual compensation is derived in part using non-GAAP income and non-GAAP EPS. This information should be considered in addition to, but not as a substitute for or superior to, information prepared in accordance with GAAP.
(1) Amounts included in materials and production costs reflect $1.1 billion of expenses for the amortization of intangible assets recognized as a result of acquisitions, as well as $24 million of amortization of purchase accounting adjustments to inventories related to the 2015 acquisition of Cubist Pharmaceuticals, Inc., and $252 million of intangible asset impairment charges. Amounts included in marketing and administrative expenses reflect integration, transaction and certain other costs related to business acquisitions, including severance costs which are not part of the company's formal restructuring programs, as well as transaction and certain other costs related to business divestitures. Amounts included in research and development expenses primarily reflect in-process research and development (IPR&D) impairment charges.
(2) Amounts primarily include employee separation costs and accelerated depreciation associated with facilities to be closed or divested related to activities under the company's formal restructuring programs.
(3) Represents the estimated tax impact of the reconciling items based on applying the statutory rate of the originating territory of the non-GAAP adjustments.
Table 2b
GAAPAcquisition and
Divestiture-Related Costs (1)
Restructuring Costs (2)
Adjustment Subtotal Non-GAAP
(UNAUDITED)
MERCK & CO., INC.GAAP TO NON-GAAP RECONCILIATION
FIRST QUARTER 2016(AMOUNTS IN MILLIONS, EXCEPT PER SHARE FIGURES)
4

1Q 1Q 2Q 3Q 4Q Full Year 1Q
TOTAL SALES (1) $9,434 $9,312 $9,844 $10,536 $10,115 $39,807 1PHARMACEUTICAL 8,185 8,104 8,700 9,443 8,904 35,151 1
Primary Care and Women's HealthCardiovascular
Zetia 334 612 702 671 575 2,560 -46Vytorin 241 277 293 273 299 1,141 -13Liptruzet 49 23 33 39 50 146 114Adempas 84 33 40 48 49 169 158
DiabetesJanuvia 839 906 1,064 1,006 932 3,908 -7Janumet 496 506 569 548 577 2,201 -2
General Medicine & Women's HealthImplanon / Nexplanon 170 134 164 148 160 606 27NuvaRing 160 175 200 195 207 777 -9Follistim AQ 81 94 73 101 87 355 -14
Hospital and SpecialtyHepatitis
Zepatier 378 50 112 164 229 555 *HIV
Isentress 305 340 338 372 337 1,387 -10Hospital Acute Care
Bridion 148 90 113 139 139 482 63Noxafil 141 145 143 147 161 595 -3Invanz 136 114 143 152 152 561 20Cancidas 121 133 131 142 152 558 -9Cubicin 96 292 357 320 119 1,087 -67Primaxin 62 73 81 77 66 297 -15
ImmunologyRemicade 229 349 339 311 269 1,268 -34Simponi 184 188 199 193 186 766 -2
OncologyKeytruda 584 249 314 356 483 1,402 134Emend 133 126 143 137 144 549 6Temodar 66 66 73 78 67 283 0
Diversified BrandsRespiratory
Singulair 186 237 229 239 210 915 -22Nasonex 139 229 101 94 112 537 -40Dulera 82 113 121 97 105 436 -27
OtherCozaar / Hyzaar 112 126 132 131 121 511 -11Arcoxia 103 111 117 114 108 450 -7Fosamax 61 75 73 68 68 284 -19
Vaccines (2)
Gardasil / Gardasil 9 532 378 393 860 542 2,173 41ProQuad / M-M-R II / Varivax 355 357 383 496 405 1,640 0RotaTeq 224 188 130 171 162 652 19Pneumovax 23 163 107 120 175 238 641 52Zostavax 154 125 149 190 221 685 23
Other Pharmaceutical (3) 1,037 1,083 1,128 1,191 1,172 4,574 -4
ANIMAL HEALTH 939 829 900 865 884 3,478 13
Other Revenues (4) 310 379 244 228 327 1,178 -18* 200% or greater
(4) Other Revenues are comprised primarily of alliance revenue, third-party manufacturing sales and miscellaneous corporate revenues, including revenue hedging activities.
MERCK & CO., INC.FRANCHISE / KEY PRODUCT SALES
(AMOUNTS IN MILLIONS)Table 3
2017 2016 % Change
Sum of quarterly amounts may not equal year-to-date amounts due to rounding.
(1) Only select products are shown. (2) Vaccine sales in 2017 include sales in the European markets that were previously part of the Sanofi Pasteur MSD (SPMSD) joint venture that was terminated on December 31, 2016. Amounts for 2016 include supply sales to SPMSD.(3) Includes Pharmaceutical products not individually shown above. Other Vaccines sales included in Other Pharmaceutical were $88 million in the first quarter of 2017 and $103 million, $91 million, $135 million and $126 million for the first, second, third and fourth quarters of 2016, respectively.
5

1Q 2017 1Q 2016 % Change 1Q 2017 1Q 2016 % Change 1Q 2017 1Q 2016 % Change
TOTAL SALES (1) $9,434 $9,312 1 $4,195 $4,222 -1 $5,239 $5,090 3
PHARMACEUTICAL 8,185 8,104 1 3,761 3,913 -4 4,424 4,191 6Primary Care and Women's Health
CardiovascularZetia 334 612 -46 111 386 -71 222 226 -2Vytorin 241 277 -13 90 109 -18 151 168 -10Liptruzet 49 23 114 (0) (0) 49 23 114Adempas 84 33 158 0 - 84 33 158
DiabetesJanuvia 839 906 -7 507 549 -8 332 357 -7Janumet 496 506 -2 195 226 -14 302 280 8
General Medicine & Women's HealthImplanon / Nexplanon 170 134 27 132 99 32 39 35 12NuvaRing 160 175 -9 113 128 -12 47 48 -1Follistim AQ 81 94 -14 42 53 -21 40 42 -4
Hospital and SpecialtyHepatitis
Zepatier 378 50 * 200 49 * 178 1 *
HIVIsentress 305 340 -10 143 162 -12 162 178 -9
Hospital Acute CareBridion 148 90 63 45 5 * 102 86 19Noxafil 141 145 -3 65 71 -8 76 74 3Invanz 136 114 20 82 65 26 54 49 10Cancidas 121 133 -9 5 4 20 116 128 -10Cubicin 96 292 -67 54 255 -79 41 37 13Primaxin 62 73 -15 0 1 -57 62 73 -14
ImmunologyRemicade 229 349 -34 0 - 229 349 -34Simponi 184 188 -2 0 - 184 188 -2
OncologyKeytruda 584 249 134 361 133 172 223 116 92Emend 133 126 6 86 82 5 47 44 7Temodar 66 66 1 4 -78 65 62 6
Diversified BrandsRespiratory
Singulair 186 237 -22 6 17 -66 180 220 -18Nasonex 139 229 -40 18 112 -84 121 117 3Dulera 82 113 -27 75 107 -29 7 6 18
OtherCozaar / Hyzaar 112 126 -11 3 6 -48 109 121 -9Arcoxia 103 111 -7 0 - 103 111 -7Fosamax 61 75 -19 1 1 62 60 74 -20
Vaccines (2)
Gardasil / Gardasil 9 532 378 41 398 320 25 134 58 130ProQuad / M-M-R II / Varivax 355 357 298 310 -4 57 47 21RotaTeq 224 188 19 178 149 20 45 39 16Pneumovax 23 163 107 52 114 67 70 49 40 22Zostavax 154 125 23 109 109 45 16 174
Other Pharmaceutical (3) 1,037 1,083 -4 329 334 -1 709 745 -5
ANIMAL HEALTH 939 829 13 283 233 22 656 596 10
Other Revenues (4) 310 379 -18 151 76 99 159 303 -48
* 200% or greater
(4) Other Revenues are comprised primarily of alliance revenue, third-party manufacturing sales and miscellaneous corporate revenues, including revenue hedging activities.
MERCK & CO., INC.FRANCHISE / KEY PRODUCT SALES
FIRST QUARTER 2017(AMOUNTS IN MILLIONS)
Table 3a
(3) Includes Pharmaceutical products not individually shown above. Other Vaccines sales included in Other Pharmaceutical were $88 million and $103 million on a global basis for first quarter 2017 and 2016, respectively.
(1) Only select products are shown.
U.S.
(2) Vaccine sales in 2017 include sales in the European markets that were previously part of the Sanofi Pasteur MSD (SPMSD) joint venture that was terminated on December 31, 2016. Amounts for 2016 include supply sales to SPMSD.
Global International
6
1Q 1Q 2Q 3Q 4Q Full Year
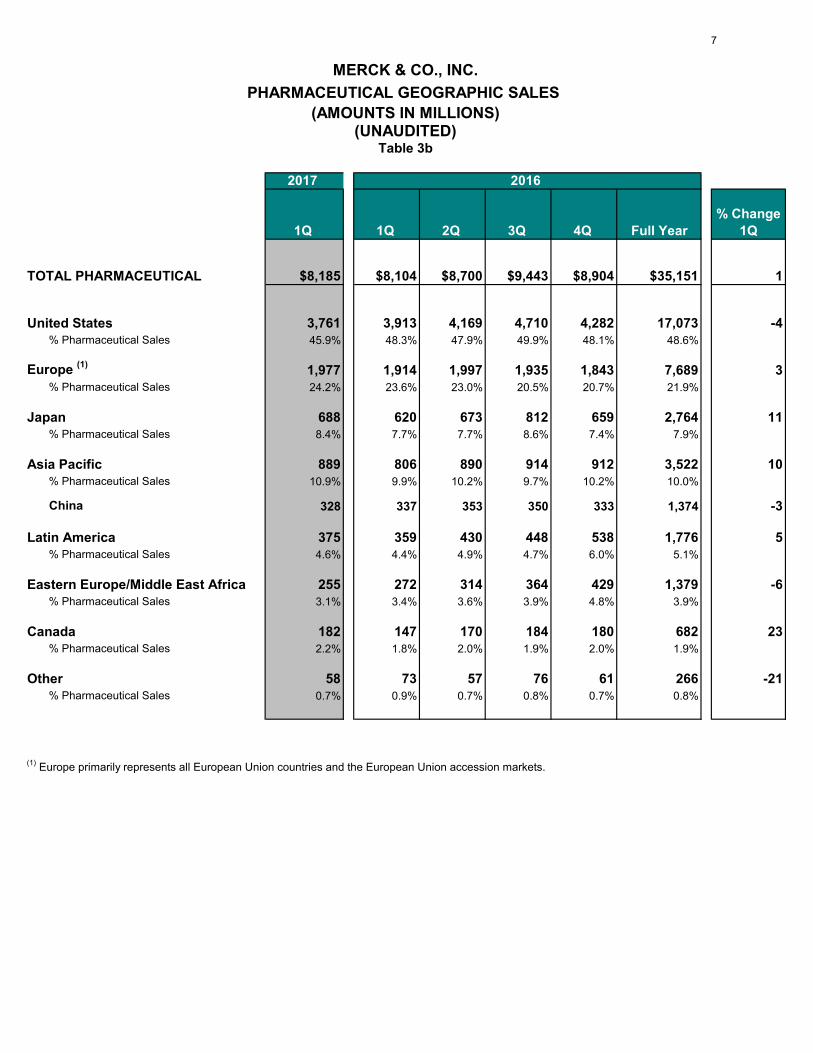
TOTAL PHARMACEUTICAL $8,185 $8,104 $8,700 $9,443 $8,904 $35,151 1
United States 3,761 3,913 4,169 4,710 4,282 17,073 -4% Pharmaceutical Sales 45.9% 48.3% 47.9% 49.9% 48.1% 48.6%
Europe (1) 1,977 1,914 1,997 1,935 1,843 7,689 3% Pharmaceutical Sales 24.2% 23.6% 23.0% 20.5% 20.7% 21.9%
Japan 688 620 673 812 659 2,764 11% Pharmaceutical Sales 8.4% 7.7% 7.7% 8.6% 7.4% 7.9%
Asia Pacific 889 806 890 914 912 3,522 10% Pharmaceutical Sales 10.9% 9.9% 10.2% 9.7% 10.2% 10.0%
China 328 337 353 350 333 1,374 -3
Latin America 375 359 430 448 538 1,776 5% Pharmaceutical Sales 4.6% 4.4% 4.9% 4.7% 6.0% 5.1%
Eastern Europe/Middle East Africa 255 272 314 364 429 1,379 -6% Pharmaceutical Sales 3.1% 3.4% 3.6% 3.9% 4.8% 3.9%
Canada 182 147 170 184 180 682 23% Pharmaceutical Sales 2.2% 1.8% 2.0% 1.9% 2.0% 1.9%
Other 58 73 57 76 61 266 -21% Pharmaceutical Sales 0.7% 0.9% 0.7% 0.8% 0.7% 0.8%
2017 2016
MERCK & CO., INC.PHARMACEUTICAL GEOGRAPHIC SALES
(AMOUNTS IN MILLIONS)(UNAUDITED)
Table 3b
(1) Europe primarily represents all European Union countries and the European Union accession markets.
% Change 1Q
7

OTHER (INCOME) EXPENSE, NET
1Q17 1Q16INTEREST INCOME (97)$ (79)$ INTEREST EXPENSE 182 172 EXCHANGE (GAINS) LOSSES (8) 38 EQUITY LOSS (INCOME) FROM AFFILIATES 13 (34) Other, net (32) (49) TOTAL 58$ 48$
Table 4
MERCK & CO., INC.OTHER (INCOME) EXPENSE, NET - GAAP
(AMOUNTS IN MILLIONS)(UNAUDITED)
8


