Merchandising Reports Book - Point of Sale Software · PDF fileMerchandising Reports Book....
30
Section 1, Sales Report Generator Merchant Technologies (800) 395-8324 Page 1.1 By MERCHANT TECHNOLOGIES MERCHANT TECHNOLOGIES Corporate Headquarters: 5504 Business Drive, Wilmington, NC 28405 v (910) 452-9808, Fax (910) 452-9826 Sales Office: 3985 Race Road, Suites 7 & 8, Cincinnati, OH 45211 v (800) 395-8324, Fax (800) 804-6901 E-Mail: [email protected] Web: www.mtpos.com Merchandising Reports Book
Transcript of Merchandising Reports Book - Point of Sale Software · PDF fileMerchandising Reports Book....

Section 1, Sales Report Generator Merchant Technologies (800) 395-8324
Page 1.1
ByMERCHANT TECHNOLOGIES
MERCHANT TECHNOLOGIESCorporate Headquarters: 5504 Business Drive, Wilmington, NC 28405 v (910) 452-9808, Fax (910) 452-9826Sales Office: 3985 Race Road, Suites 7 & 8, Cincinnati, OH 45211 v (800) 395-8324, Fax (800) 804-6901
E-Mail: [email protected] Web: www.mtpos.com
MerchandisingReports Book
Section 1, Sales Report Generator Merchant Technologies (800) 395-8324
Page 1.2
Sales Report Generator System
Table
of
Contents
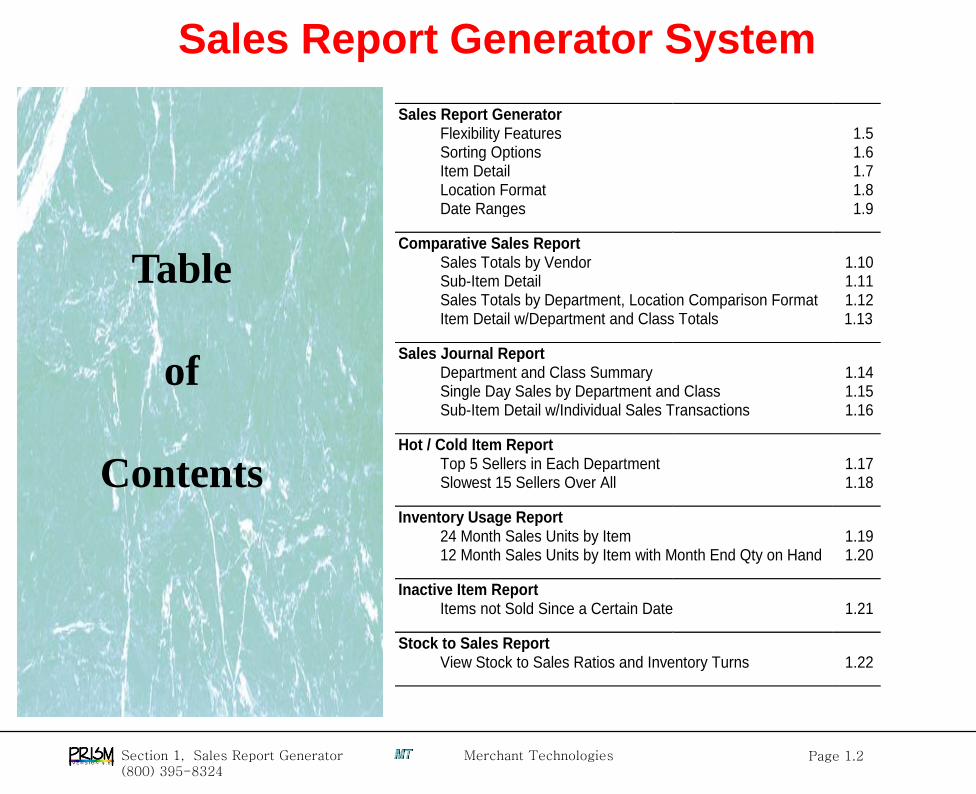
Sales Report Generator
Flexibility Features 1.5 Sorting Options 1.6 Item Detail 1.7 Location Format 1.8 Date Ranges 1.9
Comparative Sales Report
Sales Totals by Vendor 1.10 Sub-Item Detail 1.11 Sales Totals by Department, Location Comparison Format 1.12 Item Detail w/Department and Class Totals 1.13
Sales Journal Report
Department and Class Summary 1.14 Single Day Sales by Department and Class 1.15 Sub-Item Detail w/Individual Sales Transactions 1.16
Hot / Cold Item Report
Top 5 Sellers in Each Department 1.17 Slowest 15 Sellers Over All 1.18
Inventory Usage Report
24 Month Sales Units by Item 1.19 12 Month Sales Units by Item with Month End Qty on Hand 1.20
Inactive Item Report
Items not Sold Since a Certain Date 1.21
Stock to Sales Report
View Stock to Sales Ratios and Inventory Turns 1.22

Section 1, Sales Report Generator Merchant Technologies (800) 395-8324
Page 1.3
Table
of
Contents
Page 2
Sales Report Generator System
Location Comparison Report Selection Screen 1.23 Compare Sales Units, Quantity On Hand and On Order 1.24
Weekly Sales Report Sales Trends in Department 22 at Location 01 1.25
Style Status Report Style Status Exception Criteria Maintenance Screen 1.26 Style Status for a Particular Department and Class 1.27 Sub-Totals by Exception Status 1.28
Performance Summary Report Style Performance for a Particular Vendor 1.29
Gross Margin Return On Investment (GMROI) Report Item Detail for a Vendor 1.30

Section 1, Sales Report Generator Merchant Technologies (800) 395-8324
Page 1.4
Sales Report Generator System
The Flexibility built into the Sales Report Generating System
allows you to create your own reports, focusing on the Specific
Information you need to make the best decisions.
Your Sales Data can be reported in broad summaries or in the
most minute detail, and in 11 different formats.
Print Sales Reports to monitor just about every facet of your
operation, including Margins, On Hand and On Order Quantities,
Inventory Usage, Best Sellers, Discounts and Sales Trends.
The Flexibility Features include Sorting Options, Location
Formats, Summary / Detail Choices and Date Ranges.

Section 1, Sales Report Generator Merchant Technologies (800) 395-8324
Page 1.5
Report Format Options are selected on the Report Selection Screen
Sales Report Generator - Flexibility Features
The Report Format Options are the tools that provide the
Flexibility in the Sales Report Generator.
This Flexibility gives you the power to present your Sales Data
in the format most pertinent to the demands of the moment.
Run Date 6/20/97 S A L E S A N A L Y S I S R E P O R T Page 1
Run Time 2:08 PM MerchanTechnologies
[SELECT OPTIONS] Sort Order (1/2/3/4)? 3 <1>=Dept/Class/Item, <2>=Vend/Ref, <3>=Dept/Item, <4>=Vend/Dept/Ref
Region Code: ALL
Location Code: ALL
Vendor Code: ALL
Department Code: ALL
Class Code: ALL
Category Code: ALL
Item Code: ALL
Sales Period 1 (mmyy): 01/00 to 12/00
Sales Period 2 (mmyy): 01/99 to 12/99
Item Detail (1/2/3)? 1 <1>=Totals Only, <2>=Item Detail, <3>=Sub-Item Detail
Location Format (1/2/3)? 2 <1>=Separate Report by Location, <2>=Location Comparison, <3>=Consolidated
Print Deleted Items (Y/N)? Y <Y>=Prints % of Sales, <N>=% of Sales Suppressed
Active Items Only (Y/N)? N
----- 01/96 to 12/96 ----- ----- 01/95 to 12/95 -----
On Sales Sales % of Mrg Sales Sales % of Mrg
Hand Units $ Sales % Units $ Sales %
---- ----- ----- ----- --- ----- ----- ----- ---
10 SHIRTS 01 376 408 11665 25% 46% 270 7751 27% 49%
02 357 737 19366 41% 44% 402 10549 37% 46%
03 348 590 15979 34% 45% 406 10579 37% 46%
---- ---- ------- -- -- ----- ------- -- --
1081 1735 47011 40% 45% 1078 28880 42% 47%
20 SPORTING GOODS EQUIPMENT 01 135 112 5221 24% 52% 57 2694 36% 54%
02 108 133 6009 27% 51% 63 2824 37% 50%
03 106 236 10807 49% 51% 45 2068 27% 52%
---- ---- ------- -- -- ----- ------- -- --
349 481 22038 19% 51% 165 7588 11% 52%
25 SPORTS APPAREL 01 245 312 11544 31% 51% 128 4692 20% 51%
02 237 374 12263 33% 49% 258 9990 43% 51%
03 255 405 13594 36% 49% 249 8731 37% 49%
---- ---- ------- -- -- ----- ------- -- --
737 1091 37402 32% 50% 635 23414 34% 50%
81 TOYS 01 30 154 5309 44% 52% 142 4964 51% 53%
02 33 80 2635 22% 50% 85 2731 28% 49%
03 29 118 4002 34% 51% 58 1966 20% 51%
---- ---- ------- -- -- ----- ------- -- --
92 352 11947 10% 51% 285 9662 14% 51%
TOTAL Company: 2259 3659 118400 48% 2163 69545 49%
*** End of Report ***
Narrow the focus of the reporting output to a
particular group of Items. Enter the desired
grouping in as many of these fields that apply.

Section 1, Sales Report Generator Merchant Technologies (800) 395-8324
Page 1.6
Sales Report Generator - Sorting Options
Sorting By Department, Class and/or
VendorSort by up to 6 different combinations of
Department, Class and Vendor:
Department, Item
Department, Class, Item
Vendor, Item
Department, Vendor, Item
Department, Class, Vendor, Item
Vendor, Department, Item
Additional Sorting OptionsIn addition to the above, reports can be sorted by:
Category
Manufacturer
Sorting Items within GroupingsThe Items listed under the grouping can be sorted
by:
Item Code
Vendor Reference Code (Style, Model, etc)
Alphabetically by Item Description
Run Date 3/12/97 I N V E N T O R Y U S A G E R E P O R T Page 1
Run Time 1:44 PM MerchanTechnologies
[SELECT OPTIONS] Sort Order (1/2/3/4)? 1 <1>=Dept/Class/Item, <2>=Vend/Ref, <3>=Dept/Item <4>=Vend/Dept/Ref
Region Code: ALL
Location Code: 01
Vendor Code: ALL
Department Code: ALL
Class Code: ALL
Category Code: ALL
Item Code: ALL
Item Detail (1/2/3)? 2 <1>=Totals Only, <2>=Item Detail, <3>=Sub-Item Detail
Location Format (1/2/3)? 1 <1>=Separate Report by Location, <2>=Location Comparison, <3>=Consolidated
Print Deleted Items (Y/N)Y
Active Items Only (Y/N)? N
Months/Type (1/2/3)? 1 <1>=12 Mth Sales, <2>=24 Mth Sales, <3>=12 Mth Sales / 12 Mth Closing Units
Print Vendor Ref (Y/N)? N <Y>=Prints Vendor Reference Number, <N>=Prints item code
Location: 01 MERCHANTECHNOLOGIES
Department: 10 SHIRTS
- - - - - - - - - - - - S A L E S U N I T S - - - - - - - - - - - - - - -
Item Item On On 96 96 96 96 96 96 96 96 96 97 97 97
Code Description Hand Ord Apr May Jun Jul Aug Sep Oct Nov Dec Jan Feb Mar Total
---- ----------- ---- --- --- --- --- --- --- --- --- --- --- --- --- --- -----
Class: 01 T-SHIRTS
106000 POCKET T-SHIRT 36 32 4 0 5 6 10 13 3 19 16 10 33 14 133
107000 DECAL T-SHIRT 30 24 1 0 2 8 3 10 0 5 11 7 13 7 67
---- ---- ---- ---- ---- ---- ---- ---- ---- ---- ---- ---- ---- ---- ----
TOTAL Class: 66 56 5 0 7 14 13 23 3 24 27 17 46 21 200
Class: 10 MEN'S SHORT SLEEVE SHIRTS
101000 SHORT SLEEVE DRESS SHIR 21 31 4 0 3 7 2 15 3 27 23 12 10 7 113
102000 POLO SHIRT 32 40 1 2 1 4 1 11 5 27 18 14 17 7 108
---- ---- ---- ---- ---- ---- ---- ---- ---- ---- ---- ---- ---- ---- ----
TOTAL Class: 53 71 5 2 4 11 3 26 8 54 41 26 27 14 221
TOTAL Department 148 151 14 2 12 29 19 64 17 98 85 58 81 41 520
Location: 01 MERCHANTECHNOLOGIES
Department: 10 SHIRTS
- - - - - - - - - - - - S A L E S U N I T S - - - - - - - - - - - - - - -
Item Item On On 96 96 96 96 96 96 96 96 96 97 97 97
Code Description Hand Ord Apr May Jun Jul Aug Sep Oct Nov Dec Jan Feb Mar Total
---- ----------- ---- --- --- --- --- --- --- --- --- --- --- --- --- --- -----
101000 SHORT SLEEVE DRESS SHIR 20 31 4 0 3 7 2 15 3 27 23 12 10 5 111
102000 POLO SHIRT 31 40 1 2 1 4 1 11 5 27 18 14 17 3 104
106000 POCKET T-SHIRT 27 75 4 0 5 6 10 13 3 19 16 10 33 2 121
107000 DECAL T-SHIRT 22 32 1 0 2 8 3 10 0 5 11 7 13 1 61
109000 OXFORD BUTTON DOWN SHIR 33 60 4 0 1 4 3 15 6 20 17 15 8 6 99
109999 MISC. SHIRTS 0 0 0 0 0 0 0 0 0 0 0 0 0 0 0
TOTAL Department 133 238 14 2 12 29 19 64 17 98 85 58 81 17 496
Location: 01 MERCHANTECHNOLOGIES
Vendor: CARIBO CARIBOU
- - - - - - - - - - - - S A L E S U N I T S - - - - - - - - - - - - - - -
Item Item On On 96 96 96 96 96 96 96 96 96 97 97 97
Code Description Hand Ord Apr May Jun Jul Aug Sep Oct Nov Dec Jan Feb Mar Total
---- ----------- ---- --- --- --- --- --- --- --- --- --- --- --- --- --- -----
GPT4001 MENS GOLF PANTS 13 38 0 0 0 0 0 2 0 7 3 1 0 1 14
GPT6001 LADIES GOLF PANTS 0 36 0 0 0 0 0 0 0 0 0 0 0 0 0
RSH1001 RUNNING SHORTS 53 0 2 0 3 6 10 11 4 32 25 13 13 4 123
TS4100 MENS TENNIS SHORTS 14 27 0 0 0 0 0 0 0 0 0 0 0 1 1
TS4200 LADIES TENNIS SHORTS 16 0 0 0 0 0 0 0 0 0 0 0 0 1 1
WJ4310 WARMUP JACKET 10 39 0 0 0 0 0 0 0 0 0 0 0 5 5
WP4300 WARMUP PANTS 12 0 0 0 0 0 0 0 0 0 0 0 0 2 2
TOTAL Vendor: 118 139 5 2 4 9 11 20 5 53 31 21 13 15 189
Vendor: NIKE NIKE SHOES
- - - - - - - - - - - - S A L E S U N I T S - - - - - - - - - - - - - - -
Item Item On On 96 96 96 96 96 96 96 96 96 97 97 97
Code Description Hand Ord Apr May Jun Jul Aug Sep Oct Nov Dec Jan Feb Mar Total
---- ----------- ---- --- --- --- --- --- --- --- --- --- --- --- --- --- -----
Department: 20 SPORTING GOODS EQUIPMENT
BL-BBS4001 AIR BASEBALL SPIKES 23 0 2 1 5 2 5 7 4 7 1 3 5 4 46
BL-FBS4001 AIR FOOTBALL SHOES 9 0 0 0 0 0 0 0 0 0 0 0 0 0 0
WH-BBS4001 AIR BASEBALL SPIKES 21 45 1 3 1 3 7 6 0 12 11 6 11 16 77
WH-FBS4001 AIR FOOTBALL SHOES 7 0 0 0 0 0 0 0 0 0 0 0 0 0 0
TOTAL Department 60 45 3 4 6 5 12 13 4 19 12 9 16 20 123
Department: 25 SPORTS APPAREL
TW455 TIGER WOODS GOLF SHIRT 46 0 0 0 0 0 0 0 0 0 0 0 0 0 0
TW665 TIGER WOODS WIND BREAKE 28 0 0 0 0 0 0 0 0 0 0 0 0 0 0
TOTAL Department 74 0 0 0 0 0 0 0 0 0 0 0 0 0 0
TOTAL Vendor: 134 45 3 4 6 5 12 13 4 19 12 9 16 20 123
TOTAL Location: 134 45 3 4 6 5 12 13 4 19 12 9 16 20 123
*** End of Report ***
Run Date 5/15/03 C O M P A R A T I V E S A L E S R E P O R T Page 1
Run Time 5:32 PM Merchant Technologies User JW
[SELECT OPTIONS] Sort (1-6) +A=Alpha Sort: 3A <1>=Dep/Cls/Item <2>=Vend/Ref <3>=Dep/Item <4>=Ven/Dep/Ref <5>=Manuf <6>=Cat
Region Code: ALL
Location Code: 01
Vendor Code: ALL
Manuf Code: ALL
Department Code: 65
Class Code: ALL
Category Code: ALL
Item Code: ALL
Sales Period 1 (mmyy): 4/03 to 5/03
Sales Period 2 (mmyy): 4/02 to 5/02
Item Detail (1/2/3)? 2 <1>=Totals Only, <2>=Item Detail, <3>=Sub-Item Detail
Location Format (1/2/3)? 3 <1>=Separate Report by Location, <2>=Location Comparison, <3>=Consolidated
Stocked Items (1/2/3)? 1 <1>=All Items, <2>=Stocked Items Only, <3>=Non-Stocked Items Only
Print Deleted Items (Y/N)? Y <Y>=Prints % of Sales, <N>=% of Sales Suppressed
Active Items Only (Y/N)? N
Page Breaks (Y/N)? N <N>=No Page Break on Dept, Vendor, Manuf or Category (Depending on Sort)
Category # (1/2/3/4/5)? 1 Enter Cagetory Number from Inventory Maintenance to Sort on
Print Vendor Ref (Y/N)? N <Y>=Prints Vendor Reference Number, <N>=Prints item code
----- 4/03 to 5/03 ----- ----- 4/02 to 5/02 -----
Item Item On On Sales Sales % of Mrg Sales Sales % of Mrg
Code Description Hand Ord Units $ Sales % Units $ Sales %
---- ----------- ---- --- ----- ----- ----- --- ----- ----- ----- ---
Department: 65 BOOKS
Class: 01 FICTION - CLASSIC
000619 A CHRISTMAS CAROL 28 0 10 69 49% 12 83 49%
000629 A FAREWELL TO ARMS 13 7 9 62 49% 8 55 49%
000491 A TALE OF TWO CITIES 21 6 11 82 49% 16 111 45%
000622 DUBLINERS 12 0 14 97 49% 9 62 49%
000632 FINNEGAN'S WAKE 15 4 6 41 49% 3 20 49%
000623 FOR WHOM THE BELL TOLLS 16 5 5 34 49% 8 55 49%
000492 GREAT EXPECTATIONS 10 6 16 111 49% 11 76 49%
000490 OLIVER TWIST 22 8 7 48 49% 14 97 49%
000620 PICKWICK PAPERS 16 6 4 27 49% 20 139 45%
000621 POTRAIT OF THE ARTIST AS A.. 7 6 21 145 49% 10 69 44%
000625 TENDER IS THE NIGHT 33 7 6 41 49% 6 41 49%
000627 THE GREAT GATSBY 3 0 14 97 49% 7 48 49%
000626 THE OLD MAN AND THE SEA 9 0 31 215 49% 23 159 49%
000624 THE SUN ALSO RISES 18 0 12 83 49% 5 34 49%
000628 ULYSSEYS 16 8 6 41 49% 9 62 45%
---- ---- ---- ------- -- -- ----- ------- -- --
TOTAL Class: 239 63 172 1193 31% 49% 161 1111 36% 48%
TOTAL Department: 239 63 172 1193 13% 49% 161 1111 15% 48%
TOTAL Company: 239 63 172 1193 49% 161 1111 48%
Location: 01 MT V9.1 TEST - LINUX
Item Item Wks Whse --Qty On-- Units Unit Disc ----- Extend ----- Prof
Code Description Rcv QOH Hand Ord Sold Price Pct Price Cost Marg
---- ----------- --- ---- ---- --- ----- ----- ---- ----- ---- ----
Department: 22 MEN'S SHIRTS
Vendor: ARRSH ARROW SHIRTS
0006920000 ARROW DOVER L/S DRESS SHIRT 3 19 2- 0 2 30.99 61.98 30.00 51.6%
0007850000 ARROW PINPOINT L/S DRESS SHIRT 2 23 1- 0 1 32.99 32.99 16.00 51.5%
----- ---- --------- -------- ----
TOTAL Vendor: 3 0.0% 94.97 46.00 51.5%
Vendor: GBEANE GEOFFREY BEANE
0008090000 G BEANE HERRINGBONE DRESS SHRT 4 16 1- 0 1 34.99 34.99 16.50 52.8%
----- ---- --------- -------- ----
TOTAL Vendor: 1 0.0% 34.99 16.50 52.8%
Vendor: IZOD IZOD
0006730000 SOLID PIQUE POLO 2 65 65 0 70 28.95 2026.50 980.00 51.6%
0007320000 NAILHEAD JACQUARD POLO 1 52 52 0 66 31.95 .7% 2092.72 990.00 52.6%
----- ---- --------- -------- ----
TOTAL Vendor: 136 0.3% 4119.22 1970.00 52.1%
----- ---- --------- -------- ----
TOTAL Department: 140 0.3% 4249.18 2032.50 52.1%
----- ---- --------- -------- ----
TOTAL Location: 140 0.3% 4249.18 2032.50 52.1%
===== ==== ========= ======== ====
TOTAL Report: 140 0.3% 4249.18 2032.50 52.1%
*** End of Report ***
�E

Section 1, Sales Report Generator Merchant Technologies (800) 395-8324
Page 1.7
• Totals Only -
This option produces a Summary Report, providing Totals for
Departments, Classes or Vendors, depending on the Sort Option
selected.
• Item Detail -
Produces a Detail Report listing Items, or Styles. In Size and
Color applications, this is a consolidation of the data for all Sizes
and Colors of a Style.
• Sub-Item Detail -
Produces a Report in which the individual Sub-Items, or Size
and Color combinations, are listed.
Sales Report Generator - Item Detail
Location: 01 MERCHANTECHNOLOGIES
Department: 10 SHIRTS
- - - - - - - - - - - - S A L E S U N I T S - - - - - - - - - - - - - - -
Item Item On On 96 96 96 96 96 96 96 96 96 97 97 97
Code Description Hand Ord Apr May Jun Jul Aug Sep Oct Nov Dec Jan Feb Mar Total
---- ----------- ---- --- --- --- --- --- --- --- --- --- --- --- --- --- -----
101000 SHORT SLEEVE DRESS SHIR 20 31 4 0 3 7 2 15 3 27 23 12 10 5 111
102000 POLO SHIRT 31 40 1 2 1 4 1 11 5 27 18 14 17 3 104
106000 POCKET T-SHIRT 27 75 4 0 5 6 10 13 3 19 16 10 33 2 121
107000 DECAL T-SHIRT 22 32 1 0 2 8 3 10 0 5 11 7 13 1 61
109000 OXFORD BUTTON DOWN SHIR 33 60 4 0 1 4 3 15 6 20 17 15 8 6 99
109999 MISC. SHIRTS 0 0 0 0 0 0 0 0 0 0 0 0 0 0 0
TOTAL Department 133 238 14 2 12 29 19 64 17 98 85 58 81 17 496
This version is a Totals Only report using the Department / Class /
Item Sort option. - Qty On - Units Unit Gross Disc Net Cost Prof
Hand Ord Sold Price Price Pct Price $ Marg
---- --- ---- ----- ----- --- ----- ---- ----
Department: 10 SHIRTS
01 T-SHIRTS 17 367.83 0.0% 367.83 209.25 43.1%
05 MEN'S LONG SLEEVE SHIRTS 15 480.00 2.9% 466.10 240.00 48.5%
10 MEN'S SHORT SLEEVE SHIRTS 26 888.00 4.5% 847.78 444.00 47.6%
----- --------- ---- --------- -------- ----
TOTAL Department: 58 1735.83 3.1% 1681.71 893.25 46.8%
Department: 25 SPORTS APPAREL
01 RUNNING APPAREL 20 628.80 6.5% 587.73 304.00 48.2%
02 GOLF APPAREL 16 695.92 8.1% 639.17 335.00 47.5%
----- --------- ---- --------- -------- ----
TOTAL Department: 36 1324.72 7.3% 1226.90 639.00 47.9%
----- --------- ---- --------- -------- ----
TOTAL Location: 116 3952.55 3.8% 3800.61 1943.25 48.8%
*** End of Report ***
This sample is a Totals Only report using the Vendor / Vendor
Ref. Sort option. On Sales Sales % of Mrg Sales Sales % of Mrg
Hand Units $ Sales % Units $ Sales %
---- ----- ----- ----- --- ----- ----- ----- ---
ALL ALL FASHIONS 221 53 1240 5% 45% 36 758 6% 43%
BEVERL BEVERLY HILLS POLO CLUB 432 146 5348 21% 49% 39 1599 12% 49%
CARIBO CARIBOU 380 95 2683 10% 48% 78 1827 14% 48%
DOLFIN DOLFIN APPAREL 238 91 2810 11% 48% 29 867 7% 46%
GAMES GAMES UNLIMITED 66 35 1194 5% 52% 40 1338 10% 51%
JUDY JUDY BOND 0 0 0 0% 0% 0 0 0% 0%
LAND LAND AND SEA 173 100 3465 14% 48% 67 2197 17% 45%
NIKE NIKE SHOES 349 82 3768 15% 52% 64 2822 22% 50%
NOTATI NOTATIONS 241 141 2728 11% 37% 23 423 3% 45%
PRETTY PRETTY MISS 0 0 0 0% 0% 0 0 0% 0%
PUZZLE ALWAYS PUZZLED 26 9 316 1% 51% 11 356 3% 47%
WILSON WILSON SPORTING GOODS 133 49 2066 8% 50% 20 849 7% 50%
---- ---- ------- -- -- ----- ------- -- --
TOTAL Company: 2259 801 25622 48% 407 13040 48%
*** End of Report ***
----- 02/97 to 02/97 ----- ----- 02/96 to 02/96 -----
Item Vendor Item On Sales Sales % of Mrg Sales Sales % of Mrg
Code Reference Description Hand Units $ Sales % Units $ Sales %
---- --------- ----------- ---- ----- ----- ----- --- ----- ----- ----- ---
Class: 10 MEN'S SHORT SLEEVE SHIRTS
SHORT SLEEVE DRESS SHIRT
1010000001 SSD1010 <WHITE 14 - > 15 2 57 44% 0 0 0%
1010000002 SSD1010 <WHITE 14.5 - > 12 2 57 44% 1 32 50%
1010000003 SSD1010 <WHITE 15 - > 19 2 57 44% 1 32 50%
1010000004 SSD1010 <WHITE 15.5 - > 16 2 57 44% 1 32 50%
1010000005 SSD1010 <WHITE 16 - > 20 2 57 44% 1 32 50%
---- ---- ------- -- -- ----- ------- -- --
82 10 288 % 44% 4 128 % 50%
POLO SHIRT
1020000001 SSG10201 <YELLOW S - > 14 6 194 44% 0 0 0%
1020000002 SSG10201 <YELLOW M - > 17 5 162 44% 4 144 50%
1020000003 SSG10201 <YELLOW L - > 17 3 97 44% 1 36 50%
1020000004 SSG10201 <YELLOW XL - > 17 3 97 44% 5 180 50%
---- ---- ------- -- -- ----- ------- -- --
65 17 550 % 44% 10 360 % 50%
---- ---- ------- -- -- ----- ------- -- --
TOTAL Class: 147 27 838 43% 44% 14 488 73% 50%
TOTAL Department: 147 27 838 26% 44% 14 488 31% 50%
TOTAL Location: 147 27 838 44% 14 488 50%
*** End of Report ***
This sample is an Item
Detail report using the
Department / Item Sort
option.
This output is a Sub-Item
Detail report using the
Department / Class / Item
Sort option.
Section 1, Sales Report Generator Merchant Technologies (800) 395-8324
Page 1.8
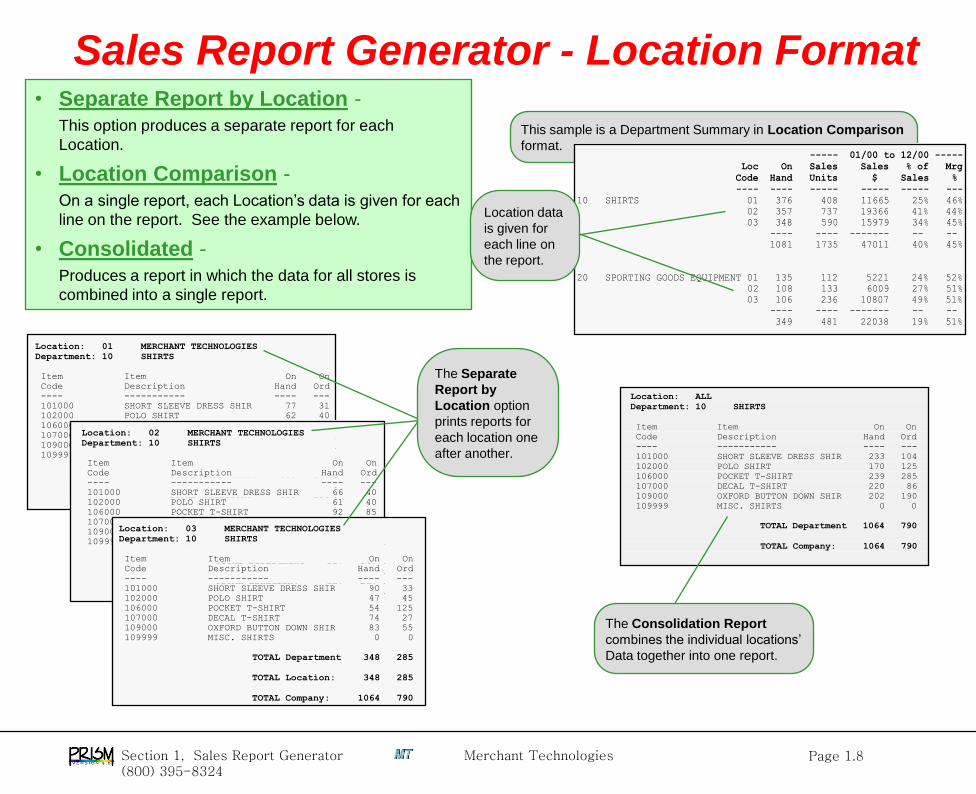
Sales Report Generator - Location Format• Separate Report by Location -
This option produces a separate report for each
Location.
• Location Comparison -
On a single report, each Location’s data is given for each
line on the report. See the example below.
• Consolidated -
Produces a report in which the data for all stores is
combined into a single report.
This sample is a Department Summary in Location Comparison
format.
Location: 01 MERCHANT TECHNOLOGIES
Department: 10 SHIRTS
- - - - - - - - - - - - S A L E S U N I T S - - - - - - - - - - - - - - -
Item Item On On 96 96 96 96 96 96 96 96 97 97 97 97
Code Description Hand Ord May Jun Jul Aug Sep Oct Nov Dec Jan Feb Mar Apr Total
---- ----------- ---- --- --- --- --- --- --- --- --- --- --- --- --- --- -----
101000 SHORT SLEEVE DRESS SHIR 77 31 0 3 7 2 15 3 27 23 12 10 5 0 107
102000 POLO SHIRT 62 40 2 1 4 1 11 5 27 18 14 17 3 0 103
106000 POCKET T-SHIRT 93 75 0 5 6 10 13 3 19 16 10 33 2 0 117
107000 DECAL T-SHIRT 70 32 0 2 8 3 10 0 5 11 7 13 1 0 60
109000 OXFORD BUTTON DOWN SHIR 57 60 0 1 4 3 15 6 20 17 15 8 6 0 95
109999 MISC. SHIRTS 0 0 0 0 0 0 0 0 0 0 0 0 0 0 0
TOTAL Department 359 238 2 12 29 19 64 17 98 85 58 81 17 0 482
TOTAL Location: 359 238 2 12 29 19 64 17 98 85 58 81 17 0 482
Location: 02 MERCHANT TECHNOLOGIES
Department: 10 SHIRTS
- - - - - - - - - - - - S A L E S U N I T S - - - - - - - - - - - - - - -
Item Item On On 96 96 96 96 96 96 96 96 97 97 97 97
Code Description Hand Ord May Jun Jul Aug Sep Oct Nov Dec Jan Feb Mar Apr Total
---- ----------- ---- --- --- --- --- --- --- --- --- --- --- --- --- --- -----
101000 SHORT SLEEVE DRESS SHIR 66 40 15 41 8 7 26 17 22 17 21 17 0 0 191
102000 POLO SHIRT 61 40 0 10 20 0 0 10 37 23 17 4 0 0 121
106000 POCKET T-SHIRT 92 85 0 46 55 8 22 16 49 30 15 0 0 0 241
107000 DECAL T-SHIRT 76 27 0 4 0 13 9 8 9 23 12 0 0 0 78
109000 OXFORD BUTTON DOWN SHIR 62 75 0 37 8 16 18 7 17 12 15 26 0 0 156
109999 MISC. SHIRTS 0 0 0 0 0 0 0 0 0 0 0 0 0 0 0
TOTAL Department 357 267 15 138 91 44 75 58 134 105 80 47 0 0 787
TOTAL Location: 357 267 15 138 91 44 75 58 134 105 80 47 0 0 787
Location: 03 MERCHANT TECHNOLOGIES
Department: 10 SHIRTS
- - - - - - - - - - - - S A L E S U N I T S - - - - - - - - - - - - - - -
Item Item On On 96 96 96 96 96 96 96 96 97 97 97 97
Code Description Hand Ord May Jun Jul Aug Sep Oct Nov Dec Jan Feb Mar Apr Total
---- ----------- ---- --- --- --- --- --- --- --- --- --- --- --- --- --- -----
101000 SHORT SLEEVE DRESS SHIR 90 33 0 0 6 0 11 0 7 21 16 15 0 0 76
102000 POLO SHIRT 47 45 8 42 12 7 20 0 21 20 30 18 0 0 178
106000 POCKET T-SHIRT 54 125 14 18 15 35 15 10 8 29 64 19 0 0 227
107000 DECAL T-SHIRT 74 27 0 20 9 8 0 6 5 18 12 9 0 0 87
109000 OXFORD BUTTON DOWN SHIR 83 55 0 3 6 0 0 14 3 16 17 13 0 0 72
109999 MISC. SHIRTS 0 0 0 0 0 0 0 0 0 0 0 0 0 0 0
TOTAL Department 348 285 22 83 48 50 46 30 44 104 139 74 0 0 640
TOTAL Location: 348 285 22 83 48 50 46 30 44 104 139 74 0 0 640
TOTAL Company: 1064 790 39 233 168 113 185 105 276 294 277 202 17 0 1909
Location: ALL
Department: 10 SHIRTS
- - - - - - - - - - - - S A L E S U N I T S - - - - - - - - - - - - - - -
Item Item On On 96 96 96 96 96 96 96 96 97 97 97 97
Code Description Hand Ord May Jun Jul Aug Sep Oct Nov Dec Jan Feb Mar Apr Total
---- ----------- ---- --- --- --- --- --- --- --- --- --- --- --- --- --- -----
101000 SHORT SLEEVE DRESS SHIR 233 104 15 44 21 9 52 20 56 61 49 42 5 0 374
102000 POLO SHIRT 170 125 10 53 36 8 31 15 85 61 61 39 3 0 402
106000 POCKET T-SHIRT 239 285 14 69 76 53 50 29 76 75 89 52 2 0 585
107000 DECAL T-SHIRT 220 86 0 26 17 24 19 14 19 52 31 22 1 0 225
109000 OXFORD BUTTON DOWN SHIR 202 190 0 41 18 19 33 27 40 45 47 47 6 0 323
109999 MISC. SHIRTS 0 0 0 0 0 0 0 0 0 0 0 0 0 0 0
TOTAL Department 1064 790 39 233 168 113 185 105 276 294 277 202 17 0 1909
TOTAL Company: 1064 790 39 233 168 113 185 105 276 294 277 202 17 0 1909
The Separate
Report by
Location option
prints reports for
each location one
after another.
The Consolidation Report
combines the individual locations’
Data together into one report.
Run Date 6/20/97 S A L E S A N A L Y S I S R E P O R T Page 1
Run Time 2:08 PM MerchanTechnologies
[SELECT OPTIONS] Sort Order (1/2/3/4)? 3 <1>=Dept/Class/Item, <2>=Vend/Ref, <3>=Dept/Item <4>=Vend/Dept/Ref
Region Code: ALL
Location Code: ALL
Vendor Code: ALL
Department Code: ALL
Class Code: ALL
Category Code: ALL
Item Code: ALL
Sales Period 1 (mmyy): 01/96 to 12/96
Sales Period 2 (mmyy): 01/95 to 12/95
Item Detail (1/2/3)? 1 <1>=Totals Only, <2>=Item Detail, <3>=Sub-Item Detail
Location Format (1/2/3)? 2 <1>=Separate Report by Location, <2>=Location Comparison, <3>=Consolidated
Print Deleted Items (Y/N)? Y <Y>=Prints % of Sales, <N>=% of Sales Suppressed
Active Items Only (Y/N)? N
----- 01/00 to 12/00 ----- ----- 01/95 to 12/95 -----
Loc On Sales Sales % of Mrg Sales Sales % of Mrg
Code Hand Units $ Sales % Units $ Sales %
---- ---- ----- ----- ----- --- ----- ----- ----- ---
10 SHIRTS 01 376 408 11665 25% 46% 270 7751 27% 49%
02 357 737 19366 41% 44% 402 10549 37% 46%
03 348 590 15979 34% 45% 406 10579 37% 46%
---- ---- ------- -- -- ----- ------- -- --
1081 1735 47011 40% 45% 1078 28880 42% 47%
20 SPORTING GOODS EQUIPMENT 01 135 112 5221 24% 52% 57 2694 36% 54%
02 108 133 6009 27% 51% 63 2824 37% 50%
03 106 236 10807 49% 51% 45 2068 27% 52%
---- ---- ------- -- -- ----- ------- -- --
349 481 22038 19% 51% 165 7588 11% 52%
25 SPORTS APPAREL 01 245 312 11544 31% 51% 128 4692 20% 51%
02 237 374 12263 33% 49% 258 9990 43% 51%
03 255 405 13594 36% 49% 249 8731 37% 49%
---- ---- ------- -- -- ----- ------- -- --
737 1091 37402 32% 50% 635 23414 34% 50%
81 TOYS 01 30 154 5309 44% 52% 142 4964 51% 53%
02 33 80 2635 22% 50% 85 2731 28% 49%
03 29 118 4002 34% 51% 58 1966 20% 51%
---- ---- ------- -- -- ----- ------- -- --
92 352 11947 10% 51% 285 9662 14% 51%
TOTAL Company: 2259 3659 118400 48% 2163 69545 49%
*** End of Report ***
Location data
is given for
each line on
the report.

Section 1, Sales Report Generator Merchant Technologies (800) 395-8324
Page 1.9
This version of the Sales Comparative Report compares
the 1st Quarter of 2000 to the 1st Quarter of 1997.
Date Ranges• All of the reports in the Sales Report Generator can be
printed for a specified Date Range.
• You can select any Date Range from a 4 Year Period,
Current Year plus 3 Years of Historical Data.
• A User specified Date Range allows reports to be
printed for a particular Day, Month, Quarter, Season or
Year, or look at Month to Date or Year to Date Sales
Data.
• The Sales Comparative Report allows you to compare 2
Date Ranges.
Sales Report Generator - Date Ranges
Run Date 4/23/97 C O M P A R A T I V E S A L E S R E P O R T Page 1
Run Time 2:55 PM MerchanTechnologies User RIG
[SELECT OPTIONS] Sort Order (1/2/3/4)? 1 <1>=Dept/Class/Item, <2>=Vend/Ref, <3>=Dept/Item <4>=Vend/Dept/Ref
Region Code: ALL
Location Code: 01
Vendor Code: ALL
Department Code: 10
Class Code: ALL
Category Code: ALL
Item Code: ALL
Sales Period 1 (mmyy): 1/00 to 3/00
Sales Period 2 (mmyy): 1/97 to 3/97
Item Detail (1/2/3)? 2 <1>=Totals Only, <2>=Item Detail, <3>=Sub-Item Detail
Location Format (1/2/3)? 1 <1>=Separate Report by Location, <2>=Location Comparison, <3>=Consolidated
Print Deleted Items (Y/N)? Y <Y>=Prints % of Sales, <N>=% of Sales Suppressed
Active Items Only (Y/N)? N
Location: 01 MERCHANT TECHNOLOGIES
Department: 10 SHIRTS
----- 1/00 to 3/00 ----- ----- 1/97 to 3/97 -----
Item Item On Sales Sales % of Mrg Sales Sales % of Mrg
Code Description Hand Units $ Sales % Units $ Sales %
---- ----------- ---- ----- ----- ----- --- ----- ----- ----- ---
Class: 01 T-SHIRTS
106000 POCKET T-SHIRT 93 45 833 35% 40 777 42%
107000 DECAL T-SHIRT 70 21 472 43% 25 587 47%
~10-01 ~CONSOLIDATE = 10-01 0 0 0 0% 0 0 0%
---- ---- ------ -- -- ----- ----- -- --
TOTAL Class: 163 66 1306 32% 38% 65 1364 28% 44%
Class: 05 MEN'S LONG SLEEVE SHIRTS
109000 OXFORD BUTTON DOWN SHIRT 56 29 885 47% 23 716 48%
---- ---- ------ -- -- ----- ------ -- --
TOTAL Class: 56 29 885 21% 47% 23 716 22% 48%
Class: 10 MEN'S SHORT SLEEVE SHIRTS
101000 SHORT SLEEVE DRESS SHIRT 77 27 808 46% 25 776 48%
102000 POLO SHIRT 61 34 1134 46% 36 1266 48%
---- ---- ------ -- -- ----- ------ -- --
TOTAL Class: 138 61 1942 47% 46% 61 2042 50% 48%
Class: 99 MISC. SHIRTS
109999 MISC. SHIRTS 0 0 0 0% 3 77 42%
---- ---- ------ -- -- ----- ------ -- --
TOTAL Class: 0 0 0 0% 0% 3 77 0% 42%
TOTAL Department:357 156 4134 45% 43% 152 4199 38% 47%
TOTAL Location: 357 156 4134 43% 152 4199 47%
*** End of Report ***
Sales Journal Report printed for a particular Day.
Sales Date: 3/24/00 to 3/24/00
Location: 01 MERCHANT TECHNOLOGIES
Item Item - Qty On - Units Unit Gross Disc Net Cost Prof
Code Description Hand Ord Sold Price Price Pct Price $ Marg
---- ----------- ---- --- ---- ----- ----- --- ----- ---- ----
Department: 10 SHIRTS
1010000000 SHORT SLEEVE DRESS SHIRT 20 32 5 32.00 160.00 6.0% 150.40 80.00 46.8%
1020000000 POLO SHIRT 31 40 3 36.00 108.00 1.9% 105.85 54.00 48.9%
1060000000 POCKET T-SHIRT 27 36 2 19.99 39.98 39.98 24.00 39.9%
1070000000 DECAL T-SHIRT 22 32 1 23.99 23.99 23.99 12.75 46.8%
1090000000 OXFORD BUTTON DOWN SHIRT 33 44 6 32.00 192.00 1.6% 188.80 96.00 49.1%
----- -------- ---- --------- -------- ----
TOTAL Department: 17 523.97 2.8% 509.02 266.75 47.6%
----- -------- ---- --------- -------- ----
TOTAL Location: 17 523.97 2.8% 509.02 266.75 47.6%
===== ========= ==== ========= ======== ====
TOTAL Report: 17 523.97 2.8% 509.02 266.75 47.6%
*** End of Report ***
Sales Journal Report printed in Month to Date format.
Sales Date: 3/01/00 to 3/24/00
Location: 01 MERCHANT TECHNOLOGIES
Item Item - Qty On - Units Unit Gross Disc Net Cost Prof
Code Description Hand Ord Sold Price Price Pct Price $ Marg
---- ----------- ---- --- ---- ----- ----- --- ----- ---- ----
Department: 10 SHIRTS
1010000000 SHORT SLEEVE DRESS SHIRT 20 32 90 32.00 2880.00 5.2% 2730.24 1440.00 47.3%
1020000000 POLO SHIRT 31 40 54 36.00 1944.00 2.1% 1903.18 972.00 48.9%
1060000000 POCKET T-SHIRT 27 36 36 19.99 719.64 1.0 712.44 432.00 39.4%
1070000000 DECAL T-SHIRT 22 32 18 23.99 431.82 1.7 424.48 229.50 45.9%
1090000000 OXFORD BUTTON DOWN SHIRT 33 44 92 32.00 2944.00 2.0% 2885.12 1472.00 49.0%
----- --------- ---- --------- -------- ----
TOTAL Department: 290 8919.46 2.8% 8655.46 4545.50 47.5%
----- --------- ---- --------- -------- ----
TOTAL Location: 290 8919.46 2.8% 8655.46 4545.50 47.5%
===== ========= ==== ========= ======== ====
TOTAL Report: 290 8919.46 2.8% 8655.46 4545.50 47.5%
*** End of Report ***
Sales Journal Report printed in Year to Date format.
Sales Date: 01/01/00 to 3/24/00
Location: 01 MERCHANT TECHNOLOGIES
Item Item - Qty On - Units Unit Gross Disc Net Cost Prof
Code Description Hand Ord Sold Price Price Pct Price $ Marg
---- ----------- ---- --- ---- ----- ----- --- ----- ---- ----
Department: 10 SHIRTS
1010000000 SHORT SLEEVE DRESS SHIRT 20 32 315 32.00 10080.00 5.1% 9565.92 5040.00 47.3%
1020000000 POLO SHIRT 31 40 189 36.00 6804.00 2.5% 6633.90 3402.00 48.7%
1060000000 POCKET T-SHIRT 27 36 126 19.99 2518.74 1.2% 2488.52 1512.00 39.2%
1070000000 DECAL T-SHIRT 22 32 63 23.99 1511.37 1.7% 1485.68 803.75 45.9%
1090000000 OXFORD BUTTON DOWN SHIRT 33 44 378 32.00 12096.00 2.1% 11841.98 6048.00 48.9%
----- --------- ---- --------- -------- ----
TOTAL Department: 1071 33010.11 3.0% 32016.00 16805.25 47.5%
----- --------- ---- --------- -------- ----
TOTAL Location: 1071 33010.11 3.0% 32016.00 16805.25 47.5%
===== ========= ==== ========= ======== ====
TOTAL Report: 1071 33010.11 3.0% 32016.00 16805.25 47.5%
*** End of Report ***

Section 1, Sales Report Generator Merchant Technologies (800) 395-8324
Page 1.10
Run Date 4/29/03 C O M P A R A T I V E S A L E S R E P O R T Page 1
Run Time 4:01 Merchant Technologies User JW
[SELECT OPTIONS] Sort (1-6) +A=Alpha Sort: 2 <1>=Dep/Cls/Item <2>=Vend/Ref <3>=Dep/Item <4>=Ven/Dep/Ref <5>=Manuf <6>=Cat
Region Code: ALL
Location Code: 01
Vendor Code: ALL
Manuf Code: ALL
Department Code: ALL
Class Code: ALL
Category Code: ALL
Item Code: ALL
Sales Period 1 (mmyy): 1/03 to 4/03
Sales Period 2 (mmyy): 1/02 to 4/02
Item Detail (1/2/3)? 1 <1>=Totals Only, <2>=Item Detail, <3>=Sub-Item Detail
Location Format (1/2/3)? 1 <1>=Separate Report by Location, <2>=Location Comparison, <3>=Consolidated
Stocked Items (1/2/3)? 1 <1>=All Items, <2>=Stocked Items Only, <3>=Non-Stocked Items Only
Print Deleted Items (Y/N)? Y <Y>=Prints % of Sales, <N>=% of Sales Suppressed
Print Vendor Ref (Y/N)? Y <Y>=Prints Vendor Reference Number, <N>=Prints item code
Location: 01 Merchant Technologies
----- 1/03 to 4/03 ----- ----- 1/02 to 4/02 -----
On On Sales Sales % of Mrg Sales Sales % of Mrg
Hand Ord Units $ Sales % Units $ Sales %
---- --- ----- ----- ----- --- ----- ----- ----- ---
ALLF ALL FASHIONS 71 32 163 4564 4% 50% 154 4186 4% 48%
ANTIGU ANTIGUA SPORTSWEAR 88 42 207 8073 8% 52% 202 7642 8% 53%
BEVERL BEVERLY HILLS POLO CLUB 65 24 172 5160 5% 47% 154 4481 5% 47%
CARIBO CARIBOU 51 36 157 4553 4% 45% 146 4107 4% 46%
DKNY DONNA KARAN 87 40 209 9614 9% 54% 206 9192 10% 53%
DOLFIN DOLFIN APPAREL 76 0 136 2992 3% 50% 124 2646 3% 50%
JANTZ JANTZEN 91 46 251 9287 9% 53% 232 8326 9% 52%
JUDY JUDY BOND 48 36 147 3528 3% 51% 154 3585 4% 51%
LAND LAND AND SEA 99 55 265 9540 9% 51% 247 8625 9% 49%
LEVIS LEVI STRAUSS 136 52 297 12177 12% 50% 281 11175 12% 48%
NIKE NIKE 53 16 146 3796 4% 51% 149 3758 4% 52%
NOTAT NOTATIONS 29 21 72 1440 1% 46% 58 1125 1% 48%
PRETTY PRETTY MISS 43 15 89 2403 2% 41% 90 2357 2% 44%
LAUREN RALPH LAUREN 72 32 177 9735 10% 52% 162 8643 9% 52%
RTW READY TO WEAR 55 38 132 4356 4% 47% 138 4417 5% 48%
SANTA SANTA FE APPAREL 40 12 81 3402 3% 55% 76 3096 3% 53%
STERL STERLING SPORTSWEAR 36 0 38 950 1% 40% 52 1261 1% 48%
TREND TREND INT’L USA 55 32 125 3500 3% 44% 118 3205 3% 46%
UMBRA UMBRA 51 22 99 3267 3% 49% 94 3009 3% 49%
---- ---- ---- ------- -- -- ----- ------- -- --
TOTAL Location: 1246 551 2963 102337 51% 1279 789367 49%
Comparative Sales ReportObjective:
Print Sales Totals by
Vendor.
Compare the first four
months of 2003 to the
first four months of 2002.
Include Sales Data for
Units, Dollars, Margin
and Percent of Sales.
Report information for
Location 01 only.
1
2
3
4
1
23
4
Percent of Sales gives each
Vendor’s share of the Total
Company’s Sales.
3

Section 1, Sales Report Generator Merchant Technologies (800) 395-8324
Page 1.11
Run Date 5/12/03 C O M P A R A T I V E S A L E S R E P O R T Page 1
Run Time 11:53 AM Merchant Technologies User JW
[SELECT OPTIONS] Sort (1-6) +A=Alpha Sort: 1 <1>=Dep/Cls/Item <2>=Vend/Ref <3>=Dep/Item <4>=Ven/Dep/Ref <5>=Manuf <6>=Cat
Region Code: ALL
Location Code: ALL
Vendor Code: ALL
Manuf Code: ALL
Department Code: 22
Class Code: 01
Category Code: ALL
Item Code: ALL
Sales Period 1 (mmyy): 5/03 to 5/03
Sales Period 2 (mmyy): 5/02 to 5/02
Item Detail (1/2/3)? 3 <1>=Totals Only, <2>=Item Detail, <3>=Sub-Item Detail
Location Format (1/2/3)? 1 <1>=Separate Report by Location, <2>=Location Comparison, <3>=Consolidated
Stocked Items (1/2/3)? 1 <1>=All Items, <2>=Stocked Items Only, <3>=Non-Stocked Items Only
Print Deleted Items (Y/N)? N <Y>=Prints % of Sales, <N>=% of Sales Suppressed
Active Items Only (Y/N)? N
Print Vendor Ref (Y/N)? Y <Y>=Prints Vendor Reference Number, <N>=Prints item code
Location: 01 Merchant Technologies
----- 5/03 to 5/03 ----- ----- 5/02 to 5/02 -----
Item Item On On Sales Sales % of Mrg Sales Sales % of Mrg
Code Description Hand Ord Units $ Sales % Units $ Sales %
---- ----------- ---- --- ----- ----- ----- --- ----- ----- ----- ---
Department: 22 MEN'S SHIRTS
Class: 01 SHORT SLEEVED SHIRTS
SOLID PIQUE POLO SHIRT
IP 205 <RED SMALL > 7 0 9 260 51% 7 203 51%
IP 205 <RED MEDIUM > 5 2 11 318 51% 12 347 51%
IP 205 <RED LARGE > 9 4 16 463 51% 12 347 51%
IP 205 <RED XL > 4 3 13 376 51% 11 318 51%
IP 205 <RED XXL > 6 1 7 202 51% 8 232 51%
---- ---- ---- ------- -- -- ----- ------- -- --
31 10 56 1621 56% 51% 50 1447 58% 51%
NAILHEAD JACQUARD POLO
IP 208 <DK BLU SMALL > 3 3 6 191 53% 3 93 52%
IP 208 <DK BLU MEDIUM > 7 0 10 319 53% 6 186 52%
IP 208 <DK BLU LARGE > 6 0 9 287 53% 11 340 52%
IP 208 <DK BLU XL > 5 1 13 415 53% 9 279 52%
IP 208 <DK BLU XXL > 5 1 5 159 53% 7 217 52%
---- ---- ---- ------- -- -- ----- ------- -- --
26 5 43 1373 42% 53% 36 1114 42% 52%
---- ---- ---- ------- -- -- ----- ------- -- --
TOTAL Class: 57 15 99 2995 32% 52% 86 2561 28% 51%
TOTAL Department: 57 15 99 2995 16% 52% 86 2561 18% 51%
TOTAL Location: 57 15 99 2995 52% 86 2561 51%
Comparative Sales ReportObjective:
Print Sales Information for
Department 22, Class 01 at
Location 01.
Print Sub-Item Detail (Size
and Color Combination)
View data for May of 2003
and 2002.
1
2
3
1
1
2
3
2

Section 1, Sales Report Generator Merchant Technologies (800) 395-8324
Page 1.12
Run Date 5/14/03 C O M P A R A T I V E S A L E S R E P O R T Page 1
Run Time 4:51 PM Merchant Technologies User JW
[SELECT OPTIONS] Sort (1-6) +A=Alpha Sort: 3 <1>=Dep/Cls/Item <2>=Vend/Ref <3>=Dep/Item <4>=Ven/Dep/Ref <5>=Manuf <6>=Cat
Region Code: ALL
Location Code: ALL
Vendor Code: ALL
Manuf Code: ALL
Department Code: ALL
Class Code: ALL
Category Code: ALL
Item Code: ALL
Sales Period 1 (mmyy): 6/02 to 5/03
Sales Period 2 (mmyy): 6/01 to 5/02
Item Detail (1/2/3)? 1 <1>=Totals Only, <2>=Item Detail, <3>=Sub-Item Detail
Location Format (1/2/3)? 2 <1>=Separate Report by Location, <2>=Location Comparison, <3>=Consolidated
Stocked Items (1/2/3)? 1 <1>=All Items, <2>=Stocked Items Only, <3>=Non-Stocked Items Only
Print Deleted Items (Y/N)? Y <Y>=Prints % of Sales, <N>=% of Sales Suppressed
Active Items Only (Y/N)? N
Print Vendor Ref (Y/N)? Y <Y>=Prints Vendor Reference Number, <N>=Prints item code
----- 6/02 to 5/03 ----- ----- 6/01 to 5/02 -----
On On Sales Sales % of Mrg Sales Sales % of Mrg
Hand Ord Units $ Sales % Units $ Sales %
---- --- ----- ----- ----- --- ----- ----- ----- ---
01 JUNIOR SPORTSWEAR 01 1923 342 9230 203069 45% 48% 8953 179070 45% 47%
02 1482 202 6817 143161 32% 46% 6681 126936 32% 46%
03 930 216 4604 101277 23% 47% 4327 90873 23% 46%
---- ---- ---- ------- -- -- ----- ------- -- --
4335 760 20651 447507 26% 47% 19962 396879 25% 47%
02 MISSY SPORTSWEAR 01 1766 197 8477 211920 49% 47% 8222 197340 50% 48%
02 1174 144 5400 124209 29% 47% 5292 116433 29% 46%
03 822 102 4069 97654 23% 48% 3825 84145 21% 47%
---- ---- ---- ------- -- -- ----- ------- -- --
3762 443 17946 433783 25% 47% 17340 397917 25% 47%
03 WOMENS SPORTSWEAR 01 2101 447 10085 332798 48% 49% 9782 313032 48% 48%
02 1495 321 6877 206310 30% 49% 6739 202184 31% 49%
03 1011 265 5004 155138 22% 50% 4704 141125 22% 49%
---- ---- ---- ------- -- -- ----- ------- -- --
4607 1033 21966 694246 41% 49% 21226 656341 42% 48%
04 OUTERWEAR 01 321 87 1541 66254 53% 50% 1495 61278 52% 48%
02 209 62 961 39417 31% 49% 942 37687 32% 49%
03 98 48 485 20374 16% 48% 456 18696 16% 47%
---- ---- ---- ------- -- -- ----- ------- -- --
628 197 2987 126046 7% 49% 2893 117660 8% 48%
TOTAL Company: 13332 2433 63551 1701582 48% 61420 1568798 47%
Comparative Sales ReportObjective:
Print a Department Summary
of Sales Information.
Compare Sales for the
periods 6/02 to 5/03 and 6/01
to 5/02.
Print data for all Locations
separately, but on one
report.
1
2
3
1
2
3
Location Comparison format displays each Location’s sales
data in one spot, instead of on separate pages of the report.
3
Date Ranges allow the user to
select any date range desired.
You are not limited to Year to
Date, Month to Date, etc.
2

Section 1, Sales Report Generator Merchant Technologies (800) 395-8324
Page 1.13
Run Date 5/15/03 C O M P A R A T I V E S A L E S R E P O R T Page 1
Run Time 5:32 PM Merchant Technologies User JW
[SELECT OPTIONS] Sort (1-6) +A=Alpha Sort: 3A <1>=Dep/Cls/Item <2>=Vend/Ref <3>=Dep/Item <4>=Ven/Dep/Ref <5>=Manuf <6>=Cat
Region Code: ALL
Location Code: 01
Vendor Code: ALL
Manuf Code: ALL
Department Code: 65
Class Code: ALL
Category Code: ALL
Item Code: ALL
Sales Period 1 (mmyy): 4/03 to 5/03
Sales Period 2 (mmyy): 4/02 to 5/02
Item Detail (1/2/3)? 2 <1>=Totals Only, <2>=Item Detail, <3>=Sub-Item Detail
Location Format (1/2/3)? 3 <1>=Separate Report by Location, <2>=Location Comparison, <3>=Consolidated
Stocked Items (1/2/3)? 1 <1>=All Items, <2>=Stocked Items Only, <3>=Non-Stocked Items Only
Print Deleted Items (Y/N)? Y <Y>=Prints % of Sales, <N>=% of Sales Suppressed
Active Items Only (Y/N)? N
Page Breaks (Y/N)? N <N>=No Page Break on Dept, Vendor, Manuf or Category (Depending on Sort)
Category # (1/2/3/4/5)? 1 Enter Cagetory Number from Inventory Maintenance to Sort on
Print Vendor Ref (Y/N)? N <Y>=Prints Vendor Reference Number, <N>=Prints item code
----- 4/03 to 5/03 ----- ----- 4/02 to 5/02 -----
Item Item On On Sales Sales % of Mrg Sales Sales % of Mrg
Code Description Hand Ord Units $ Sales % Units $ Sales %
---- ----------- ---- --- ----- ----- ----- --- ----- ----- ----- ---
Department: 65 BOOKS
Class: 01 FICTION - CLASSIC
000619 A CHRISTMAS CAROL 28 0 10 69 49% 12 83 49%
000629 A FAREWELL TO ARMS 13 7 9 62 49% 8 55 49%
000491 A TALE OF TWO CITIES 21 6 11 82 49% 16 111 45%
000622 DUBLINERS 12 0 14 97 49% 9 62 49%
000632 FINNEGAN'S WAKE 15 4 6 41 49% 3 20 49%
000623 FOR WHOM THE BELL TOLLS 16 5 5 34 49% 8 55 49%
000492 GREAT EXPECTATIONS 10 6 16 111 49% 11 76 49%
000490 OLIVER TWIST 22 8 7 48 49% 14 97 49%
000620 PICKWICK PAPERS 16 6 4 27 49% 20 139 45%
000621 POTRAIT OF THE ARTIST AS A.. 7 6 21 145 49% 10 69 44%
000625 TENDER IS THE NIGHT 33 7 6 41 49% 6 41 49%
000627 THE GREAT GATSBY 3 0 14 97 49% 7 48 49%
000626 THE OLD MAN AND THE SEA 9 0 31 215 49% 23 159 49%
000624 THE SUN ALSO RISES 18 0 12 83 49% 5 34 49%
000628 ULYSSEYS 16 8 6 41 49% 9 62 45%
---- ---- ---- ------- -- -- ----- ------- -- --
TOTAL Class: 239 63 172 1193 31% 49% 161 1111 36% 48%
TOTAL Department: 239 63 172 1193 13% 49% 161 1111 15% 48%
TOTAL Company: 239 63 172 1193 49% 161 1111 48%
Comparative Sales Report
Objective:
Print Sales Data for Items in
Department 65 at Location 01.
Compare Sales for April and May
of 2003 to 2002.
Sort Items Alphabetically.
1
2
3
1
1
2
Items can be sorted
Alphabetically within
a Department, Class,
Vendor and Category
by adding A to the
Sort Method.
3
3
2

Section 1, Sales Report Generator Merchant Technologies (800) 395-8324
Page 1.14
Run Date 5/29/03 S A L E S J O U R N A L Page 1
Run Time 4:42 PM Merchant Technologies User JW
[SELECT OPTIONS] Sort (1-5) +A=Alpha Sort: 2 <1>=Dept <2>=Dept/Class <3>=Vendor <4>=Dept/Vendor <5>=Dept/Class/Vendor
Location Code: 01
Salesman Code: ALL
Vendor Code: ALL
Department Code: ALL
Class Code: ALL
Category Code: ALL
Item Code: ALL
Sales Date: 5/01/03 to 5/31/03
Print Sub-Items (Y/N)? N
Store Consolidation (Y/N)? N
Sales Type (1/2): ALL <1>=Retail POS Sales, <2>=Sales Order Entry (prints '*' if Print Item Detail)
Print Item Detail (Y/N)? N <Y>=Separate line for each Item Sale & prints Date/Time instead of Vendor Ref
Print Profit Margin (Y/N)? Y
Print Totals Only (Y/N)? Y
Misc Items Only (Y/N)? N <Y>=Prints only Items set up for a Price Override at POS
Vendor Ref (Y/N)? N <Y>=Prints Vendor Reference Number, <N>=Prints item code
Cost Type (1/2): 2 <1>=Replacement Cost, <2>=Average Cost
Kit Sales (1/2/3): 1 <1>=Kits not Separate, <2>=Kits Only-Prints Components, <3>=Kits w/o Component
Salesman Type (1/2)? 1 <1>=Include Salesperson, <2>=Exclude Salesperson
Location: 01 Merchant Technologies
Item Item Wks Whse --Qty On-- Units Unit Disc ----- Extend ----- Prof
Code Description Rcv QOH Hand Ord Sold Price Pct Price Cost Marg
---- ----------- --- ---- ---- --- ----- ----- ---- ----- ---- ----
Department: 10 MEN’S SHIRTS
01 POLO 195 3.1% 5007.31 2608.81 47.9%
05 SHORT SLEEVE 177 4.3% 4319.42 2284.97 47.1%
10 LONG SLEEVE CASUAL 109 6.0% 2766.42 1535.36 44.5%
15 LONG SLEEVE DRESS 124 5.2% 3291.46 1777.39 46.0%
----- ---- --------- -------- ----
TOTAL Department: 605 4.6% 15384.61 8206.53 46.7%
Department: 15 MEN’S PANTS
01 JEANS 186 3.6% 6544.60 3442.46 47.4%
05 SHORTS/SPORTSWEAR 279 2.7% 6515.21 3400.94 47.8%
10 CASUAL PANTS 130 5.1% 5144.53 2783.19 45.9%
15 DRESS PANTS 115 7.2% 5314.66 2986.84 43.8%
----- ---- --------- -------- ----
TOTAL Department: 710 4.7% 23519.00 12613.43 46.4%
Department: 20 MEN’S OUTERWEAR
01 COATS 78 5.2% 3771.14 2021.33 46.4%
----- ---- --------- -------- ----
TOTAL Department: 78 5.2% 3771.14 2021.33 46.4%
----- ---- --------- -------- ----
TOTAL Location: 1393 4.8% 42674.75 22841.29 46.5%
===== ==== ========= ======== ====
TOTAL Report: 1393 4.8% 42674.75 22841.29 46.5%
Sales Journal ReportObjective:
Print a Department and
Class Sales Summary.
Include Discount and
Margin information,
View Sales Information for
May, 2003.
1
2
3
1
1
22
3
1

Section 1, Sales Report Generator Merchant Technologies (800) 395-8324
Page 1.15
Run Date 5/31/03 S A L E S J O U R N A L Page 1
Run Time 1:38 PM Merchant Technologies User JW
[SELECT OPTIONS] Sort (1-5) +A=Alpha Sort: 1 <1>=Dept <2>=Dept/Class <3>=Vendor <4>=Dept/Vendor <5>=Dept/Class/Vendor
Location Code: 01
(Several Select Options have been deleted to make space. See previous page for all Select Options.)
Sales Date: 5/30/03 to 5/30/03
Print Sub-Items (Y/N)? N
Print Item Detail (Y/N)? N <Y>=Separate line for each Item Sale & prints Date/Time instead of Vendor Ref
Print Profit Margin (Y/N)? Y
Print Totals Only (Y/N)? N
Vendor Ref (Y/N)? Y <Y>=Prints Vendor Reference Number, <N>=Prints item code
Cost Type (1/2): 2 <1>=Replacement Cost, <2>=Average Cost
Location: 01 Merchant Technologies
Item Item Wks Whse --Qty On-- Units Unit Disc ----- Extend ----- Prof
Code Description Rcv QOH Hand Ord Sold Price Pct Price Cost Marg
---- ----------- --- ---- ---- --- ----- ----- ---- ----- ---- ----
Department: 01 JUNIOR SPORTSWEAR
D427 CAP SLV TEE SHIRT V KNECK 12 3 1 15 1 26.00 26.00 12.50 51.9%
----- ---- --------- -------- ----
TOTAL Department: 1 0.0% 26.00 12.50 51.9%
Department: 02 MISSY SPORTSWEAR
SURF-SH SURF SHIRT 6 4 3 10 1 20.00 20.00 10.00 50.0%
----- ---- --------- -------- ----
TOTAL Department: 1 0.0% 20.00 10.00 50.0%
Department: 21 MEN'S PANTS
501 LEVI'S 501 JEANS 3 26 77 39 6 34.95 209.70 102.00 51.3%
501BF LEVI'S 501 BUTTON FLY JEANS 5 62 123 28 5 34.95 174.75 85.00 51.3%
505 RF LEVI'S 505 REG FIT JEANS 5 41 128 0 4 36.95 147.80 68.00 53.9%
517 BC LEVI'S 517 BOOT CUT JEANS 5 23 128 22 3 36.95 110.85 51.00 53.9%
550 RF LEVI'S 550 RELXD FIT JEANS 5 32 142 17 4 39.95 159.80 76.00 52.4%
569 LS LEVI'S 569 LOOSE STRT JEANS 5 20 44 27 2 40.95 81.90 39.70 51.5%
PR-AU LEVI'S PREM AUSTIN JEANS 5 9 176 0 1 45.95 45.95 22.00 52.1%
T1 STR LEVI'S TYPE 1 STRAIGHT 5 14 109 23 1 43.95 43.95 21.50 51.0%
----- ---- --------- -------- ----
TOTAL Department: 26 0.0% 974.70 465.20 52.2%
Department: 22 MEN'S SHIRTS
IP 205 CAMP SOLID POLO 6 26 66 0 12 28.95 347.40 168.00 51.6%
IP 208 SOLID PIQUE POLO 6 19 62 0 13 31.95 415.35 195.00 53.0%
----- ---- --------- -------- ----
TOTAL Department: 25 0.0% 762.75 363.00 52.4%
TOTAL Location: 53 0.0% 1783.45 840.70 52.8%
===== ==== ========= ======== ====
TOTAL Report: 53 0.0% 1783.45 840.70 52.8%
Sales Journal Report Objective:
Print a report to see what
items were sold on
5/30/03.
Include Discount and
Margin information,
Consolidate Colors and
Sizes into Style
Sort by Department then
Style Code..
1
2
3
4
Quantity On Hand is
provided for the
Selling and
Warehouse locations.
Wks Rcv is the number of weeks since the last P.O. was received.
1
2
2
3
3
4
4
4
2

Section 1, Sales Report Generator Merchant Technologies (800) 395-8324
Page 1.16
Run Date 6/03/03 S A L E S J O U R N A L Page 1
Run Time 12:40 PM Merchant Technologies User JW
[SELECT OPTIONS] Sort (1-5) +A=Alpha Sort: 1 <1>=Dept <2>=Dept/Class <3>=Vendor <4>=Dept/Vendor <5>=Dept/Class/Vendor
Location Code: ALL
Salesman Code: ALL
Vendor Code: ALL
Department Code: 22
Class Code: 01
Category Code: ALL
Item Code: 000732
Sales Date: 6/02/03 to 6/02/03
Print Sub-Items (Y/N)? Y
Sales Type (1/2): ALL <1>=Retail POS Sales, <2>=Sales Order Entry (prints '*' if Print Item Detail)
Print Item Detail (Y/N)? Y <Y>=Separate line for each Item Sale & prints Date/Time instead of Vendor Ref
Print Profit Margin (Y/N)? Y
Print Totals Only (Y/N)? N
Page Breaks (Y/N)? N <N>=No Page Break on Dept or Vendor (Depending on Sort)
Vendor Ref (Y/N)? N <Y>=Prints Vendor Reference Number, <N>=Prints item code
Location: 01 Merchant Technologies
Item Item Wks Whse --Qty On-- Units Unit Disc ----- Extend ----- Prof
Code Description Rcv QOH Hand Ord Sold Price Pct Price Cost Marg
---- ----------- --- ---- ---- --- ----- ----- ---- ----- ---- ----
Department: 22 MEN'S SHIRTS
POLO SHIRT
0007320002 <RED MEDIUM > 4 7 5 6 1 31.95 31.95 15.00 53.0%
6/02/03 10:42AM 01 752
0007320005 <RED XXL > 4 4 6 4 1 31.95 31.95 15.00 53.0%
6/02/03 12:28PM 01 758
0007320006 <GREEN SMALL > 4 6 6 4 1 31.95 31.95 15.00 53.0%
6/02/03 10:03AM 02 475
0007320009 <GREEN XL > 4 9 2 4 1 31.95 31.95 15.00 53.0%
6/02/03 4:56PM 01 762
0007320012 <WHITE MEDIUM > 4 6 5 6 1 31.95 31.95 15.00 53.0%
6/02/03 12:28PM 01 758
0007320014 <WHITE XL > 4 6 5 4 1 31.95 31.95 15.00 53.0%
6/02/03 7:16PM 02 481
0007320017 <DK BLU MEDIUM > 4 3 6 6 1 31.95 50.0% 15.97 15.00 6.0%
6/02/03 11:27AM 01 755
0007320019 <DK BLU XL > 4 4 4 4 1 31.95 31.95 15.00 53.0%
6/02/03 2:39PM 01 766
----- ---- --------- -------- ----
TOTAL Item: 8 6.2% 239.62 120.00 49.9%
----- ---- --------- -------- ----
TOTAL Department: 8 6.2% 239.62 120.00 49.9%
TOTAL Location: 8 6.2% 239.62 120.00 49.9%
===== ==== ========= ======== ====
TOTAL Report: 8 6.2% 239.62 120.00 49.9%
Sales Journal Report Objective:
Print Sales Information for the
Size and Color combinations
of a particular Item.
Show each Sales Transaction
from 6/2/03.
What kind of Discounts were
given on each sale?
Also include current Quantity
On Hand and On Order.
1
2
3
4
1
2
34
1
2
The Item Detail version of the report
includes the Date, Time, Register
Number and Transaction Number for
each time the Item was sold.

Section 1, Sales Report Generator Merchant Technologies (800) 395-8324
Page 1.17
Run Date 6/02/03 H O T / C O L D I T E M R E P O R T Page 1
Run Time 5:29 PM Merchant Technologies User JW
[SELECT OPTIONS] Hot or Cold Report (H/C): H <H>=Hot Items, <C>=Cold Items
Sort Order (1/2/3): 1 <1>=Department, <2>=Vendor, <3>=Item
Ranking (1/2/3/4/5): 2 <1>=Sales$ <2>=Sales Units <3>=Margin$ <4>=Margin% <5>=Sell Thru% (to date)
Number of Items to Print: 5 Ex: If Number = 10 & Sort = Dept, prints top 10 items for each Dept
Date: 3/01/03 to 6/02/03
Location Code: 01
Vendor Code: ALL
Department Code: ALL
Class Code: ALL
Category Code: ALL
Print Sub-Items (Y/N)? N
Store Consolidation (Y/N)? N
Sold Items Only (Y/N)? Y <Y>=Only Sale Items, <N>=All Items that have been Received
Print Vendor Ref (Y/N)? Y
Price Point: ALL Uses Retail Price
Location: 01 Merchant Technologies
Item Item On On Last Sales Sell Sales Cost Disc Marg Last
Code Description Hand Order Recv Units Thru $ $ $ $ Sale
---- ----------- ---- ----- ---- ----- ---- ----- ---- ---- ---- ----
Department: 01 MEN’S SHIRTS
IP 2112 IZOD SOLID CAMP POLO 88 24 5/15/03 187 68% 4948 2525 101 2424 6/01/03
20250 ARROW PINPOINT SOLID 68 30 4/21/03 171 72% 5910 2993 246 2917 5/30/03
D4247 DOCKERS BARRYMORE 24 12 4/08/03 158 87% 5688 2844 0 2844 5/31/03
IP 2131 IZOD SOLID PIQUE POLO 50 24 5/15/03 155 76% 3798 1860 78 1938 6/01/03
GBD6600 G. BEANE HERRINGBONE 41 36 3/30/03 132 76% 3598 1914 230 1684 6/01/03
----- --- ------ ----- ---- ----
TOTAL Department: 803 75% 23942 12135 654 11807
Department: 02 MEN'S PANTS
501 LEVI'S 501 JEANS 106 46 5/02/03 243 70% 8493 4131 0 4362 6/01/03
FF 245 DOCKER FLAT FRNT KHAKI 91 32 5/11/03 216 70% 10057 5184 311 4873 6/01/03
505 RF LEVI'S 505 REG FIT JEANS 81 37 5/02/03 211 72% 7796 3798 0 3998 5/31/03
501BF LEVI'S 560 CMFT FIT JEANS 113 0 5/02/03 178 61% 6794 3382 139 3412 5/30/03
PF 240 DOCKER PLEAT FRNT KHAKI 87 18 5/11/03 165 65% 7603 3960 317 3643 6/01/03
----- --- ------ ----- ---- ----
TOTAL Department: 1013 68% 40744 20455 767 20289
Department: 03 MEN’S OUTERWEAR
WR4240 MICROFIBER FRNT ZIP JACKET 29 0 12/18/02 107 79% 3424 1712 856 1712 5/29/03
PG 2004PO PATAGONIA FLEECE PULLOVER 59 36 5/03/03 103 64% 4403 2163 232 2240 6/01/03
242506 COLUMBIA STORMY TRAILS JKT 17 18 2/24/03 86 83% 6063 3096 387 2967 5/26/03
CB 4250 C&B MICRO BOMBER JACKET 9 20 3/19/03 62 87% 2364 1240 178 1124 5/18/03
242483 COLUMBIA KEENE VALLEY JKT 12 18 2/24/03 58 83% 3031 1566 160 1465 5/24/03
----- --- ------ ----- ---- ----
TOTAL Department: 416 77% 19285 9777 1812 9508
===== === ====== ===== ==== ====
TOTAL Location: 2232 72% 83970 42367 3233 41603
Hot / Cold Item ReportObjective:
Print the Top 5 Sellers
in each Department.
Rank Items by Sales
Units.
Base the Ranking on
March through May
2003 Sales.
1
2
3
1
1
2
3
The Hot / Cold Item
Report can rank items by
Sales $, Sales Units,
Margin $, Margin % or
Sell Thru%.

Section 1, Sales Report Generator Merchant Technologies (800) 395-8324
Page 1.18
Run Date 6/04/03 H O T / C O L D I T E M R E P O R T Page 1
Run Time 5:02 PM Merchant Technologies User
[SELECT OPTIONS] Hot or Cold Report (H/C): C <H>=Hot Items, <C>=Cold Items
Sort Order (1/2/3): 3 <1>=Department, <2>=Vendor, <3>=Item
Ranking (1/2/3/4/5): 3 <1>=Sales$ <2>=Sales Units <3>=Margin$ <4>=Margin% <5>=Sell Thru% (to date)
Number of Items to Print: 15 Ex: If Number = 10 & Sort = Dept, prints top 10 items for each Dept
Date: 3/01/03 to 5/31/03
Location Code: 01
Vendor Code: ALL
Department Code: ALL
Class Code: ALL
Category Code: ALL
Print Sub-Items (Y/N)? N
Store Consolidation (Y/N)? N
Sold Items Only (Y/N)? Y <Y>=Only Sale Items, <N>=All Items that have been Received
Print Vendor Ref (Y/N)? Y
Price Point: ALL Uses Retail Price
Location: 01 MERCHANT TECHNOLOGIES
Item Item On On Last Sales Sell Sales Cost Disc Marg Last
Code Description Hand Order Recv Units Thru $ $ $ $ Sale
---- ----------- ---- ----- ---- ----- ---- ----- ---- ---- ---- ----
PS-11-50 PHY SCI VELOUR ZIP FRNT JKT 21 0 2/22/03 2 19% 46 28 12 18 4/17/03
M25561 MERONA FINE GAUGE SILK TOP 34 0 3/13/03 3 18% 62 38 16 25 4/28/03
03-02-1803 I LOVE CRANSTON TEE 18 12 1/18/03 5 22% 70 38 15 32 5/08/03
CB31005 C&B RUFFLED DRESS SHIRT 29 0 4/02/03 5 15% 188 115 47 73 3/28/03
AX-25-401 AXCS HRNGBONE PLT DRSS PANT 14 18 2/01/03 5 26% 215 125 35 90 3/23/03
12F740 FRENCH TERRY JKT 11 0 10/04/02 10 48% 227 130 43 97 3/13/03
MLBNYY251 NY YANKEES TEE 16 0 3/21/03 17 52% 272 170 68 102 4/29/03
NBA-5966 BLU/WHT SHAQ MUSCLE SHIRT 7 0 11/02/02 15 68% 284 180 46 104 5/20/03
RL-T47 RALPH LAUREN DRESS TEE 20 18 4/11/03 9 31% 287 171 55 116 3/04/03
10-1004 EVRYDAY HERO BASABALL SHRT 9 0 6/07/02 15 63% 261 135 39 126 5/06/03
TG4283 MEN’S VELOUR PANTS 15 0 3/05/03 24 62% 444 300 132 144 4/29/03
TG2365 CAMOFLAGE CARGO SHORTS 22 18 4/17/03 19 46% 334 181 46 154 5/19/03
PR-SK LEVI’S PREM SKINNER JEANS 37 24 1/30/03 10 21% 391 230 69 161 5/28/03
SVN7945 SAVNE COOLMAX PLT CSL PANT 8 24 3/20/03 13 62% 437 273 96 164 5/05/03
599 GF LEVI’S 599 GIANT FIT JEANS 33 18 1/30/03 12 27% 439 252 77 187 5/29/03
===== === ====== ===== ==== ====
TOTAL Location: 164 36% 3957 2365 796 1592
Hot / Cold Item ReportObjective:
Print the slowest selling 15
items over all at location 01.
(Cold Report)
Use Margin Dollars as the
ranking criteria.
Base Rankings on March
through May, 2003 Sales.
1
2
3
1
1
2
3
The Hot / Cold Item
Report can rank
items within Vendor
or Department, or
rank Items overall.
The Sold Items Only field allows only items that have been sold to appear.
Use the Inactive Report to find items that have not been sold at all.

Section 1, Sales Report Generator Merchant Technologies (800) 395-8324
Page 1.19
Run Date 6/15/03 I N V E N T O R Y U S A G E R E P O R T Page 1
Run Time 6:56 PM Merchant Technologies User JW
[SELECT OPTIONS] Sort (1-6) +A=Alpha Sort: 1 <1>=Dep/Cls/Item <2>=Vend/Ref <3>=Dep/Item <4>=Ven/Dep/Ref <5>=Manuf <6>=Cat
Location Code: 01
Vendor Code: ALL
Manuf Code: ALL
Department Code: 22
Class Code: ALL
Category Code: ALL
Item Code: ALL
Item Detail (1/2/3)? 2 <1>=Totals Only, <2>=Item Detail, <3>=Sub-Item Detail
Location Format (1/2/3)? 1 <1>=Separate Report by Location, <2>=Location Comparison, <3>=Consolidated
Stocked Items (1/2/3)? 1 <1>=All Items, <2>=Stocked Items Only, <3>=Non-Stocked Items Only
Months/Type (1/2/3)? 2 <1>=12 Mth Sales, <2>=24 Mth Sales, <3>=12 Mth Sales / 12 Mth Closing Units
Print Vendor Ref (Y/N)? Y <Y>=Prints Vendor Reference Number, <N>=Prints item code
Print Min/Max (Y/N)? N <Y>=Prints Min/Max instead of QOH & QOO (forces item detail)
Export Data File (Y/N)? N <1>=No Export, <2>=Export to data file expusg
Print Retail/Cost (Y/N)? Y Prints Retail/Cost beneath Item Description
Location: 01 MERCHANT TECHNOLOGIES
- - - - - - - - - - - - S A L E S U N I T S - - - - - - - - - - - - - - -
Item Item On On 02 02 02 02 02 02 03 03 03 03 03 03
Code Description Hand Ord Jul Aug Sep Oct Nov Dec Jan Feb Mar Apr May Jun Total
---- ----------- ---- --- --- --- --- --- --- --- --- --- --- --- --- --- -----
Department: 22 MEN'S SHIRTS
Class: 01 SHORT SLEEVED SHIRTS
IP 205 IZOD SOLID CAMP POLO 66 12 62 55 32 18 6 2 0 5 37 40 51 31 339
14.00 / 28.95 0 0 0 0 0 0 0 0 28 36 45 49 158
IP 208 IZOD SOLID PIQUE POLO 53 18 58 61 43 25 11 6 2 7 34 44 57 36 384
15.00 / 31.95 50 52 29 15 10 2 0 0 25 46 53 59 341
---- ---- ---- ---- ---- ---- ---- ---- ---- ---- ---- ---- ---- ---- ----
TOTAL Class: 119 30 120 116 75 43 17 8 2 12 71 84 108 67 723
50 52 29 15 10 2 0 0 53 82 98 108 499
Class: 05 LONG SLEEVED SHIRTS
A-5652 ARROW DOVER L/S DRESS S 32 18 20 25 24 25 22 34 27 32 28 23 30 16 306
15.00 / 30.99 22 36 24 28 21 32 24 27 30 26 28 33 331
A-5680 ARROW PINPOINT L/S DRES 46 0 22 28 24 26 31 38 34 25 26 28 31 12 325
16.00 / 32.99 0 0 0 18 28 26 23 27 30 26 29 33 240
32560 G BEANE HERRINGBONE DRE 24 24 15 17 19 13 21 17 15 20 22 25 18 11 213
16.50 / 34.99 0 0 5 18 17 21 13 16 17 15 20 19 161
---- ---- ---- ---- ---- ---- ---- ---- ---- ---- ---- ---- ---- ---- ----
TOTAL Class: 102 42 57 70 67 64 74 89 76 77 76 76 79 39 844
22 36 29 64 66 79 60 70 77 67 77 85 732
TOTAL Department 221 72 177 186 142 107 91 97 78 89 147 160 187 106 1567
72 88 58 79 76 81 60 70 130 149 175 193 1231
TOTAL Location: 221 72 177 186 142 107 91 97 78 89 147 160 187 106 1567
72 88 58 79 76 81 60 70 130 149 175 193 1231
Inventory Usage ReportObjective:
Print a report for Sales Units
by Item by month.
Include Sales Data for
Department 22 at Location 01.
Include Sales Units for each of
the last 24 months.
Quantity On Hand and On Order
included for quick reference.
1
2
3
1
1
2
The Inventory Usage
Report can be printed to
include 12 or 24
months of Sales Units,
or 12 months of Sales
units with Month End
Qty on Hand.

Section 1, Sales Report Generator Merchant Technologies (800) 395-8324
Page 1.20
Run Date 6/06/03 I N V E N T O R Y U S A G E R E P O R T Page 1
Run Time 1:12 PM Merchant Technologies User JW
[SELECT OPTIONS] Sort (1-6) +A=Alpha Sort: 3A <1>=Dep/Cls/Item <2>=Vend/Ref <3>=Dep/Item <4>=Ven/Dep/Ref <5>=Manuf <6>=Cat
Region Code: ALL
Location Code: 01 NOTE – Several Select options were removed in order to
Vendor Code: ALL fit the report on one page.
Manuf Code: ALL
Department Code: 65
Class Code: 02
Item Detail (1/2/3)? 3 <1>=Totals Only, <2>=Item Detail, <3>=Sub-Item Detail
Location Format (1/2/3)? 1 <1>=Separate Report by Location, <2>=Location Comparison, <3>=Consolidated
Months/Type (1/2/3)? 3 <1>=12 Mth Sales, <2>=24 Mth Sales, <3>=12 Mth Sales / 12 Mth Closing Units
Print Min/Max (Y/N)? Y <Y>=Prints Min/Max instead of QOH & QOO (forces item detail)
Print Retail/Cost (Y/N)? Y Prints Retail/Cost beneath Item Description
Location: 01 MERCHANT TECHNOLOGIES
- - - - - - - - - - - - S A L E S U N I T S - - - - - - - - - - - - - - -
Item Item 02 02 02 02 02 02 03 03 03 03 03 03
Code Description Min Max Jul Aug Sep Oct Nov Dec Jan Feb Mar Apr May Jun Total
---- ----------- ---- --- --- --- --- --- --- --- --- --- --- --- --- --- -----
Department: 65 BOOKS
Class: MODERN FICTION
0006290000 A FAREWELL TO ARMS 3 10 3 8 4 1 6 5 7 10 8 5 7 12 76
3.50 / 6.95 5 22 18 17 11 31 24 14 6 26 19 7 200
0006220000 DUBLINERS 3 10 4 3 27 10 4 6 31 7 6 8 4 3 113
3.50 / 6.95 3 50 23 13 9 53 22 15 9 16 12 9 234
0006320000 FINNEGAN'S WAKE 3 6 0 0 16 6 2 1 11 12 2 1 0 2 53
3.50 / 6.95 3 23 7 11 9 28 17 5 9 8 8 6 134
0006230000 FOR WHOM THE BELL TOLLS 3 10 11 17 24 10 14 9 22 13 12 9 14 12 167
3.50 / 6.95 20 53 29 19 5 46 24 11 7 23 9 22 268
0006210000 POTRAIT OF THE ARTIST A 3 10 6 8 29 8 9 10 24 11 8 5 12 7 137
3.50 / 6.95 3 45 16 18 9 49 25 14 6 21 9 12 227
0006270000 THE GREAT GATSBY 3 10 20 5 34 12 9 5 27 18 4 7 5 16 162
3.50 / 6.95 6 51 17 15 6 51 24 6 22 15 10 6 229
0006240000 THE SUN ALSO RISES 3 10 22 8 24 16 4 6 34 4 8 11 9 12 158
3.50 / 6.95 3 45 21 15 11 55 21 17 9 18 9 7 231
0006280000 ULYSSEYS 3 6 2 1 19 4 3 1 15 7 5 2 4 2 65
3.50 / 6.95 2 26 7 13 10 29 14 7 12 10 6 4 140
---- ---- ---- ---- ---- ---- ---- ---- ---- ---- ---- ---- ---- ---- ----
TOTAL Class: 24 72 68 50 177 67 51 43 171 82 53 48 55 66 931
45 315 138 121 70 342 171 89 80 137 82 73 1663
TOTAL Department 24 72 68 50 177 67 51 43 171 82 53 48 55 66 931
45 315 138 121 70 342 171 89 80 137 82 73 1663
TOTAL Location: 24 72 68 50 177 67 51 43 171 82 53 48 55 66 931
45 315 138 121 70 342 171 89 80 137 82 73 1663
Inventory Usage ReportObjective:
Print a report for Dept 65,
Class 02 with Monthly
Sales Totals and EOM
Qty on Hand.
Include the Reorder
Minimums and
Maximums, and Cost and
Retail Price.
Sort items alphabetically.
Reorder Minimums and
Maximums can be included
for quick reference.
The first
row
contains
Sales
data, the
second
row
contains
Month End
Qty on
Hand.
1
2
1
2
3
1
3
3
2
2

Section 1, Sales Report Generator Merchant Technologies (800) 395-8324
Page 1.21
Run Date 6/09/03 I N A C T I V E I T E M R E P O R T Page 1
Run Time 12:30 PM Merchant Technologies User JW
[SELECT OPTIONS] Sort (1-6) +A=Alpha Sort: 1 <1>=Dep/Cls/Item <2>=Vend/Ref <3>=Dep/Item <4>=Ven/Dep/Ref <5>=Manuf <6>=Cat
Region Code: ALL
Location Code: 01
Vendor Code: ALL
Manuf Code: ALL
Department Code: 01
Class Code: ALL
Category Code: ALL
Item Code: ALL
Print Items not sold since: 2/01/03
Item Detail (1/2/3)? 2 <1>=Totals Only, <2>=Item Detail, <3>=Sub-Item Detail
Location Format (1/2/3)? 1 <1>=Separate Report by Location, <2>=Location Comparison, <3>=Consolidated
Stocked Items (1/2/3)? 1 <1>=All Items, <2>=Stocked Items Only, <3>=Non-Stocked Items Only
Print Deleted Items (Y/N)? N
Active Items Only (Y/N)? N
Page Breaks (Y/N)? N <N>=No Page Break on Dept, Vendor, Manuf or Category (Depending on Sort)
QOH Items Only (Y/N)? Y <Y>=Only prints items with On Hand Quantity > 0
Location: 01 MERCHANT TECHNOLOGIES
-- To Date -- Last
Item Vendor Item On On Sales Sales Sale
Code Reference Description Hand Order Units $ Date
---- --------- ----------- ---- ----- ----- ----- ----
Department: 01 JUNIOR SPORTSWEAR
Class: 1 KNIT TOPS/T-SHIRTS
000500 S4520 LONG SLEEVE VNK TEE 5 0 13 221 1/03/03
000610 BRIT230 OOPS! I DID IT AGAIN T 1 0 11 231 10/07/02
000813 GP-2230 LEOPARD PRINT SLVLESS TOP 8 0 22 478 9/26/02
000924 OLL4257 FRENCH WORDS KNIT TOP 10 0 8 141 12/05/02
001075 RW-93 DEEP VEE CROP TEE 13 0 5 85 10/15/03
001376 TBTEE TERRY BACKLESS TEE 7 0 8 161 9/02/02
001871 ED-7878 S/S TURTLE TEE 1 0 11 209 1/21/03
Class: 3 SLACKS
000472 1100SZ LINEN CROP PANT/SIDE ZIP 3 0 9 297 11/20/02
Class: 4 SHORTS
000975 2666 DRAW STRING WAIST SHORT 6 0 25 525 1/02/03
001137 RK811 DRAGON HOT PANTS 2 0 7 161 8/29/02
*** End of Report ***
Inactive Item ReportObjective:
Find out what Items
have not sold since
February 1, 2003.
Sort the Inactive Items
by Department and
Class.
View the Inactive Items
for Location 01 only.
1
2
31
2
2
3
The report can
be printed to
see only Items
that have Qty on
Hand, so you
can focus on
problem items.

Section 1, Sales Report Generator Merchant Technologies (800) 395-8324
Page 1.22
Run Date 6/10/03 S T O C K T O S A L E S R E P O R T Page 1
Run Time 9:50 AM Merchant Technologies User JW
[SELECT OPTIONS] Sort (1-6) +A=Alpha Sort: 4 <1>=Dep/Cls/Item <2>=Vend/Ref <3>=Dep/Item <4>=Ven/Dep/Ref <5>=Manuf <6>=Cat
Region Code: ALL
Location Code: 01
Vendor Code: LEVIS
Manuf Code: ALL
Department Code: ALL
Class Code: ALL
Category Code: ALL
Item Code: ALL
Period (mmyy): 3/03 to 6/03
Item Detail (1/2/3)? 2 <1>=Totals Only, <2>=Item Detail, <3>=Sub-Item Detail
Location Format (1/2/3)? 1 <1>=Separate Report by Location, <2>=Location Comparison, <3>=Consolidated
Stocked Items (1/2/3)? 1 <1>=All Items, <2>=Stocked Items Only, <3>=Non-Stocked Items Only
Print Deleted Items (Y/N)? Y <Y>=Prints % Inv. Units, % Sales Units & Variance %, <N>=% data Suppressed
Active Items Only (Y/N)? N
Page Breaks (Y/N)? N <N>=No Page Break on Dept, Vendor, Manuf or Category (Depending on Sort)
Print Vendor Ref (Y/N)? Y
Location: 01 MERCHANT TECHNOLOGIES
------- MONTHLY AVERAGE ------- -- RATIO -- -- % of --
Item Item On On Inv Sales EOM Sales Stock Inv EOM Sales
Code Description Hand Ord $ $ Units Units Sales Turn Units Units Var
---- ----------- ---- --- --- ----- ----- ----- ----- ---- ----- ----- ---
Vendor: LEVIS LEVI STRAUSS
Department: 21 MEN'S PANTS
501 LEVI'S 501 JEANS 225 59 5950 8963 223.4 256.4 .9 3.8
501BF LEVI'S 501 BUTTON FLY JEAN 261 15 7031 8459 254.3 242.0 1.1 3.2
505 RF LEVI'S 505 REG FIT JEANS 226 9 6879 8233 240.2 222.8 1.1 3.1
512 SF LEVI'S 512 SLIM FIT JEANS 233 0 7256 7656 267.2 207.2 1.3 2.6
517 BC LEVI'S 517 BOOT CUT JEANS 190 9 6213 6679 224.6 180.7 1.2 2.7
527 BC LEVI'S 527 LOW RISE BOOT C 122 12 4034 4444 139.9 117.1 1.2 2.8
527 SC LEVI'S 529 LOW RISE STR CU 155 0 5196 5151 174.1 135.7 1.3 2.6
550 RF LEVI'S 550 RELXD FIT JEANS 239 32 8085 10293 276.8 257.6 1.1 3.1
560 CF LEVI'S 560 CMFT FIT JEANS 241 16 7702 9549 260.9 239.0 1.1 3.1
569 LS LEVI'S 569 LOOSE STRT JEAN 71 16 2582 2926 85.8 71.4 1.2 2.8
599 GF LEVI'S 599 GIANT FIT JEANS 165 27 6010 7429 188.8 172.9 1.1 3.0
OUTB LEVI'S OUTBACK JEANS 88 0 3250 2922 97.3 69.6 1.4 2.4
PR-AU LEVI'S PREM AUSTIN JEANS 278 13 10625 12280 319.2 267.2 1.2 2.8
PR-SK LEVI'S PREM SKINNER JEANS 272 0 9893 8610 296.4 187.3 1.6 2.1
T1 RL LEVI'S TYPE 1 REAL LOOSE 192 0 7430 7575 226.1 172.3 1.3 2.5
T1 STR LEVI'S TYPE 1 STRAIGHT 182 23 6533 7945 209.6 180.7 1.2 2.9
---- ---- ------ ------ ------ ------ ---- ---- ---- ---- ----
TOTAL Department: 3140 231 104677 119121 3485.2 2980.7 1.2 2.8 96.0% 97.3% 1.3%
TOTAL Vendor: 3140 231 104677 119121 3485.2 2980.7 1.2 2.8 20.7% 26.4% 5.7%
TOTAL Location: 3140 231 104677 119121 3485.2 2980.7 1.2 2.8
Stock to Sales and Inv Turns are given for the months in the
Reporting Period. Partial Current Months are taken into account.
Stock to Sales ReportObjective:
Print a report containing
Stock to Sales and Inventory
Turn Information.
Include Items from the
Vendor Levi’s at Location 01 .
Include information for March
through June, 2003.3
1
2
1
2
3
Monthly Average columns contain average
information for each month in the reporting period.
Inventory to Sales
Units Comparison is
provided for Class and
Department or Vendor
Totals.

Section 1, Sales Report Generator Merchant Technologies (800) 395-8324
Page 1.23
Run Date 6/10/03 L O C A T I O N C O M P A R I S O N R E P O R T Page 1
Run Time 11:08 AM Merchant Technologies User JW
[SELECT OPTIONS] Sort (1-6) +A=Alpha Sort: 1 <1>=Dep/Cls/Item <2>=Vend/Ref <3>=Dep/Item <4>=Ven/Dep/Ref <5>=Manuf <6>=Cat
Region Code: ALL
Vendor Code: ALL
Manuf Code: ALL
Department Code: 66
Class Code: 01
Category Code: ALL
Item Code: ALL
Line 1 Comparison Data: 1 <1>=QOH <2>=QOO <3>=Sales <4>=Reserve/Layaway
U <U>=Units, <C>=Cost$, <R>=Retail$
6/03
Line 2 Comparison Data: 2 <1>=QOH <2>=QOO <3>=Sales <4>=Reserve/Layaway, <5>=Blank
U <U>=Units, <C>=Cost$, <R>=Retail$
6/03
Line 3 Comparison Data: 3 <1>=QOH <2>=QOO <3>=Sales <4>=Reserve/Layaway, <5>=Blank
U <U>=Units, <C>=Cost$, <R>=Retail$
4/03 to 6/03
Item Detail (1/2/3)? 2 <1>=Totals Only, <2>=Item Detail, <3>=Sub-Item Detail
Stocked Items (1/2/3)? 1 <1>=All Items, <2>=Stocked Items Only, <3>=Non-Stocked Items Only
Print Deleted Items (Y/N)? Y
Active Items Only (Y/N)? N
Page Breaks (Y/N)? N <N>=No Page Break on Dept, Vendor, Manuf or Category (Depending on Sort)
Print Vendor Ref (Y/N)? N <Y>=Prints Vendor Reference Number, <N>=Prints item code
Skip Line (Y/N)? Y <Y>=Applicable for multiple comparison lines, skips line after line 2 or 3
Whse On Hand Only (Y/N)? N <Y>=Prints line if Whse QOH > 0, Use to fill stores from Whse (Item Detail=3)
Consolidated Items (Y/N)? N <Y>=Prints Consolidated Items denoted by ~ preceding Item Code
Location Comparison Report - Part 1
Location Comparison Report -
Report Selection Screen
Up to 3 reporting
criteria can be
selected from 4 data
types for inclusion on
the report.
Reporting can
be based on
Units, or Cost or
Retail Dollars
criteria.
Section 1, Sales Report Generator Merchant Technologies (800) 395-8324
Page 1.24
Run Date 6/10/03 L O C A T I O N C O M P A R I S O N R E P O R T Page 2
Run Time 1:21 PM Merchant Technologies User JW
<1> = QOH Units 6/03 to 6/03
<2> = QOO Units 6/03 to 6/03
<3> = Sales Units 5/03 to 6/03
Item Item 01 02 03
Code Description MT V9. LOCATI LOCATI Total
---- ----------- ------ ------ ------ -----
Department: 66 TOYS
Class: 01 MODEL CARS
000679 1969 PORSCHE 911S 1 1 2 1 4
2 7 1 2 10
3 11 1 1 13
000680 1972 JAGUAR XKE V12 1 2 1 2 5
2 2 2 1 5
3 10 1 3 14
000682 1965 FERRARI GTB 1 2 1 0 3
2 2 2 3 7
3 11 2 2 15
000683 1956 MERCEDES 300SL GUL 1 1 1 1 3
2 2 2 2 6
3 13 3 4 20
000684 1974 BMW 3.0CSI 1 4 3 3 10
2 1 1 1 3
3 8 1 2 11
000685 1976 PONTIAC TRANS AM 1 3 1 0 4
2 1 2 3 6
3 9 2 1 12
000686 1967 FORD MUSTANG 2+2 1 1 1 2 4
2 2 2 1 5
3 11 1 3 15
000689 1973 DE TOMASSO PANTERA 1 1 1 1 3
2 3 2 2 7
3 16 0 1 17
------ ------ ------ ------
TOTAL Class: 1 15 11 10 36
2 20 14 15 49
3 89 11 17 117
TOTAL Department: 1 15 11 10 36
2 20 14 15 49
3 89 11 17 117
TOTAL Company: 1 15 11 10 36
2 20 14 15 49
3 89 11 17 117
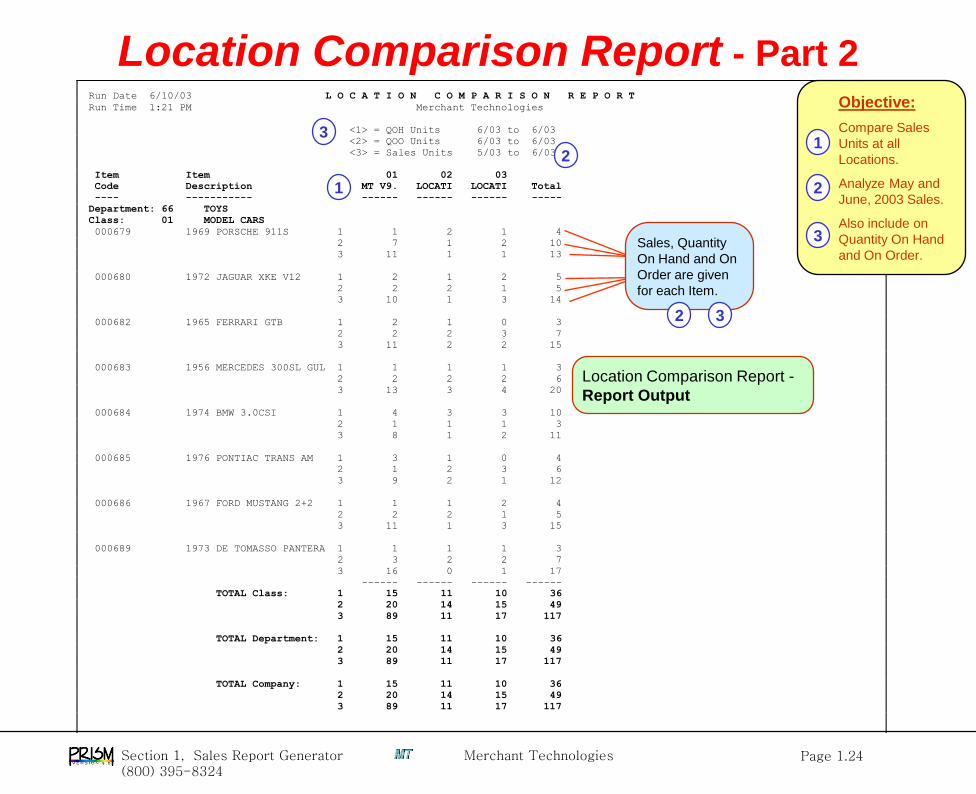
Location Comparison Report - Part 2Objective:
Compare Sales
Units at all
Locations.
Analyze May and
June, 2003 Sales.
Also include on
Quantity On Hand
and On Order.Sales, Quantity
On Hand and On
Order are given
for each Item.
1
2
3
1
2
3
2 3
Location Comparison Report -
Report Output

Section 1, Sales Report Generator Merchant Technologies (800) 395-8324
Page 1.25
Run Date 6/10/03 W E E K L Y S A L E S R E P O R T Page 1
Run Time 3:48 PM Merchant Technologies User JW
[SELECT OPTIONS] Sort (1-8) +A=Alpha Sort:1 <1>=Dep/Cls <2>=Vn <3>=Dep <4>=Vn/Dep <5>=Mfg <6>=Cat <7>=Dep/Cls/Vn<8>=Dep/Vn
Region Code: ALL
Location Code: 01
Vendor Code: ALL
Manuf Code: ALL
Department Code: 22
Class Code: ALL
Category Code: ALL
Item Code: ALL
Season Code: ALL
Ending Date: 6/09/03 Prints last 4 weeks with the period ending on this date
Item Detail (1/2/3)? 2 <1>=Totals Only, <2>=Item Detail, <3>=Sub-Item Detail
Location Format (1/2/3)? 1 <1>=Separate Report by Location, <2>=Location Comparison, <3>=Consolidated
Stocked Items (1/2/3)? 1 <1>=All Items, <2>=Stocked Items Only, <3>=Non-Stocked Items Only
Deleted Items (Y/N)? N
Page Breaks (Y/N)? N <N>=No Page Break on Dept, Vendor, Manuf or Category (Depending on Sort)
Sold Items Only (Y/N)? N <Y> = Prints only Items sold during the 4 week period
Misc Items (1/2/3)? 2 <1>=All Items, <2>=Omit Misc (Items with 0 Retail Price), <3>=Misc Only
Days Received: ALL Prints only Items <= Days Received
Last Recv Date: ALL
Print Vendor Ref (Y/N)? N <Y>=Prints Vendor Reference Number, <N>=Prints item code
Location: 01 MERCHANT TECHNOLOGIES
-------- To Date ------- ----- Unit Sales ------
Item Item On On Unit Last Qty Unit Sell 6/03 5/27 5/20 5/13
Code Description Ord Hand Price Recv Recv Sales Thru Marg 6/09 6/02 5/26 5/19
---- ----------- --- ---- ------ ---- ---- ----- ---- ---- ----- ----- ----- -----
Department: 22 MEN'S SHIRTS
Class: 01 SHORT SLEEVED SHIRTS
000673 IZOD CAMP SOLID POLO 16 66 28.95 5/11/03 345 279 80.9% 49.6% 17 14 17 24
000732 IZOD COTTON PIQUE POLO 22 53 31.95 5/11/03 258 205 79.5% 50.6% 19 21 16 18
---- ---- ----- ----- ---- ---- ---- ---- ---- ----
TOTAL Class: 38 119 603 484 80.3% 50.1% 36 35 33 42
Class: 05 LONG SLEEVED SHIRTS
000692 ARROW DOVER L/S DRESS SH 12 36 30.99 4/28/03 788 752 95.4% 46.2% 20 12 9 14
000785 ARROW PINPOINT L/S DRESS 21 29 32.99 5/09/03 456 427 93.6% 47.3% 14 18 12 11
000809 G BEANE HERRINGBONE DRES 18 32 34.99 5/16/03 217 185 85.3% 48.6% 17 10 14 15
---- ---- ----- ----- ---- ---- ---- ---- ---- ----
TOTAL Class: 51 97 1461 1364 93.3% 47.0% 51 40 35 40
TOTAL Department: 89 216 2064 1848 89.5% 47.8% 87 75 68 82
TOTAL Location: 89 216 2064 1848 89.5% 47.8% 87 75 68 82
Weekly Sales ReportObjective:
Analyze recent Sales
Trends for Department
22 at Location 01.
Include Margin and Sell
Through information.
Also include Quantity On
Hand and On Order.
To Date (since the beginning of time) Sell
Thru and Margin Data is included.
Sales Units are
displayed for the
4 weekly periods
ending with the
date entered in
the Ending Date
field.
1
2
31
3
2
This report can
also be printed
to focus on
Items received
past a certain
date, or within
a Receive Date
range.

Section 1, Sales Report Generator Merchant Technologies (800) 395-8324
Page 1.26
Add STYLE EXCEPTION MAINTENANCE Page: 1 of
1. Dpt: <03> [OUTERWEAR ] 3. Annual Turns: 6.0 5. Usl Ord Units: 20
2. Cls: <07> [LEATHER JACK] 4. MD Sell Wks: 6 6. Max Ord Units: 160
-Days Old- % Sell Thru Num Weeks
GT LT
Fast Regular * 60 17.0 1
Promo * 60 26.0 1
Markdown * 120 34.0 1
Slow Regular 14 999 15.0 2
Promo 14 999 12.0 1
No Sale Regular 7 * * 1
Promo 7 * * 1
MD Again Markdown 14 * 33.0 2
Clearance Regular 30 * 24.0 2
Promo 30 * 36.0 2
Optimization Report – Exception Criteria
The Style Exception Maintenance screen allows the user to define the criteria used by the Style
Status Report. The report evaluates the Sales Performance of items based on this criteria and
rates the Items as Fast or Slow sellers and suggests pricing action according to the ranking.
Based on this
criteria, a
Promo-Priced
Item, less than
60 days old,
that had a Sell
Thru of at least
26% in 1 week
would be
considered a
Fast Seller.
Based on this
criteria, a Regular
Priced Item at least
14 days old that had
a Sell Thru of less
than 15% in 2 weeks
would be considered
a Slow Seller.
If an already Marked Down Item that was at least 14 days
old did not achieve a Sell Thru of 33% in 2 weeks, it would
be a candidate for being Marked Down Again.

Section 1, Sales Report Generator Merchant Technologies (800) 395-8324
Page 1.27
Run Date 9/17/02 S T Y L E S T A T U S R E P O R T Page 1
Run Time 1:22 PM Merchant Technologies User JW
[SELECT OPTIONS] Sort (1/2/3/4/5/6/7/8)? 4 <1>=Dep/Cls <2>=Vn <3>=Dep <4>=Vn/Dep <5>=Mfg <6>=Cat <7>=Dep/Cls/Vn <8>=Dep/Vn
Sort by Age: N Sorts Items by age within each Style
Retail Condition: 1 <1>=NoSrt, <2>=All, <3>=Regular, <4>=Promo, <5>=MD
Exception Criteria: 2 <1>=NoSrt <2>=All <3>=Fst <4>=Slw <5>=NoSal <6>=MDagn <7>=Clr <8>=Xfr <9>=Xsret
…
Department Code: 03
Class Code: 07
……
Number of Weeks: 1 All sales calculations are based on sales less than the number of weeks input
Item Detail (1/2)? 2 <1>=Totals Only, <2>=Item Detail
Location Format (1/2/3)? 1 <1>=Separate Report by Location, <2>=Location Comparison, <3>=Consolidated
……
Season Code: ALL
Data Type (1/2/3)? 1 <1>=Units, <2>=Cost, <3>=Retail
Location: 01 Merchant Technologies
Vendor: TAYLOR TAYLOR'S LEATHERWEAR
Department: 03 JACKETS
Vendor Item R Current Mrg On On Exc Main Wks Sell Wks
Reference Description C Retail Cost % Loc Hand Order Cod Marg Rec Thru Supp Sales
--------- ----------- - ------- ---- --- --- ---- ----- --- ---- --- ---- ---- -----
4412 PASSAIC LTHR JKT M 330.95 189.00 42.9% 01 22 16 FST 48.9% 14 35.3% 2 12
4415 LTHR CAR COAT R 547.95 253.00 53.8% 01 18 12 FST 53.8% 5 25.0% 3 6
4420 CLASSIC CUT LTHR JKT R 540.95 249.75 53.8% 01 35 12 FST 53.8% 5 18.6% 4 8
4420L CLASSIC LTHR JKT LONG R 614.95 295.00 52.0% 01 21 24 FST 52.0% 6 22.2% 4 6
4441 NASHVILLE P.D. LEATH M 457.95 264.00 42.4% 01 34 12 FST 48.6% 3 34.6% 2 18
4465 LEATHER HIDDEN AGEND R 608.95 298.00 51.1% 01 31 20 FST 51.1% 8 20.5% 4 8
4469 FULL LENGTH LEATHER R 577.95 266.95 53.8% 01 52 0 FST 53.8% 3 17.5% 5 11
4412L PASSAIC LTHR JKT LONG R 491.95 227.05 53.8% 01 105 0 SLW 53.8% 3 8.7% 11 10
4417 CLEVELAND STY. JACKE P 501.95 272.46 45.7% 01 23 24 SLW 50.3% 8 17.9% 5 5
4418 CHICAGO/MIL. STYLE L R 392.95 179.55 54.3% 01 50 0 SLW 54.3% 2 12.3% 7 7
4422 MEMPHIS STYLE LTHR P 493.95 268.16 45.7% 01 37 12 SLW 51.1% 11 9.8% 9 4
4422L MEMPHIS STYLE LTHR LNG R 653.95 320.34 51.0% 01 5 24 SLW 51.0% 16 16.7% 5 1
4457 LEATHER JACKET, WAIS P 398.95 215.62 46.0% 01 59 20 SLW 50.7% 11 16.9% 5 12
4473 FIFTH AVE LTHR JKT R 624.95 306.00 51.0% 01 16 16 SLW 51.0% 3 15.8% 5 3
4425 CLASSIC USAF WAIST M 483.95 290.40 40.0% 01 33 0 MDA 45.2% 7 10.8% 8 4
4431 CYCLE STYLE LTHR WST M 424.95 245.00 42.3% 01 10 0 MDA 44.8% 12 0.0% 99 0
4451 NYY BASEBALL LTHR M 335.95 180.50 46.3% 01 28 0 MDA 47.7% 9 6.7% 14 2
4460 FIELD JACKET LTHR M 305.95 164.00 46.4% 01 29 0 MDA 48.2% 10 6.5% 15 2
4476 LTHR HIP LENGTH JKT M 447.95 258.00 42.4% 01 34 0 MDA 45.1% 6 8.1% 11 3
4476W LTHR/WOOL HIP LNGTH J M 488.95 282.00 42.3% 01 16 0 MDA 46.1% 8 5.9% 16 1
4421 DUSTER LTHR LNG COAT R 638.95 295.16 53.8% 01 12 12 NSL 41.9% 6 0.0% 99 0
4437 STADIUM COAT LTHR/WOOL R 599.95 293.65 51.1% 01 22 0 NSL 40.0% 9 0.0% 99 0
4455 LADIES ¾ LTHR COAT P 507.95 275.50 45.8% 01 19 0 NSL 49.5% 13 0.0% 99 0
------ ----- ------ -------
TOTAL Department: 711 246 14.7% 123
TOTAL Vendor: 711 246 14.7% 123
TOTAL Location: 711 246 14.7% 123
Optimization Report Objective:
Find out the Style Status for
items in Dept 03, Class 07.
Sort by the Exception Criteria.
Base the rankings on the prior
week’s sales.
1
2
3
1
2
2
3
3
The Marg % column reflects the Margin during the 1 Week Prior, the
Main Marg reflects the Margin from the time the item was first received.
The Exception Status of the Items is shown in the Exc Cod column. FST indicates
Fast Sellers, SLW Slow sellers, MDA is Markdown Again and NSL indicates No Sales.

Section 1, Sales Report Generator Merchant Technologies (800) 395-8324
Page 1.28
Run Date 9/17/02 S T Y L E S T A T U S R E P O R T Page 1
Run Time 1:22 PM Merchant Technologies User JW
Location: 01 Merchant Technologie
Vendor: TAYLOR TAYLOR'S LEATHERWEAR
Department: 03 JACKETS
Vendor Item R Current Mrg On On Exc Main Wks Sell Wks
Reference Description C Retail Cost % Loc Hand Order Cod Marg Rec Thru Supp Sales
--------- ----------- - ------- ---- --- --- ---- ----- --- ---- --- ---- ---- -----
4412 PASSAIC LTHR JKT M 330.95 189.00 42.9% 01 22 16 FST 48.9% 14 35.3% 2 12
4415 LTHR CAR COAT R 547.95 253.00 53.8% 01 18 12 FST 53.8% 5 25.0% 3 6
4420 CLASSIC CUT LTHR JKT R 540.95 249.75 53.8% 01 35 12 FST 53.8% 5 18.6% 4 8
4420L CLASSIC LTHR JKT LONG R 614.95 295.00 52.0% 01 21 24 FST 52.0% 6 22.2% 4 6
4441 NASHVILLE P.D. LEATH M 457.95 264.00 42.4% 01 34 12 FST 48.6% 3 34.6% 2 18
4465 LEATHER HIDDEN AGEND R 608.95 298.00 51.1% 01 31 20 FST 51.1% 8 20.5% 4 8
4469 FULL LENGTH LEATHER R 577.95 266.95 53.8% 01 52 0 FST 53.8% 3 17.5% 5 11
---- ----- ----- -----
TOTAL Exception: 213 96 24.5% 69
4412L PASSAIC LTHR JKT LONG R 491.95 227.05 53.8% 01 105 0 SLW 53.8% 3 8.7% 11 10
4417 CLEVELAND STY. JACKE P 501.95 272.46 45.7% 01 23 24 SLW 50.3% 8 17.9% 5 5
4418 CHICAGO/MIL. STYLE L R 392.95 179.55 54.3% 01 50 0 SLW 54.3% 2 12.3% 7 7
4422 MEMPHIS STYLE LTHR P 493.95 268.16 45.7% 01 37 12 SLW 51.1% 11 9.8% 9 4
4422L MEMPHIS STYLE LTHR LNG R 653.95 320.34 51.0% 01 5 24 SLW 51.0% 16 16.7% 5 1
4457 LEATHER JACKET, WAIS P 398.95 215.62 46.0% 01 59 20 SLW 50.7% 11 16.9% 5 12
4473 FIFTH AVE LTHR JKT R 624.95 306.00 51.0% 01 16 16 SLW 51.0% 3 15.8% 5 3
---- ----- ----- -----
TOTAL Exception: 295 138 12.5% 42
4425 CLASSIC USAF WAIST M 483.95 290.40 40.0% 01 33 0 MDA 45.2% 7 10.8% 8 4
4431 CYCLE STYLE LTHR WST M 424.95 245.00 42.3% 01 10 0 MDA 44.8% 12 0.0% 99 0
4451 NYY BASEBALL LTHR M 335.95 180.50 46.3% 01 28 0 MDA 47.7% 9 6.7% 14 2
4460 FIELD JACKET LTHR M 305.95 164.00 46.4% 01 29 0 MDA 48.2% 10 6.5% 15 2
4476 LTHR HIP LENGTH JKT M 447.95 258.00 42.4% 01 34 0 MDA 45.1% 6 8.1% 11 3
4476W LTHR/WOOL HIP LNGTH J M 488.95 282.00 42.3% 01 16 0 MDA 46.1% 8 5.9% 16 1
---- ----- ----- -----
TOTAL Exception: 150 0 7.4% 12
4421 DUSTER LTHR LNG COAT R 638.95 295.16 53.8% 01 12 12 NSL 41.9% 6 0.0% 99 0
4437 STADIUM COAT LTHR/WOOL R 599.95 293.65 51.1% 01 22 0 NSL 40.0% 9 0.0% 99 0
4455 LADIES ¾ LTHR COAT P 507.95 275.50 45.8% 01 19 0 NSL 49.5% 13 0.0% 99 0
---- ----- ----- -----
TOTAL Exception: 53 12 0.0% 0
------ ----- ------ -------
TOTAL Department: 711 246 14.7% 123
TOTAL Vendor: 711 246 14.7% 123
TOTAL Location: 711 246 14.7% 123
Optimization ReportThis version of the Style
Status Report is printed in a
way that provides Sub-Totals
by Exception Status.

Section 1, Sales Report Generator Merchant Technologies (800) 395-8324
Page 1.29
Run Date 6/11/03 P E R F O R M A N C E S U M M A R Y R E P O R T Page 1
Run Time 11:43 AM Merchant Technologies User JW
[SELECT OPTIONS] Sort (1-8) +A=Alpha Sort: 2 <1>=Dep/Cls <2>=Vn <3>=Dep <4>=Vn/Dep <5>=Mfg <6>=Cat<7>=Dep/Cls/Vn<8>=Dep/Vn
Region Code: ALL
Location Code: 01
Vendor Code: LEVIS
Manuf Code: ALL
Department Code: ALL
Class Code: ALL
Category Code: ALL
Item Code: ALL
Season Code: ALL
Period (mmyy): 4/03 to 6/03
Item Detail (1/2)? 2 <1>=Totals Only, <2>=Item Detail
Location Format (1/2/3)? 1 <1>=Separate Report by Location, <2>=Location Comparison, <3>=Consolidated
Data Type (1/2/3)? 1 <1>=Units, <2>=Cost, <3>=Retail
Deleted Items (Y/N)? Y
Page Breaks (Y/N)? N <N>=No Page Break on Dept, Vendor, Manuf or Category (Depending on Sort)
Print Vendor Ref (Y/N)? Y
Location: 01 MERCHANT TECHNOLOGIES
-- Unit Analysis -- -- Percentage Analysis –
Item Item R On On On On Sell Weeks
Code Description C Loc Hand Order Sales Hand Order Sales Thru Supply
---- ----------- - ---- ---- ----- ----- ---- ----- ----- ---- ------
Vendor: LEVIS LEVI STRAUSS
501 LEVI'S 501 JEANS Reg 225 19 427 7% 25% 9% 89% 6
501BF LEVI'S 501 BUTTON FLY JEANS Reg 261 15 403 8% 20% 8% 82% 8
505 RF LEVI'S 505 REG FIT JEANS Reg 226 9 371 7% 12% 7% 88% 7
512 SF LEVI'S 512 SLIM FIT JEANS Reg 233 0 345 7% 0% 7% 86% 8
517 BC LEVI'S 517 BOOT CUT JEANS Reg 190 9 301 6% 12% 6% 95% 8
527 BC LEVI'S 527 LOW RISE BOOT CUT Reg 122 0 195 4% 0% 4% 93% 8
527 SC LEVI'S 529 LOW RISE STR CUT Reg 155 0 226 5% 0% 5% 87% 8
550 RF LEVI'S 550 RELXD FIT JEANS Reg 239 12 429 8% 16% 9% 92% 7
560 CF LEVI'S 560 CMFT FIT JEANS Reg 241 0 398 8% 0% 8% 91% 7
569 LS LEVI'S 569 LOOSE STRT JEANS Reg 71 6 119 2% 8% 2% 88% 7
599 GF LEVI'S 599 GIANT FIT JEANS Reg 165 0 288 5% 0% 6% 93% 7
OUTB LEVI'S OUTBACK JEANS Reg 88 0 116 3% 0% 2% 84% 9
PR-AU LEVI'S PREM AUSTIN JEANS Reg 278 3 445 9% 4% 9% 90% 8
PR-SK LEVI'S PREM SKINNER JEANS Reg 272 0 312 9% 0% 6% 91% 11
T1 RL LEVI'S TYPE 1 REAL LOOSE Reg 192 0 287 6% 0% 6% 92% 8
T1 STR LEVI'S TYPE 1 STRAIGHT Reg 182 3 301 6% 4% 6% 90% 7
------ ----- ----- --- --- --- --- ----
TOTAL Vendor: 3140 76 4963 100% 100% 100% 88% 8
TOTAL Location: 18927 812 26572 17% 9% 19% 77% 13
Performance Summary ReportObjective:
Print a report to compare the
Sales Performance of all the
styles of Levi’s Jeans.
Display Quantity on Hand,
On Order and Sales in Units
and as a Percentage.
Include information for April
through June, 2003.
1
2
3
1
22
3
The numbers in
the Weeks
Supply column
are based on the
Qty on Hand and
on Order divided
by the average
Sales per Week
for the Date
Range specified.
On this report the Data
and Percentage
Analysis are done by
Sales Units. They can
also be given in Cost
or Retail $.
RC or Retail Condition (Regular,
Promo, Markdown) is displayed
for quick reference.
2

Section 1, Sales Report Generator Merchant Technologies (800) 395-8324
Page 1.30
Run Date 5/08/03 G M R O I C O M P A R A T I V E R E P O R T Page 1
Run Time 5:00 PM Merchant Technologies User JW
[SELECT OPTIONS] Sort (1-6) +A=Alpha Sort: 1 <1>=Dep/Cls/Item<2>=Vend/Ref<3>=Dep/Item<4>=Ven/Dep/Ref<5>=Man<6>=Cat
Region Code: ALL
Location Code: 01
Vendor Code: LEVIS
Manuf Code: ALL
Department Code: 21
Class Code: 01
Category Code: ALL
Item Code: ALL
Sales Period 1 (mmyy): 4/03 to 4/03
Sales Period 2 (mmyy): 5/03 to 5/03
Item Detail (1/2/3)? 2 <1>=Totals Only, <2>=Item Detail, <3>=Sub-Item Detail
Location Format (1/2/3)? 1 <1>=Separate Rept by Loc, <2>=Location Comparison, <3>=Consolidated
…
Print Vendor Ref (Y/N)? Y
Location: 01 Merchant Technologies
---- 4/03 to 4/03 ---- ---- 5/03 to 5/03 ----
Item Item On On Gross Inv GM Gross Inv GM
Code Description Hand Ord Marg$ Cost ROI Marg$ Cost ROI
---- ----------- ---- --- ----- ---- --- ----- ---- ---
Department: 21 MEN'S PANTS
Class: 01 JEANS
501 LEVI'S 501 JEANS 83 149 4272 3757 1.14 3266 2958 1.10
501BF LEVI'S 501 BUTTON FLY JEANS 128 138 4308 3935 1.09 2836 3519 .81
505 RF LEVI'S 505 REG FIT JEANS 132 98 4648 3791 1.23 2673 3383 .79
512 SF LEVI'S 512 SLIM FIT JEANS 133 81 4548 3969 1.15 2334 3255 .72
517 BC LEVI'S 517 BOOT CUT JEANS 131 62 3730 3655 1.02 2214 3170 .70
527 BC LEVI'S 527 LOW RISE BOOT CUT 79 43 2534 2252 1.13 1550 1972 .79
527 SC LEVI'S 529 LOW RISE STR CUT 115 40 3247 2635 1.23 1487 2558 .58
550 RF LEVI'S 550 RELXD FIT JEANS 146 97 5824 5139 1.13 3079 4170 .74
560 CF LEVI'S 560 CMFT FIT JEANS 122 119 5048 4807 1.05 3289 3809 .86
569 LS LEVI'S 569 LOOSE STRT JEANS 46 27 1434 1697 .85 1033 1399 .74
599 GF LEVI'S 599 GIANT FIT JEANS 104 61 4377 3690 1.19 2087 3085 .68
OUTB LEVI'S OUTBACK JEANS 65 23 1668 1710 .98 878 1700 .52
T1 STR LEVI'S TYPE 1 STRAIGHT 110 73 4624 4375 1.06 2110 3375 .63
T1 RL LEVI'S TYPE 1 REAL LOOSE 132 60 4041 4611 .88 2402 3988 .60
PR-SK LEVI'S PREM SKINNER JEANS 160 112 4478 6105 .73 2993 4895 .61
PR-AU LEVI'S PREM AUSTIN JEANS 177 102 7304 6699 1.09 3329 5423 .61
---- ---- ------ ------ ----- ------ ------ -----
TOTAL Class: 1863 1285 66092 62830 1.05 37566 52662 .71
TOTAL Department: 1863 1285 66092 62830 1.05 37566 52662 .71
TOTAL Location: 1863 1285 66092 62830 1.05 37566 52662 .71
Gross Margin Return on Investment Report
Objective:
Print a report to view the Gross
Margin Return on Investment
(GMROI) for Levi’s Jeans.
View GMROI Data for April and
May, 2003.
Include current Quantity on
Hand and Quantity on Order.
1
2
3
The Gross Margin Return on Investment Report, or GMROI, relates Inventory Cost Dollars
to Gross Margin Dollars, or, how many dollars are being made for every dollar in Inventory.
1
1
23
2
The GMROI column
contains the amount of
Gross Margin compared to
each dollar in Inventory.
The Inv Cost
column is the
average of the
Beginning and
Ending
Inventory.