Mental Health Evidence Based Practices (EBPs) in ... · Mental Health Evidence Based Practices...
65
Mental Health Evidence Based Practices (EBPs) in Washington State The 2007 Evidence-Based Practices (EBP) Survey Mental Health Evidence Based Practices (EBP) in Washington State Dennis McBride, PhD; Survey Director William Voss, PhD; Research Associate Heather Mertz, PhD; Research Associate Terri Villanueva; Research Assistant Genevieve Smith; Research Assistant The Washington Institute for Mental Illness Research and Training - Western Branch 253/756-2741 University of Washington School of Medicine Department of Psychiatry and Behavioral Sciences
Transcript of Mental Health Evidence Based Practices (EBPs) in ... · Mental Health Evidence Based Practices...
Mental Health Evidence Based Practices (EBPs) in Washington State
The 2007 Evidence-Based Practices (EBP) Survey
Mental Health Evidence Based Practices (EBP) in Washington State
Dennis McBride, PhD; Survey Director
William Voss, PhD; Research Associate
Heather Mertz, PhD; Research Associate
Terri Villanueva; Research Assistant
Genevieve Smith; Research Assistant
The Washington Institute for Mental Illness Research and Training - Western Branch 253/756-2741
University of Washington School of Medicine Department of Psychiatry and Behavioral Sciences

Table of Contents
Acknowledgement .................................................................................................................iv
Executive Summary ...............................................................................................................v
Introduction............................................................................................................................1
Defining Evidence Based Practices .......................................................................................2
Methodology..........................................................................................................................5
Developing the Survey Instrument ............................................................................5
Selecting Participants.................................................................................................5
Conducting the Survey...............................................................................................8
Response Rate............................................................................................................10
Representativeness.....................................................................................................11
Findings..................................................................................................................................11
Data Considerations and Limitations.........................................................................13
Agency Characteristics ..............................................................................................14
Utilization of EBPs ....................................................................................................19
Fidelity .......................................................................................................................24
Training......................................................................................................................26
EBP Target Population ..............................................................................................28
EBP Implementation Success ....................................................................................30
Effectiveness of EBPs................................................................................................32
Future EBP Utilization...............................................................................................34
Barriers.......................................................................................................................37
Most Needed Assistance in Adopting EBPs..............................................................39
Populations Served by No Known EBPs ...................................................................41
Interest in EBP Implementation.................................................................................43
Initiatives to Promote EBPs .......................................................................................45
Systematic Assessment of Effects of EBPs ...............................................................47
Annual Client Counts.................................................................................................49
Client Counts by EBP ................................................................................................51
Respondent Average Number of years at Agency.....................................................53
i
List of Tables and Figures
Tables Table 1. Timeline for distribution of survey materials and contacts ...........................8
Table 2. Number of Eligible Agencies that Completed the Survey by DSHS Division/Administration ................................................................................10
Table 3. Average Number of EBPs Offered Per Site By Agency Type ......................23
Table 4. Number and Percent of EBPs Offered Per Site By Agency Type .................23
Figures
Figure 1. Agency Characteristics: Services Offered by DSHS Administration............16
Figure 2. Agency Characteristics: Solo Practice by DSHS Administration..................17
Figure 3. Agency Characteristics: Service Population..................................................18
Figure 4a1. Utilization of EBPs by MHD and DASA ......................................................21
Figure 4a2. Utilization of EBPs by JRA and CA..............................................................22
Figure 4b. EBP Fidelity...................................................................................................25
Figure 5. Training in EBP Utilization ...........................................................................27
Figure 6. Target Populations .........................................................................................29
Figure 7. EBP Implementation Success ........................................................................31
Figure 8. Effectiveness of EBPs....................................................................................33
Figure 9a. Future EBP Utilization by MHD and DASA Agencies.................................35
Figure 9b. Future EBP Utilization by JRA and CA Agencies ........................................36
Figure 10. Barriers...........................................................................................................38
Figure 11. Most Needed Assistance to Adopt EBPs .......................................................40
Figure 12a. Populations Served by No Known EBP.........................................................42
Figure 13. Interest in EBP Implementation.....................................................................44
Figure 14. Initiatives to Promote EBPs ...........................................................................46
Figure 15. Systematic Assessment of Effects of EBPs ...................................................48
Figure 16. Annual Client Count ......................................................................................50
Figure 17. Client Counts by EBP ....................................................................................52
Figure 18. Respondent Average Number of years at Agency.........................................54
ii
List of Appendices
Appendix A. Transformation Granted States and Evidence-Based Practices (Compiled February 2007) Appendix B. Evidenced Based Practices Selection Criteria and Definitions
Part 1a. Matrix of Practices by Administration Types and Rating Sources
Part 1b. Rating System Definition
Part 1c. References
Part 2. Evidence Based Practices Inclusion Criteria
Part 3. Evidence Based Practices Definitions Appendix C. Evidence-Based Practices Survey Instrument Appendix D. Maps: Completions/Non-Completions By Agency Type Appendix E. Tables Appendix F. “Other” Responses Appendix G. Fidelity Measures/Methods Used
iii

Acknowledgement The authors would like to thank the literally hundreds of people that contributed to the success of
this project. First, we would like to thank our funders, specifically the Washington State Mental
Health Transformation Project, the Mental Health Division (MHD), and the Division of Alcohol
and Substance Abuse (DASA). Without their support, this project would not have been possible.
The 2007 EBP Survey originated with and was developed by the Evaluation Task Group, which
is comprised of mental health consumers, family members, social scientists, and Department of
Social and Health Services (DSHS) administrators. We want to thank all of our colleagues who
are members of the Task Group as well as non-members, such as Mark Snowden and Kate
Comtois, and Susan Bullerdick, who participated in various phases of this project. Finally, we
would like to thank everyone who took the time and effort to complete the survey. The survey
respondents are key personnel in the fields of mental health, chemical dependency, juvenile
rehabilitation, and children’s services. We are particularly thankful to staff at the Juvenile
Rehabilitation Administration (JRA), the Children’s Administration (CA), and DASA for
assistance with obtaining data from their agencies.
iv

Executive Summary The current project is part of Washington State’s Mental Health Transformation effort and was
developed to identify and assess the utilization of mental health “Evidence Based Practices”
(EBPs) in Washington State. To conduct this assessment a survey was administered to providers
of publically funded social services. The Mental Health Division (MHD), the Division of
Alcohol and Substance Abuse (DASA), the Juvenile Rehabilitation Administration (JRA), and
the Children’s Administration (CA) all participated in the survey. The intent of the survey is to
inform state policymakers, providers, consumers, and other stakeholders about the current status
of mental health EBP implementation in Washington State. Results are intended to directly
inform planning and programming efforts, as well as serve as a baseline for tracking EBP
implementation in the future.1
Defining Evidence Based Practices
Selecting EBPs to include in the survey was an iterative process that involved multiple
stakeholders, including mental health consumers, family members, researchers, and service
providers. A literature search uncovered nearly 350 practices that were classified as being either
a “true” evidence based practice, a promising practice, or an emerging practice. A “decision
rule” involving nine key sources containing definitions and rating criteria for mental health EBPs
was used to identify which of these would be considered evidence based practices for this
assessment. The decision rule was based upon the number of times the practice was endorsed by
each of the nine sources, the level of research support that each practice received, and whether or
not the practice was currently offered in Washington State. From these criteria, 34 EBPs were
selected and included in the survey.
1 Funding for this report was made possible by the Mental Health State Incentive Grant Award No. 6 U79 SM57648 from the Substance Abuse and Mental Health Services Administration (SAMHSA). The views expressed in this reports do not necessarily reflect the official policies of the Department of Health and Human Services or agencies of the State of Washington; nor does mention of trade names, commercial practices, or organizations imply endorsement by the U.S. Government or Washington State.
v

The Survey Instrument
The same iterative process used for identifying EBPs also was used to identify items for the
instrument, and involved multiple stakeholders, including mental health consumers, family
members, researchers, service providers, and administrators. In addition to agency characteristics
the survey asked about each agency’s utilization of EBPs, the agency’s target population, if
fidelity is measured, if training is offered and from where, how successful the implementation of
EBPs has been, what barriers have been encountered, how effective EBPs have been in
improving client outcomes, how interested the agency is in continuing/beginning to use EBPs,
what initiatives have been used to promote EBPs, and what are the agency’s client counts overall
in 2007 as well as how many clients received each EBP.
Survey Participants
Provider agencies funded by the Mental Health Division (N = 156), Division of Alcohol and
Substance Abuse (N = 239), Children’s Administration (N = 15), and Juvenile Rehabilitation
Administration (N = 17) were contacted to participate in the survey. Of the 427 eligible provider
agencies in the sample universe, 281 agencies completed the survey, yielding a 65.8% response
rate across all four DSHS Division/Administrations: Mental Health Division (N = 96, 61.5%),
Division of Alcohol and Substance Abuse (N = 154, 64.4%), Children’s Administration (N = 14,
93.3%), and Juvenile Rehabilitation Administration (N = 17, 100%). Agency providers
themselves completed the survey in both MHD and DASA. To reduce the administrative burden
on provider agencies within the Children’s Administration (CA) and Juvenile Rehabilitation
Administration (JRA), surveys were not sent to each of the individual agencies but instead were
completed by staff members working directly for JRA and CA.
Selected Findings
Service Provision
o Most agencies (88%) provide intake, assessment, and referral services. While 92% of the
MHD agencies indicated that they provide mental health services, less than half of the
other agencies provide mental health services (DASA = 42%, JRA = 29%, CA = 14%).
o Half of the agencies in MHD and DASA offer Co-Occurring Disorder (COD) treatment.
vi
Utilizing Evidenced Based Practices
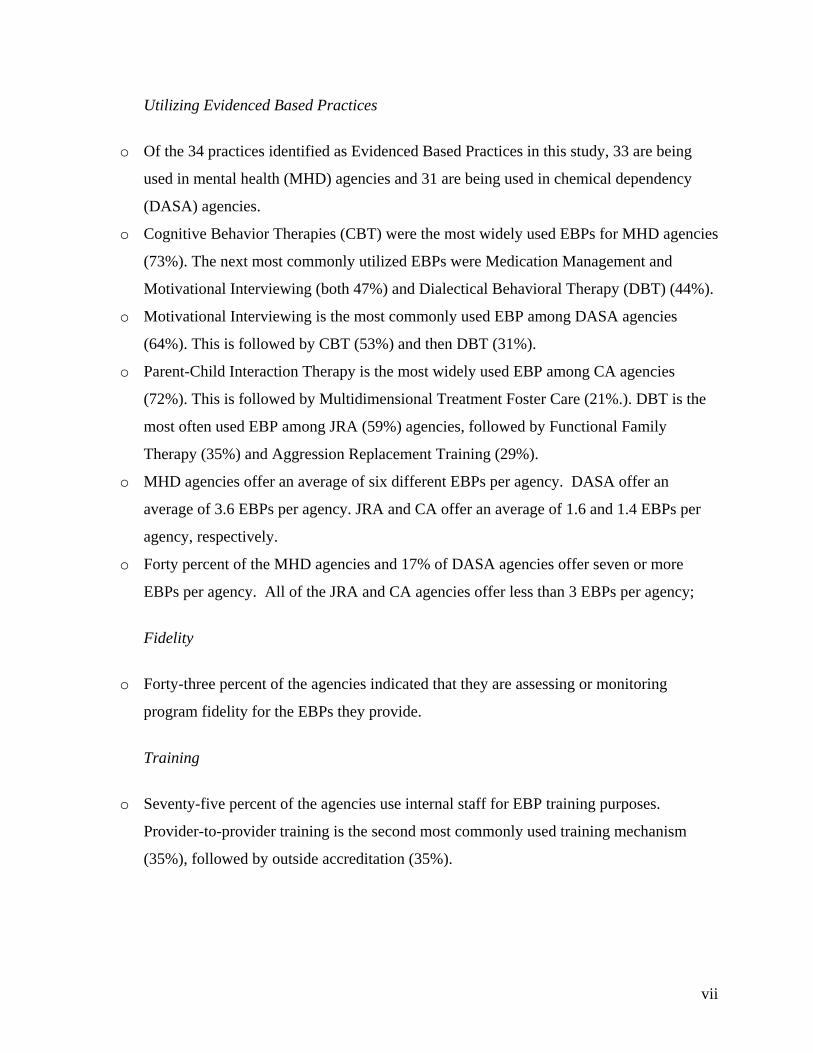
o Of the 34 practices identified as Evidenced Based Practices in this study, 33 are being
used in mental health (MHD) agencies and 31 are being used in chemical dependency
(DASA) agencies.
o Cognitive Behavior Therapies (CBT) were the most widely used EBPs for MHD agencies
(73%). The next most commonly utilized EBPs were Medication Management and
Motivational Interviewing (both 47%) and Dialectical Behavioral Therapy (DBT) (44%).
o Motivational Interviewing is the most commonly used EBP among DASA agencies
(64%). This is followed by CBT (53%) and then DBT (31%).
o Parent-Child Interaction Therapy is the most widely used EBP among CA agencies
(72%). This is followed by Multidimensional Treatment Foster Care (21%.). DBT is the
most often used EBP among JRA (59%) agencies, followed by Functional Family
Therapy (35%) and Aggression Replacement Training (29%).
o MHD agencies offer an average of six different EBPs per agency. DASA offer an
average of 3.6 EBPs per agency. JRA and CA offer an average of 1.6 and 1.4 EBPs per
agency, respectively.
o Forty percent of the MHD agencies and 17% of DASA agencies offer seven or more
EBPs per agency. All of the JRA and CA agencies offer less than 3 EBPs per agency;
Fidelity
o Forty-three percent of the agencies indicated that they are assessing or monitoring
program fidelity for the EBPs they provide.
Training
o Seventy-five percent of the agencies use internal staff for EBP training purposes.
Provider-to-provider training is the second most commonly used training mechanism
(35%), followed by outside accreditation (35%).
vii
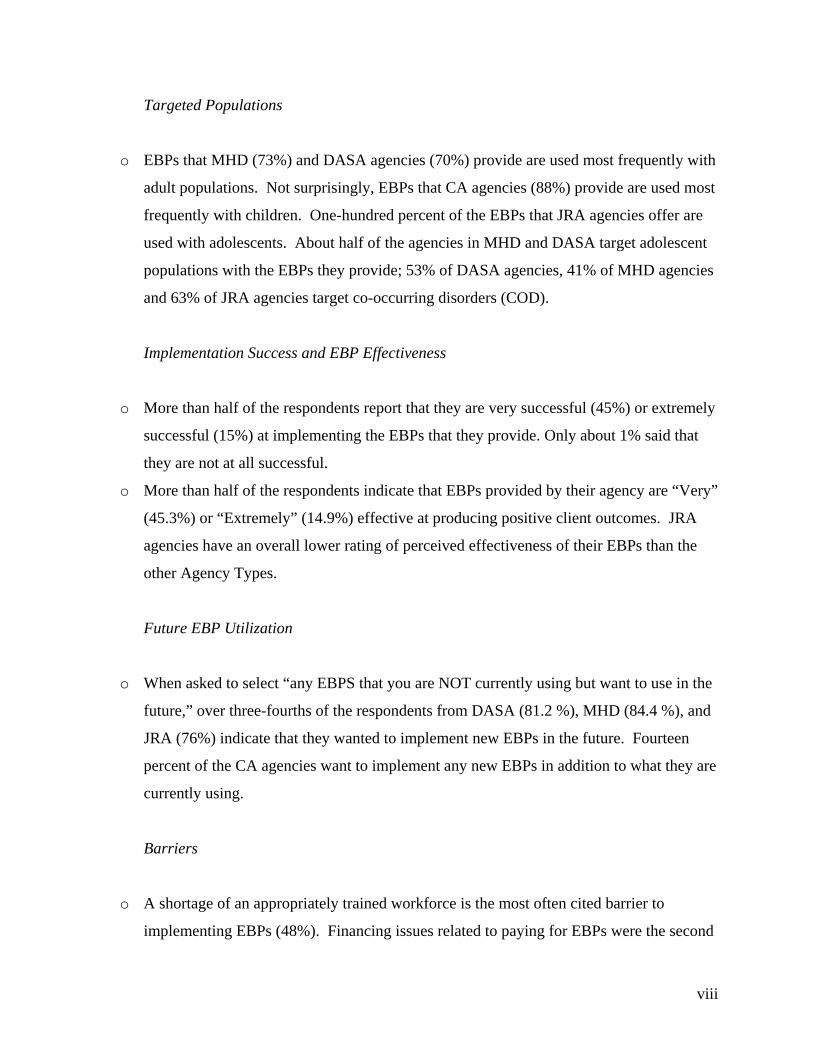
Targeted Populations
o EBPs that MHD (73%) and DASA agencies (70%) provide are used most frequently with
adult populations. Not surprisingly, EBPs that CA agencies (88%) provide are used most
frequently with children. One-hundred percent of the EBPs that JRA agencies offer are
used with adolescents. About half of the agencies in MHD and DASA target adolescent
populations with the EBPs they provide; 53% of DASA agencies, 41% of MHD agencies
and 63% of JRA agencies target co-occurring disorders (COD).
Implementation Success and EBP Effectiveness
o More than half of the respondents report that they are very successful (45%) or extremely
successful (15%) at implementing the EBPs that they provide. Only about 1% said that
they are not at all successful.
o More than half of the respondents indicate that EBPs provided by their agency are “Very”
(45.3%) or “Extremely” (14.9%) effective at producing positive client outcomes. JRA
agencies have an overall lower rating of perceived effectiveness of their EBPs than the
other Agency Types.
Future EBP Utilization
o When asked to select “any EBPS that you are NOT currently using but want to use in the
future,” over three-fourths of the respondents from DASA (81.2 %), MHD (84.4 %), and
JRA (76%) indicate that they wanted to implement new EBPs in the future. Fourteen
percent of the CA agencies want to implement any new EBPs in addition to what they are
currently using.
Barriers
o A shortage of an appropriately trained workforce is the most often cited barrier to
implementing EBPs (48%). Financing issues related to paying for EBPs were the second
viii
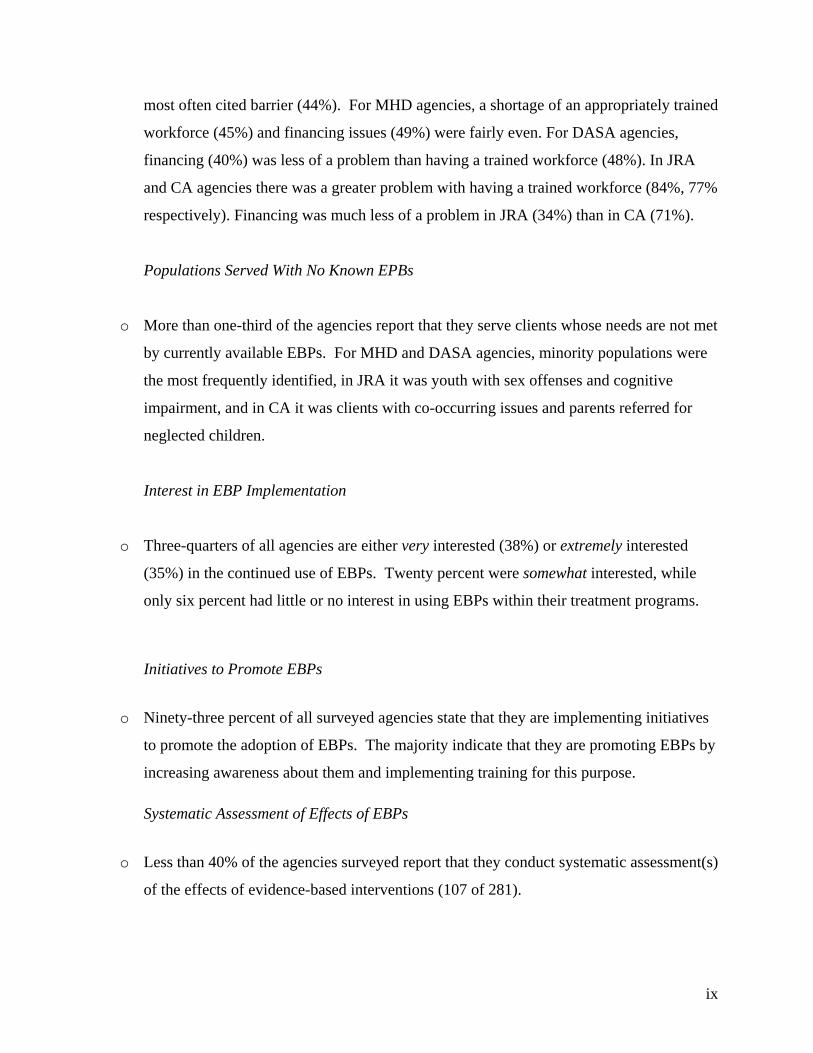
most often cited barrier (44%). For MHD agencies, a shortage of an appropriately trained
workforce (45%) and financing issues (49%) were fairly even. For DASA agencies,
financing (40%) was less of a problem than having a trained workforce (48%). In JRA
and CA agencies there was a greater problem with having a trained workforce (84%, 77%
respectively). Financing was much less of a problem in JRA (34%) than in CA (71%).
Populations Served With No Known EPBs
o More than one-third of the agencies report that they serve clients whose needs are not met
by currently available EBPs. For MHD and DASA agencies, minority populations were
the most frequently identified, in JRA it was youth with sex offenses and cognitive
impairment, and in CA it was clients with co-occurring issues and parents referred for
neglected children.
Interest in EBP Implementation
o Three-quarters of all agencies are either very interested (38%) or extremely interested
(35%) in the continued use of EBPs. Twenty percent were somewhat interested, while
only six percent had little or no interest in using EBPs within their treatment programs.
Initiatives to Promote EBPs
o Ninety-three percent of all surveyed agencies state that they are implementing initiatives
to promote the adoption of EBPs. The majority indicate that they are promoting EBPs by
increasing awareness about them and implementing training for this purpose.
Systematic Assessment of Effects of EBPs
o Less than 40% of the agencies surveyed report that they conduct systematic assessment(s)
of the effects of evidence-based interventions (107 of 281).
ix
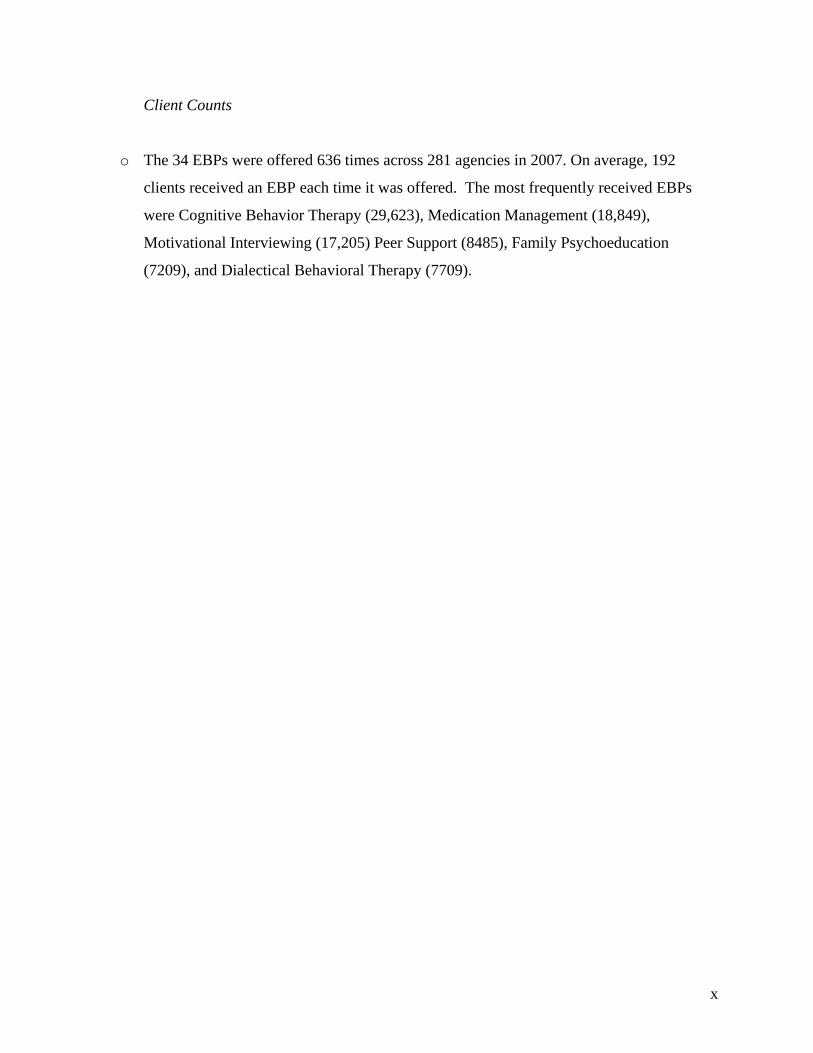
Client Counts
o The 34 EBPs were offered 636 times across 281 agencies in 2007. On average, 192
clients received an EBP each time it was offered. The most frequently received EBPs
were Cognitive Behavior Therapy (29,623), Medication Management (18,849),
Motivational Interviewing (17,205) Peer Support (8485), Family Psychoeducation
(7209), and Dialectical Behavioral Therapy (7709).
x

Introduction
In October 2005, Washington State was one of seven states awarded a Mental Health
Transformation State Incentive Grant from the Substance Abuse and Mental Health Services
Administration, Center for Mental Health Services (SAMHSA/CMHS). The grants are intended
to support infrastructure and service delivery changes that will advance the goals of the final
report of the President’s New Freedom Commission on Mental Health (NFC) and lead to the
development of systems and services that facilitate recovery and resilience among youth,
families and adults. To help assess this effort, an Evaluation Task Group was put in place that
consists of a team of researchers and consumers from the state’s Department of Social and
Health Services (DSHS), the University of Washington, and the Washington Institute for Mental
Illness: Research and Training (WIMIRT).
One objective of the Evaluation Task Group is to identify and assess the utilization of mental
health “Evidence Based Practices” (EBPs) in Washington State. To conduct this assessment, a
survey was administered to providers of publically funded social services. The Mental Health
Division (MHD), the Division of Alcohol and Substance Abuse (DASA), the Juvenile
Rehabilitation Administration (JRA), and the Children’s Administration (CA) all participated in
the survey. This is a report of the findings of the survey.
To conduct the survey, the Mental Health Transformation Project contracted with the
Washington Institute for Mental Illness: Research and Training (WIMIRT) to develop and
administer an “online” survey. The intent of the survey is to inform state policymakers,
providers, consumers, and other stakeholders about the current status of mental health EBP
implementation in Washington State. Results are intended to directly inform planning and
programming efforts, as well as serve as a baseline for tracking EBP implementation in the
future.
To begin our inquiry, a literature search was conducted that resulted in two products. The first
was a table showing the Transformation activities of nine states that received Transformation
grants from SAMHSA. Included were the individual states’ transformation priorities, evaluation
1

approach, and most relevant to our purposes here, an EBP work plan identifying the evidence
based practices recognized by the other states. The table summary appears in Appendix A.
The second product emerging from the literature review was a matrix showing mental health
practices identified in the literature as being either a “true” evidence based practice, promising
practice, or emerging practice. Each practice is cross-referenced by the status of the evidence
(the sources identifying the practice as being evidence based) and information about the
practice’s use in Washington. In addition to the matrix, rating system definitions and references
are included. The matrix is used as a basis for categorizing and tracking EBP use in the state as
well as an initial “wide net” of practices for use in developing survey materials. This matrix
served as a starting point for the development of the survey and appears in Appendix B. We
begin by describing how the evidence based practices were identified and selected for the survey.
We then move on to describing the development of the survey as to what information was
wanted about EBPs in the state, describe the survey method, and, finally, to the findings.
Defining Evidence Based Practices
The concept and general guidelines for developing and conducting the EPB survey were
identified by the Evaluation Task Group. Selecting EBPs to include in the survey was a complex
and iterative process that involved multiple stakeholders, including mental health consumers,
family members, researchers, and service providers.
The literature search uncovered nearly 350 practices that were classified as being either a “true”
evidence based practice, promising practice, or emerging practice (see Appendix B). A
mechanism or “decision rule” needed to be made to identify which of these would be considered
true “evidence based practices” for the purposes of this assessment. We started with the Institute
of Medicine (2001) which offers the most widely used definition:
Evidenced based practice is the integration of best research evidence with clinical expertise and patient values. Best research evidence refers to clinically relevant research, often from the basic health and medical sciences, but especially from patient-centered clinical research into the accuracy and precision of diagnostic tests (including the clinical examination); the power of prognostic markers; and the efficacy and safety of therapeutic, rehabilitative, and preventive regimens. Clinical expertise means the ability to use clinical skills and past expertise to rapidly identify each
2

patient’s unique health state and diagnosis, individual risks, and benefits of potential interventions, and personal values and expectations. Patient values refers to the unique preferences, concerns, and expectations that each patient brings to a clinical encounter and that must be integrated into clinical decisions if they are to serve the patient. .2
A more abbreviated version is identified by Drake and colleagues (2005): “Evidenced Based
Practices – means employing clinical interventions that research has shown to be effective in
helping consumers recover and achieve goals.”3
Roberts and Yeager (2004) identified four “Levels of Evidence.”4 The level of evidence
indicates the degree to which the practice has been tested; 1 meeting the highest standard, 4
meeting the lowest:
Level Description
1 Meta-analysis or replicated randomized controlled trials (RCT) that include a placebo condition/control trial or are from well-designed cohort or case control analytic study, preferably from more than one center or research group, or national consensus panel recommendations based on controlled, randomized studies, which are systematically reviewed.
2 At least one RCT with placebo or active comparison condition, evidence obtained from multiple time series with or without intervention, or national consensus panel recommendations base on uncontrolled studies with positive outcomes or based on studies showing dramatic effects of interventions.
3 Uncontrolled trial observational study with 10 or more subjects, opinions of respectful authorities, based on clinical experiences, descriptive studies, or reports of expert consensus.
4 Anecdotal case reports, unsystematic clinical observation, descriptive reports, case studies, and /or single-subject designs.
2 Institute of Medicine (2001). Crossing the Quality Chasm: A New Health System for the 21st Century. Washington, D.C.: National Academy Press. 3 Drake, R. E., Merrens, M. R., & Lynde, D.W. (2005) Evidenced-Based Mental Health Practice. WW Norton & Co. p.67. 4 Roberts, A.R, & Yeager, K. (2004). Systematic reviews of evidence-based studies and practice-based research: How to search for, develop, and use them. In Roberts, A.R. & Yeager, K.R. (Eds.). Evidence-Based Practice Manual: Research and Outcome Measures in Health and Human Services, (pp.3-14). Oxford: Oxford University Press.
3

While these definitions are widely used in the literature, we discovered that the major sources we
identified had varying criteria to classify the evidence base for each practice. As will be seen
below, most of these are similar to the criteria recommended by Roberts and Yeager (2004).
Nine sources were identified that contained definitions and rating criteria for Mental Health
Evidence Based Practices (see Appendix B). These sources were used to select the EBPs for the
survey:
1. WIMIRT Literature Review and Resource Guide on Evidence Based Best and Promising Mental Health Practices;
2. Data Infrastructure Grants (DIGs) (SAMHSA); 3. Tool Kit (SAMHSA); 4. National Registry of Evidence Based Practices (SAMHSA); 5. Model Programs (SAMHSA); 6. Transformation Grant's Evidence/Consensus Based/Promising/Emerging practices
(ECBPEP) Supplemental Report on EBPs; 7. Children's Mental Health EBP Expert Panel report; 8. Alcohol and Drug Institute's (ADAI) EBP database; and 9. Washington State Institute for Public Policy (WSIPP). The decision rule to determine whether a practice qualified for inclusion as a true EBP in this
study was based upon the number of times the practice was endorsed by the nine sources, the
level of research support that each practice received, and whether or not the practice was
currently offered in Washington State. While the rating criteria varied across the 9 sources, each
could be categorized into three general levels: 1= lowest level (e.g., emerging practice); 2=
middle level (promising practice); and 3 = highest level (e.g., evidenced based practice). The
score of each practice was calculated by summing the number of endorsements across the nine
EBP sources (range = 1-9) multiplied by the level of evidence of each practice within each
source (range = 1-3):
Final score = SUM (Number of sources that endorse each EBP X Level of Evidence).
To be included as an EBP in this study a practice had to achieve a minimum score of “5.” In
addition, those practices with scores of 5 or 6 also had to be known to be currently offered in
Washington State. For example, on page B-2 of Appendix B, the third practice listed is Assertive
4
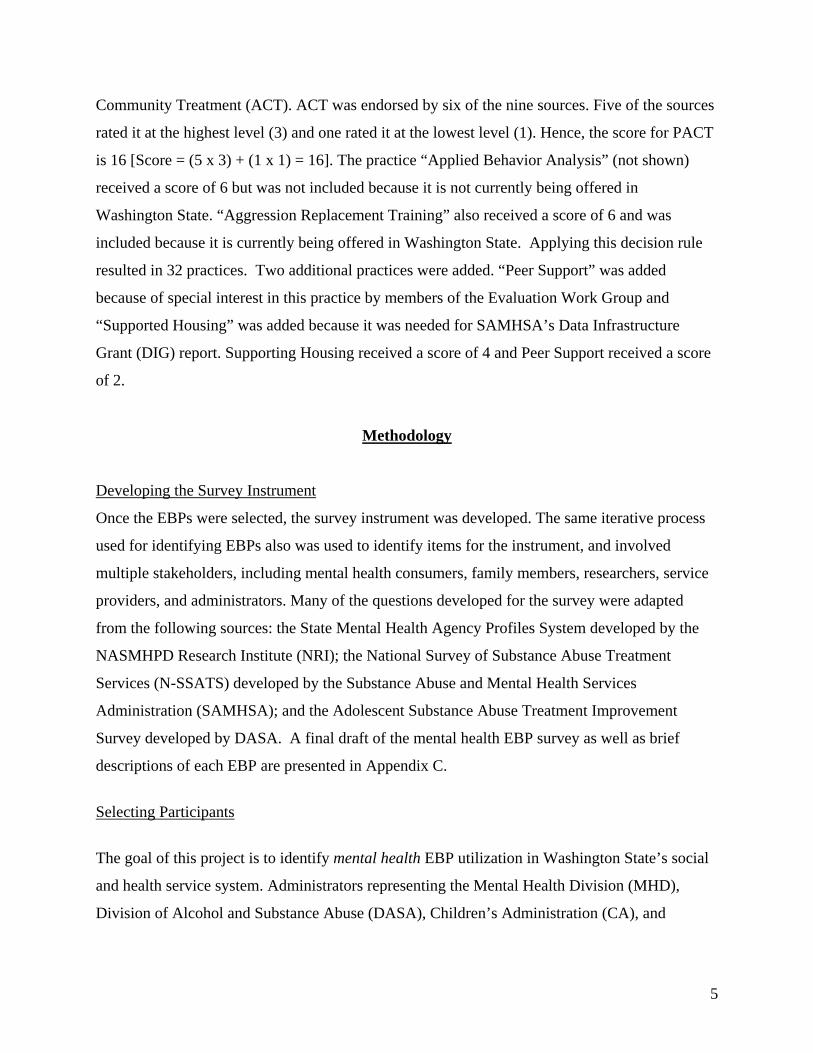
Community Treatment (ACT). ACT was endorsed by six of the nine sources. Five of the sources
rated it at the highest level (3) and one rated it at the lowest level (1). Hence, the score for PACT
is 16 [Score = (5 x 3) + (1 x 1) = 16]. The practice “Applied Behavior Analysis” (not shown)
received a score of 6 but was not included because it is not currently being offered in
Washington State. “Aggression Replacement Training” also received a score of 6 and was
included because it is currently being offered in Washington State. Applying this decision rule
resulted in 32 practices. Two additional practices were added. “Peer Support” was added
because of special interest in this practice by members of the Evaluation Work Group and
“Supported Housing” was added because it was needed for SAMHSA’s Data Infrastructure
Grant (DIG) report. Supporting Housing received a score of 4 and Peer Support received a score
of 2.
Methodology
Developing the Survey Instrument
Once the EBPs were selected, the survey instrument was developed. The same iterative process
used for identifying EBPs also was used to identify items for the instrument, and involved
multiple stakeholders, including mental health consumers, family members, researchers, service
providers, and administrators. Many of the questions developed for the survey were adapted
from the following sources: the State Mental Health Agency Profiles System developed by the
NASMHPD Research Institute (NRI); the National Survey of Substance Abuse Treatment
Services (N-SSATS) developed by the Substance Abuse and Mental Health Services
Administration (SAMHSA); and the Adolescent Substance Abuse Treatment Improvement
Survey developed by DASA. A final draft of the mental health EBP survey as well as brief
descriptions of each EBP are presented in Appendix C.
Selecting Participants
The goal of this project is to identify mental health EBP utilization in Washington State’s social
and health service system. Administrators representing the Mental Health Division (MHD),
Division of Alcohol and Substance Abuse (DASA), Children’s Administration (CA), and
5

Juvenile Rehabilitation Administration (JRA) agreed to use the inventory of MH EBPs.5
“Provider agency” within each Division/Administration is the unit of analysis. Lists of eligible
provider agencies were provided by each of the four Divisions/Administrations: MHD (N =
156); DASA (N = 238); JRA (N = 17); and CA (N = 15). Participant selection in each of the
Divisions/Administrations differed. Each process is described below. It is important to note that
agency providers themselves completed the survey in both MHD and DASA; however, among
CA and JRA agencies, surveys were not sent to each of the individual agencies but instead were
completed by staff members working directly for JRA and CA.
Mental Health Division (MHD)
The list of publically funded mental health agencies (MHD) was compiled from three sources:
1. The Washington State Mental Health Division provided WIMIRT with a list of mental health agencies that were certified and/or licensed to provide mental health services by the Washington State Department of Social and Health Services (DSHS) in 2007.6 Certified agencies included providers that supplied one or more of the following services: (1) inpatient evaluation and treatment; (2) outpatient treatment services; and/or (3) emergency crisis intervention services. Licensed agencies included providers that met minimum standards for one or more of the following types of services: (1) Emergency crisis intervention services; (2) Case management services; (3) Psychiatric treatment, including medication supervision; (4) Counseling and psychotherapy services; (5) Day treatment services; and/or (6) Consumer employment services.
2. A second list was provided by Regional Support Network (RSN) Directors, and included any additional agencies that the RSNs wanted surveyed.
3. The third list was provided by the Eastern Branch of WIMIRT and consisted of 11 Washington State Clubhouses.
From the three lists identified above, 175 agencies were initially selected. This number
decreased as we found out that two agencies were closed or no longer existed and four agencies
were actually duplications of other agencies under different names. Because the focus of this
project was on the implementation of EBPs among publically funded agencies providing direct
treatment services, four agencies were excluded for the following reasons: 1) one agency was a
utilization management company, 2) one agency provided Ombuds services only, 3) one agency
5 Two other Departments, the Department of Corrections (DOC) and the Aging and Disability Services Administration (ADSA), were also considered for inclusion. Including DOC proved to be beyond the scope of this assessment. ADSA was invited to participate but did not provide us with data after several requests. 6 See WAC 388-865-400
6
provided ITA assessment services only, and 4) one agency was a crisis line in Oregon. An
additional nine facilities whose survey responses were “rolled into” another agency’s
characteristics and client counts were also excluded from the agency counts in this report.
These exclusion criteria resulted in 156 agencies that were eligible to complete the survey.
Unless instructed otherwise by administrative staff at the RSN- or mental health agency-level, all
contacts with agencies in the MHD sample were sent to the agency director via email.
Division of Alcohol and Substance Abuse (DASA)
The list of chemical dependency treatment agencies was obtained from DASA and initially
consisted of 266 publicly funded chemical dependency treatment agencies in Washington State.
This number decreased as we learned that nine agencies/programs no longer existed and that the
results of 18 agencies were included or “rolled” into the survey responses of another agency.
Taking these exclusion criteria into account, 239 unduplicated agencies were eligible to complete
the survey. In addition to agency name and location, each of the agencies in the DASA sample
was entered into a database that included the name and email address of an agency contact
person that was selected to complete the survey.
Children’s Administration (CA)
The sample of agencies from CA was obtained from the Children Administration’s Evidence-
Based Programs Manager and included 16 unduplicated agencies. This number decreased to 15
as we learned that EBP utilization and client count information from one CA agency was
included in the survey responses of another agency. In order to reduce the administration burden
on agency staff, the EBP Programs Manager completed a separate survey for each of the eligible
agencies. The CA EBP Program manager was unable to obtain the total number of clients served
in FY2007 by agency and therefore this information is reported.
7
Juvenile Rehabilitation Administration (JRA)
The sample of JRA agencies was obtained from the Clinical Director of JRA and included 17
unduplicated agencies. To reduce the administrative burden on agency staff, staff working
directly for the Juvenile Rehabilitation Administration (JRA) completed separate surveys for
each of the identified agencies.
Conducting the Survey
Survey procedures for the DASA and MHD samples were based upon those recommended by
Dillman (2000) to maximize response rates through multiple contacts.7 He recommends that
potential respondents are contacted by mail or email at least four times, with an additional
“Special” contact (e.g., a telephone call) provided to persistent non-responders. The process and
timeline used to administer the survey for each of the four DSHS Divisions/Administrations is
outlined in Table 1 below. During the data collection phase, WIMIRT personnel were available
by phone and email to answer questions that potential respondents had about the survey.
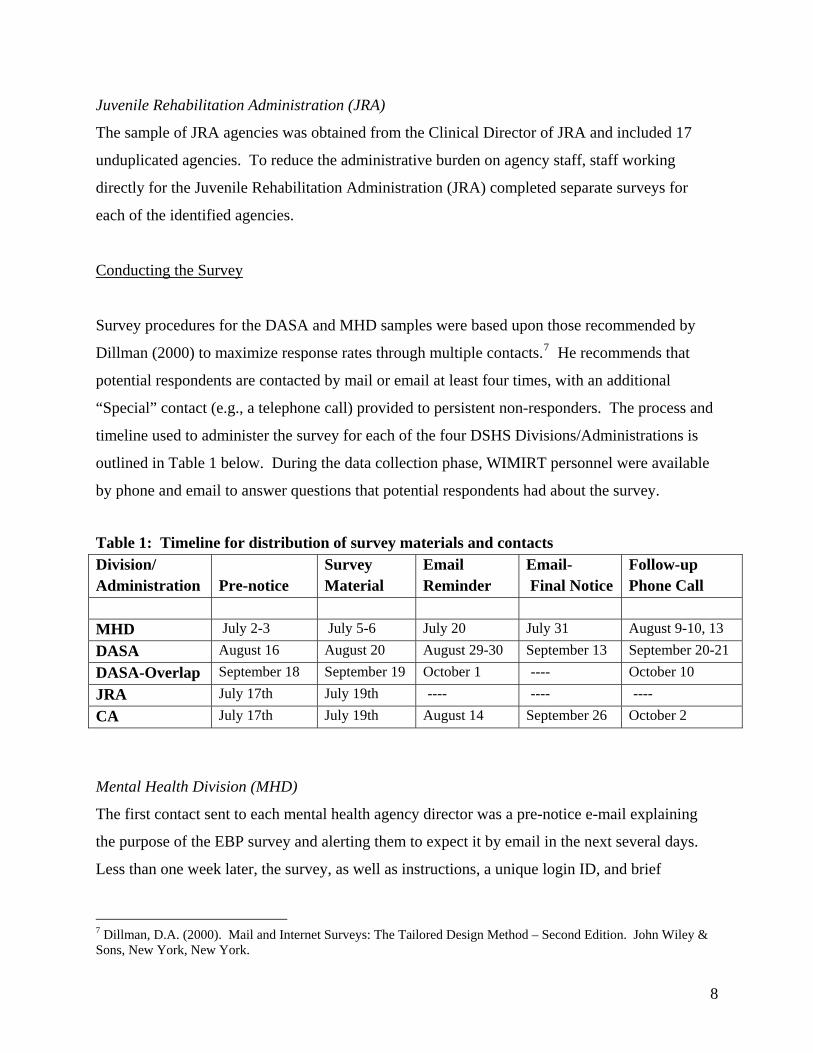
Table 1: Timeline for distribution of survey materials and contacts Division/ Administration
Pre-notice
Survey Material
Email Reminder
Email- Final Notice
Follow-up Phone Call
MHD July 2-3 July 5-6 July 20 July 31 August 9-10, 13 DASA August 16 August 20 August 29-30 September 13 September 20-21 DASA-Overlap September 18 September 19 October 1 ---- October 10 JRA July 17th July 19th ---- ---- ---- CA July 17th July 19th August 14 September 26 October 2
Mental Health Division (MHD)
The first contact sent to each mental health agency director was a pre-notice e-mail explaining
the purpose of the EBP survey and alerting them to expect it by email in the next several days.
Less than one week later, the survey, as well as instructions, a unique login ID, and brief
7 Dillman, D.A. (2000). Mail and Internet Surveys: The Tailored Design Method – Second Edition. John Wiley & Sons, New York, New York.
8

descriptions of each EBP were emailed to each agency administrator in the sample.8 For
agencies that did not complete the survey, the agency director was contacted up to three more
times after the original survey materials were sent. The final contact was a follow-up phone call.
A follow-up phone script was provided to interviewers to inform the respondents that the survey
was sent to them previously, and to explain that the call was being made to see if they had any
questions about the project. Potential respondents were also encouraged to complete the survey
as soon as possible.
Division of Alcohol and Substance Abuse (DASA)
Although similar, the data collection procedures used with the DASA sample differed slightly
from those used with the MHD sample. One important difference was the inclusion of more than
30 substance use EBPs in the DASA version of the survey.9 A consequence of including
chemical dependency EBPs in the DASA version of the survey was that it was very long, and
could only be completed online. Another procedural difference in the protocol used with DASA
agencies was that the pre-notice contact was an actual memo written and signed by the Director
of DASA and was sent to DASA agency contacts via e-mail and postage mail.
A third procedural difference was related to variability in the DASA sample itself. Because
fifty-seven (57-DASA Overlap) agencies from the DASA sample were also duplicated in the
MHD sample, they were surveyed separately. These 57 agencies were surveyed separately
primarily to draw attention to the fact that the DASA EBP survey also included chemical
dependency EBPs, unlike the MHD EBP survey which only included mental health EBPs. The
overlap sample inclusion criteria was based on the following decision rule: 1) the DASA
licensed/certified agency had the same name as the MHD licensed/certified agency or; 2) the
DASA licensed/certified agency had the same address as the MHD licensed/certified agency.
For disposition reporting purposes, both samples have been combined into one sample.
8 For the MHD sample, agency administrators were encouraged to complete the survey online, they were also given the option of completing an electronic or paper copy of the survey. 9 Substance use EBPs included in the DASA version of the survey were obtained from the Alcohol and Drug Abuse Institute’s (ADAI) website: http://adai.washington.edu/ebp/matrix.pdf
9
Children’s Administration (CA) and Juvenile Rehabilitation Administration (JRA)
The timeline for JRA and CA consisted of a pre-notice telephone call from WIMIRT with
management from both Administrations. Similar to the purpose of the pre-notice email sent to
DASA and MHD agencies, the purpose of the pre-notice telephone call to JRA and CA was to
ask them to complete the EBP Survey and that they would be receiving it in the next several
days. The Evidence Based Practices (EBP) Manager from CA and Clinical Director from JRA
were asked to complete a separate survey for each of the individual agencies within their
Administration and to enter the responses online.
Response Rate
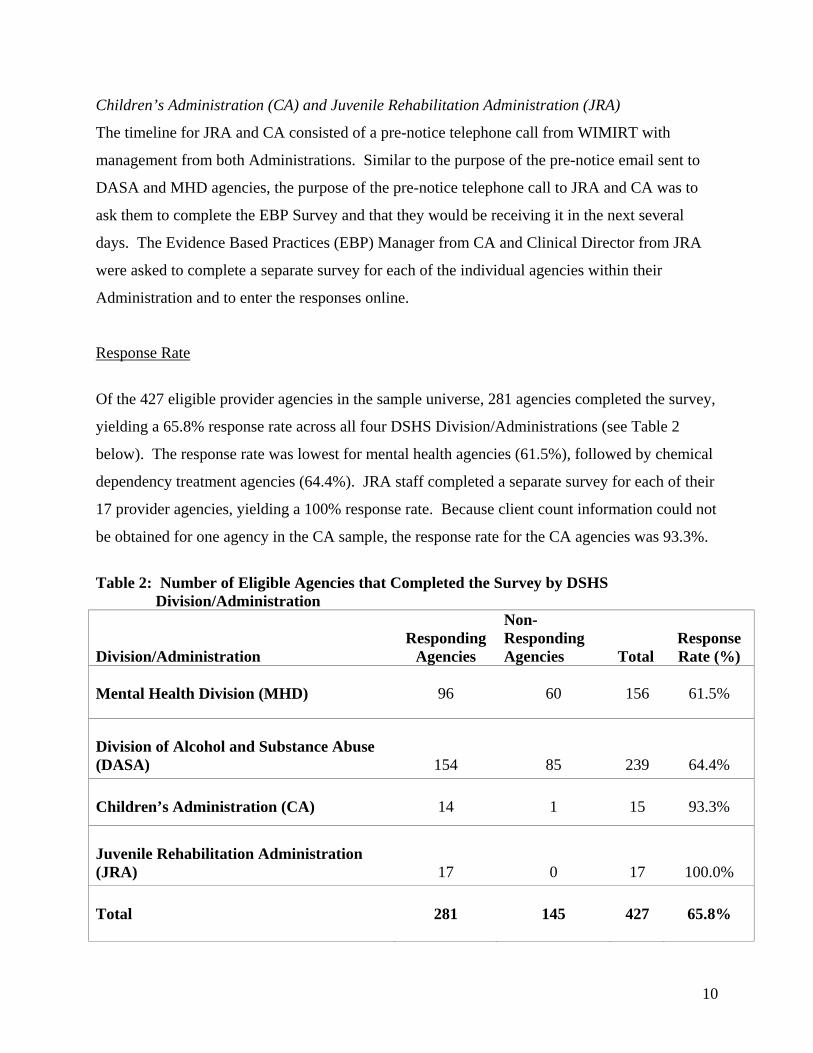
Of the 427 eligible provider agencies in the sample universe, 281 agencies completed the survey,
yielding a 65.8% response rate across all four DSHS Division/Administrations (see Table 2
below). The response rate was lowest for mental health agencies (61.5%), followed by chemical
dependency treatment agencies (64.4%). JRA staff completed a separate survey for each of their
17 provider agencies, yielding a 100% response rate. Because client count information could not
be obtained for one agency in the CA sample, the response rate for the CA agencies was 93.3%.
Table 2: Number of Eligible Agencies that Completed the Survey by DSHS Division/Administration
Division/Administration
Responding
Agencies
Non-Responding Agencies
Total
Response Rate (%)
Mental Health Division (MHD)
96
60
156
61.5%
Division of Alcohol and Substance Abuse (DASA)
154
85
239
64.4% Children’s Administration (CA)
14
1
15
93.3%
Juvenile Rehabilitation Administration (JRA)
17
0
17
100.0% Total
281
145
427
65.8%
10

Representativeness
Our interest in conducting a statewide survey is to be able to generalize the findings to the
statewide publically funded mental health service provider population. In this case it would be
those provider agencies funded by the MHD, DASA, JRA, and CA. If we had obtained a 100%
response rate from the four Divisions and Administrations this would not be questionable. A
response rate of 62% from the MHD agencies and 65% from DASA requires us to exercise some
caution in making generalizations across the state since the possibility exists that those that did
not respond differ from those that did respond in some systematic way. If this were the case, then
the sample may not represent the true population, and thus would have poor
“representativeness.”
Representativeness may better be assessed if we had common indicators for both those agencies
that did respond and those agencies that did not respond to the survey. This would allow us to
see if these two groups differed in any appreciable ways that may affect their survey responses
(e.g., size of agency, location, urban vs. rural). The only indicator that we have for both those
that responded and those that did not is their location (see the map in Appendix D showing the
location of the provider agencies by agency type and whether or not they responded to the
survey). The distributions of MHD and DASA agencies that completed and did not complete the
survey appear relatively evenly distributed across the state. JRA and CA agencies are confined
primarily to urban areas. Included in Appendix D are the percentage of agencies within each
county that completed the survey and a list of agencies that completed or did not complete the
survey.
Findings
The survey inquires about agency characteristics (e.g., services offered, size of service area
served) and the following content areas:
9 UTILIZATION OF EBPS. Utilization of EBPs is based on the percent of responding agencies currently providing each of the EBPs that are listed;
11
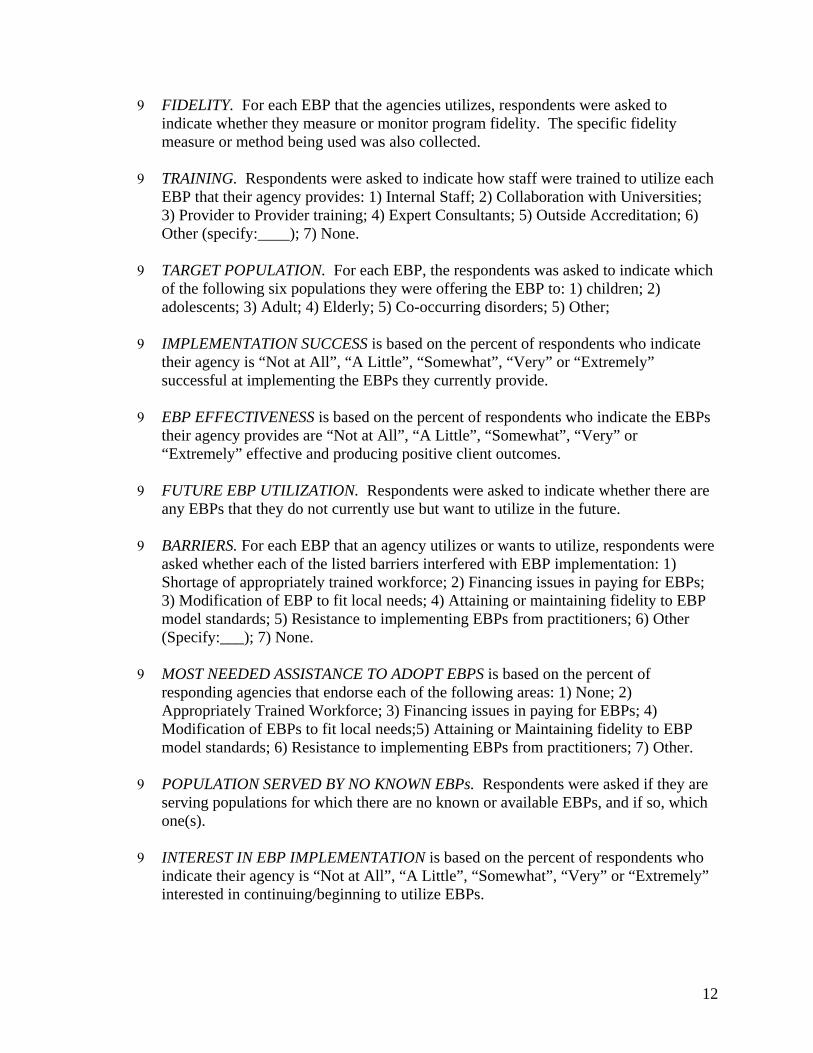
9 FIDELITY. For each EBP that the agencies utilizes, respondents were asked to indicate whether they measure or monitor program fidelity. The specific fidelity measure or method being used was also collected.
9 TRAINING. Respondents were asked to indicate how staff were trained to utilize each EBP that their agency provides: 1) Internal Staff; 2) Collaboration with Universities; 3) Provider to Provider training; 4) Expert Consultants; 5) Outside Accreditation; 6) Other (specify:____); 7) None.
9 TARGET POPULATION. For each EBP, the respondents was asked to indicate which of the following six populations they were offering the EBP to: 1) children; 2) adolescents; 3) Adult; 4) Elderly; 5) Co-occurring disorders; 5) Other;
9 IMPLEMENTATION SUCCESS is based on the percent of respondents who indicate their agency is “Not at All”, “A Little”, “Somewhat”, “Very” or “Extremely” successful at implementing the EBPs they currently provide.
9 EBP EFFECTIVENESS is based on the percent of respondents who indicate the EBPs their agency provides are “Not at All”, “A Little”, “Somewhat”, “Very” or “Extremely” effective and producing positive client outcomes.
9 FUTURE EBP UTILIZATION. Respondents were asked to indicate whether there are any EBPs that they do not currently use but want to utilize in the future.
9 BARRIERS. For each EBP that an agency utilizes or wants to utilize, respondents were asked whether each of the listed barriers interfered with EBP implementation: 1) Shortage of appropriately trained workforce; 2) Financing issues in paying for EBPs; 3) Modification of EBP to fit local needs; 4) Attaining or maintaining fidelity to EBP model standards; 5) Resistance to implementing EBPs from practitioners; 6) Other (Specify:___); 7) None.
9 MOST NEEDED ASSISTANCE TO ADOPT EBPS is based on the percent of
responding agencies that endorse each of the following areas: 1) None; 2) Appropriately Trained Workforce; 3) Financing issues in paying for EBPs; 4) Modification of EBPs to fit local needs;5) Attaining or Maintaining fidelity to EBP model standards; 6) Resistance to implementing EBPs from practitioners; 7) Other.
9 POPULATION SERVED BY NO KNOWN EBPs. Respondents were asked if they are serving populations for which there are no known or available EBPs, and if so, which one(s).
9 INTEREST IN EBP IMPLEMENTATION is based on the percent of respondents who indicate their agency is “Not at All”, “A Little”, “Somewhat”, “Very” or “Extremely” interested in continuing/beginning to utilize EBPs.
12

9 EBP INITIATIVES is based on the percent of responding agencies that indicate “Yes” for each of the following methods used to promote EBP implementation: 1) Increase awareness about EBPs; 2) Training; 3) Incorporation of EBPs in contracts; 4) Monitoring of fidelity; 5) Modification of information systems/data reports; 6) Modification of paperwork; 7) Financial incentives; 8) Other; 9) None.
9 SYSTEMATIC ASSESSMENT OF EBP EFFECTS. Respondents were asked whether any systematic assessments are being utilized to measure EBP effectiveness.
9 CLIENT COUNTS are based on the average number of people served in FY2007 by agency and by each EBP.
In discussing the findings below, reference will be made to Appendix E and F that contain all the
major tables for each question (Appendix E) as well as a complete listing of the “Other”
responses for each question (Appendix F). Including this material in the text would be too
cumbersome. Instead, a series of “figures” have been included that summarizes some of the main
findings from the tables. Information from the “Other” responses is added when appropriate. The
reader is encouraged to refer to Appendix E and F for more specifics on each question. A Table
of Contents has been included in each appendix for reference.
Data Considerations and Limitations
Certain procedural considerations and limitations should be taken into account when interpreting
the results of the 2007 EBP Survey. First, it should be noted that survey participation was
voluntary. One of the consequences of voluntary participation is missing data. With the
exception of JRA, the response rate for the EBP survey was less than 100% across the other three
DSHS Division/Administrations. Therefore, it is unknown the extent to which the facility
characteristics, utilization of EBPs, and client counts of responding agencies generalize to those
of non-responding agencies, particularly among mental health and chemical dependency service
systems.
13

Second, the survey respondents varied across the four DSHS Agency Types (i.e., CA, MHD,
JRA, and DASA). Whereas the primary respondents for the MHD and DASA samples were
employed by the local service provider agencies, the primary respondents for the CA and JRA
samples were employed directly by CA and JRA.
Third, the survey instrument completed by DASA agencies was different from the survey
instrument completed by MHD, CA, and JRA agencies. Specifically, the DASA version of the
EBP survey included chemical dependency and mental health EBPs. It is unknown the extent to
which the addition of chemical dependency EBPs might have altered the response to mental
health EBPs.
Agency Characteristics Figure 1 below shows that when all of the DSHS agencies are combined, intake, assessment, or
referral services are the most frequently offered services overall (87.5%). Chemical dependency
(67.6%) and mental health (56.6 %) treatment are provided by more than half of the agencies.
Co-occurring disorder services are provided by slightly less than half (47.7%) of the agencies in
the overall sample and 41% of the agencies reported offering services other than or in addition to
those described above.
Each DSHS Agency Type differs from the next in the emphasis they place on each service. Not
surprisingly, most of the agencies in the MHD sample provide mental health treatment (91.7%)
whereas most of the agencies in the DASA sample provide chemical dependency treatment
(98.1%). One hundred percent of the JRA agencies provide intake, assessment, or referral
services, and 100% of the CA agencies offer “Other” services. Most of the “Other” services
listed by CA are MTFC and PCIT (See Appendix F. p. F-3). Of the four Agency Types, only
one, the Children’s Administration, did not provide all five listed services. The “other” services
listed by each agency type are provided in Appendix F.
14

Figure 2 below shows the percent of agencies that are operated as a solo office with a single
practitioner or therapist. Overall, only 2.5% of all agencies are being operated as a solo practice.
These solo practices are all DASA affiliated agencies (4.5%).
Figure 3 below shows that agencies that serve populations between 50,001 and 500,000 had the
greatest representation (41.3%) when responding agencies from all four DSHS systems were
combined. Agencies with service areas of 5000 or less were the least represented overall
(11.0%).
Although both MHD and DASA agencies tend to service populations of 50,001-500,000, DASA
agencies are more likely to service lesser populated areas than MHD. Furthermore, the CA
agencies that responded only service areas of 50,001 or more people. JRA agencies only service
areas with populations lower than 5000 (5.9%) or greater than 500,000 (94.1%). A likely reason
for the large number served by JRA agencies in areas greater than 500,000 is that clients from
across the state are sent to JRA treatment facilities that are located in these larger areas.
15
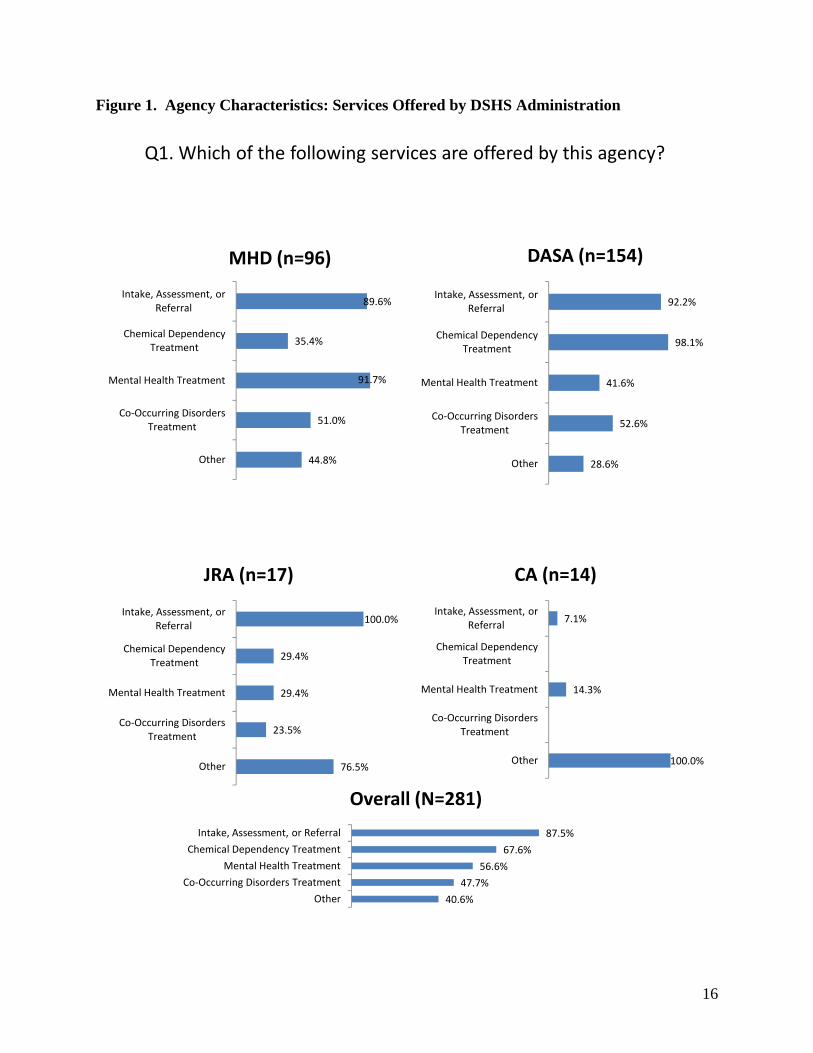
Figure 1. Agency Characteristics: Services Offered by DSHS Administration
Q1. Which of the following services are offered by this agency?
89.6%
35.4%
91.7%
51.0%
44.8%
Intake, Assessment, or Referral
Chemical Dependency Treatment
Mental Health Treatment
Co‐Occurring Disorders Treatment
Other
MHD (n=96)
92.2%
98.1%
41.6%
52.6%
28.6%
Intake, Assessment, or Referral
Chemical Dependency Treatment
Mental Health Treatment
Co‐Occurring Disorders Treatment
Other
DASA (n=154)
100.0%
29.4%
29.4%
23.5%
76.5%
Intake, Assessment, or Referral
Chemical Dependency Treatment
Mental Health Treatment
Co‐Occurring Disorders Treatment
Other
JRA (n=17)
7.1%
14.3%
100.0%
Intake, Assessment, or Referral
Chemical Dependency Treatment
Mental Health Treatment
Co‐Occurring Disorders Treatment
Other
CA (n=14)
87.5%
67.6%
56.6%
47.7%
40.6%
Intake, Assessment, or Referral
Chemical Dependency Treatment
Mental Health Treatment
Co‐Occurring Disorders Treatment
Other
Overall (N=281)
16

Figure 2. Agency Characteristics: Solo Practice by DSHS Administration
4.5%
2.5%
0
0.01
0.02
0.03
0.04
0.05
MHD (n=96) DASA (n=154) JRA (n=17) CA (n=14) Total (N=281)
Q2. Is this a solo practice, meaning an office with a single practitioner or therapist?
17
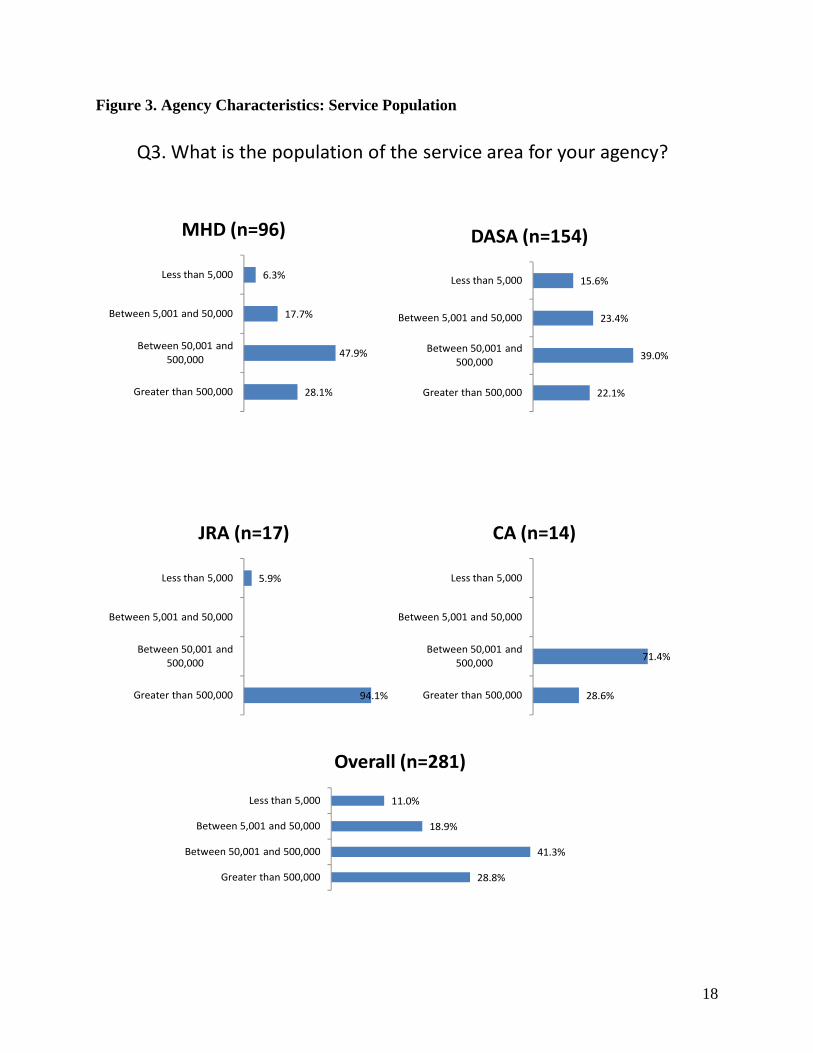
Figure 3. Agency Characteristics: Service Population
Q3. What is the population of the service area for your agency?
71.4%
28.6%
Less than 5,000
Between 5,001 and 50,000
Between 50,001 and 500,000
Greater than 500,000
CA (n=14)
5.9%
94.1%
Less than 5,000
Between 5,001 and 50,000
Between 50,001 and 500,000
Greater than 500,000
JRA (n=17)
15.6%
23.4%
39.0%
22.1%
Less than 5,000
Between 5,001 and 50,000
Between 50,001 and 500,000
Greater than 500,000
DASA (n=154)
6.3%
17.7%
47.9%
28.1%
Less than 5,000
Between 5,001 and 50,000
Between 50,001 and 500,000
Greater than 500,000
MHD (n=96)
11.0%
18.9%
41.3%
28.8%
Less than 5,000
Between 5,001 and 50,000
Between 50,001 and 500,000
Greater than 500,000
Overall (n=281)
18
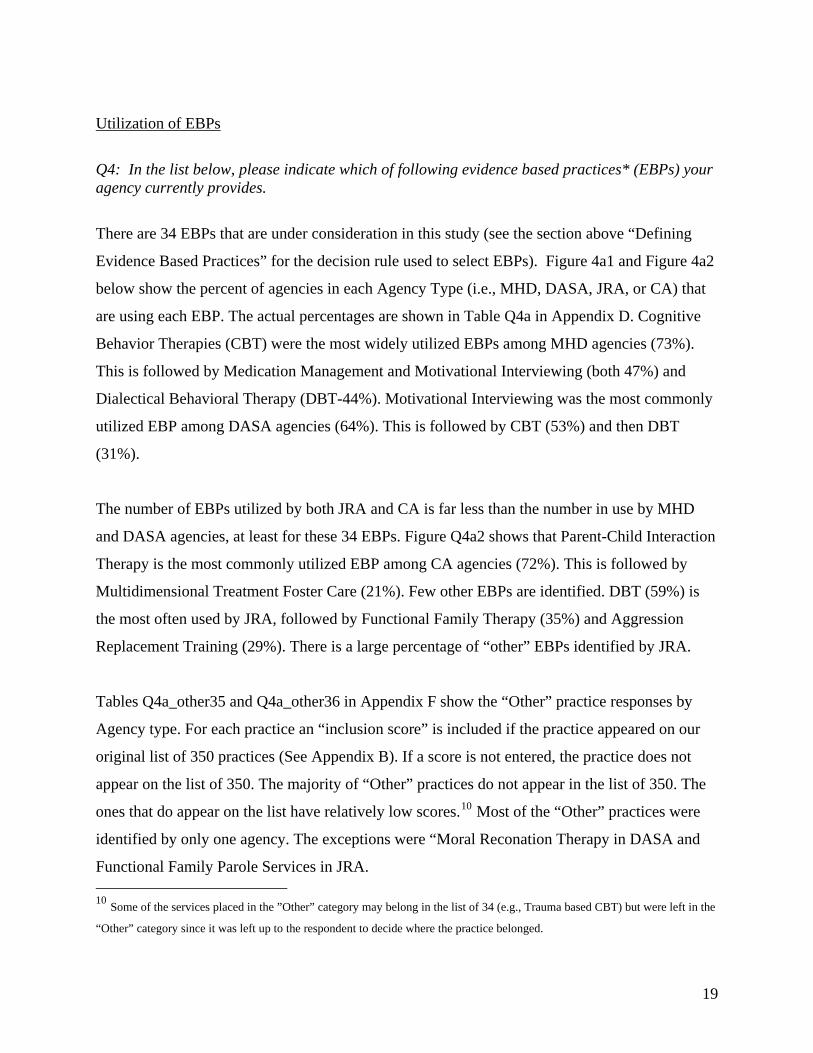
Utilization of EBPs
Q4: In the list below, please indicate which of following evidence based practices* (EBPs) your agency currently provides.
There are 34 EBPs that are under consideration in this study (see the section above “Defining
Evidence Based Practices” for the decision rule used to select EBPs). Figure 4a1 and Figure 4a2
below show the percent of agencies in each Agency Type (i.e., MHD, DASA, JRA, or CA) that
are using each EBP. The actual percentages are shown in Table Q4a in Appendix D. Cognitive
Behavior Therapies (CBT) were the most widely utilized EBPs among MHD agencies (73%).
This is followed by Medication Management and Motivational Interviewing (both 47%) and
Dialectical Behavioral Therapy (DBT-44%). Motivational Interviewing was the most commonly
utilized EBP among DASA agencies (64%). This is followed by CBT (53%) and then DBT
(31%).
The number of EBPs utilized by both JRA and CA is far less than the number in use by MHD
and DASA agencies, at least for these 34 EBPs. Figure Q4a2 shows that Parent-Child Interaction
Therapy is the most commonly utilized EBP among CA agencies (72%). This is followed by
Multidimensional Treatment Foster Care (21%). Few other EBPs are identified. DBT (59%) is
the most often used by JRA, followed by Functional Family Therapy (35%) and Aggression
Replacement Training (29%). There is a large percentage of “other” EBPs identified by JRA.
Tables Q4a_other35 and Q4a_other36 in Appendix F show the “Other” practice responses by
Agency type. For each practice an “inclusion score” is included if the practice appeared on our
original list of 350 practices (See Appendix B). If a score is not entered, the practice does not
appear on the list of 350. The majority of “Other” practices do not appear in the list of 350. The
ones that do appear on the list have relatively low scores.10 Most of the “Other” practices were
identified by only one agency. The exceptions were “Moral Reconation Therapy in DASA and
Functional Family Parole Services in JRA. 10 Some of the services placed in the ”Other” category may belong in the list of 34 (e.g., Trauma based CBT) but were left in the
“Other” category since it was left up to the respondent to decide where the practice belonged.
19
Table 3 below shows the average number of EBPs offered per site by agency type (i.e., MHD,
DASA, JRA, or CA). Among MHD, each agency offered on average six different EBPs, with a
range between zero and 22. DASA agencies offered an average of 3.6 EBPs per site, with a
range of 0 to 18. JRA and CA offered an average of 1.6 and 1.4 EBPs per agency, respectively.
Table 4 below shows that 26% of MHD agencies offered between one and three EBPs and 26%
offered between four and six EBPs per agency. Ninety-three percent of CA agencies and 94% of
JRA agencies offered between one and three EBPs. Among DASA agencies, offering between
one and three EBPs per site (39.6%) was the most frequent pattern of EBP utilization.
20
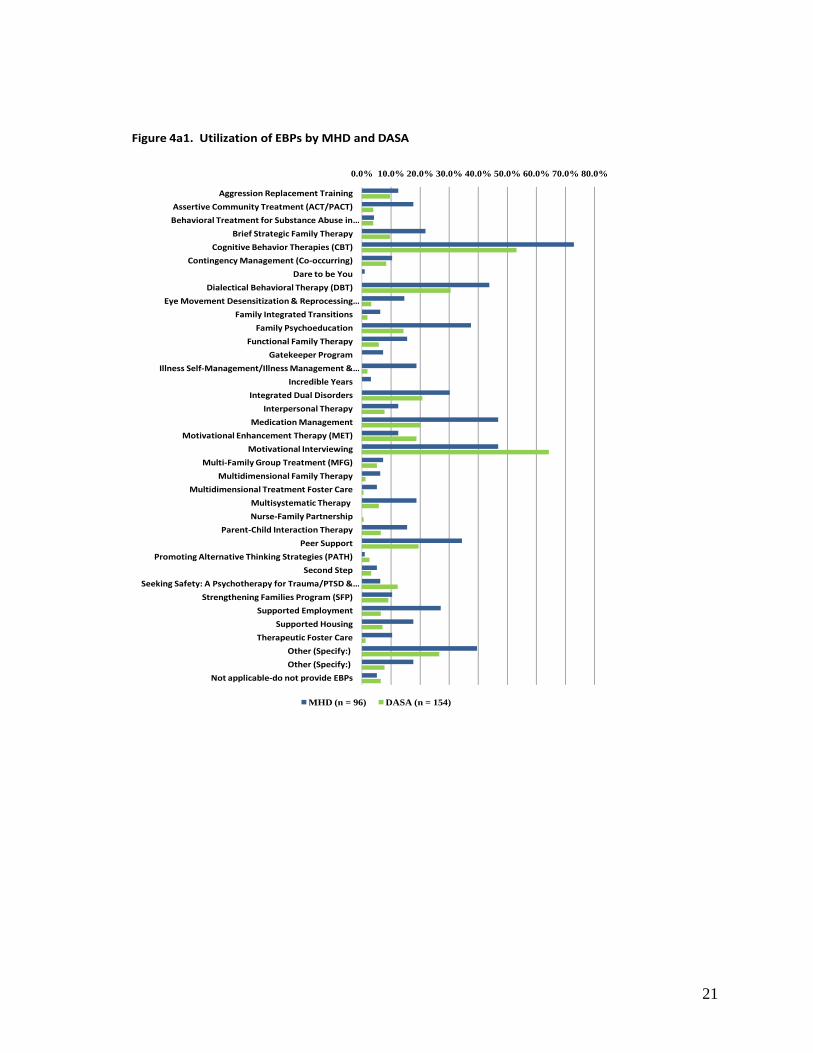
Figure 4a1. Utilization of EBPs by MHD and DASA
0.0% 10.0% 20.0% 30.0% 40.0% 50.0% 60.0% 70.0% 80.0%
Aggression Replacement Training
Assertive Community Treatment (ACT/PACT)
Behavioral Treatment for Substance Abuse in …
Brief Strategic Family Therapy
Cognitive Behavior Therapies (CBT)
Contingency Management (Co‐occurring)
Dare to be You
Dialectical Behavioral Therapy (DBT)
Eye Movement Desensitization & Reprocessing …
Family Integrated Transitions
Family Psychoeducation
Functional Family Therapy
Gatekeeper Program
Illness Self‐Management/Illness Management & …
Incredible Years
Integrated Dual Disorders
Interpersonal Therapy
Medication Management
Motivational Enhancement Therapy (MET)
Motivational Interviewing
Multi‐Family Group Treatment (MFG)
Multidimensional Family Therapy
Multidimensional Treatment Foster Care
Multisystematic Therapy
Nurse‐Family Partnership
Parent‐Child Interaction Therapy
Peer Support
Promoting Alternative Thinking Strategies (PATH)
Second Step
Seeking Safety: A Psychotherapy for Trauma/PTSD & …
Strengthening Families Program (SFP)
Supported Employment
Supported Housing
Therapeutic Foster Care
Other (Specify:)
Other (Specify:)
Not applicable‐do not provide EBPs
MHD (n = 96) DASA (n = 154)
21
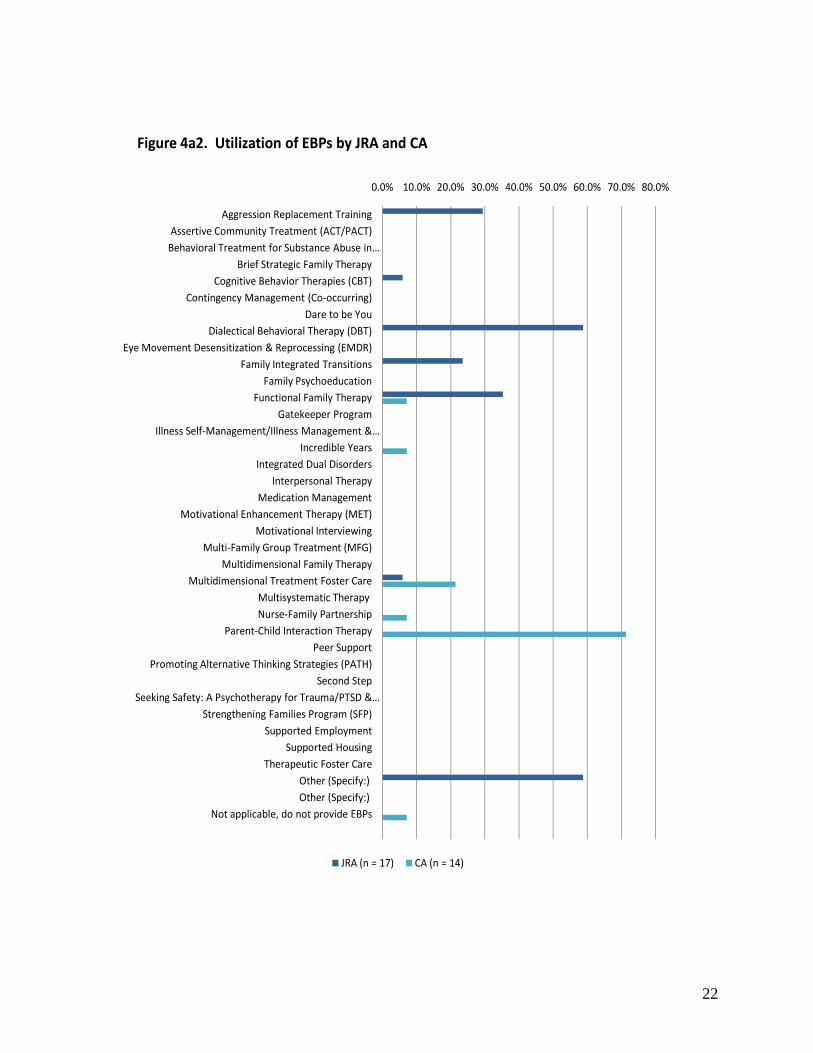
Figure 4a2. Utilization of EBPs by JRA and CA
0.0% 10.0% 20.0% 30.0% 40.0% 50.0% 60.0% 70.0% 80.0%
Aggression Replacement TrainingAssertive Community Treatment (ACT/PACT)Behavioral Treatment for Substance Abuse in …
Brief Strategic Family TherapyCognitive Behavior Therapies (CBT)
Contingency Management (Co‐occurring)Dare to be You
Dialectical Behavioral Therapy (DBT)Eye Movement Desensitization & Reprocessing (EMDR)
Family Integrated TransitionsFamily Psychoeducation
Functional Family TherapyGatekeeper Program
Illness Self‐Management/Illness Management & …Incredible Years
Integrated Dual DisordersInterpersonal Therapy
Medication ManagementMotivational Enhancement Therapy (MET)
Motivational InterviewingMulti‐Family Group Treatment (MFG)
Multidimensional Family TherapyMultidimensional Treatment Foster Care
Multisystematic Therapy Nurse‐Family Partnership
Parent‐Child Interaction TherapyPeer Support
Promoting Alternative Thinking Strategies (PATH)Second Step
Seeking Safety: A Psychotherapy for Trauma/PTSD & …Strengthening Families Program (SFP)
Supported EmploymentSupported Housing
Therapeutic Foster CareOther (Specify:) Other (Specify:)
Not applicable, do not provide EBPs
JRA (n = 17) CA (n = 14)
22

Table 3: Average Number of EBP’s Offered Per Site by Agency Type
Agency Type N Min. Max. Mean 96 .00 22 6.0208 MHD
14 .00 2 1.1429 CA
17 .00 3 1.5882 JRA
154 .00 18 3.6039 DASA
Table 4: Number and Percent of EBP’s Offered Per Site by Agency Type
Agency Type # of EBPs Percent 0 8.3
1-3 26.0 4-6 26.0 7-9 16.7 10+ 22.9
MHD
Total 100.0 (N = 96)
0 7.1
1-3 92.9
Children’s Admin
Total 100.0 (N = 14) 0 5.9
1-3 94.1
JRA
Total 100.0 (N = 17) 0 20.1
1-3 39.6 4-6 23.4 7-9 10.4 10+ 6.5
DASA
Total 100.0 N = 154) Total 0 14.6 1-3 40.9 4-6 21.7 7-9 11.4 10+ 11.4 Total 100.0 (N = 281)
23

Fidelity
Q4b. Indicate whether program fidelity is assessed or monitored (i.e., the practice is being implemented as intended according to established guidelines and/or manuals) for those practices you are currently providing and if so, what fidelity measure or method you are using.
Fidelity refers to whether a program or practice is being implemented as intended according to
established guidelines or manuals (e.g., SAMHSA Fidelity Scales). To collect this information,
all respondents were asked if they monitored the fidelity of the EBPs being provided by their
agency. If fidelity is being monitored, respondents were also asked to indicate which measure or
method is being used. The percent of EBPs being monitored for fidelity by agency type is
presented in Figure 4b below. Table Q4b in Appendix E shows the percent of EBPs being
monitored for fidelity broken down by EBP.
Overall, the respondents indicated that of the EBPs that are being used, 43% are being monitored
for fidelity (see Figure 4b below); however, the likelihood that an EBP is being monitored for
fidelity varies by agency type. Within the Children’s Administration (CA), for example, it was
reported that 100% of the EBPs being provided are monitored for fidelity. MHD agencies are
the least likely to monitor EBP fidelity (38%).
Appendix G shows the fidelity measures and methods being used broken down by EBP and
agency type. From these tables, it appears that fidelity is being measured in a variety of ways
with a range of psychometric rigor and reliability. Videotape and chart reviews, supervision,
quality assurance monitoring, consultation, as well as unspecified adherence measures are
commonly reported methods used to assess fidelity. For a minority of EBPs, specific measures
are identified (e.g., Dartmouth Assertive Community Treatment Scale, Integrated Dual Disorders
Treatment Fidelity Scale, Supported Employment Fidelity Scale). Most of the fidelity measures
cited are those developed or provided by SAMHSA.
24
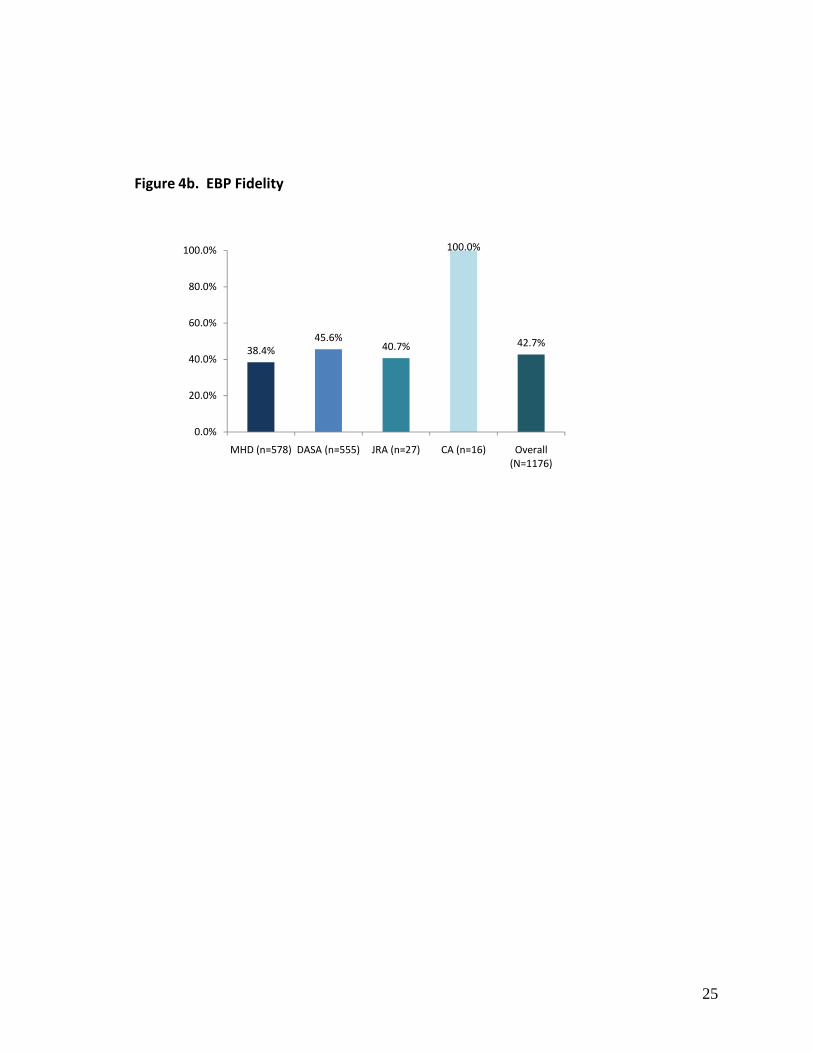
Figure 4b. EBP Fidelity
38.4%45.6%
40.7%
100.0%
42.7%
0.0%
20.0%
40.0%
60.0%
80.0%
100.0%
MHD (n=578) DASA (n=555) JRA (n=27) CA (n=16) Overall (N=1176)
25

Training Q5: For the practices your agency currently provides please indicate which mechanisms are used to provide training. Respondents were asked to indicate how agency staff are trained to use each EBP (see Figure 5
below). Overall, the most commonly used mechanism for EBP training is internal staff, which is
used for 75% of all EBPs. Provider-to-provider training (38%) is the second most common
training mechanism followed by outside accreditation (35%). Of the five categories,
collaboration with universities and “Other” are the least commonly used mechanisms of training.
This same overall pattern of results is evident within MHD. However, DASA agencies report a
slightly higher percentage for outside accreditation (36.8%) than provider-to-provider training
(33.5%). JRA and CA exhibit different patterns. JRA agencies report greater use of internal
staff (100%), provider-to-provider training (81.3%) and collaboration with universities (30.2%)
than any of the other agencies. In contrast, 100% of CA sample report using “Other” training
(CA uses State contracted PCIT consultants as its only training mechanism (see Table Q5_Other
in Appendix F). Results for individual EBPs are reported by agency and overall in Table Q5 in
Appendix E.
26

Figure 5. Training in EBP Utilization
77.3%
19.8%
33.5%
36.8%
8.5%
Internal Staff
Collaboration with Universities
Provider‐to‐Provider Training
Outside Accreditation
Other
DASA (n=555)
100.0%
33.3%
74.1%
3.7%
7.4%
Internal Staff
Collaboration with Universities
Provider‐to‐Provider Training
Outside Accreditation
Other
JRA (n=27)
100.0%
Internal Staff
Collaboration with Universities
Provider‐to‐Provider Training
Outside Accreditation
Other
CA (n=16)
73.2%
17.5%
40.7%
35.5%
12.6%
Internal Staff
Collaboration with Universities
Provider‐to‐Provider Training
Outside Accreditation
Other
MHD (n=578)
74.7%
18.7%
37.5%
34.9%
11.7%
Internal Staff
Collaboration with Universities
Provider‐to‐Provider Training
Outside Accreditation
Other
Overall (N=1176)
27

EBP Target Population Q6: For the practices your agency currently provides please indicate which target populations you are providing the EBP. Respondents were asked to indicate who their target populations are for each EBP being
currently offered (i.e., Children, Adolescents, Adult, Elderly, Co-occurring Disorders, and
Other). Figure 6 below shows that, overall, EBPs are most often used with adult (71%),
adolescent (51%), and co-occurring disorder (47.0%) populations. Moreover, nearly 26% of the
agencies were utilizing EBPs with children and 26% with the elderly. Only 4% of the EBPs
target “Other” populations (see Appendix F). The EBPs in use by MHD and DASA mainly
target adults (70% and 78% respectively). As expected, JRA and CA serve mostly adolescents
and children. However, each serves a large number of adults as well (JRA-71.9%; CA-80.8%).
In addition, adolescents are targeted by half of the agencies in MHD and DASA using EBPs, but
only by 13% of the CA agencies. Regarding children, 39% of the MHD and 33% of JRA
agencies target these populations. Ten percent of DASA’s EBPs target children. Further, the co-
occurring disorders population is targeted by a larger percentage of EBPs from JRA (63%) than
DASA (53%), MHD (41%), or CA (0%). Neither JRA nor CA agencies provide EBPs to the
elderly. Details of targeted populations by each EBP and agency type appear in Table Q6 of
Appendix E. The “Other” responses appear in Appendix F.
28
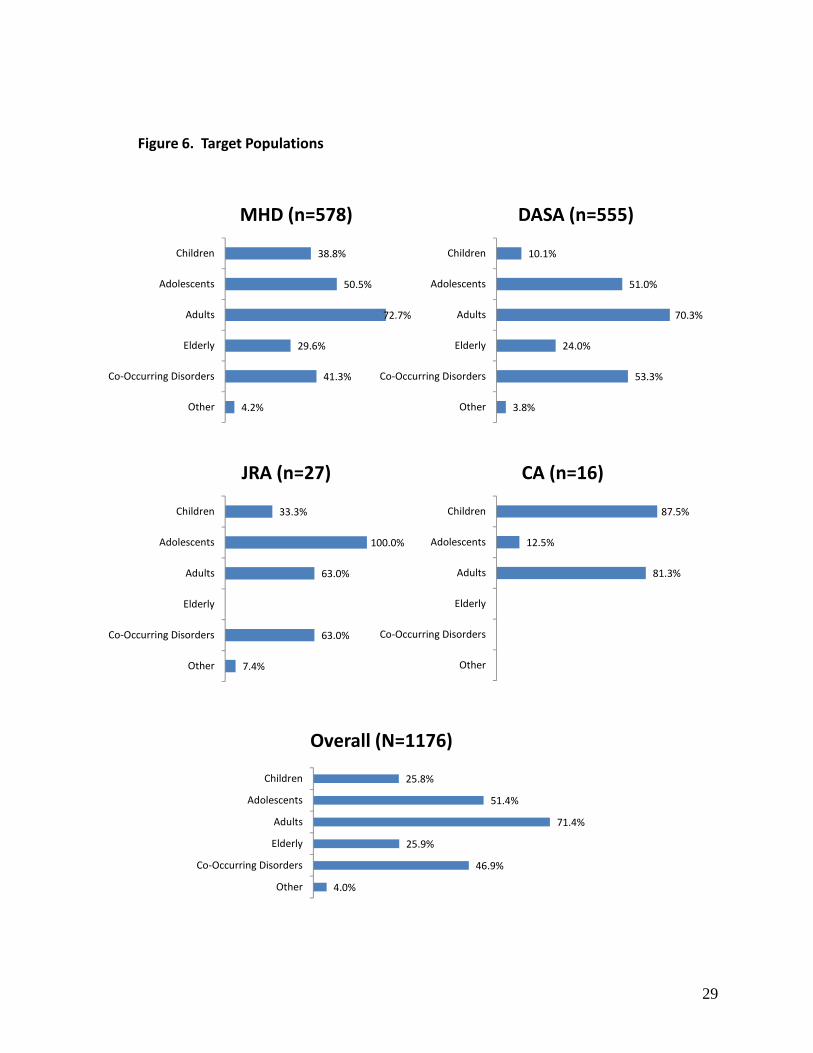
Figure 6. Target Populations
38.8%
50.5%
72.7%
29.6%
41.3%
4.2%
Children
Adolescents
Adults
Elderly
Co‐Occurring Disorders
Other
MHD (n=578)
10.1%
51.0%
70.3%
24.0%
53.3%
3.8%
Children
Adolescents
Adults
Elderly
Co‐Occurring Disorders
Other
DASA (n=555)
87.5%
12.5%
81.3%
Children
Adolescents
Adults
Elderly
Co‐Occurring Disorders
Other
CA (n=16)
33.3%
100.0%
63.0%
63.0%
7.4%
Children
Adolescents
Adults
Elderly
Co‐Occurring Disorders
Other
JRA (n=27)
25.8%
51.4%
71.4%
25.9%
46.9%
4.0%
Children
Adolescents
Adults
Elderly
Co‐Occurring Disorders
Other
Overall (N=1176)
29

EBP Implementation Success Q7: For the practices your agency currently provides (see question #4), please indicate how successful your agency has been in implementing the EBP(s) listed below. Success with EBP implementation is summarized in Figure 7 below. Overall, agencies report
that they are very or extremely successful in implementing 60% of the EBPs their agency offers.
Agencies indicate that they are somewhat successful in implementing an additional 33% of their
EBPs. Less than 10% of the EBPs have little or no success in implementation. This same pattern
of results is evident among MHD, DASA, and CA. JRA reported less success in implementing
EBPs than did the other agency types.
In reviewing individual EBPs, 92% of the 13 agencies using Family Integrated Transitions report
that they are very or extreme successful in implementation. Sixty-two percent of 21 agencies
using Illness Self-Management/Illness Management & Recovery reported that implementation
was very successful. The EBP that agencies report having the least success in implementing is
Multi-Family Group Treatment (MFG). Forty percent of 15 agencies report little or no success in
implementing this EBP. Additional results about individual EBPs can be found in Table Q7 in
Appendix E.
30

Figure 7. EBP Implementation Success
1.6%
6.7%
29.9%
45.3%
16.4%
Not at All
A Little
Somewhat
Very
Extremely
MHD (n=578)
0.7%
7.2%
34.2%
44.3%
13.5%
Not at All
A Little
Somewhat
Very
Extremely
DASA (n=555)
3.7%
55.6%
33.3%
7.4%
Not at All
A Little
Somewhat
Very
Extremely
JRA (n=27)
12.5%
25.0%
43.8%
18.8%
Not at All
A Little
Somewhat
Very
Extremely
CA (n=16)
1.1%
7.0%
32.5%
44.6%
14.9%
Not at All
A Little
Somewhat
Very
Extremely
Overall (N=1176)
31

Effectiveness of EBPs
Q8: For the practices your agency currently provides, how effective do you think the EBP is at
producing positive client outcomes?
Figure 8 below shows respondent ratings of EBP effectiveness by agency type. Overall, more
than half of the respondents indicate that EBPs provided by their agency are “Very” (45.3%) or
“Extremely” (14.9%) effective at producing positive client outcomes. This overall pattern of
response is also observed across three of the four agency types (i.e., MHD, DASA, CA). The
exception is JRA. JRA indicates lower effectiveness overall, with the majority of respondents
indicating the EBPs they provide are only “Somewhat” effective (51.9%). Table Q8 in
Appendix E shows the ratings of effectiveness for each EBP broken down by agency type.
32

Figure 8. Effectiveness of EBPs
1.8%
4.3%
33.7%
45.3%
14.9%
Not at All
A Little
Somewhat
Very
Extremely
Overall (N=1176)
0.9%
4.5%
28.9%
48.6%
17.1%
Not at All
A Little
Somewhat
Very
Extremely
MHD (n=578)
2.9%
4.1%
38.0%
41.6%
13.3%
Not at All
A Little
Somewhat
Very
Extremely
DASA (n=555)
3.7%
51.9%
44.4%
Not at All
A Little
Somewhat
Very
Extremely
JRA (n=27)
6.3%
25.0%
56.3%
12.5%
Not at All
A Little
Somewhat
Very
Extremely
CA (n=16)
33

Future EBP Utilization
Q9: Are there any EBP’s that you are NOT currently using but want to use in the future?
Respondents were asked to indicate whether there are EBPs their agency does not currently use
but would like to provide in the future. Answers to this question by agency type are presented in
Figure 9a and Figure 9b below.
Over three-fourths of the respondents from DASA (81.2 %) and MHD (84.4 %) indicate that
they want to implement new EBPs in the future. Illness Self-Management & Recovery (19.8%)
and Motivational Interviewing (19.8%) are the most frequently cited EBPs among the MHD
respondents, whereas Brief Strategic Family Therapy (13.6%) and Seeking Safety: A
Psychotherapy for Trauma/PTSD & Substance Abuse (13.6 %) are the most frequently indicated
EBPs among the DASA respondent sample.
When asked to select “any EBPS that you are NOT currently using but want to use in the future”,
“None” was identified by CA agencies 85.7% of the time and by JRA agencies 24% of the time.
JRA most frequently cite Aggression Replacement Training (41.2%) and Dialectical Behavior
Therapy (35.3%) as the EBPs they want to use in the future. The difference in responses among
the four agency types was of concern to administrators of these agencies. One of the agency
administrators offered the following explanation for this difference:
“Participating DSHS Departments, Children’s Administration, Juvenile Rehabilitation Administration and Division of Alcohol and Substance Abuse responded to the EBP survey questionnaire. Their responses reflect that individual efforts in implementing Evidenced Based Programs that provide services for the clients they serve. The answers did not address the cross system need that supports the MHD in developing more EBP infrastructure so that other clients (DSHS or not) and common clients may access EBP services earlier and potentially not progress to requiring the services of the responding agencies.”11
11 Children's Administration TWG representative Barbara Putnam, personal communication with MHTG Project Director Ken Stark, January 28, 2008.
34

Figure 9a. Future EBP Utilization by MHD and DASA Agencies
0.0% 5.0% 10.0% 15.0% 20.0% 25.0%
Aggression Replacement Training
Assertive Community Treatment (ACT/PACT)
Behavioral Treatment for Substance Abuse in Schizophrenia
Brief Strategic Family Therapy
Cognitive Behavior Therapies (CBT)
Contingency Management (Co‐occurring)
Dare to be you
Dialectical Behavioral Therapy (DBT)
Eye Movement Desensitization & Reprocessing (EMDR)
Family Integrated Transitions
Family Psychoeducation
Functional Family Therapy
Gatekeeper Program
Illness Self‐Management/Illness Management & Recovery
Incredible Years
Integrated Dual Disorders
Interpersonal Therapy
Medication Management
Motivational Enhancement Therapy (MET)
Motivational Interviewing
Multi‐Family Group Treatment (MFG)
Multidimensional Family Therapy
Multidimensional Treatment Foster Care
Multisystematic Therapy
Nurse‐Family Partnership
Parent‐Child Interaction Therapy
Peer Support
Promoting Alternative Thinking Strategies (PATH)
Second Step
Seeking Safety: A Psychotherapy for Trauma/PTSD & Substance Abuse
Strengthening Families Program (SFP)
Supported Employment
Supported Housing
Therapeutic Foster Care
Other (Specify:)
Other (Specify:)
Other (Specify:)
None
MHD (n = 96) DASA (n = 154)
35

Figure 9b. Future EBP Utilization by JRA and CA Agencies
0% 10% 20% 30% 40% 50% 60% 70% 80% 90%
Aggression Replacement Training
Assertive Community Treatment (ACT/PACT)
Behavioral Treatment for Substance Abuse in Schizophrenia
Brief Strategic Family Therapy
Cognitive Behavior Therapies (CBT)
Contingency Management (Co‐occurring)
Dare to be you
Dialectical Behavioral Therapy (DBT)
Eye Movement Desensitization & Reprocessing (EMDR)
Family Integrated Transitions
Family Psychoeducation
Functional Family Therapy
Gatekeeper Program
Illness Self‐Management/Illness Management & Recovery
Incredible Years
Integrated Dual Disorders
Interpersonal Therapy
Medication Management
Motivational Enhancement Therapy (MET)
Motivational Interviewing
Multi‐Family Group Treatment (MFG)
Multidimensional Family Therapy
Multidimensional Treatment Foster Care
Multisystematic Therapy
Nurse‐Family Partnership
Parent‐Child Interaction Therapy
Peer Support
Promoting Alternative Thinking Strategies (PATH)
Second Step
Seeking Safety: A Psychotherapy for Trauma/PTSD & …
Strengthening Families Program (SFP)
Supported Employment
Supported Housing
Therapeutic Foster Care
Other (Specify:)
Other (Specify:)
Other (Specify:)
None
JRA (n = 17)
CA (n = 14)
36

Barriers Q10: Please indicate whether any of the barriers listed below interfere with your agency in providing EBPs you are using or want to use? Respondents were asked to indicate which barriers were interfering with each EBP’s
implementation or utilization. These data are summarized in Figure 10 below. Overall, a
“Shortage of an Appropriately Trained Workforce” (47.5%) is the most frequently cited barrier
interfering with EBP implementation, followed by “Financing Issues in Paying for EBPs”
(44.4%). This same pattern is seen across three of the four agency types (DASA, JRA, and CA).
For mental health agencies, “Financing Issues in Paying for EBPs” (48.9%) is the most
commonly cited barrier, followed by “Shortage of an Appropriately Trained Workforce”
(44.5%).
Barriers to EBP implementation broken down by each EBP and agency type are presented in
Table Q10 in Appendix E. “Other” barriers identified for each EBP appear in Appendix F, Table
Q_10.
37

Figure 10. Barriers
44.5%
48.9%
18.5%
22.8%
6.6%
9.7%
21.1%
6.9%
Shortage of Appropriately …
Financing Issues in Paying for …
EBP Needs Modification to Fit …
Attaining or Maintaining …
Resistance to Implementing …
Rules & Regulations
None
Other
MHD (n=885)
47.5%
44.4%
16.6%
22.4%
8.2%
7.3%
23.5%
4.1%
Shortage of Appropriately Trained Workforce
Financing Issues in Paying for EBPs
EBP Needs Modification to Fit Local Needs
Attaining or Maintaining Fidelity to EBP Model Standards
Resistance to Implementing EBPs from Practitioners or Others
Rules & Regulations
None
Other
Overall (N=1835)
47.5%
39.9%
14.3%
20.6%
10.0%
4.9%
27.3%
0.6%
Shortage of Appropriately …
Financing Issues in Paying for …
EBP Needs Modification to …
Attaining or Maintaining …
Resistance to Implementing …
Rules & Regulations
None
Other
DASA (n=872)
83.6%
34.4%
24.6%
42.6%
4.9%
6.6%
8.2%
14.8%
Shortage of Appropriately …
Financing Issues in Paying for …
EBP Needs Modification to Fit …
Attaining or Maintaining …
Resistance to Implementing …
Rules & Regulations
None
Other
JRA (n=61)
76.5%
70.6%
17.6%
11.8%
5.9%
5.9%
Shortage of Appropriately Trained …
Financing Issues in Paying for EBPs
EBP Needs Modification to Fit Local …
Attaining or Maintaining Fidelity to …
Resistance to Implementing EBPs …
Rules & Regulations
None
Other
CA (n=17)
38

Most Needed Assistance in Adopting EBPs Q11: What type of assistance is most needed by your agency to help facilitate the adoption and implementation of evidence based practices? The type of assistance that is most needed to facilitate the adoption and implementation of EBPs
by agencies is displayed in Figure 11. Almost half of the agencies report that financial assistance
would be most helpful for adopting and implementing EBPs. However, nearly 20% of the
agencies disagree and report that appropriately trained workforce would be most beneficial to
them in implementing EBPs. Only a small percentage of agencies (5.3%) indicate that no
additional assistance is needed to facilitate their use of EBPs.
Within each agency type, both MHD and DASA agencies report financing issues as the most
needed assistance, while both JRA and CA agencies report appropriately trained workforce as
most necessary overall. Furthermore, resistance from practitioners did not seem to be a major
issue, as neither JRA nor CA report so and only a small amount of MHD (1.0%) and DASA
(2.6%) agencies indicate such. Assistance most needed by agencies in adopting/implementing
EBPs broken down by agency type is presented in Table Q11 in Appendix E. “Other” needed
assistance is reported in Table Q11_Other in Appendix F.
39
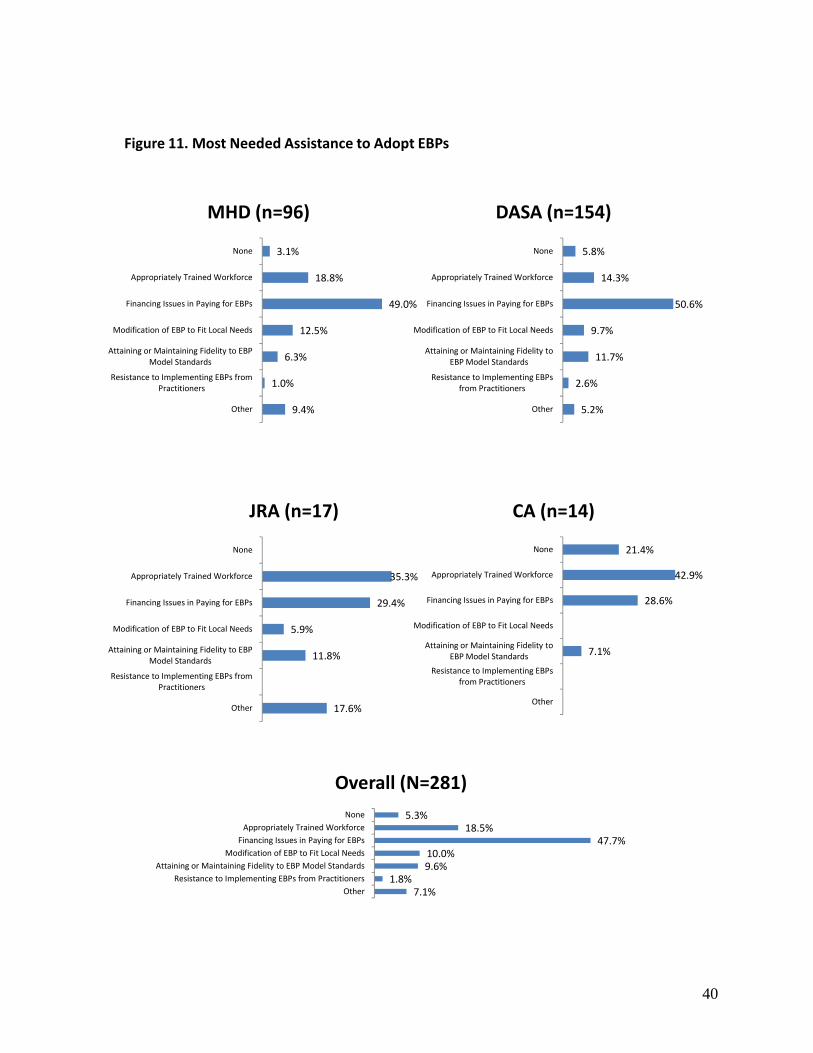
Figure 11. Most Needed Assistance to Adopt EBPs
5.3%18.5%
47.7%10.0%9.6%
1.8%7.1%
NoneAppropriately Trained Workforce
Financing Issues in Paying for EBPsModification of EBP to Fit Local Needs
Attaining or Maintaining Fidelity to EBP Model StandardsResistance to Implementing EBPs from Practitioners
Other
Overall (N=281)
3.1%
18.8%
49.0%
12.5%
6.3%
1.0%
9.4%
None
Appropriately Trained Workforce
Financing Issues in Paying for EBPs
Modification of EBP to Fit Local Needs
Attaining or Maintaining Fidelity to EBP Model Standards
Resistance to Implementing EBPs from Practitioners
Other
MHD (n=96)
5.8%
14.3%
50.6%
9.7%
11.7%
2.6%
5.2%
None
Appropriately Trained Workforce
Financing Issues in Paying for EBPs
Modification of EBP to Fit Local Needs
Attaining or Maintaining Fidelity to EBP Model Standards
Resistance to Implementing EBPs from Practitioners
Other
DASA (n=154)
35.3%
29.4%
5.9%
11.8%
17.6%
None
Appropriately Trained Workforce
Financing Issues in Paying for EBPs
Modification of EBP to Fit Local Needs
Attaining or Maintaining Fidelity to EBP Model Standards
Resistance to Implementing EBPs from Practitioners
Other
JRA (n=17)
21.4%
42.9%
28.6%
7.1%
None
Appropriately Trained Workforce
Financing Issues in Paying for EBPs
Modification of EBP to Fit Local Needs
Attaining or Maintaining Fidelity to EBP Model Standards
Resistance to Implementing EBPs from Practitioners
Other
CA (n=14)
40
Populations Served by No Known EBPs
Q12: Does your agency serve populations or address specific client needs for which there are no known
or available evidence-based practices?
Respondents were asked if their agencies served populations or addressed specific client needs
for which there are no known or available evidence-based practices. These data are summarized
in Figure 12a. More than one-third of the agencies overall report that they serve clients whose
needs are not met by currently available EBPs. JRA report that all (100%) of their agencies
serve populations that have needs outside the scope of the available EBPs. Overall, DASA
(23%) and CA (29%) agencies both report lower percentages than MHD (45%) or JRA agencies.
Appendix F, Table Q12b shows the populations that agencies in each agency type identified as
not having any known EBPs. For MHD and DASA minority populations are the most frequently
identified, in JRA it is youth with sex offenses and cognitive impairment, and in CA it is clients
with co-occurring issues and parents referred for neglected children.
41

Figure 12a. Populations Served by No Known EBP
44.7%
22.7%
100.0%
28.6%35.1%
0.0%
20.0%
40.0%
60.0%
80.0%
100.0%
MHD (n=94)
DASA (n=154)
JRA (n=17)
CA (n=14)
Overall (n=279)
42
Interest in EBP Implementation Q13: Please rate your agency’s interest in continuing/beginning to implement EBPs into your treatment program. Ratings of interest in continuing/beginning to implement EBPs into one’s treatment program are
provided in Figure 13. Overall, most agencies are either very interested (38.4%) or extremely
interested (35.2%) in the continuing or beginning to use EBPs. Twenty percent are somewhat
interested, while only six percent had little or were not at all interested in using EBPs within their
treatment programs.
This same overall pattern of interest was evident within DASA and MHD agencies. However, in
DASA compared to MHD and the other agency types, a slightly larger percentage report little or
no interest in implementing EBPs (9%). JRA agencies report the greatest amount of interest in
the continuation of EBPs. All of JRA’s agencies report that they are either extremely or very
interested in using EBPs in their treatment program.
43
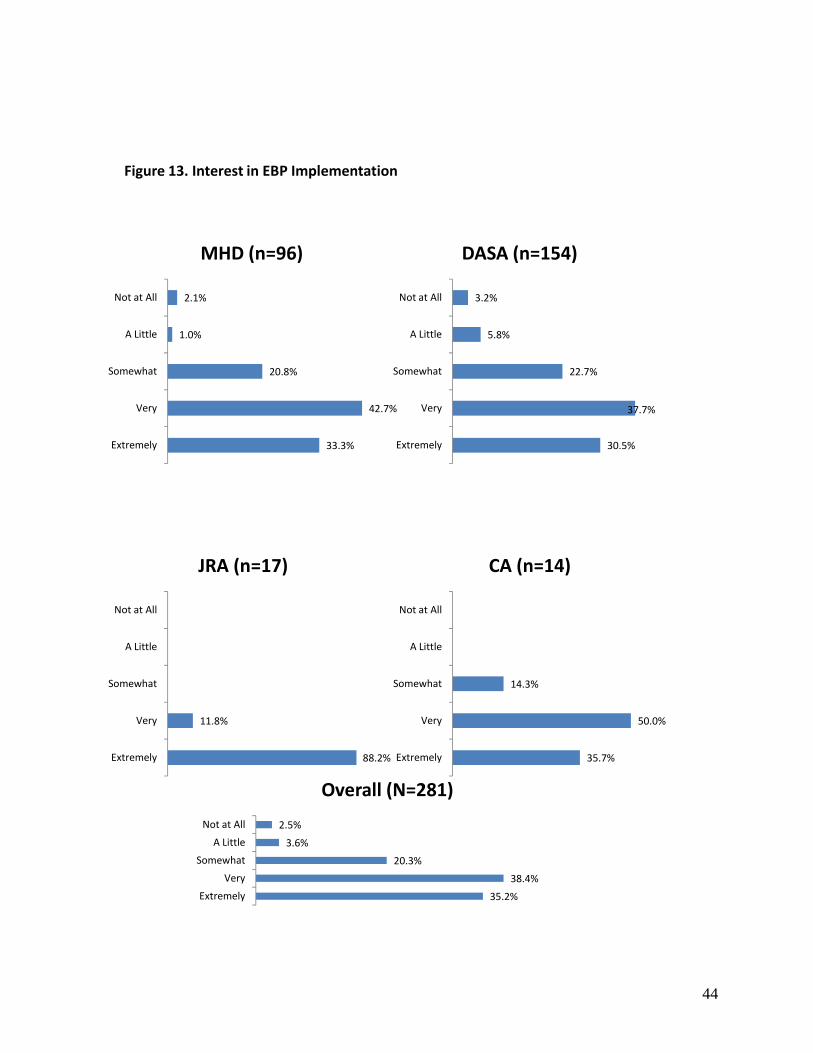
Figure 13. Interest in EBP Implementation
2.5%
3.6%
20.3%
38.4%
35.2%
Not at All
A Little
Somewhat
Very
Extremely
Overall (N=281)
2.1%
1.0%
20.8%
42.7%
33.3%
Not at All
A Little
Somewhat
Very
Extremely
MHD (n=96)
3.2%
5.8%
22.7%
37.7%
30.5%
Not at All
A Little
Somewhat
Very
Extremely
DASA (n=154)
11.8%
88.2%
Not at All
A Little
Somewhat
Very
Extremely
JRA (n=17)
14.3%
50.0%
35.7%
Not at All
A Little
Somewhat
Very
Extremely
CA (n=14)
44

Initiatives to Promote EBPs
Q14: What initiatives, if any, is your agency implementing to promote the adoption of evidence-based practices (EBPs)?
Respondents were asked to indicate which initiatives they are using to promote EBPs (see Figure
14 below). Over 90% of the agencies state that they are implementing some type of initiatives to
promote the adoption of EBPs. Seventy-six percent indicate that they are promoting increased
awareness about EBPs. In addition, 76% are implementing training for this purpose. Fidelity
monitoring (45.2%), modification of documentation forms (40.9%), and financial incentives
(10%) are also initiatives receiving support by agencies.
For the individual agency types, the patterns in MHD and DASA are very similar. All of the
JRA agencies are incorporating increasing awareness, training, modification of data reports, and
modification of documentation forms as initiatives. Neither JRA nor CA says that they use
financial incentives to promote the use of EBPs.
45

Figure 14. Initiatives to Promote EBPs
75.8%78.3%
28.5%45.2%
31.3%40.9%
10.0%7.1%7.5%
Increase Awareness about EBPs
TrainingIncorporation of EBPs in Contracts
Monitoring of Fidelity
Modification of Information Systems/Data ReportsModification of Paperwork/Documentation Forms/Guidelines to Fit EBPs …
Financial IncentivesOther
None
Overall (N=281)
80.2%
77.1%
32.3%
44.8%
32.3%
41.7%
8.3%
7.3%
6.3%
Increase Awareness about EBPs
Training
Incorporation of EBPs in Contracts
Monitoring of Fidelity
Modification of Information Systems/Data Reports
Modification of Paperwork/Documentation …
Financial Incentives
Other
None
MHD (n=96)
68.2%
75.3%
18.8%
37.7%
23.4%
35.1%
13.0%
5.8%
9.7%
Increase Awareness about EBPs
Training
Incorporation of EBPs in Contracts
Monitoring of Fidelity
Modification of Information Systems/Data Reports
Modification of Paperwork/Documentation …
Financial Incentives
Other
None
DASA (n=154)
100.0%
100.0%
47.1%
88.2%
100.0%
100.0%
23.5%
Increase Awareness about EBPs
Training
Incorporation of EBPs in Contracts
Monitoring of Fidelity
Modification of Information Systems/Data Reports
Modification of Paperwork/Documentation …
Financial Incentives
Other
None
JRA (n=17)
100.0%
92.9%
85.7%
78.6%
28.6%
28.6%
Increase Awareness about EBPs
Training
Incorporation of EBPs in Contracts
Monitoring of Fidelity
Modification of Information Systems/Data Reports
Modification of Paperwork/Documentation …
Financial Incentives
Other
None
CA (n=14)
46
Systematic Assessment of Effects of EBPs
Q15: Is your agency conducting any systematic assessment of the effects of the evidence-based
interventions that you are using?
Respondents were asked whether any systematic assessments of the effects of EBPs are being
conducted within their agencies. If respondents conduct such assessments, they were then asked
to identify the type of assessment being used. Of the 281 agencies surveyed, 107 (38%) reported
that they conduct systematic assessment(s) of the effects of evidence-based interventions (Figure
15). Of these 107 agencies, 83% use outcome monitoring, 79% use program evaluation, 28%
used Benchmarking and only 3% identified some other method. This same pattern of results is
evident among MHD, DASA and CA agencies. All of the JRA agencies report using program
evaluation to assess their EBPs’ effects.
47

Figure 15. Systematic Assessment of Effects of EBPs
28.0%
83.2%
78.5%
2.8%
Benchmarking
Outcome Monitoring
Program Evaluation
Other
Overall (N=107)
30.8%
79.5%
71.8%
7.7%
Benchmarking
Outcome Monitoring
Program Evaluation
Other
MHD (n=39)
28.8%
93.2%
81.4%
Benchmarking
Outcome Monitoring
Program Evaluation
Other
DASA (n=59)
100.0%
Benchmarking
Outcome Monitoring
Program Evaluation
Other
JRA (n=6)
33.3%
100.0%
66.7%
Benchmarking
Outcome Monitoring
Program Evaluation
Other
CA (n=3)
48
Annual Client Counts
Q16: How many unduplicated clients did your agency serve in Fiscal Year 2007 (July 1, 2006 – June 30, 2007)?
Respondents were asked to provide the unduplicated client count for the Fiscal Year 2006.
These data are provided in Figure 16. The overall mean or average of unduplicated client counts
was 1107. The highest average client count resulted from MHD (2188), followed by DASA
(532), and JRA (205). Annual client counts in FY2007 were not available for CA agencies and
are not reported in Figure 16.
49
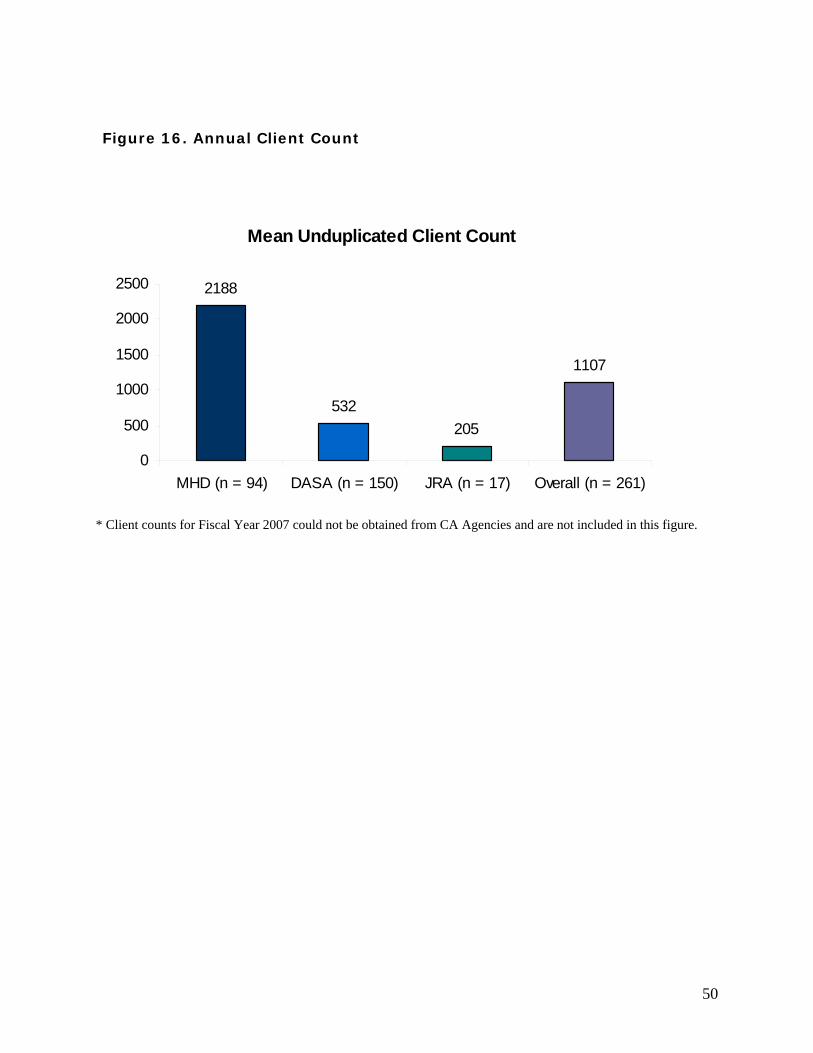
Figure 16. Annual Client Count
Mean Unduplicated Client Count
2188
532205
1107
0
500
1000
1500
2000
2500
MHD (n = 94) DASA (n = 150) JRA (n = 17) Overall (n = 261)
* Client counts for Fiscal Year 2007 could not be obtained from CA Agencies and are not included in this figure.
50
Client Counts by EBP
Q17: For each EBP that you are currently providing, please provide the total number of unduplicated clients served in FY 2007 (July 1, 2006 – June 30, 2007). Also provide the number of adults and number of children who received each practice.
The overall children, adult, and total average client counts for each EBP offered by each agency
(EBP/agency count) for Fiscal Year 2006 are provided in Figure 17. The individual EBPs by
agency average client counts appear in Tables Q17a, Q17b, and Q17c in Appendix E. The N
sizes in the figure below show the total average client counts that appear in the “column totals”
in Tables Q17a, Q17b, and Q17c in Appendix E. The N sizes may be thought of as a total of
“EBP/Agency” counts since they reflect the total number EBPs offered by all agencies. Since
one agency can offer more than one EBP the N size is larger than the total number of agencies.
For instance, a single agency that offers 7 EBPs would have an EBP/Agency count of 7; 96
agencies that each offers 7 EBPs would have a total EBP/Agency count of 672 (7 x 96).
Figure 17 shows that the total EBP/Agency count is 636, for agencies that serve children it is 353
and for those that serve adults it is 455. Hence, the 34 EBPs were offered 636 times across 281
agencies in 2007. On average, 192 clients receive each of the 636 EBP/agency units. Based
upon our sample the total number of clients receiving EBPs is approximately 122,112 (636 X
192) as reported by the surveyed agencies; for children it is 31,064 and Adults it is 91,455. The
total count does not exactly reconcile with the addition of the adult and child counts because
some agencies may use the same EBP for adults and children.
According to Table Q17a, the highest number of clients served per EBP is as follows: Cognitive
Behavior Therapy (29,623), Medication Management (18,849), Motivational Interviewing
(17,205) Peer Support (8485), Family Psychoeducation (7209), and Dialectical Behavioral
Therapy (7709).
51
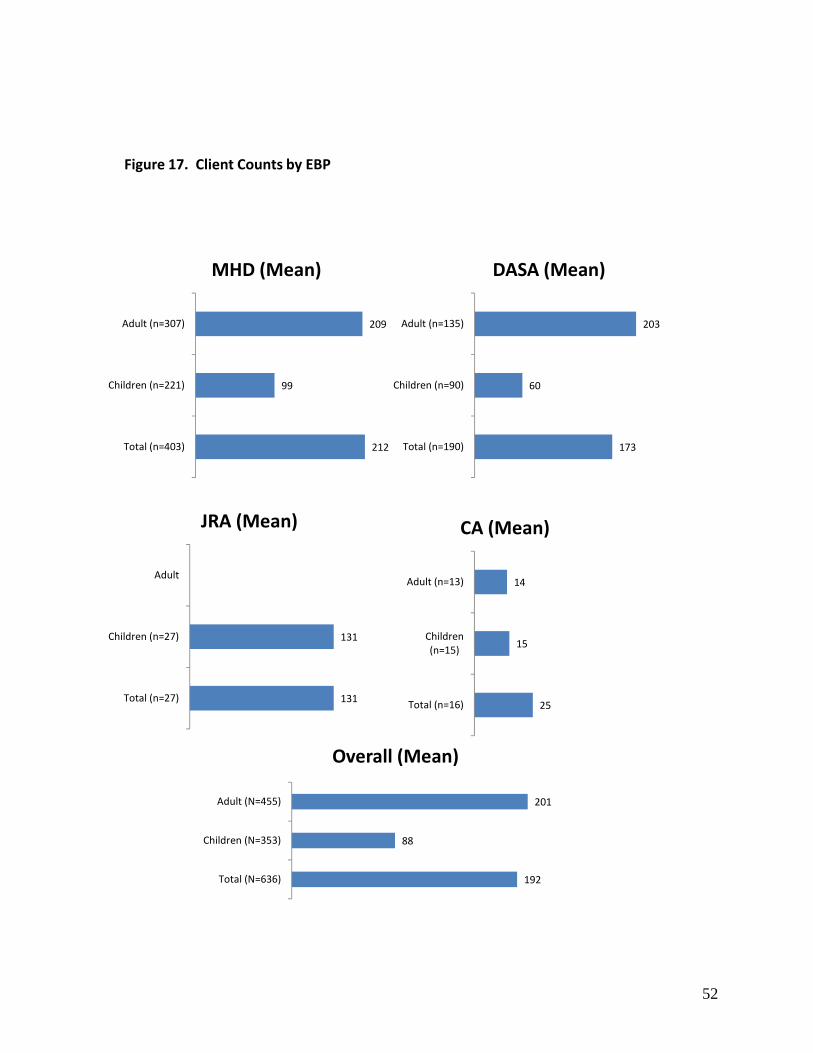
Figure 17. Client Counts by EBP
131
131
Adult
Children (n=27)
Total (n=27)
JRA (Mean)
14
15
25
Adult (n=13)
Children (n=15)
Total (n=16)
CA (Mean)
209
99
212
Adult (n=307)
Children (n=221)
Total (n=403)
MHD (Mean)
203
60
173
Adult (n=135)
Children (n=90)
Total (n=190)
DASA (Mean)
201
88
192
Adult (N=455)
Children (N=353)
Total (N=636)
Overall (Mean)
52

Respondent Average Number of Years at Agency
The average number of years that the survey respondent had worked at his or her agency is
summarized in Figure 18. These data revealed that survey respondents worked an average of
10.5 years at their agencies, overall. CA averaged the highest number of years (16 years),
followed by JRA respondents who averaged 14.8 years. MHD respondents worked an average
of 12.3 years, while DASA averaged the fewest number of years at work with 8.5 years overall.
53

Figure 18. Respondent Average Number of Years at Agency
12.3
8.5
14.816.0
10.5
0.0
2.0
4.0
6.0
8.0
10.0
12.0
14.0
16.0
18.0
MHD (n=96)
DASA (n=154)
JRA (n=17)
CA (n=14)
Overall (n=281)
Mean Years at Agency
54