MENERaLOGIC 2ND PETHOTjOGrC JNVEgnGKTICK …/67531/metadc692142/m2/1/high... · deuteric,...
64
UCID--19975 DE84 005221 MENERaLOGIC 2ND PETHOTjOGrC JNVEgnGKTICK OF PHE-TEST OOEE SAMFTES FBCtt TOE SPHfT FUEL, TOgP-fTiTWaX F. J. FKERSCN B. j. oumsEm EECEMBEH 1983 Tab baa iaforaal report ialnied praurilyforiatertnl or Hailed extcnul dbtriaitloa. 11K opalooa aad coadajloas sated ire dion of the aatkor mi miy or my not be those of the Laboratory. Work performed w o w the ussicci of the U.S. Department of Energy by the lir,n« LiTeratore Laboratory unfcr Contra W-740S-Rat-U.
Transcript of MENERaLOGIC 2ND PETHOTjOGrC JNVEgnGKTICK …/67531/metadc692142/m2/1/high... · deuteric,...

UCID--19975
DE84 005221
MENERaLOGIC 2ND PETHOTjOGrC JNVEgnGKTICK OF PHE-TEST OOEE SAMFTES
FBCtt TOE SPHfT FUEL, TOgP-fTiTWaX
F . J . FKERSCN B. j . oumsEm
EECEMBEH 1 9 8 3
Tab b a a iaforaal report ialnied praurily for iatertnl or Hailed extcnul dbtriaitloa. 11K opalooa aad coadajloas sated ire dion of the aatkor mi miy or m y not be those of the Laboratory. Work performed w o w the ussicci of the U.S. Department of Energy by the l i r , n « LiTeratore Laboratory unfcr Contra W-740S-Rat-U.

Mineralogic and Petrolcgic Investigation of Pre-Test Core Samples
from the Spent Fuel Test-Climax
by
F.J. Ryerson and 6.J. Qualheim
DISCLAIMER
This report wis prepared as an account of work sponsored by an agency of the United States Govcrnmtol. Neither the United States Government nor any agancy thereof, not any of their employees, makes any warranty, express or im-died, or assumes any legal bYjility or responsibility for the accuracy, completeness, or usefulness of any information,, apparatus,, product, or process disclosed* or represents that its use would not infringe privately owned rights. Reference herein to any specific commercial product, process, or service by trade name, trademark* manufacturer, or otherwise does not necessarily .constitute or imply its endorsement, recom-tftendalion, or favoring by the United States Government or any agency thereof. The views vni opinions of authors expressed herein do not necessarily state or reflect those of the United State; Government 01 any agency thereof.
nsTnwmM OF THIS mmm is mmm '<&

2-
ABSTRACT
Pre-test samples obtained from just inside the perimeter of the canister emplacement holes at the Spent Fuel Test-Climax have been characterized by petrographic and microanalytical techniques- The primary quartz monzonite has undergone various degrees of hydrothermal alteration as a result of natural processes. Alterat ion is most apparent on primary plagioclase and biot i te. The most common secondary phases on plagioclase are muscovite and calcite, v.-hile the most common secondary phases on biotite are epidote and chlorite. The major alteration zones encountered are localized along f i l led fractures, i.e. veins. The thickness and mineralogy of the alteration zones can be correlated with the vein mineralogy, becoming wider and more complx mineralogically when the veins contain calcite.
INTRODUCTION
The Spent Fuel Test-Climax (SFT-C) is being conducted under the technical direo ion
of the Lawrence Livormore National Laboratory as part of the U.S. Department i f
Energy's Nevada Nuclear Waste Storage Investigations (NNWSI). The main objective of
the SFT-C is to evaluate the technical feasibility of short-term emplacement and
retrieval of spent reactor fuel assemblies at plausible repository depth in granitic rocks
(Ramspott et al . , 1979). A secondary, though equally important, objective is the
evaluation of a typical granitic rock's response to the thermal and radiation fields
produced by the spent fuel assemblies. Simply, how are the physical, thermal and
mineralogical properties of the country rock altered during the course of exposure?
These data are necessary if granitic rocks are to be qualified as possible long-term
repositorit/t for either spent fuel or reprocessed commercial end mil i tary reactor waste.
-3-
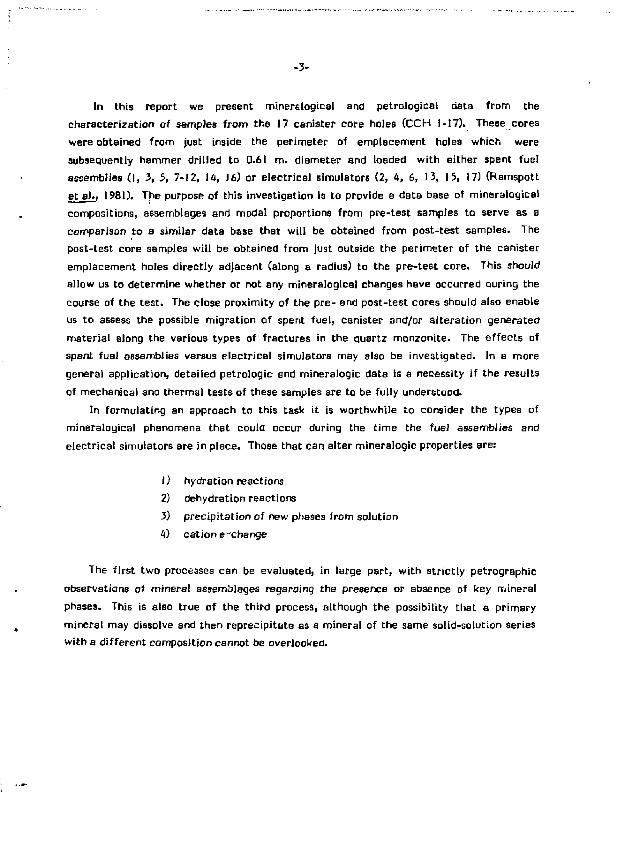
In this report we present minere logical and petrologies! data from the
characterization of samples from the J 7 canister core holes (CCH 1-17). These cores
v/ere obtained from just inside the perimeter of emplacement holes which were
subsequently hammer dril led to 0.61 m. diameter and loaded with either spent fuel
assemblies ( I , 3, 5, 7-12, 14, 16) or electrical simulators (2, 4, 6, 13, 15, 17) (Ramspott
et a)*, 1981). The purpose of this investigation is to provide a data base of mineralogies!
compositions, assemblages and modal proportions from pre-test samples to serve as a
comparison to a similar data base that wi l l be obtained from post-test samples. The
post-test core samples wil l be obtained from just outside the perimeter of the canister
emplacement holes directly adjacent (along a radius) to the pre-test core. This should
allow us to determine whether or not any mineralogies] changes have occurred auring the
course of the test. The close proximity of the pre- and post-test cores should also enable
us to assess the possible migration of spent fuel, canister and/or alteration generated
material along the various types of fractures in the quartz monzonite. The effects of
spent fuel assemblies versus electrical simulators may also be investigated. In a more
general application, detailed petrologic and mineralogic data is a necessity if the results
of mechanical ana thermal tests of these samples are to be fully understood.
In formulating an approach to this task it is worthwhile to consider the types of
mineralogical phenomena that could occur during the time the fuel assemblies and
electrical simulators are in place. Those that can alter mineralogic properties are:
0 hydration reactions 2) dehydration reactions
3) precipitation of new phases from solution
4) cation exchange
The f irst two processes can be evaluated, in large part, with str ict ly petrographic
observations of mineral assemblages regarding the presence or Bbsence of key mineral
phases. This is also true of the third process, although the possibility that a primary
mineral may dissolve and then reprecipitate as a mineral of the same solid-solution series
with a different composition cannot be overlooked.

_4
The observation of the third process requires compositional data and, clearly, so do changes caused by the fourth process, cation exchange. As such, our approach is one of combined petrographic analysis and compositional analysis by electron micrpprobe techniques.
GEOLOGIC SETTING
The Climax stock, located on the U.S. Department fo Energy's Nevada Test Site
(NTS), is a composite granitic pluton composed of an equigrenular biotite granodiorite
and a porphyritic biotite quartz monzonite. The Cretaceous Age pluton is intruded into
Paleozoic carbonate rocks (Maldonado, 1977). The intrusion has caused recrystallization
of the carbonates to form marbles, and locally tungsten-bearing skarns are present. The
SFT-C tunnel complex lies entirely within the quartz rrconzonite.
PREVIOUS INVESTIGATIONS
Connolly (1981) has studied the hydrothermal alteration of rocks from the SFT-C
tunnel complex. This work provides an excellent background for the present study as it is
not restricted to wait-rock alteration in samples from only the CCH's, where the
alteration is structurally controlled and ofi.en poorly developed. His work concentrates
upon alteration zones approximately 5m in extent which display no apparent control by
structural features. Tha larger spatial extent of the unlocalized alteration assemblages
allows more meaningful modal characterization of the alteration assemblages (Table 1).
Including the pervasive deuteric alteration, five alteration types are observed.'
deuteric, propylit ic, argiltic, phyllic, and potassic (Connolly, 1981). These alteration
zones ere often sharply defined and concentrically arranged progressing inward from
deuteric to potassic. Th<5 average modes indicate that the presence or absence of certain
key phases in the these alteration zones may be useful in classifying the structurally
controlled localized wall-rock alteration : ones (Table I) . The potassic alteration is
characterized by the high modal abundance of K-feldspar ( 57 vol.K) and low modal
-5-
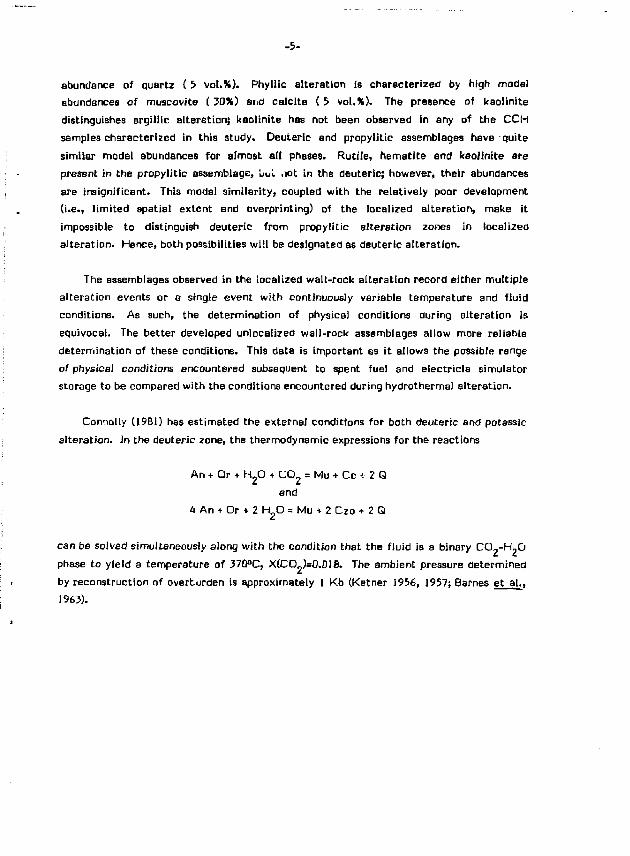
abundance of quartz ( 5 vol.S). Phyllic alteration is characterized by high modal abundances of muscovite ( 30%) and calcite ( 5 vol.%). The presence of kaolinite distinguishes argil]ic alteration; kaolinite has not been observed in any of the CCH samples characterized in this study. Deuierio and propylitic assemblages have quite similar modal abundances for almost all phases. Ruti'te, hematite and treolinite ate present in the propylitic assemblage, uul not in the deuteric; however, their abundances are insignificant. This modal similarity, coupled with the relatively poor development (i.e., l imited spatial extent and overprinting) of the localized alteration, make it impossible to distinguish deuteric from propylitic alteration zones in localized alteration. Hence, both possibilities wil l be designated as deuteric alteration.
The assemblages observed in the localized wall-rock alteration record either multiple alteration events or a single event with continuously variable temperature and f luid conditions. As such, the determination of physical conditions during alteration is equivocal. The better developed unrealized wall-rock assemblages allow more reliable determination of these conditions. This data is important es i t allows the possible range of physical conditions encountered subsequent to spent fuel and eiectricia simulator storage to be compared with the conditions encountered during hydrcthermal alteration.
Connolly (1981) has estimated the external conditions for both deuteric and potassic
alteration. In the deuteric zone, the thermodynamic expressions for the reactions
An + Or + H.O + CO = Mu + Cc -.• 2 Q and
4 An + Or + 2 H O = Mu + 2 Czo + 2 Q
can be solved simultaneously along With the condition that the fluid is a binary C G 7 - H ? 0
phase to yield a temperature of 370°C, X(CO„)=0.018. The ambient pressure determined
by reconstruction of overturden is approximately 1 Kb (Ketner 1956, 1957; Barnes et al . ,
1963).
-6-
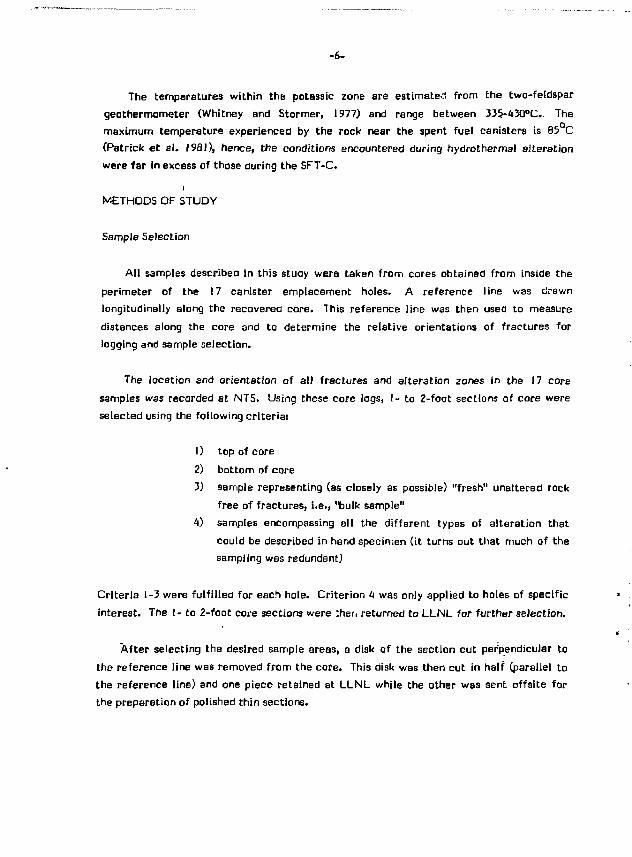
The temperatures within the potassic zone are estimated from the two-feldspar geothermometer (Whitney and Stormer, 1977) and range between 335-430°C. The maximum temperature experienced by the rock near the spent fuel canisters is 85 C (Patrick et a l . 1991), hence, the conditions encountered during hydrothermal alteration were far in excess of those during the SFT-C.
METHODS OF STUDY
Sample Selection
Al l samples describee in this study were taken from cores obtained from inside the perimeter of the 17 canister emplacement holes. A reference line was drawn longitudinally along the recovered core. This reference line was then used to measure distances along the core and to determine the relative orientations of fractures for logging and sample selection.
The location and orientation of alJ fractures and alteration zones in the 17 core samples was recorded at NTS. Using these core logs, I - to Z-foot sections of core were selected using the following cri teria:
1) top of core
2) bottom of core 3) sample representing (as closely as possible) "fresh" unaltered rock
free of fractures, i.e., "bulk sample" 4) samples encompassing all the different types of alteration that
could be described in hand specimen (it turns out that much of the sampling WBS redundant)
Criteria 1-3 were ful f i l led for each hole. Criterion 4 was only applied to holes of specific
interest. The I - to 2-foot core sections were ;her; returned to LLNL for further selection.
After selecting the desired sample areas, a disk of the section cut perpendicular to the reference line was removed from the core. This disk was then cut in half (parallel to the reference line) and one piece retained et LLNL while the other was sent offsite for the preparation of polished thin sections.

-7-
Petrography and Modal Analysis
Al l thin sections were observed in plane and cross-polarized transmitted light in
order to determine mineral assemblages and textures (Appendix A). A number of samples
were then point counted (2000 point modes) in transmitted light in order to determine
modal abundanqes. The samples selected for modal analyses are:
1) all samples from CCH-I 2) the 'bulk sample" from each hole
Samples from group (1) are used to demonstrate the variation in modal abundances in a
specific hole. These variations are due to alteration and vein injection. The group (2)
samples were chosen as "fresh" rock. Modal variations among these samples should,
therefore, demonstrate the range of modal abundances in unaltered rock as a function of
position along the canister dr i f t .
Microprobe Analysis
Microprobe analyses were obtained in both automated and interactive modes
employing a 2pm x 2 urn rastered beam at 15 na sample current (measured in a Faraday
cup) with an accelerating voltage of 15 kV. The totally automated analyses were
undertaken in order to objectively determine the frequency of K-feldspar and plagioclase
compositions within selected samples. In this mode 300 analyses were obtained along a
grid covering the sample surface. Approximately 600 12-element analyses we/e obtained
in a 24-hour period. The interactive analysis required operator selection of specific
analysis points. This was done in order to determine the compositions of alteration
phases which are normally low in the modn.

-8'
PETROGRAPHY
Unaltered Rock
The oufirtz monzonite is a porphyritie rock composed of a groundless which is predominately equant, subhedral greins of plegioclaae, K-felcispar, quart?, end biotite ranging in sire from 0.5-2.0 mm in diameter. Igneous accessory phases (t itanite, allanite, zircon, and apatite) are below 3 volume X and show no effects of hydrothermal alteration (Conrolly, 1981).
Piagioctese in the grountfmess is tabular and elongate. Oscillatory sorting is e common feature, and polysynihetic twinning is ubiquitous. Plagioclase commonly contains inclusions qf clino?oisite, epiaote and caicite associated with hydrothermal alteration.
Quartz and K-feldspsr ere present both in the groundmass and as phenocrysts. In the grcondroass both have anhedral to subhedral granular habits. The k-feldspars are untwinned, and the quartz commonly displays undulatory extinction. Phenoerysts of K-felospar (4-6 mm in length} are anhedral and commonly perthic. Quartz phenocrysts (3-1 b mm) are commonly composed of a number of smaller grains.
Biotite has a tabular habit end can be as large as 1 mm. Biotite is commonly altered to some subset of the minerals chlorite, muscovtte, epidote, t i tanite, rut i ie, calcite, and pyrite.
Vein Mineralogy
Two distinctly different types of mineral assemblages are found in the veins within the canister dr i f t region. The f i rst vein, henceforth referred to as "barren," is composed of quartz with or without pyrite. Alteration zones adjacent to the barren veins are typically thin (<5 mm) and lack intense secondary mineralization. In particular, calcite is never found in these alteration zones.

-9-
The second vein assemblage is composed of quart?, calcite, pyrite, and apatite. It
may also contain grains of muscovite, K-feldspar and intensely altered plagioclase. The
alteration zones adjacent to these " fer t i le" veins can be as large as 2 cm in diameter and
often show intense alteration.
Alteration of Plagioclase
Plagiociase from the Climax stock is almost always altered to some combination of muscovite, epidote and calcite (Table II). The alteration assemblages found here are similar to those described by Ferry (1979) for mesozona! granitic piutons. The most common assemblages are (a) plagioclase and muscovite and (b) plBgioclase, muscovite and calcite which are found in 4354 and 35% of the sample areas studies, respectively (Appendix A). The alteration phases generally have irregular outlines, although muscovite is often present as fan-shaped aggregates. The percentage of plagiociase converted in a single grain can range from 0-75 volume %, and the distribution of converted and unconverted is sporadic although greater conversion is noted near veins.
Photomicrographs of typical plagioclase alteration assemblages are presented in
Figure 1. It should also be noted that the plagioclase alteration assemblages can be
correlated with the vein mineral assemblage about which they are localized.
Assemblages B and D (from Table II) are usually found adjacent to "barren" veins, while
assemblages C and E are found adjacent to " fer t i le" veins.
In characterizing the plagioclase alteration assemblages, we have chosen not to
distinguish clinozoisite from iron-bearing epidote. The complex zoning patterns make
such a separation quite cumbersome for these samples. Figure 2 shows a backscattered
electron image and corresponding Fe^ X-ray image of an "epidote" grain includea in
altered pisgioclase. The image illustrates discontinuous oscillatory zoning on a 10 um
scale in which the grain has compositions ranging from pure clinozoisite to Fe-rich epidote.

-10-
Alteration of Biotite
The alteration of biotite in these samples is extremely complex and makes any
classification scheme quite di f f icul t . The secondary phases found on biotite include
chlorite, muscovite, epidote, t i tanite, rut i le, calcite, and pyrite (Appendix A). In any
particular sample, the number of phases found on biotite may vary. For instance, one
biotite grain may include only chlorite while an adjacent grain contains chlorite and
epidote. We have chosen to base our classification scheme on the maximum number of
phases found on biotite rather than on the most frequent assemblage. The variability and,
in some cases, large number of phases may be related to variability in the pore fluid
composition during alteration and/or the variability in cation transport paths within the
rocks.
A large variety of alteration assemblages are found on biotite (Table 111). The most
common assemblages are (a) biotite and chlorite, and (b) biotite, chlorite and epidote and
(c) chlorite, muscovite, epidote, and titanite which are found in 2}%, 20% and 13%,
respectively, of the samples classified.
The alteration assemblages in Table III record a progressive loss of iron and
magnesium from the biotite sites. This is f irst seen by the replacement of biotite by
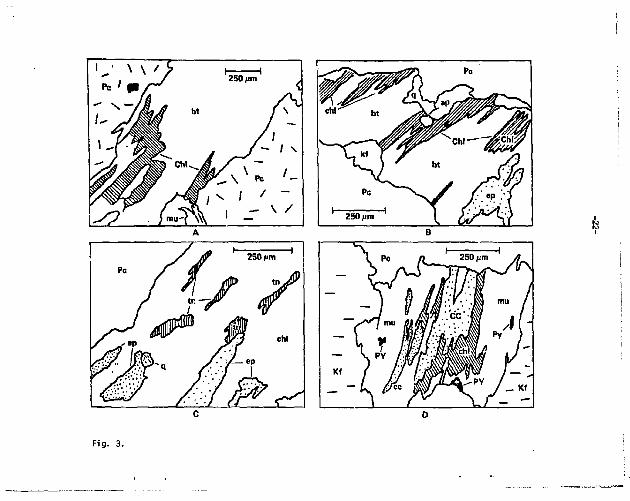
chlorite. Chlorite appears as symplectic intergrowths in biotite (Fig. 3a). A similar
texture is observed in biotite-chlorite-epidote assemblages where biatite intergrowths are
often crosscut by anhedral equent grains of epidote (Fig. 3b and c). Further depletion of
iron and magnesium results in the complete disappearance of biotite. This often results in
symplectic intergrowths of muscovite and chlorite which include scattered anhedral
grains of epidote or t i tanite and/or rutile needles (Fig. 3d-f). Eventually, even chlorite
may disappear leaving assemblages that are predominantly muscovite. An additional
feature of the biotite-free samples is the presence of calcite after biotite. The cBlcite
commonly appears along cleavage traces in chlorite or muscovite but may also be found
as anhedral grains with these phases (Fig. 3d).

-11-
Moda1 Analyses v-
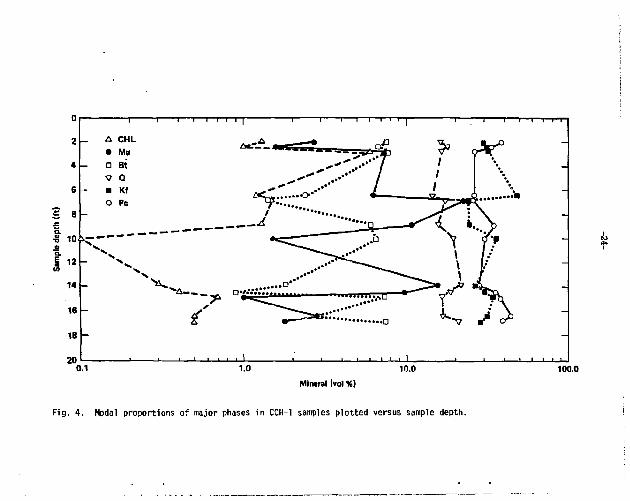
Results of modal analyses for CCH-1 samples and "bulk samples" from each of the 17 CCH's are presented in volume S and were obtained from 2000 point modes (Appendix B). Percentages of key phases have been plotted against sample position in Figures A and 5.
Model analyses for the CCH-1 were obtained from the entire thin section regardless of any sample heterogeneity. Material from veins, alteration zones and unaltered regions were all counted equally in older that SBr.iple variability on this scale could be documented. Modal percentages for the primary phases, quartz, plagioclase, and K-feldspar, are fairly constant with average modal volumes of 17.3% + 2. l%, 3Z.B%+?.6% and 31.2%+5,3%, respectively. The 1-sigma variation for plagioclase and K-feldspar are similar in spite of the much more pronounced alteration of piagioclase. Biotite is also a primary phase but displays a much larger percent variation than do the felsic phases. The average biotite volume is 4.9+2.7%. The higher variability in biotite abundance is consistent with textural variability demoistrated earlier for biotite alteration.
Muscovite, chlorite, epidote, clino2oisite, t i tanite, and pyrite are present as
secondary minerals. Their secondary origin is reflected in much larger variations in their
modal abundance (Table IV, Fig. U) and results from both variability in alteration down
CCH-I and tD the presence or absence of veins which carried the hydrothermal solutions.
The modal abundances for the "bulb samples" have not been collected in manner
which includes the larger phenocrysts, and therefore, cannot be compared directly with
the oata in Table 1 in which only the groundmass phases were counted (the high modal
abundance of K-feldspar phenocrysts may account for the generally lower abundance of
Quartz and higher modal abundance of K-feldspar in our data as compared to that of
Connolly (1981)). Of the primary phases, only plagioclase appears to be significantly
higher in the trash "bulk samples" than in the variably altered samples from CCH- I ,
42.B& versus 3 ' .8X, respectively. This is consistent with the observation that plagioclase
is the only felsic phase which undergoes significant alteration.

-12-
The modal volumps of the secondary phases are as variable in the "bulk samples" as in
those from CCH-1 (Table V, Fig. 5). However, the average volumes of secondary phases
in the bulk samples has decreased.
MINERAL CHEMISTRV
Primary Phases
The major primary igneous phases are quartz, plegioclase, K-feldspar, and biot i te.
Analyses obtained in the interactive mode are presented in Appendix C. In addition to
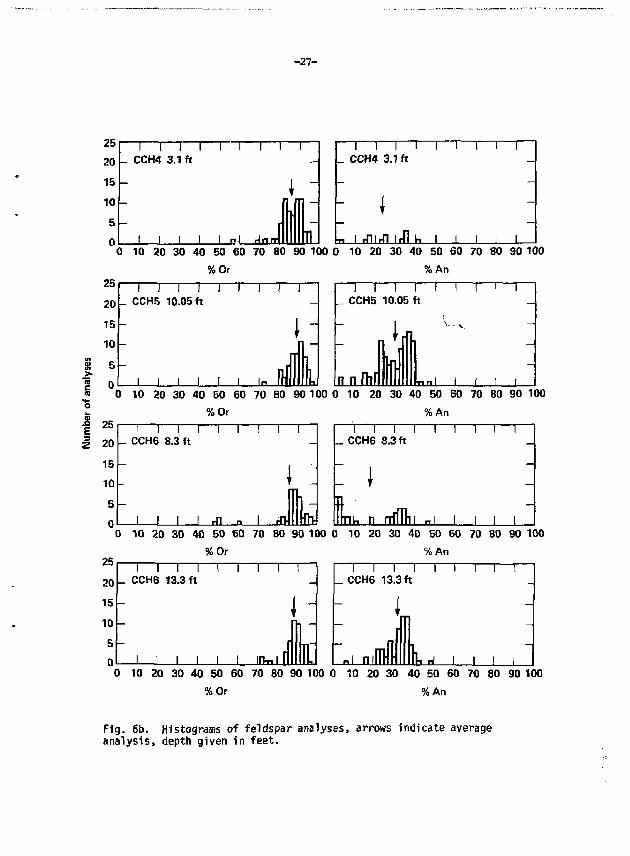
interactive analyses, feldspar analyses were also obtained by automated step-scan
treverses in order to objectively determine the extent of zoning and average feldspar
compositions (Fig. 6).
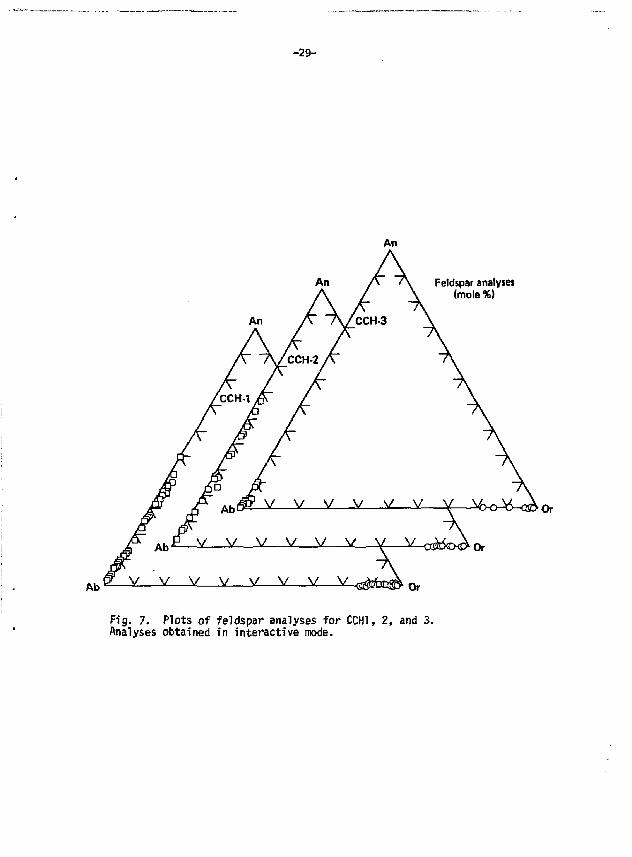
Histograms of feldspar analyses obtained from step-scan traverses indicate that the K-feldsper analyses vary between O r „ n and Org f i with only occasional analyses falling at lower Or concentrations. The average analysis is O r 9 f l , and shows very l i t t le variation from sample to sample. These values agree quite well with those obtained during the interactive analyses (Fig. 7). The K-feJdspars show very l i t t le alteration, so that the variation must be due to a combination of primary igneous zoning coupled with subsolidus reequilibration.
The majority of the plagtoclase composition fall between An -An. with the
average at A n , , (Fig. 6). Again, sample-to-sample variation in average analysis and
frequency is small. In contrast to the K-feldspar analyses, comparison of the plagioclase
analyses collected in automated and interactive analyses show an important difference
(Figs. 6 and 7). The interactive analyses focused upon plagicclase grains which contained
significant amounts of secondary phases. This group of analyses contains significantly
more analyses in the range An__-An- than do those obtained in the automated step-scan
traverses. This feature, which has also been observed by Ferry (19793, is indicative of
incongruent plagioclase alteration. The albite endmember is conserved during
hydrothermal alteration, while the anorthite component is preferentially dissolved and
transported from the plagiociase site.

-13-
The biotite analyses can be represented by the formula,
K t T i 0 . 2 0 . 2 < F e ' M 9 ) 2 . 4 A , 0 . 2 ] [ A 1 1 . 2 5 i 2 . 8 ] O l 0 ( O H ) 2
The Mg/(Mg+Fe) ratio in these biotites lies between 0.50 and 0.66 (Fig. 8).
Secondary Phases
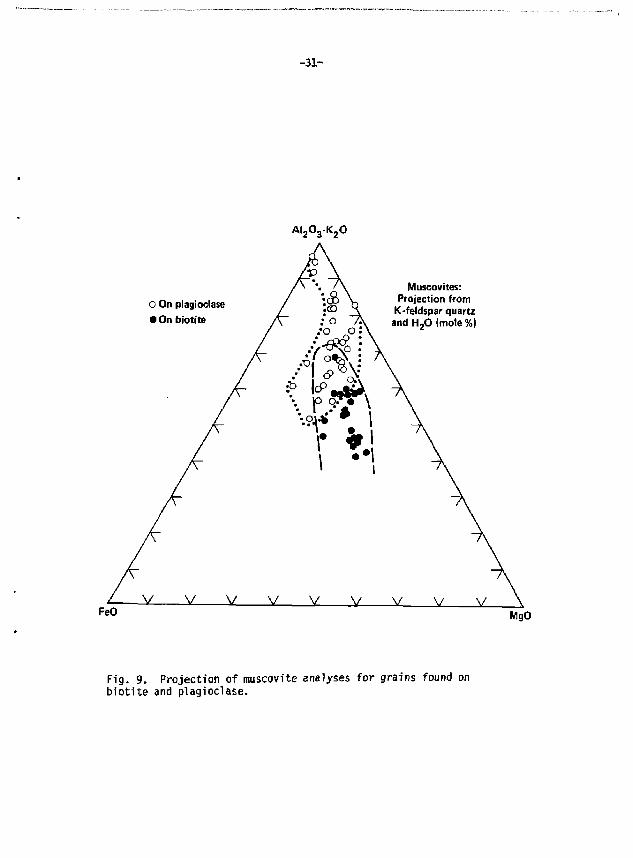
Al l data for secondary minerals was collected in an interactive mode and is presented in Appendix C. The muscovite compositions fal l in the range approximated by the formula,
K (Mg ,Fe_ 8 | A l I 4 6 )A l > e S i 3 _ 2 O | ( J (OH) 2 -KA I 2 (A lS i 3 )O J 0 (OH) 2 ,
with a range in Mg/(Mg+Fe) (atom) between 0 and 1.0. When projected onto the plane (Al 0 3 - K 0)-MgO-FeO from quartz, K-feldspar snu f-LO, i t can be shown that the muscovites which are found to be pseudomorphing biotites ere generally enriched in MgO and FeO relative to those found on plagioclase (Fig. 9). This is most likely indicative of increased activities of the components on the biotite sites and indicates that cation exchange equilibrium between plagioclase and biotite sites was not attained on even a thin section scale during hydrothermal alteration.
Chlorite is found exclusively on biotite sites, and its composition is given by the
formula (Fe,MgL Jvin . „ A I „ Si„ _O. 0 (QH)„ . The range in Mg/(Mg+Fe) is between 0.42
b.rd 0.74 and is slightly larger than the range for the primary biotite (Fig. 8).
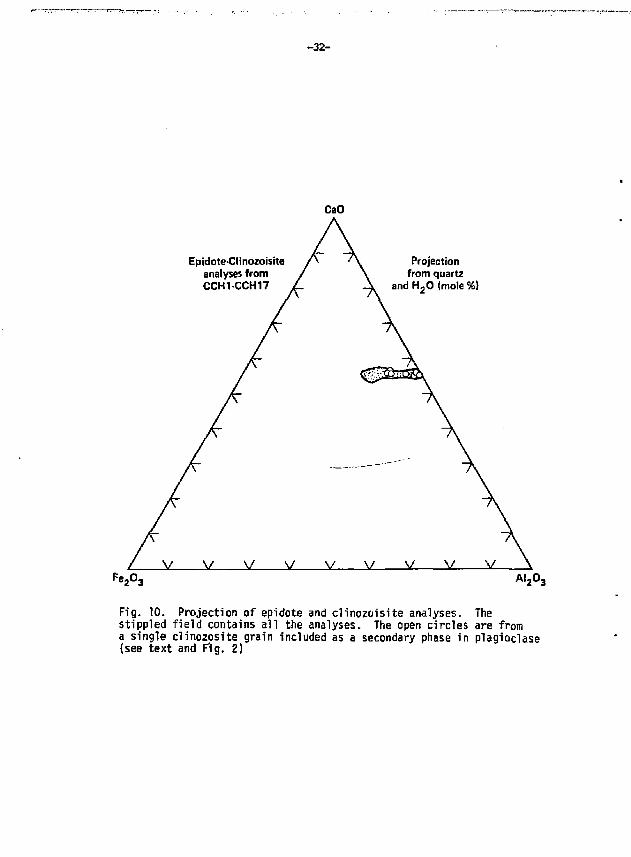
Mineral compositions and zoning patterns in the clinozoisite-epidote series are complex. The compositions are generally expressed by the formula Ca„(Al,Fe + ) S i , 0 ) ? (OH) . Given the complexity of the zonation, we have arbitrarily tabulated the analyses of this phase on plagioclase as "clinozoisite" and those on biotite as "epidote" (Appendix C). Generally, the "epidotes" found on biotite are more iron-rich than the "clinozoisites" found on plagioclase. The Al/(A1+Fe) in the epidotes ranges from 0.86-0.68 while that in the clinozoisites varies between 0.99 and 0.79. A large variation in AI/(Al+Fe) can occur in a single grain of clinozoisite. For instance, the -analyses of clinozoisites found on a single grain of "clinozoisite" in plagioclase (Fig. 2) cover a large portion of the f ield of clinozoisite-epidote analyses encountered in the entire study area (Fig. 10).
-14-
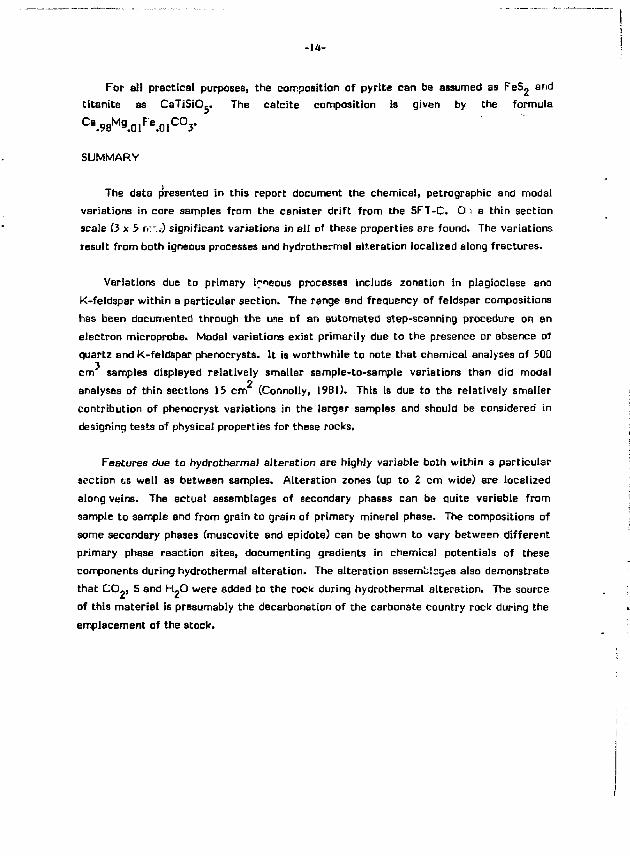
For all practical purposes, the composition of pyrite can be assumed as FeS„ arid t i tanite as CaTiSiCU. The calcite composition is given by the formula C a .98 M 9.oi F e .o . c °y
SUMMARY
The data presented in this report document the chemical, petrographic and modal variations in core samples from the canister dr i f t from the SFT-C. On a thin section scale ( 3 x 5 rr.-.i) significant variations in all of these properties are found. The variations result from both igneous processes and hydrothermal alteration localized along fractures.
Variations due to primary igneous processes include zonation in plagioclase ano
K-feldspar within a particular section. The range end frequency of feldspar compositions
has been documented through the une Df an automated step-scanning procedure on an
electron microprobe. Modal variations exist primarily due to the presence or absence of
quartz and K-feldspar phenocrysts. I t is worthwhile to note thBt chemical analyses of 500
cm samples displayed relatively smaller sample-to-sample variations than did model
analyses of thin sections 15 cm (Connolly, 1961}. This is due to the relatively smaller
contribution of phenocryst variations in the larger samples and should be considered in
designing tests of physical properties for these rocks.
Features due to hydrothermal alteration are highly variable both within a particular
section £S well as between samples. Alteration zones (up to 2 cm wide) are localized
along veins. The actual assemblages of secondary phases can be quite variable from
sample to sample and from grain to grain of primary mineral phase. The compositions of
some secondary phases (muscovite and epidote) can be shown to vary between different
primary phase reaction sites, documenting gradients in chemical potentials of these
components during hydrothermal alteration. The alteration assemblages also demonstrate
that CO, , S and f-UO were added to the rock during hydrothermal alteration. The source
of this material is presumably the decarbonaticn of the carbonate country rock during the
emplacement of the stock.
-15-
REFERENCES
Connolly, J.A., "Hydrothermal alteration in the Climax granite stock at the Nevada Test Site," Arizona State University, Tempe, AZ., unpublished M.S.
Thesis. (1981)
Ferry, J.M., "Reaction mechanisms, physical conditions and mass transfer
during hydrothermal alteration of mica and feldspar in granitic rocks
from south-central Maine, U.S.A.," Contrib. Mineral. Petrol., 68, 125-
139,(1979)
Maldonado, F., "Summary of geology and physical properties of the Climax Stock
Nevada Test Site," Open File Report 77-356, U.S. Geological Survey,
Washington, D.C. (1977)
Patrick, W.C., L.B. Ballou, T.R. Butkovitch, R.C. Carlson, W.B. Durham, G.L.
Hage, E.L. Majer, D.N. Montan, R.A. Nyholm, N.L.Rector, D.G. Wilder and
J.L. Yow, Jr., "Spent Fuel Test-Climax: Technical measurements, interim
report, fiscal year 1981," Lawrence Livermore National Laboratory, UCRL-
53294,(1982).
Ramspott, L.D., L.B. Ballou, R.C. Carlson, J.E. Duncan, W.C. Patrick, D.G.
Wilder, W.G. Brough and M.C. Mayr, "Technical concept for a test of
geologic storage of spent reactor fuel in the climax granite, Nevada
Test Site," Lawrence Livermore National Laboratory, UCRL-52796 (1979).
Ramspott, L.D., L.B. Batlou and W.C. Patrick, "Status report on Spent Fuel
Test-Climax: A test of geologic storage of High-Level waste in
granite," Lawrence Livermore National Laboratory, UCRL-85516, (1981)
Whitney, J.A. and J.C. Stormer, "The distribution of NaAISi,0_ between coexisting microcline and plagioclase and its effect on geothermometric calculations," Am. Min., 62, 687-691.
-16-
TABi.E I
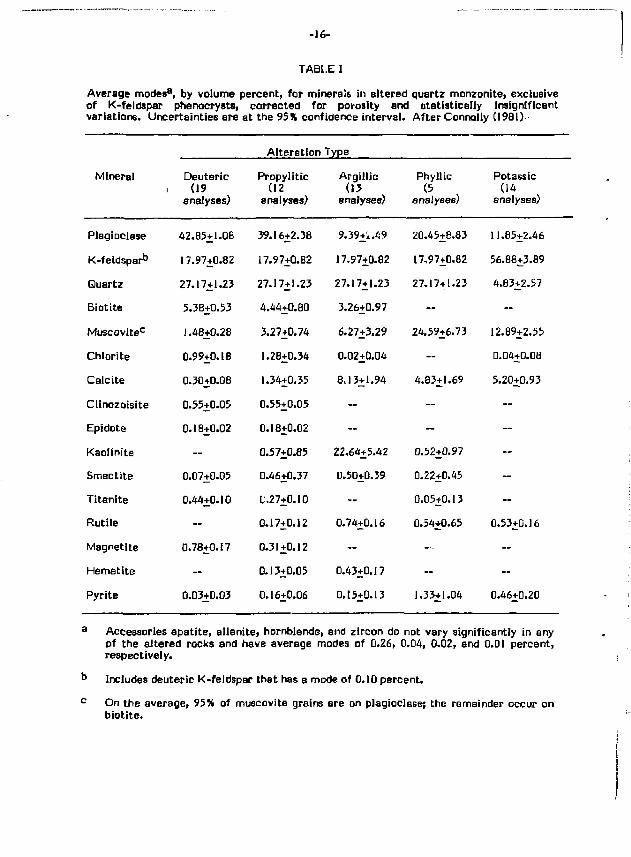
Average modes 8, by volume percent, for minerals in altered quartz monzonite, exclusive of K-feldspar phenocrysts, corrected for porosity and statistically insignificant variations. Uncertainties are at the 95% confidence interval. Af ter Connolly (1981)
Alteration Type
Mineral Deuteric . (19
analyses)
Propylitic (12
analyses)
Argi l l ic (13
analyses)
Phyllic (5
analyses)
Potassic (14
analyses)
Plagioclase 42.85+1.08 39.16+2.38 9.39+i .49 20.45+8.83 11.85+2.46
K-feldspar° 17.97+0.82 17.97+0.82 17.97+0.82 17,97+0.82 56.88+3.89
Quartz 27.17+1.23 27.17+1.23 27.17+1.23 27.17+1.23 4.83+2.57
Biotite 5.3B+O.S3 4.44+0.80 3.26+0.97 - ~
Muscovite 0 1.48+0.28 3.27+0.74 6.27+3.29 24.59+6.73 12.89+2.55
Chlorite 0.99+0.18 1.28+0.34 0.02+0.04 ~ 0.04+0.08
Calcite 0.30+0.08 1.34+0.35 8.13+1.94 4.83+1.69 5.20+0.93
Clinozoisite 0.55+0.05 0.55+0.05 - — —
Epidote 0.18+0.02 0.18+0.02 - - —
Kaolinite ~ 0.57+0.85 22,64+5.42 0.52+0.97 —
Smectite 0.07+0.05 0.46+0.37 0.50+0.39 0.22+0.45 -
Titenite 0.44+0.10 1.27+0.10 - 0.05+0.13 -Rutiie ~ 0.17+0.1 Z 0.74+0.16 0.54+0.65 0.53+C.J6
Magnetite 0.78+0.17 0.31+0.12 — — -Hematite - 0.13+0.05 0.43+0.17 ~ -
Pyrite 0.03+0.03 0.16+0.06 0.15+0.13 1.33+1.04 0.46+0.20
8 Accessories apatite, allenite, hornblende, and zircon do not vary significantly in any of the altered rocks and have average modes of 0.26, 0.04, 0.02, and 0.01 percent, respectively.
D Includes deuteric K-feldspar that has a mode of 0.10 percent.
c On the average, 95% of muscovite grains are on plagioclase; the remainder occur on biot i te.

-17-
TABLE II
MINERAL ASSEMBLAGES FORMED DURING THE ALTERATION OF PLAGIOCLASE
, A. Pc (10)
B. Pc, Mu (55)
C. Pc, Mu. Cc ( « )
D. Pc, Mu, Ep ( 8)
E. Pc, Mu, Ep, Cc (10
Number in parentheses indicates the number of regions found with s particular assemblage.

-18-
TABLE HI
MINERAL ASSEMBLAGES FORMED DURING THE ALTERATION OF BIOTITE
1 Bt (0)
2 Bt, Chi (30)
3 Bt, Ch l .Mu (1) 4 Bt, Ch I .Ep (26)
5 Bt, C h i , Tn (2) 6 B t , C h l , M u , Ep (1) 7 Bt, Ch i , Ep, Tn (5)
8 Bt, Ch i , Mu, Tn, Ru (1) 9 Bt, Ch i , Mu, Ep, Tn (2) 10 Bt, Ch l .Ep , Tn, Ru (1) 11 Bt, Ch i , Mu, Ep, Tn, Ru (2)
12 Ch l ,Mu, Tn (6) 13 Ch l ,Ep , Tn (4) 14 C h l , M u , Ep, Tn 117) 15 Ch l .Mu , Tn, Cc (2)
16 Ch i , Mu, Tn, Ru (3) 17 Ch i , Mu, Ru, Cc W) IS C M , Ep, 7n, Ru (1) 19 Ch l .Mu , Ep, Tn, Cc (3)
20 Ch i , Mu, Ep, Tn, Ru (4)
21 C h i , Mu, Ep, Ru, Cc (3)
22 Ch i , Mu, Tn, Ru, Cc (4)
23 Ch i , Mu, Ep, Tn, Ru, Cc (1) 24 Mu, Tn (4)
25 Mu, Ep, Tn, Cc (2)
Number in parentheses indicates the number of regions found with a particular assemblage.

-19-
TABLE IV
OBSERVED COMBINATIONS OF BIOTITE AND PLAGIOCLASE ALTERATION ASSEMBLAGES
A2 (5) B2 (21) C4 (1) D2 (3) E2 (1)
A4 (5) B3 (19) C6 (0 D4 (1) E12 (1)
84 (1) C7 (2) D7 (1) E14 (7)
B5 (Z) CB (I) D9 (1) EI8 (1)
B7
B9
B i t
BI2
B[3
614
B15
B20
B22
(Z)
(Z)
(1)
(1)
(I)
(2)
(1)
to (1)
C l l
C12
CI?
CI4
C15
CI6
CI7
C19
C20
C21
C2Z
C23
C24
C25
(1)
(4)
(3)
(6)
(1)
(3)
(A)
(3)
(3)
(3)
(3)
(1)
(3)
(3)
D14 (2) E24 (1)
Number in parentheses indicates the number of regions found with a particular assemblage.
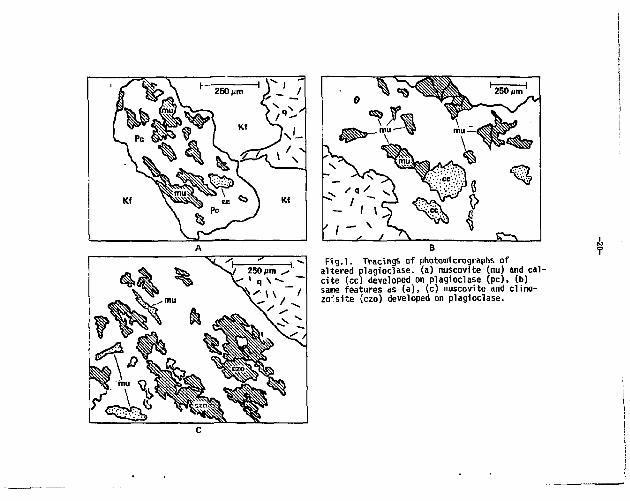
Fig.l. Tracings of photomicrographs of altered plagioclase. (a) muscovite (mu) and cal-cite (cc) developed on plagioclase (pc), (b) same features as (a), (c) muscovite and clino-zoJsite (czo) developed on plagioclase.

+21-
cl1)Hteois1te-ep1dote grain found 1fl pliaiocUwi, ;-^&..|H6Mvtttered electron Image, (b) Fe„ x-ray image. •
/ % / % 1 250 |im '
bt } \ I —
/ / ' ^ r • ©si
KM ^~.y§r
yW*0 « / N / / ~
S? ) n»u-| \ \ , _- \ /
Fig. 3.
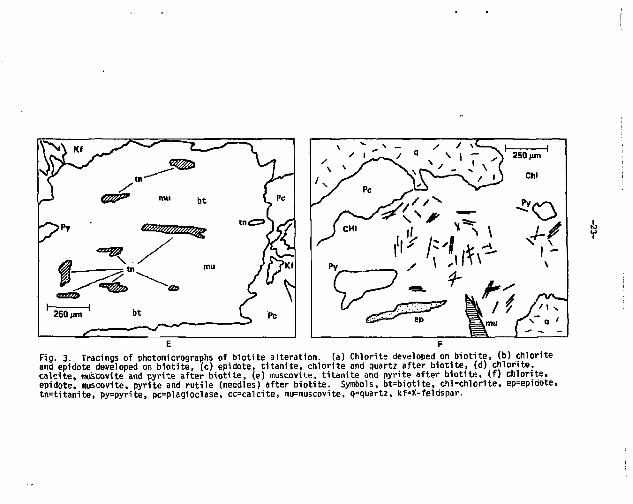
Fig. 3. Tracings of photomicrographs of b io t i te al terat ion, (a) Chlorite developed on b io t i t e , (b) chlori te and epidote developed on b io t i t e , (c) epidote, t i t a n i t e , chlor i te and quartz after b i o t i t e , (d) ch lo r i te , ca lc i te , mus'covite and pyr i te after b i o t i t e , (e) muscovite, t i t an i t e and pyri te af ter b i o t i t e , ( f ) ch lo r i te , epidote, muscovite, pyr i te and ru t i l e (needles) after b io t i te . Symbols, b t=biot i te , chl=chlor i te, ep=epidote, tn=t i tan i te , py=pyrite, pc=plagioclase, cc=calcite, mu=muscovite, q=quartz, kf=K-feldspar.
!
• • ' ' ' 10.0 100.0
Mineral (vol %)
Fig. 4. Modal proportions of major phases in CCH-1 samples plotted versus sample depth.

-25 -
100.0
10.0
"5
I 1.0
i—i—i i — i — r
- v
0.1 J L J_ J I I L J_ J_
F ig . 5. Modal proport ions of major mineral phases from "bull! samples p lo t ted versus canis ter core hole pos i t i on .
6 7 8 9 10 11 12 13 14 15 16 17 18 Canister core hole number

-26-
25 20 15 10 5 0
I
25 20 15 10
5 5
>. 1 0.
1 1 j 1 _CCH1 16.75 ft
1 1 1 1 I " ' -
-11
JL" I I I ! in i i t m L" 10 20 30 40 50 60 70 80 90 100 0 10 20 30 40 50 60 70 80 90 100
% Or % An T—i—i—r I i i i
CCH2 7.6 ft i—r
_L__i I I fa_J fa_L nlflM
~i i—i—i r |_ CCH2 7.6 ft
Jo__L M n_ _L
| 25
| 20
10 20 30 40 50 60 70 80 90 100 0 10 20 30 40 50 60 70 80 90 100 % Or % An
15 -
10 -
5 -
~i i i i i i i—i r CCH3 4.1 ft
JL I I I L_L •fllh
i—i—i—i—i i—r M CCH3 4 . 7 f t _
J_JU flU 1 tlln I |__| L 10 20 30 40 50 60 70 80 90 100 0 10 20 30 40 50 60 70 80 90 100
%Or %An
0 10 20 30 40 50 60 70 80 90 100 0 10 20 30 40 50 60 70 80 90 100 % Or % An
Fig. 6a. Histograms of feldspar analyses, arrows indicate average analysis, depth given in feet .
-27-
25 20 15 10 5 0
I I I I _ CCH4 3.1 ft
1 1 1 1 1
1 -
1 1 1 1 J 1 u
1 1 1 1 1 1 _ CCH4 3.1ft
1 I 1
1 1 1 0 10 20 30 40 50 60 70 80 90 100 0 10 20 30 40 50 60 70 80 90 100
%An 25
20
%Or 25
20 I I I t I I I
_ CCH5 10.05 ft I I
15 \ -10
• • 0 -
5 n I i I I I I I J 1
~i—i—i—i—r CCH5 10.05 ft
"T"
nnfhfl
^--v
JanJ I I I i 10 20 30 40 50 60 70 80 90 100 0 10 20 30 40 50 60 70 80 90 100
% Or % An " i — i — i — i — i — i — i — i — r
25 20 15 10 5 0
10 20 30 40 50 60 70 80 90 100 0 10 20 30 40 50 60 70 80 90 100 % Or % An
I I I I I _ CCH6 13.3 ft
1 1 1 1
_
fHU 1 1 1 1 1 I HI—• ml i l i r 10 20 30 40 50 60 70 80 90 100 0 10 20 30 40 50 60 70 80 90 100
% Or % An
Fig. 6b. Histograms of feldspar analyses, arrows indicate average analysis, depth given in feet.

-28-
I
25 20 15 10 5 0
25 20 15 10 5 -
i—I—r CCH7 9.15 ft
J_ -J I L 0 10 20 30 40 50 60 70 80 90 100 0 10 20 30 40 50 60 70 80 90 100
% Or % An — i i i i i r CCH7 10.3 ft
T
_L
1-
n i i r CCH7 10.3 ft
J H J J H ih I I L 0 10 20 30 40 50 60 70 80 90 100 0 10 20 30 40 50 60 70 80 90 100
% Or % An i — i — r i — i — r -
Jhii I 1 l_ 0 10 20 30 40 50 60 70 80 90 100 0 10 20 30 40 50 60 70 80 90 100
%Or %An
Fig. 6c. Histograms of feldspar analyses, arrows indicate average analysis, depth given in feet.
-29-
Fig. 7. Plots of feldspar analyses for CCHl, 2, and 3. Analyses obtained in interactive mode.

-30 -
A l 2 0 3 - K 2 0
a Chlorite O Biotite
Projection from quartz, K-feldspar and H 2 0 (mole %)
© <b
FeO AL _V_ _y_ ^L. _V_ JUL _^_ .v_ _AZ_ 'MgO
Fig. 8. Projection of b io t i te and chlori te analyses.
-31-
O On plagioclase • On biotite
Muscovites: Projection from
K-feldspar quartz and H 2 0 (mote %)
FeO MgO
Fig. 9. Projection of muscovite analyses for grains found on biotite and plagioclase.
-32 -
CaO
Epidote-Clinozoisite analyses from CCH1-CCH17
Projection from quartz
and H 2 0 (mole %)
A l 2 0 3
Fig. 10. Projection of epidote and cl inozoisite analyses. The stippled f ie ld contains a l l the analyses. The open circles are from a single clinozosite grain included as a secondary phase in plagioclase (see text and Fig. 2)
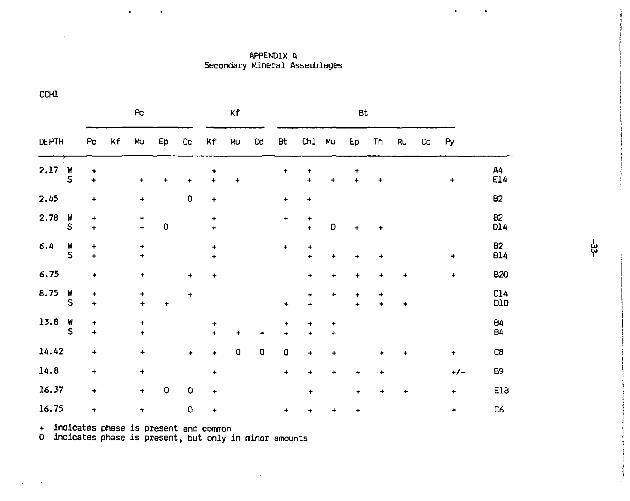
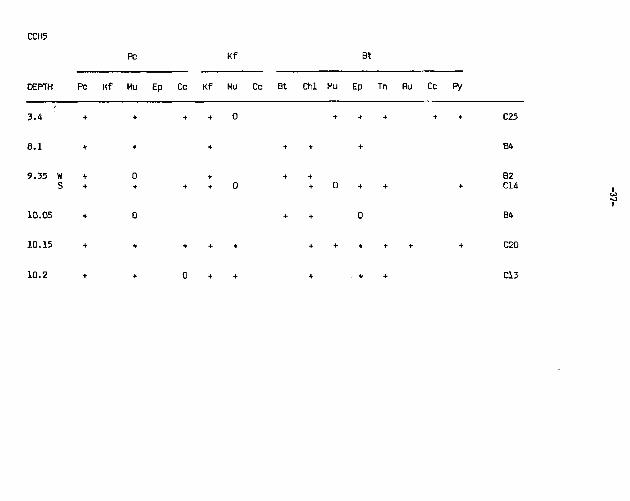
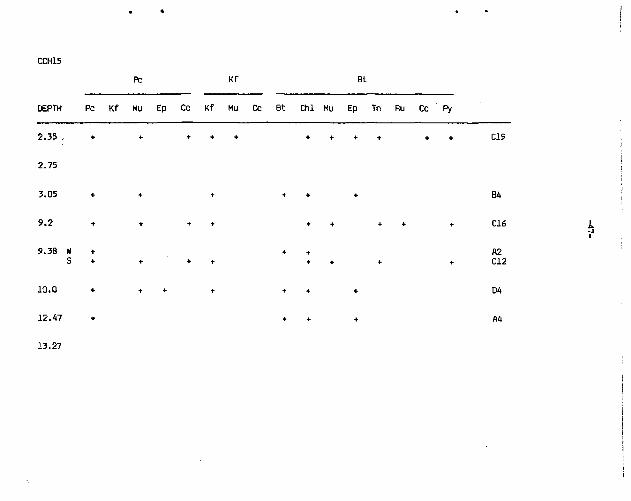
APPENDIX A Secondary Mineral Assemblages
CCH1
DEPTH
Pc Kf Bt
Pc Kf Mu Ep Cc Kf Mu Cc Bt Chi Mu Ep Tn Ru Cc Py
2.17 W S
2.45 2.78 W
S 6.4 W
S 6.75 8.75 W
S 13.8 W
S
14.42
14.8 16.37 16.75
0 +
A4 E14 B2 B2 D14 B2 B14 B20 C14 D10
B4 B4 C8 B9 E18 C6
+ inOicates phase is present and common 0 indicates phase is present, but only in minor amounts
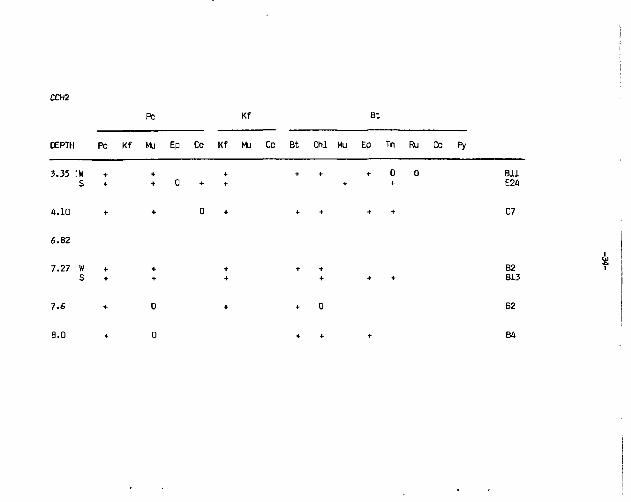
CCH2 PC Kf Bt
DEPTH Pc Kf Mu Ep Cc Kf Mu Cc Bt Chi Mu Ep Tn Ru Cc Py
+ + + + + 0 0 Bll + 0 + + + + E24
+ 0 + + + + + C7
B2 B13
3.35 S
+ +
4.10 +
£.82
7.27 W S
+ +
7.6 +
8.0 +
+ 0 B2
+ + + B4

CCH3
14.45
15.0
Pc Kf Bt
DEPTH Pc Kf Mu Ep Cc Kf Mu Cc Bt Chi Mu Ep Tn Ru Cc Py
3.35 W, * • + + + 0 + B7
S + + + < • + + + + 0 C20
3 .7 + + + + + 0 Bft
8 .9 W + + + + +
S + + + + + + 0 +
9.15 + + + + + +
9.4 + D + + 0
10.04 W + -f + + S + + + + + + +
+ B2 C14
84
B2
02 E14
+ B2 C17

CCH4
Pc K f Bt
DEPTH Pc K f Mu Ep Cc Kf Mu Cc Bt Chi Mu Ep Tn Ru Cc Py
2.55 + + + + + 0 + + B9
3.1 + 0 + + + B2
3.83 W • 0 + + 0 B2
S + •*- + + + + + + E12
9.15 + + + + + 0 + + + + + C22
9.8 + + + + 0 + + + + + C7
13.55 + + + + + 0 C4
H.A5 + + + + 0 0 + + + C12
CCH5
PC Kf Bt
DEPTH Pc K f Mu Ep Cc K f Mu Cc B t Ch i Mu Ep Tn Ru Cc Py
3.4 +
8.1 +
9.35 W S
+ +
10.05 +
10.15 +
10.2 •f
C25
B4
+ + + B2 + 0 + 0 + + + CU
Bit
C20
C13

CCH6
PC Kf Bt
DEPTH Pc Kf Mu Ep Cc Kf Mu Cc Bt Chi Mu Ep Tn Ru Cc Py
7 . 7 5 ' + * <• + + + + + + + E23
0 + t • B3 + + + + + D + + + C l l
Bit
8.3D W + S +
6.80
13.3 +
13.95 + + + + E14
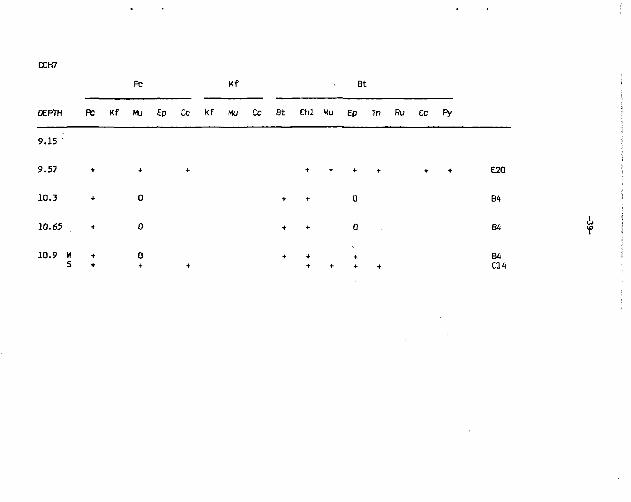
CCH7
Pc Kf Bt
DEPTH Pc Kf Mu Ep Cc Kf Mu Cc Bt Chi Mu Ep Tn Ru Cc Py
9.15 '
9.57 + +
10.3 + 0
10.65 + 0
E20
B4
10.9 W + 0 S + + t + +
W C14

CCHB
PC Kf Bt
DEPTH Pc Kf Mu Ep Cc Kf Mu Cc Bt Chi Mu Ep Tn Ru Co Py
9.3 '. + + + + +
9.8 + 0 + + 0 +
10.15 • + + + + + + + + +
10.55 + + 0 + + + + + +
B2
B4
* C19
C14
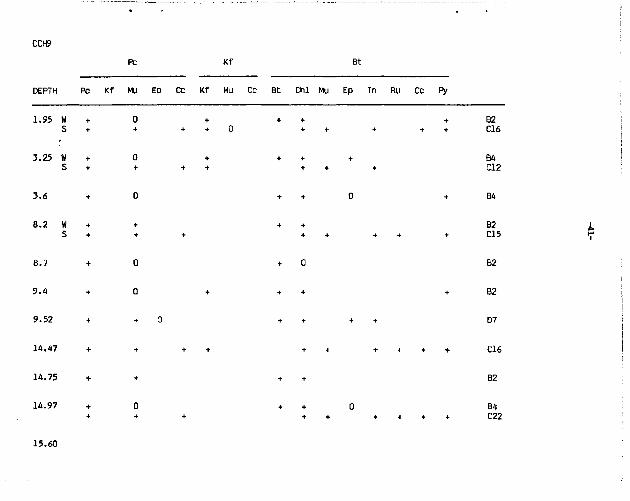
CCH9
Pc Kf Bt
DEPTH PC Kf Mu Ep Cc Kf Mu Cc Bt Chi Mu Ep Tn Ru Cc Py
1.95 W + 0 • + + + B2 S + + + + 0 + + + + + C16
3.25 W + 0 + + + + B4
S + + + + + + + C12
3 . 6 + 0 + + 0 + B4
8.2 W + + + + B2
S + + + + + + + + C15
8.7 + 0 + 0 B2
9.4 + 0 + + + + B2
9.52 + + 0 + + + + D7
14.47 + + + + + + + + + + C 1 6
14.75 + + + + B2
14.97 + 0 + + 0 B4 + + + + + + + + + C22
15.60
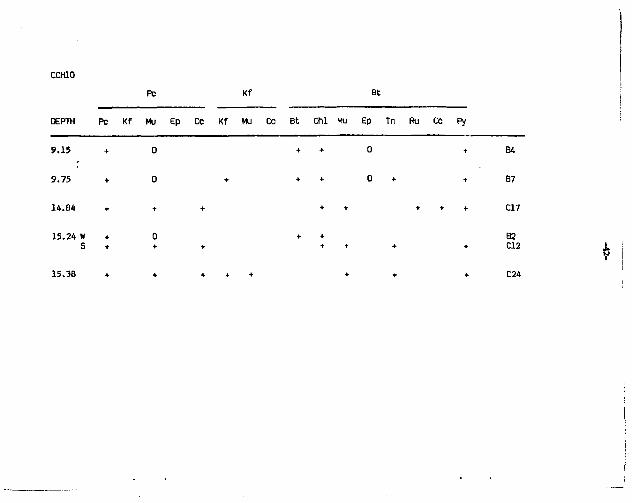
CCHlO
PC Kf Bt
DEPTH Pc Kf Mu Ep Cc Kf Mu Co Bt Ctll Mu Ep Tn Ru Cc Py
9.15 + 0 * + 0 +
9.75 + 0 + + • 0 + +
14.84 + + + + + + + +
S4
87
C17
15.24 W S + •*•
B2 C12
15.3S C24

CCHl l
PC Kf Bt
OEPTH PC K f Mu Ep Cc Kf Nu Cc Bt Chi Mu Ep Tn Ru Cc Py
9.5 + 0 + + B2
9.9
10.02
u>

CCH12
PC Kf Bt
DEPTH Pc K f Mu Ep Co K f Mu Cc B t Ch i Mu Ep Tn Ru Co Py
9.1 • + + + + + 0 + + + C21
9.35 + 0 + + + • + B12
9.70 + + + + 0 + + 0 + C22
10.18

CCH13
Pc Kf Bt
DEPTH Pc Kf Hu Ep Cc Kf Mu Cc Bt Chi Mu Ep Tn Ru Cc Py
8.68 W
8.93 + + + + 0 + +
9.35 + + + + + + 0
9.6 + 0 + + + 0
B2 B22
E1H
C21
B4

CCHU
PC Kf Bt
DEPTH PC K f Mu Ep Cc Kf Mu Cc Bt Chi Mu Ep Jn Ru Cc Py
8.31 + 0 + + + +
8.82
B4
M
9.32 W S
B4 C14
9.64 W S
+ + + + + +
B2 B14
10.0
13.72
E2
D14
•
CCH15
Pc Kf Bt
DEPTH PC Kf Mu Ep Cc Kf Mu Cc Bt Chi Mu Ep Tn Ru Cc Py
2.35 , • + + + + + t + t t + C19
2.75
3.05 + + + + + * B4
9.2 •• + + + + + + + + C16 1 i
9.38 H + + + A2
S + + + + t + + + C12
10.0 + + • + + + + DA
12.47 + + + + M
13.27
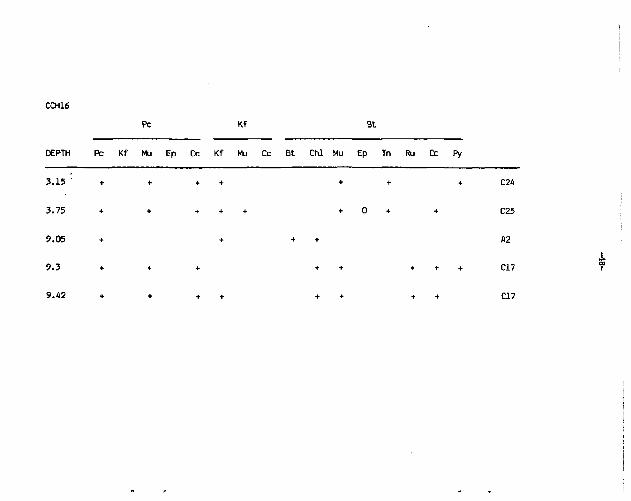
CCH16
Pc Kf Bt
DEPTH Pc Kf Mu Ep Cc Kf Mu Cc Bt Chi Mu Ep Tn Ru Cc Py
3.15
3.75
9.05
9.3
9.42
+ 0
C24
C25
A2
C17
C17

CCH17
Pc Kf Bt
DEPTH Pc Kf Mu Ep Cc Kf Mu Cc Bt Chi Mu Ep Tn Ru Cc Py
7.45 + + + + M
8.05 + + + + 0 + + + . B 5
8.2 + + + + + + + C24
8.25 + + + + + + + + C 2 4
8.38 + + • + + + + B15
8.8 + 0 t + + 85
9.1 + + + + * + C12

APPENDIX SI
MODAL ANALYSES (VOL %) OF CCHl SAMPLES SAMPLE DEPTH (FT.)
"ZTD 2741 3771 O o 6775 8.75 10.02 i3 .8 14.42 1.4.8 16.47 16-75 flVG. 1-8
Plagloclase 36-9 34 .1 26.0 26 .1 25.3 34 .5 29.9 28.1 35.4 37.1 42.3 38.2 32.8*5.6 K-fel'dspar 30. D 30.8 32.0 44.0 24.4 24.4 35.8 28.2 30.3 34.6 31.3 28 .5 31.2T5.3 Quartz 15 .1 17 .8 16 .1 14.5 17.1 15.5 19.1 21.2 - 18.4 16.2 16.5 20.2 17.3*2.1 B io t i t e 7 .5 6 .7 7 .6 2.4 1.4 6.0 6 .5 1.8 0.9 7.3 2 .8 7.4 4.9V2.7 Muscovite 2 .7 1.6 7.6 6.3 22.3 10.7 1.5 15.3 9.7 1.0 2.9 1.8 7.0T6.6 Chlor i te 1.3 1.0 6.0 1.2 1.5 1.3 0.1 0 .3 0.4 0.7 0 .5 0.5 1.2+1.5 Calci te 0 .7 0 .5 0 .7 0 .3 4 .5 3.1 0.1 4 .3 2 .8 1.1 2 .1 1.7 1 .8 .1 .5 Cl inozo i s i t e 0 .6 -.- 0.2 -.- o.e 0.0 -.- -.- -.- -.- ..-Epidote 2 .8 0 . 3 2 .1 0.6 o!< 1.4 0,8 0.4 0 .3 0 .7 0.1 D.3 0.9*0.8 Kaol in i te .02 .02 -,- -.- -.- .04 .11 -.- _.-Ti t an i t e o!9 o!2 lis 1.1 0.7 0.6 0.2 0 .2 0.6 0 .3 0 .0 D.4 0.5*0.4 Rut i le -,- -,- -,_ 0.2 -,- -.- 0.0 -._ _._ Magnetite -.- 0 . 1 -.. -.- 0.1 0.1 -.- -.- .04 .11 -.- -.-Hematite -.- -.- ... -.- -.- -._ _,_ -,- -.- -.- -,_ -,-FVrite 1.3 1.3 - • - 1.1 0 .5 0.6 3.6 0.4 1.0 0 . 2 1.4 0.9 1.0.0.9
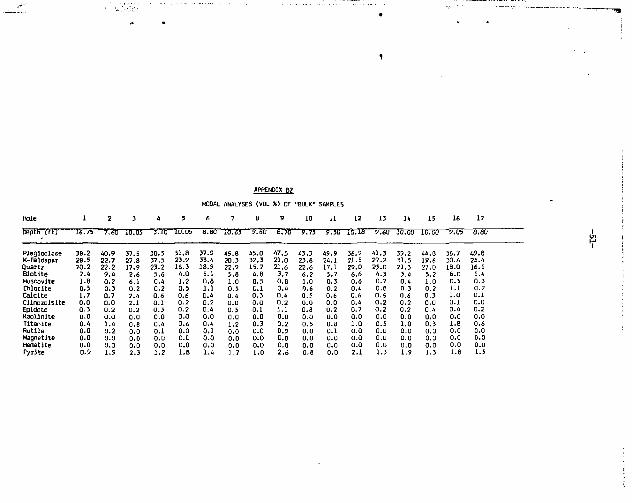
APPENDIX B2
MODAL ANALYSES (VDL %) OF "8ULK" SAMPLES
Hale 1 2 3 4 5 6 7 8 9 10 11 12 13 14 15 IS 17
Depth ( f t ) JiTTS 7.6d lo.oS 3.10 ia.05 b.ai lo.sS O B O S 977! 9.50 10.IB 9.60 10.00 10.00 9765 5780 1
Plagioclase 38.2 40.9 37.5 30.5 51.8 37.9 45.6 45.0 47.5 43.3 49.9 36.9 41.3 39.2 44.8 36.7 49.6 K-felcispar 26.5 22.7 27.8 37.5 23.9 33.4 20.3 32.3 21.0 23.8 24.1 21.5 27.2 31.5 19.6 30.6 25.4 Quartz 20.2 22.2 17.9 23.2 16.3 18.9 22.9 15.7 21.6 22.6 17.1 29.0 23.0 21.3 27.0 16.0 16.5 Biotitc 7.4 9 .4 2.6 5.6 4.0 5.1 5.8 4.B 3.7 6 .2 5.7 6.6 4 .3 3.4 5.2 6.0 5.4 Muscovite 1.8 0 .2 6.1 0.4 1.2 0 .8 1.0 0.5 0 .6 1.0 0 .3 0.6 0.7 0.4 1.0 D.3 0 .3 Chlorite 0 .5 0 .3 0 .2 0 .2 0 .5 1.1 0.5 0.1 0.4 n.6 0.2 0.4 0.6 0 .3 0.2 1.1 0.2 Calcite 1.7 0.7 2.4 0.6 0.6 0.4 0.4 0 .3 0.4 0.5 0.6 0.6 0 .6 0.6 0 .3 1.0 0.1 Cllnazolsite 0.0 n .o 2.1 0.1 0.2 0 .2 0.0 0 .0 0 .2 0 .0 0.0 0.4 0 .2 0.2 0.0 0.1 0.0 Epldate 0.3 D.2 0.2 0 .3 0.2 0.4 0.5 0.1 1.1 0 .8 0.2 0.7 0 .2 0.2 0.4 0.4 0.2 Kaollnlte 0.0 0 .0 0.0 0.0 0.0 0.0 0.0 0.D 0.0 0.0 0 .0 0 .0 0.0 0 .0 0 .0 0.0 0.0 Titanite 0.4 1.4 0 .8 0.4 0.6 0.4 1.2 0 .3 0 .2 0 .5 0.8 1.0 0.5 1.0 0 .3 1.6 0.6 Rutlle 0.0 0.2 0 .0 0.1 0 .0 0.1 0 .0 0.0 0.9 0.0 0.1 0 .0 0.0 0.0 0 .0 0.0 0.0 Magnetite 0.0 0.0 0 .0 0 .0 0 .0 0 .0 0.0 0 .0 0.0 0.0 0.0 0 .0 0.0 0.0 0.0 0.0 0.0 Hematite 0.0 0.0 0 ,0 0 .0 0 .0 0 .0 0 ,0 0 .0 0 .0 0 .0 0.0 0 .0 0 .0 0 .0 0 .0 0.0 0.0 Pyrite 0.9 1.9 2 . 3 1.2 1.8 1.4 J,7 1.0 2.6 0.8 0.0 2.1 1.3 1.9 1.3 1.8 1.5

APPENDIX, C g I
Microprobe Analyses of mineral phases form the canister control hole cores
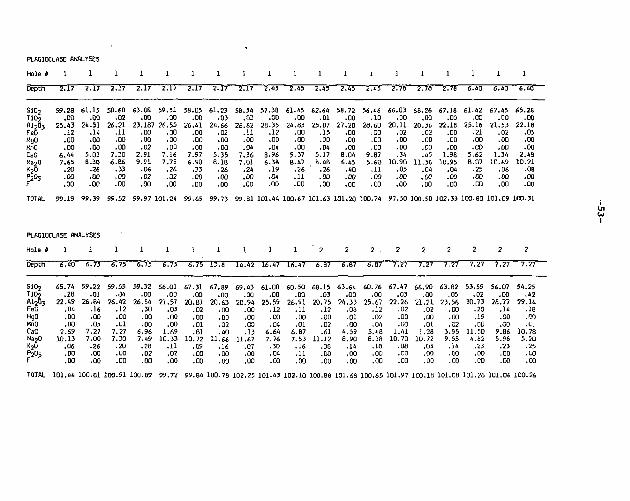
PLAGIOCLASE ANALYSES
Hole I 1 1 1 1 1 1 1 1 1
DeptH 5717 57T7 57T7 5717 57T7 5717 57T7 2717 2T4T
S i 0 2 59.28 61 .15 58.68 63.88 59.51 5B.05 61 .23 58.54 57.38 T10 2 .00 .00 .02 .00 .00 .00 .03 .03 .00 M203 25 .43 24.51 26.21 23.187 26.55 26.41 24.66 26.62 28.35 FeO .12 .14 .11 .00 .00 .00 .02 .11 .12 HgO .00 .00 .00 .00 .00 .00 .00 .00 .00 MriO . 00 .00 .OD .02 .DO .00 .00 .04 .04 CaO 6.44 5.03 7.30 2 .91 7.16 7.97 5.35 7.36 8.96 N a 2 0 7.65 a .30 6 .86 9 .91 7 .75 6.90 8 .18 7 .01 6.38 K 2 0 .20 .26 .33 .06 .26 .33 .26 .24 .19 P 2 0 5 . 00 .00 .00 .02 .02 .00 .00 .00 .04 F .00 .00 .00 .00 .00 ,00 .00 .00 .00
TOTAL 99.19 99.39 99.52 99.97 101.24 99 .65 99.73 9 9 . Bl 101.44
PLACI0CLA5E ANALYSES
Hole S l l l l l l l l l
EepEF 6.40 67}! 6775 6775 6775 6.75 13.8 14.42 16.47
S i 0 2 65.74 59.22 59.55 59.32 66.01 67.31 67.69 69 .43 61.00 TI02 .28 .01 .04 .00 .00 .00 .00 .00 .00 A W ) , 22 .49 26.64 26.42 26.54 21.57 20.6,7 20 .63 20.94 25.59 FeO .D« .16 .12 .30 .03 .02 .00 .00 .12 MgO .00 .00 .00 .00 .00 .00 .00 .00 .00 KnO .00 .05 .01 .00 .00 .01 .02 .00 .04 CaO 2.69 7.27 7.27 6.96 1.69 .61 .40 .13 6.64 Na 2 0 10 .13 7.00 7.30 7.49 10.33 10.72 11.66 11.67 7.76 K 2 0 .06 .26 .20 .28 .11 .09 .16 .07 .30 H , 0 , .00 .00 .00 .02 .02 .00 .00 .00 .04 F .00 .00 .00 .00 .00 .00 .00 .00 .00
TOTAL 101.44 1O0.81 100.91 100.89 99.72 99.84 100.78 102.25 101.43
1 1 1 J 1 1 1 1 1 1
•?745 5745 2745 2745 2778 5771 2771 6.40 6740 6746"
61 .45 62.64 58.72 56.46 66 .03 68.26 67.18 61.42 67 .45 £5 .28 .00 .01 .00 .10 .00 .00 .00 .00 .00 .00
24.83 25.07 27.20 28.60 20.11 20.36 22.18 25.16 21 .53 22.18 .00 .15 .00 .00 .02 .02 .00 .21 .02 .05 .00 .00 .00 .00 .00 .00 .00 .00 .00 .00 .00 .04 .00 .00 .00 .00 .00 .co .00 .00
5.37 5.17 8.04 9.87 .34 .45 1.98 5.62 1.34 2 .43 B.47 8 .48 6 .45 5.60 10.90 11.36 10.95 8.07 10.69 10 .21
.26 .26 .40 .11 .05 .04 .04 .25 .06 .08
.11 . 00 .00 .00 .00 . 0 0 .00 .00 .00 .00
.00 .00 .00 .00 .00 .00 .00 .CO .00 .00
100.67 101.63 101.20 '.00.74 97.50 100.50 102.33 100.80 101.09 100.31 U1
I
1 ' 2 2 2 . 2 2 2 2 2 2
16.47 87a7 5787 6787 7757 7757 7757 7757 7757 7.27
60.50 68.15 £3.64 60.76 67.47 66.90 63.82 53.59 56.07 54 .25 .00 .03 .00 .00 .03 .00 .05 .02 .00 .42
26 .91 20 .75 24 .33 25.67 22.26 2 1 . 2 1 23.56 30.73 28.77 29.14 .11 .12 .08 .12 .02 .02 .00 .20 .14 .18 .00 .00 .01 .0? .00 .00 .00 .19 .00 .CO .01 .02 .00 .04 .00 .01 .02 .00 .00 .L.
6.87 .61 4 ,59 5.48 1.41 1.28 3 .95 11.50 9.86 10.78 7 .53 11.12 8.90 8.38 10.70 10.72 9 .55 4 .62 5.96 5 .20
.16 .08 .14 .18 .08 .03 .14 .23 .23 .25 .11 .00 .00 .00 .00 .00 .00 .00 .00 .00 .00 .00 ,00 .00 .00 .00 .CO .CO .00 .00
102.10 100.8$ 101,68 100.65 101.97 100.IB 101.08 101.28 101.06 100.26
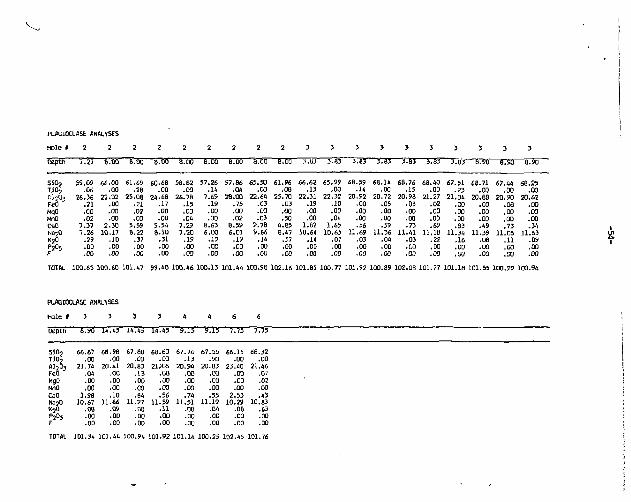
PLAGIOO-flSE ANALYSES
Hole 1 2 2 2 2 2 2 2 2 2 3 3 3 3 3 3 3 3 3 3
Depth TTJJ iToo 8755 SToo 87oo O o 8755 S76o EToo J7u3 37(5 3755 3781 37B3 3781 3783 8T50 8750 8.90
S10, T10 , M 2 a 3
FeO HgO MnO CaO H320 K 2 0 P 2 0 5
f TOTAL 100.65 100.60 101.47 99.48 100.46 100.13 101.44 100.98 102.16 101.85 100.77 101.92 100.89 102.08 101.77 101.18 101.55 100.29 100.94
PLAGIOCLASE ANALVSES
Hale * 3 3 3 3 4 4 6 6
Depth 8.90 14.45 14.45 14.45 9715 9713 7771 7.75
59.09 66.00 61,6V 60.68 58. B2 57.26 57.86 65.50 61.96 66.62 65.99 68.59 68.14 68.76 68.40 67.51 68.71 67.44 68.25 .06 .00 .28 .00 .00 .14 .04 .00 .06 .13 .00 .14 .00 .15 .00 .23 .00 .00 .00
26.36 22.02 25,08 24.68 26.7B 7.69 28.00 22.64 25.70 22.31 22.32 20.92 20.72 20.98 21.27 21.04 20.68 20.90 20.132 .21 .00 ,21 .17 .15 .19 .75 .03 .03 .19 .10 .00 .05 .03 .02 .00 .00 .08 .00 .00 .00 .02 .00 .00 .00 .00 .00 .00 .00 .00 .00 .00 .00 .00 .00 .00 .00 .00 .02 .00 .00 .00 .04 .00 .02 .03 .50 .00 .04 .00 .00 .00 .00 .00 .00 .OD .00
7.37 2 .30 5.59 5.54 7.29 8.63 8.59 2.78 4.85 1.82 1.65 .56 .59 .73 .69 .83 .49 .73 .34 7.26 10.17 8.22 8.10 7.20 6.00 6.01 9.86 8.47 10.64 ID.65 11.69 11.36 11.41 11.IB 11.34 11.39 11.05 11.63
.29 .10 .37 .31 .19 .19 .19 .14 .57 .14 .07 .03 .04 .03 .22 .16 .08 .11 .09
.00 .00 .00 .00 .00 .00 .00 .00 .00 .00 .00 .00 .00 .00 .00 .00 .00 .00 .00 .00 .00 .00 .00 .00 .00 .00 .00 .00 .00 .00 .00 .00 .00 .oo .00 .00 .00 .00
SIO3 66.07 68.98 67.80 68-60 S7.7A 67.55 66.15 68.32 TJ0 2 .00 .00 .00 .00 .13 .90 .00 .00 Al^O* 21.7fi 20.41 20.83 21>t)S 20.94 20.83 23.40 21.46 FeO .04 .00 .15 .00 .00 .00 .00 .07 MgO .00 .00 .00 -00 .00 .00 .00 .02 HflO .00 .00 .00 .00 .00 .00 .00 .00 CaO 1.58 .10 .84 .56 .74 .55 2 .53 .43 K320 10.67 11.86 11.27 11.59 11.51 11.19 10.29 10.83 K^O .OB .09 .06 .11 .08 .04 .08 .63 P2O5 .00 .00 .00 .00 .CO .00 .00 .00 F .00 .00 .00 .00 .00 .00 .00 .00
TOTAL 101.34 101.44 100.94 101.92 101.14 100.25 102.45 101.76
!
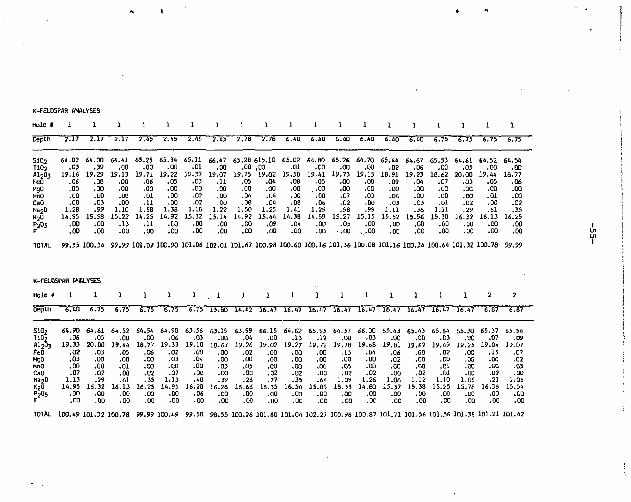
K-FELDSPAP. ANALYSES
Hole # 1 1 1 1 1 1 1 1 1
Depth 2737 2717 27T7 2~745 Z"745 2.45 2.45 2.78 2*78"
510 2 64.02 £4.00 64.41 65.25 65.34 65.11 66.47 65.28 615.10 Ti02 .03 .39 .00 .00 .00 .01 .00 .00 ,00 A 1 2 0 3 19.16 19.29 19.13 19.71 19.22 19.37 19.07 19.75 19.02 FeO .06 .00 .00 .06 .05 .03 .11 .05 .04 MgO .00 .00 .00 .00 .00 .00 .00 .00 .00 MnO .00 .00 .00 .01 .00 .02 .00 .04 .04 CaO .00 .03 .00 .11 .00 .02 .00 .06 .04 Na 20 1.28 .99 1.10 1.58 1.38 1.18 1.22 1.50 1.25 K 20 14.95 15.58 15.22 14.25 14.92 15.32 15.14 14.92 15.44 P2O5 .00 .00 .13 .11 .00 .00 .00 .00 .09 F .00 .00 .00 .DO .00 .00 .00 .00 .00
TOTAL 99.55 100.34 59.99 101.09 1DD.90 101.06 102.01 101.67 100.98
K-FELOSPAI" ANALYSES
Hole * 1 1 1 1 1 1 . 1 1 1
Depth 6755 6.75 6.75 6*775 6.75 6 . ' 5 ' 13.BO 14.42 16.47
S10 2 64.90 64.61 6«.52 64.54 64.90 63.56 63.19 63.99 66.15 T10 2 .06 .05 .00 .00 .06 .03 .00 .04 .00 Al-,0, 19.33 20.00 19.44 16.77 19.33 19.10 18.67 19.26 19.02 feO .02 .03 .05 .06 .02 .00 .00 .02 .00 HgO .03 .00 .00 .00 .03 .04 .00 .00 .00 MnO .00 .00 .01 .00 .00 .00 .03 .05 .00 CaO .07 .02 .00 .02 .07 .00 .00 .00 .02 Na 20 1.13 .29 .61 .35 1.13 .40 .39 .26 .27 K 20 14.95 16.32 16.13 16.25 14.95 16.28 16.26 16.66 16.35 P 2 0 5 .00 .00 .00 .00 .00 .06 .00 .00 .00 F .00 .00 .00 .00 .00 .00 .00 .00 .00
TOTAL 100.49 101.32 100.78 99.99 100.49 99.50 93.55 100.26 101.80
1 1 1 1 1 1 1 a 1 1
6.40 6.40 6.40 6-SO O o 6*755 6775 6/75 6775 6775"
65.02 64.80 £5.26 64.70 65.44 64.67 65.53 64,61 64,52 £4.54 .01 .00 .00 .00 .02 .06 .00 .05 .00 .oo 19.58 19.41 19.73 19.13 16.91 19.23 18.62 20.00 19.44 18.77 .08 .05 .00 .06 .09 .04 .07 .03 .05 .06 .00 .00 .00 .00 .00 .00 .00 .00 .00 .00 .00 .00 .07 .03 .04 .00 .00 .00 .01 .00 .08 .06 .02 .00 .03 .03 .01 .02 .00 .02
1.41 1.25 .98 .99 1.11 .36 1.11 .29 .61 .35 14.38 14.59 15.27 15.15 15.52 15.96 15.30 16.32 16.13 16.25
.04 .00 .05 .00 .00 .00 .00 .00 .oo .00
.00 .00 .00 , .00 .00 .00 .00 .00 .00 .00
100.60 10D.16 101.36 100.08 101.16 100.34 100.64 101.32 100.76 99.99
1 1 1 1 1 1 1 1 2 2
16.47 16.47 16.47 16.47 16.47 16.47 16.47 16.47 67S1 6757
64.62 65.95 64.57 66.00 65.43 65.43 65.64 65.30 65.37 65.54 .13 .12 .00 .03 .00 ,00 .03 .DO .07 ,D9
19.27 19.72 19.78 19.68 19.81 19.62 19.49 19.25 19.04 19.07 .00 .00 .15 .04 .06 .00 .02 .00 .15 .07 .00 .00 .00 .00 .02 .00 .CO .00 .00 .02 .00 .00 .05 .00 .00 .00 .01 .00 .00 .03 .02 .00 .02 .02 .00 .02 .01 .00 .02 .00 .35 .64 1.09 1.26 1.06 1.12 1.10 1.05 .21 1.06
16.54 15.65 15.33 14.80 15.32 15.30 15.25 15.78 16.36 15.54 .00 .00 .00 .00 .00 ,00 .00 .00 .00 .00 .00 .00 • CO .00 .00 .00 .00 .00 .00 .00
101.D4 102.27 100.98 100.87 101.71 101.56 101.56 101.38 101.21 101.42

K-FELDSPAR ANALYSES
Hole # 2 2 2 2 2 2 2 2 2 2 3 3 3 3 3 3 3 3 3
oSptR 6T65 6755 675? 5715 5717 5787 572? 87(55 5705 5755 3755 5755 5735 3.B3 10.0" 10.04 10.04 10.04 14.43
S i 0 2 65.34 65.22 64.69 63.51 64.5.'- 65.67 64.42 65.11 65.43 65.72 63.76 64,68 65.03 62.17 64.65 65.92 60.71 64.86 .00 T10 2 .09 .16 .16 .29 .CJ .04 .00 .00 .02 .02 ,00 .69 .00 .00 .57 .00 .15 .42 .on « 1 2 0 3
reo 19.07 16.59 19.69 19.32 I B . ; 7 19.48 18.53 19.00 18.98 18.87 l a . 70 19,14 19.21 18.70 19.44 19.26 19.36 16.96 .nn « 1 2 0 3
reo .07 .12 .07 .11 .07 .04 .03 .14 .05 .00 .08 ,00 .07 .07 .00 .00 .00 .00 .00 NQO .02 .02 .02 ,DD .01 .00 .00 .00 .00 .00 • .02 .02 .00 .00 .00 .00 .00 .00 .00 MnO .03 .03 .03 ,DD .01 .00 .•0 .03 .00 .04 .00 .00 .00 .00 .00 .00 .00 .00 .00 CaO .00 .00 .02 .09 .00 .00 .00 .03 .00 .00 .00 .00 .00 .00 .00 .05 .00 .00 .00 Na 2 0 1.06 1.01 1.31 1.50 .70 1.06 .63 1.20 1.13 .31 .18 .20 .28 .11 .25 .25 l.OB 1.64 .00 K 2 0 15.54 15.39 14.55 14.50 15.90 15.53 15.98 14.95 14.83 15.92 16.28 16.36 16.34 16.86 16-29 16.07 14.86 14.28 .00 P 2 0 5 ,00 .00 .00 .00 .00 .00 .00 .00 .00 .00 .00 .OD .00 .00 .00 .00 .OD .00 .00 F .00 .00 .00 ,00 .00 .00 .00 .00 .00 .00 .00 .00 .OD .00 .00 .00 .00 .00 .00
TOTAL 101.42 100.54 100.55 99.33 100.50 102.01 99.60 100.46 100.44 100.90 99.02 101.49 100.98 97.94 101.13 101.56 100.18 100.17 .00
K-FELOSPAR ANALYSES
Hale 1 6 6
DeptFl 5755 575T
5 i 0 2 65.01 65.07 T10 2 .00 .00 A1 ? 0 , 19.55 19.19 FeO -It .00 Mgo .04 .04 MnO .00 .00 CaO .03 .02 Na 2 o .24 .22 KjO 16.29 16.64 PfO, .00 .CO F .00 .00
TOTAL 101.30 1D1.B3
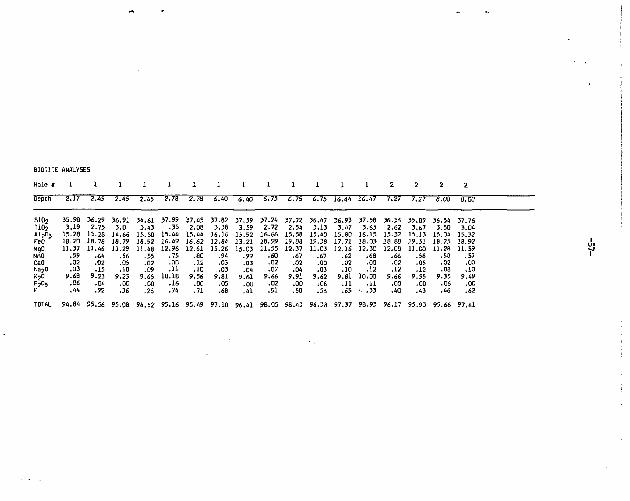
BIOTITE ANALYSES
Hole # 1 1 1 1 1 1 1 1 1 1 1 1 1 2 2 2 2
Depth 5717 2745 2741 JTi! 2778 27741 6740 O B 6775 6775 6.75 16.44 16.47 7757 7727 8753 8.00
S10 2 35.96 36.29 36.91 34.61 37.99 37.45 37.82 37.59 37.24 37.72 36.47 36.93 37.58 36.56 35.89 36.54 37.76
U02 3.19 2.75 3.0 3.43 .35 2.08 3.38 3.59 2.72 2.54 3.13 3.47 3.65 2.62 3.67 3.50 3.04 A 1 2 0 3 15.28 15.28 14.66 15.50 15.44 15.44 16.16 15.92 16.66 15.58 15.40 15.80 16.15 15.32 15.13 15.00 15.32 FeD 18.20 18.78 18.79 18.92 16.49 16.62 12.84 13,21 18.99 19.08 19.38 17.71 18. D3 18.80 19.51 18.75 18.92 MOO 11.37 11.46 11.29 11.48 12.96 12.61 15.26 15.03 11.55 12.37 11.03 12.16 12.30 12.00 11.00 11.28 11.59 HnO .59 .64 .56 .55 .75 .60 .94 .99 .60 .67 .67 .62 .68 .66 .56 .50 .57 CaO .02 .02 .05 .0? .on .12 .03 .03 .02 .02 .00 .02 .00 .02 .05 .02 .00 NajO .03 .15 .10 .09 .11 .10 . .03 .04 .07 .04 .03 .10 .12 .12 .12 .08 .10 K 20 9.63 9.23 9.23 9.65 10.18 9.56 9.81 9.61 9.66 9.91 9.62 9.81 10.00 9.66 9.55 9.35 9.49 P 2 0 5 .06 .04 .00 .00 .16 .00 .05 .00 .02 .00 .08 .11 .11 .00 .00 .06 .00 F .44 .92 .36 .26 .74 .71 .68 ,41 .51 .50 .56 .65 •• .33 .40 .43 .46 .62
TOTAL 94.64 95.56 95.08 94.52 55.16 95.45 97.10 56.41 98.05 98.43 96.3,3 97.37 98.93 96.17 95.93 95.66 97.41

EP1LOTE ANALYSES
H o l e # 1 1 1 1 1 1 2 2 2 2 2 2 2 3 3 3 3
TSptFi 5717 2717 5717 5755 5775 5775 6717 6785 6737 8773 7757 57cm BToo O o 8.90 10.04 10.00
S102 35.83 37.77 37.16 38.32 38.67 38.32 38.02 37.88 37.92 38.58 37.58 37.64 37.46 37.68 39.20 38.46 37.37 T10 2 .00 .52 .20 .00 .00 .00 .35 .54 .11 1.52 .19 1.17 .28 .00 .00 .15 .87
£n° 3 24.34 24.92 24.69 24.06 25.64 24.74 21.90 23.02 22.36 24.90 21.66 21.95 22.20 28.09 27.89 24.23 23.03 £n° 3 11.84 11.12 10.43 11.57 10.71 12.12 14.20 13.37 14.58 9.85 14.57 13.64 13.64 8.23 7.99 12.58 13.37
MgO .00 .01 .02 .05 .25 .05 .00 .13 .01 .14 .03 .04 .00 .00 .00 .41 .02 KnO .00 .17 .22 .45 .30 .96 .16 .24 .10 .17 .12 .22 0.56 .05 .00 .29 .22 CeO 23.56 23.26 23.65 23.23 23.72 22.94 22.96 22.63 22.64 23.39 23.21 22.92 21.85 22.73 23.32 23.05 22.19 Ka2° .00 .00 .00 .00 .00 .00 .OD .00 .02 .00 .00 .03 .00 .00 .02 .00 .00 K20 .03 .00 .00 .00 .07 .00 .00 .01 .00 .00 .00 .02 .02 .01 .04 .00 .03 P 2 0 5 .00 .00 .00 .00 .00 .00 .OD .02 .14 .00 .00 .00 .00 .15 .05 .00 .06 F .00 .00 .00 .00 .00 .00 .07 .15 . .00 .13 .06 .18 .00 .00 .00 .00 .OD
TOTAL 95.60 97.77 96.57 97.70 97.66 99.13 97.70 98.20 96.12 98.68 97.42 97.08 96.01 97.16 98.51 99.17 97.15
EP1D0TE ANALYSES
Hole I t 4 4 4 4 4 - 4 4 4 4 6 6 6
BepJh J783 3753 3783 37S5 5763 376! 3715 9715 9713 svB 7771 7775 7.75
S 1 0 2 38.21 38.36 38.54 38.85 38.30 37.80 38.05 38.36 37.73 37 .« 38.81 38.43 37.64 T102 .03 .10 .00 .20 .00 .24 .00 .41 .01 .'/9 .00 .00 .00 A 1 7 0 , 25.68 27.97 25.25 28.64 28.88 25.68 26.46 25.19 24.03 23.01 25.53 25.17 25.08 Feo 10.48 8.17 9.35 6.77 6.50 9.33 9.46 10.54 12.55 13.76 11.71 11.16 11.60 ego .11 .04 .04 .04 .05 .04 .13 .00 .00 .00 .08 .03 .19 WnO 1.00 .32 .65 .10 .16 .19 .09 .20 .15 .54 .12 .41 .27 CaO 22.46 23.33 22.92 23.40 23.97 22.86 23.31 22.77 21.13 21.49 22.67 23.23 22.20 N a 3 0 .00 .00 .00 .00 .00 .62 .00 .00 .00 .00 .00 .00 .00 K 20 .00 .00 .00 .02 .00 .20 .01 .07 .03 .03 .02 .03 .02 P 2 0 , .00 .08 .00 .00 .05 .08 .05 .11 .14 .04 .00 .03 .00 F .00 .00 .00 .00 .00 .00 .12 .00 .00 ,00 .00 .00 .00
TOTAL 98.19 98.38 9B.73 98.01 S7.90 97.03 97.69 97.66 95.80 96.88 98.93 98.48 97.00

MUSCOVITE ANALYSES
Hole f 1 1 1 1 1 1 1 1 1 1 1 1 1
Depth 2.17 2.17 2.17 2 . » •"2.78 6.40 6.40 6.40 6.75 6.75 6.75 6.75 6.75
SiCb 46.15 47.23 46.05 45.59 47.09 47,00 46.82 48.26 46.20 50,14 49.7D 49.43 50.73 TiCb .44 .40 .33 .48 .00 .12 .OD .48 .02 ,00 .06 .00 .06 AI2O3 29.17 31.13 27.41 28.49 30.32 36.96 39.23 30.08 37.79 30.98 32.27 32.22 31.06 FeO 4.86 3.78 4.42 4.56 3.98 1.11 .77 3.42 .65 2.34 2.22 1.86 2.87 MgO 2.67 3.31 5.06 5.00 2.92 .31 .17 3.85 .00 2.39 1.91 2.00 2.02 Mno .00 .04 .03 .04 .03 .35 .07 .00 .06 .04 .17 .03 .02 CaO .00 .00 .00 .00 .06 .03 .00 .00 .00 .00 .00 .00 .05 Na,0 .17 .12 .13 .12 .15 .20 .24 .16 .07 .11 .11 .09 .08 K20 10.69 10.60 10.70 10.64 10.84 9.82 10.34 10.40 10.51 10.94 10.87 ID.77 10.98 P2O5 .00 .00 .00 .00 .00 .00 .00 .12 .09 .00 .00 .00 .00 F .04 ,40 .00 .16 .36 .00 .00 .20 .24 .20 .D7 .00 ' . .00
TOTAL 94.39 97.01 94.13 95.10 93 .75 95.88 97.63 96.98 95.62 97.13 97.37 96.42 97.87
MUSCOVITE ANALYSES
H o l e * 1 1
ttepth ' 13.60 13,80 13 . BO 13.60 13.80 13.80 13.80 13.80 14.42 14.42 14.42 14.42 14.42 14.42 14.42 14.42 14.42 16.47 16.47
5i02 50.68 50.40 47.08 47.03 47.83 48.13 47.94 46.33 48.45 50.03 48.92 47.11 48.24 49.03 48.24 47.09 49.75 47.58 46.47 Tipz .11 .00 .87 .49 .03 .09 .41 .49 .00 .06 .53 .70 .95 .03 .63 .44 .07 .71 .35 W2O3 29.61 30.79 30.12 26.40 30.09 29.96 30.59 27.92 30.36 32.71 33.47 30.00 29.75 3 1 . 86 31 . DB 27.23 32.31 30.41 29.19 Feo 2.9a 2.88 2.99 3.34 2.04 3.22 3.36 4.02 1.40 .85 .03 2.94 3.11 2.48 2.78 4.24 1.47 3.64 4.60 KgO 2.23 2.05 3.05 3.80 2.52 3.23 3.78 4.99 2.28 2.23 1.87 3.23 3.31 2.32 3.74 5.74 2.18 2.86 4.78 Mna .03 .10 .02 .07 .09 .04 .08 .06 .00 .00 .00 .00 .06 .00 .04 .00 .CO .01 .06 Cao .05 .00 .03 .20 .05 .02 .02 .00 .05 .00 .04 .07 .02 .04 .01 .00 .03 .00 • CO Na 20 .07 .07 .18 .20 .11 .21 .22 .16 .06 .10 .10 .13 .15 .18 .25 .15 .16 .14 .14 K 20 10.88 11.19 11.13 10.83 10.74 10.95 11.33 10.97 10.88 10.97 10.66 10.69 10.94 10,75 11.12 11.03 10.60 11.07 10.91 P 2 0 5 .00 .06 .00 .02 .02 .06 .00 .02 .05 .00 .00 .00 .00 .00 .07 .00 .00 .00 .05 f .00 .12 .00 .12 .10 .12 .15 .17 .14 .20 .00 .18 .05 .12 .43 .23 .14 .07 .11
TOTAL 96.64 97,66 95,ft7 94.32 93.60 96.02 97.91 95.13 93.72 97.lft 95.59 95.07 96.5B 96.82 9B.38 96.21 96.71 ?6.70 96.67
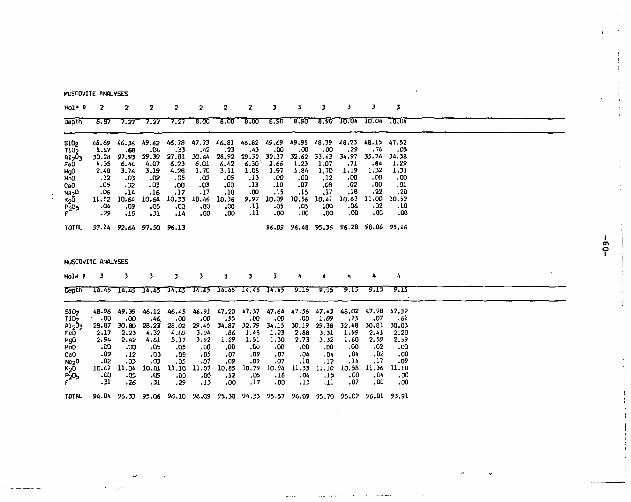
MUSCOVITE ANflUVSES
Hole B 2 2 2 2 2 2 2 3 3 3 3 3 3
Depth 6.87 7.27 7.27 7.27 8.00 8.00 8.00 8.90 8.90 8.90 10.04 10.04 10,04
SI02 46.69 46.36 49.62 46.78 47.73 46.81 46.82 49.69 49.95 48.39 48.23 48.15 47.52 Ti02 1.67 .68 .04 .33 .42 .23 .43 .00 .00 .00 .29 .76 .05 AI0O3 30.28 27.93 29.39 27.81 30.64 28.92 29.32 32.37 32.62 33.43 34.97 35.76 34.38 FeO 4.35 6.44 4.07 6.23 6.01 6.42 6.30 1.66 1.23 1.07 .71 .84 1.29 MgO Z.40 3.76 3.19 4.26 1.70 3.11 1.85 1.97 1.84 1,70 1.19 1.32 1.31 MnO . 1 2 .03 .02 .05 .05 .05 .13 .00 .00 .12 .00 .00 .00 CaO -05 .02 .03 .00 .03 .00 .13 .10 .07 .08 .02 .00 .01 Na 2 0 .06 .14 .16 .17 .17 .18 .00 .15 .15 .17 .18 ,22 .20 K 20 11.12 10.64 10.64 10.33 10.46 10.36 9.97 10.09 10.56 10.41 10.63 11.00 10.52 P2O5 .04 .09 .05 .00 .00 .00 .11 .05 .05 ;00 .06 .02 .10 F .29 .15 .31 .14 .00 .00 .11 .00 .00 .00 .00 .00 .08
TOTAL 97.14 92.64 97.50 96.13 96.09 96.48 95.36 96.28 98.06 95.46
MUSCOVITE ANALVSE5
Hole J 3 3 3 3 3 3 3 3 4 4 4 4 4
OeptFi 1/T.45 14.45 14.45 14.45 14.4$ 14.45 14.45 14.45 973 9713 9"7T3 9TB STTT"
S10 Z 48.96 49.39 46.12 46.45 46.91 47.20 47.37 47.64 47.56 47.43 48.02 47.98 47.52 TIDj AI2O3
• .DO .00 .46. .00 .00 .55 .00 .00 .00 1.09 .75 .07 .61 TIDj AI2O3 28.67 30.80 28 .23 28.02 29.45 34.82 32.79 34.15 30.19 29.38 32.48 30.81 30.03 FEO 2.17 2 .23 4.32 4.89 3.94 .66 1.49 1.23 2.88 3.31 1.99 2.41 2.23 MgO 2.94 2.42 4.61 5.17 3.92 1.29 1.51 1.30 2.73 3.32 1.60 2.59 2.59 HnO .00 .00 .05 .05 .00 .00 .00 .00 ,00 .00 .00 .02 .00 CaO .09 .12 .03 .08 .05 .07 .09 .07 .04 .04 .04 .02 .00 NO2O .02 .03 .03 .05 .07 .09 .09 .07 .10 .12 .14 .17 .09 KjO 10.67 11.04 10.01 11.10 11.07 10.85 10.79 10.94 11,33 11.10 10.58 U . 3 6 11.10 P 2 0 5 .00 .05 .09 .00 .00 .12 .05 .16 .04 .15 .00 .04 .00 F .31 .26 .31 .29 .13 .00 .17 .00 .13 .11 .07 .00 .00
TOTAL 94.04 96.33 95.06 96.10 96.09 95,30 94.33 95.57 96.09 95.70 95.02 56.01 93.91

MUSCOVITE ANALYSE5
H o l e ( 1 6 6 6 6 6 6 6 6 6
Depth 7775 7775 7775 7775 7 7 8 7773 f7?3 7771 TTTT
SiOj 48.21 50.30 46.78 46.42 47.61 47.24 50.35 49.73 49.04 Ti02 .00 .00 .00 .00 .00 .00 .00 .00 .00 AI3O3 29.24 28.56 29.90 29.45 31.17 30.38 3J .47 32.64 30.82 FeO 3.62 li.B7 3.79 4.29 4.99 4.64 2.5B 1.66 2.30 MgO 3.68 3.39 2.97 4.10 2.15 2.69 3.12 2.25 2.84 Mno .00 .00 .00 .04 .02 .00 .00 .00 .00 Cao .03 .D4 .00 .02 .02 .03 .04 .05 .01 Na 20 .10 .D7 .15 .11 .18 .15 .13 .16 .13 k 2 n 11.08 11.07 10. BS 10.45 10.34 11.34 10.88 10.56 10.91 P20 5 .00 .D5 .00 .00 .00 .00 .00 .03 .00 F .23 .24 .10 .05 .08 .07 .00 .19 .23
TOTAL 96.19 9B.59 94.56 94.93 97.07 96.55 98.56 97.29 96.29
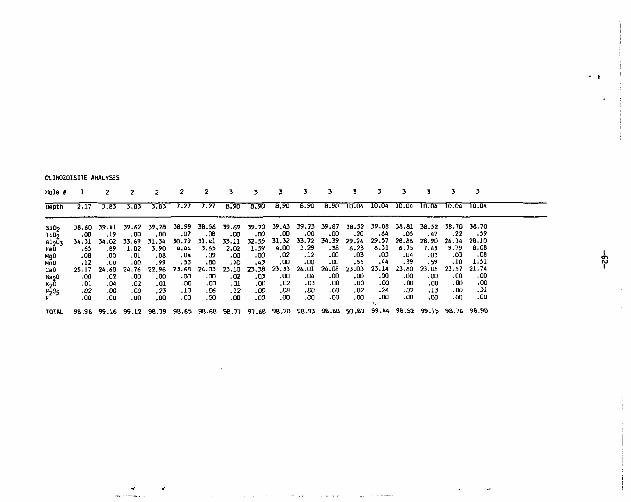
CUNOIOISHE ANALYSES
Hole J 1 2 2 2 2 2 3 3 3 3 3 3 3 3 3 3 3
Depth 27l7 3Tal 3Tel 3T83 7.27 7727 8790 8795 8.90 8.90 8.90 10.04 1U.U4 10.04 10.04 10.04 10.04
S10 2
TiD 2
Aly03
38.60 39.41 39.62 39.28 38.99 3B.56 39.69 39.70 39.43 39.73 39.87 38.52 39.08 38.81 38.52 38.70 38.70 S10 2
TiD 2
Aly03 .00 .19 .OD .00 .07 .06 .00 .00 .00 .00 .00 .20 .64 .05 .47 .22 .59
S10 2
TiD 2
Aly03 34.31 34.02 33.69 31.34 30.79 31.41 33.11 32.55 31.32 33.72 34.39 29.24 29.57 28.86 28.90 26.34 28.10 FeO .65 .89 1.02 3.90 4.44 3.65 2.02 1.59 4.00 1.29 .38 6.23 6.31 6.75 7.45 9.79 8.OS MgO .08 .00 .01 .08 .04 .09 .00 .oo .02 .12 .00 .03 .03 .04 .03 .03 .08 MnO .12 .00 .00 .99 .33 .00 .70 .45 .00 .00 .00 .55 .44 .39 .59 .10 1.51 CaO 25.17 24.60 24.76 22.96 23.68 24.03 23.10 23.38 23.33 24.01 24.06 23.03 23.14 23.60 23.06 23.57 21.74 Na20 .00 .02 .00 .00 .00 .00 .02 .03 .00 .04 .00 .00 .00 .00 .00 .CO .00 K 20 P 2 0 5
.01 .04 .02 .01 .00 .00 .01 .00 .02 .03 .00 .00 .00 .00 .00 .00 .00 K 20 P 2 0 5
.02 .00 .00 .23 .10 .05 .12 .00 .OS .CD .00 .02 .24 .02 .13 .00 .31 K 20 P 2 0 5
.00 .00 .00 .00 .00 .00 .00 . 00 .00 .00 .00 .00 .00 .00 .00 .00 .00
101M- 9B.96 99.16 99.12 98.79 98.65. 98.68 98.77 97 .68 98.20 98 .93 98.80 97.82 9 9 . W 98.52 99.15 98.16 98.90

CHLORITE ANALVSES
Hole I
DepTh 2743 2755 2776 5778 2778 5778 5778 67i0" 6771 5771 6773 6.75 14.42 16.47 16.47 16.47 6761 6781 6787"
S102
T102
A1 20 3
Feo Mga NflO cao Na20 K2C P 2 0 5
TOTAL 89.01 8S.65 67.27 89.62 88.50 87.93 87.34 85.63 66.33 67.06 66.23 66.97
27.20 25.65 27.40 26.17 28.28 29.03 26.96 28.56 26.55 25.76 26.50 25.86 29.48 28.36 26.81 26.99 26.61 28.43 27.18 .44 .00 .00 .00 .00 .00 .00 .00 .00 .00 .20 .09 1.35 .22 .OB .18 .13 3.32 .00
15.54 20.45 20.10 19.60 21.15 19.09 17.83 19.37 19 .87 20.95 20.51 19.57 20.27 19 .26 22.15 20.72 19.24 17.84 19.07 21.57 24.08 18.69 19.24 17.48 16.36 17.37 14.25 76 .19 24.35 25.61 24.6D 15.43 71 .82 18.47 18.42 24.65 22.26 28.95 15.72 15.40 19.95 20.85 20.40 22.32 22.10 22.50 14 .76 14.83 14.54 15.15 22.70 16 .53 15.59 19.57 15.57 13.74 12.03
.93 .95 .83 .79 .87 1.02 .68 .87 .97 1.14 .61 1.44 .20 .66 .48 .44 .87 .72 .50
.33 .06 .•2 .03 .03 .03 .03 .01 .UO .01 .05 .02 .07 .06 .02 .00 .03 2.76* .05
.00 .00 .00 .80 .00 .00 .00 .00 .00 .00 .02 .00 .00 .UU .00 .00 .00 .00 .00
.03 .02 .00 .12 .17 .00 .00 .07 .00 .00 .00 .04 .01 .94 .00 .oo .03 .61 .00
.04 .04 .12 .05 .00 .09 .16 .00 .00 .00 .00 .00 .00 .00 .00 .00 .04 .04 .02 .21 .DO .15 .17 .14 .00 .00 .00 .00 .00 .00 • DO .39 .00 .00 .00 .11 .12 .00
87.85 B7.69 66.37 67.26 65.65 87.60
CHLORITE ANALYSES
Hole 1 2 2 2 2 2 2 2 2 3 3 4 4 6 6 6 6 6
Depth 6.87 6.87 7.27 7.27 8.00 6.00 8.00 8.00 10.04 10.04 3.S3 3.83 7.75 7.75 7.75 7.75 7.75
S10 2 25.55 25 .79 25.31 26.61 25 .99 26.91 27.87 25 .74 26.75 27 .46 27 .06 27 .15 27.53 26 .68 27.22 27 .20 27.45 T10; .02 .05 .08 .01 .n* .12 .00 .08 1.63 .02 1 .54 .03 .00 .00 -CC .00 .00 A l j 0 3
29.59 21 .01 21.00 20.53 20.50 20.65 20.27 20 .10 20.69 20.43 21 .52 21 .39 20.00 21 .14 19.90 20 .38 20.08 Feo 24.35 23.71 21.33 23.66 24 .» 25.06 24.41 25.33 22.00 22.89 16.66 20.34 51.13 21.99 25.39 25.60 25.18 "90 14.63 15.39 16.24 16.16 15.OB 15.76 15.31 14 .77 16.6D 16 .75 19 .01 18 .77 18.72 17.63 15.46 15.36 15.23 MnO .50 .65 .57 .61 .55 .48 .48 .55 .79 .70 .72 .84 .17 .15 .80 .79 .80 CaO .02 .05 .00 .06 .03 .04 .05 .00 .04 .02 .02 .00 .03 .05 .04 .04 .04 N920 .00 .UO .00 .00 .03 .00 .08 .00 .12 .00 .08 .00 .00 .05 .00 .00 .DO K 20 .00 .Ul .04 .00 .0? .00 .02 .01 .19 .05 .05 .02 .03 .U2 .00 .00 .DO P7P5 .00 .02 .00 .00 .Of) .CO .00 .00 .00 .00 .09 .20 .00 .CO .06 ,00 .00 F .00 .UO .00 .21 .00 .00 .00 .00 .00 .10 .04 .13 .00 .00 .00 .00 .00
TOTAL 85.65 B7.38 84.37 87.85 86.62 89.C2 88.49 86.5B 8?.02 87.92 88.78 88.86 87.60 88.13 88.92 89.3?