Kuwait Oil Company (K.S.C) and Kuwait National Petroleum ...

Al Safat Investment Company Page 1 of 3
MENA Weekly Report
Apr 09, 2017
GCC Markets Watch Indicators M.Cap
(USD Bn) Last Close
WTD (%)
MTD (%)
YTD (%)
P/E TTM
P/B TTM DY
Kuwait SE Wt. 103 420 1.7 1.7 10.5 14.4 1.5 5.6 Saudi (TASI) 443 7,076 1.1 1.1 -1.9 14.8 1.7 4.2 Abu Dhabi (ADI) 136 4,615 3.9 3.9 1.5 11.1 1.6 5.2 Dubai (DFMGI) 83 3,566 2.5 2.5 1.0 9.6 1.2 4.9 Qatar(QE Index) 133 10,456 0.6 0.6 0.2 15.2 1.5 4.0 Oman(Muscat) 17 5,613 1.1 1.1 -2.9 9.8 1.1 5.6 Bahrain (BAX) 21 1,353 -0.2 -0.2 10.9 10.1 0.9 5.0 S&P GCC 894 100 1.4 1.4 0.6 14.8 2.0 3.4 Source: Reuters
Kuwait Market Indices Indicators M. Cap
(KD Bn) Last
Close WTD (%)
MTD (%)
YTD (%)
P/E TTM
P/B TTM DY
KSE Price Index 31 7,030 0.0 0.0 22.3 16.0 1.5 4.9 Weighted Index 31 420 1.7 1.7 10.5 14.4 1.5 5.6 KWT 15 Index 17 958 2.6 2.6 8.2 15.1 1.5 3.8 Kuwait Islamic Index 10 91 1.4 1.4 9.5 15.9 1.4 3.3
Source: Reuters
Kuwait Sector Performance Indicators
M. Cap (KD Bn)
Last Close
Volume (in mn)
Value (KD mn)
WTD (%)
MTD (%)
YTD (%)
Oil & Gas 0.3 300 9.9 0.6 3.3 3.3 11.7 Basic Materials 0.8 749 1.6 0.6 2.2 2.2 33.1 Industrials 3.1 644 120.0 10.5 0.1 0.1 9.7 Consumer Goods 1.4 936 13.6 2.5 0.5 0.5 -0.9 Healthcare 0.2 621 0.20 0.10 -2.7 -2.7 4.8 Consumer Services 0.7 462 28.0 2.3 1.3 1.3 2.1 Telecommunications 2.6 349 52.2 11 -1.0 -1.0 5.8 Banking 13.7 484 275.2 48.7 3.3 3.3 12.5 Insurance 0.3 577 0.3 0 -0.1 -0.1 -3.6 Real Estate 2.3 590 574.0 28.6 1.2 1.2 6.5 Financial Services 2.8 500 718.1 46.5 -0.5 -0.5 16.2 Technology 0.06 420 1.1 0.1 1.3 1.3 30.5 Source: Reuters
Al Safat Group Companies
Indicators M.
Cap (KD Mn)
Last Close
WTD (%)
MTD (%)
YTD (%)
P/E TTM
P/B TTM
Senergy 9.9 50 7.6 7.6 43.5 - 0.6
Effect RE 3.0 37 1.4 1.4 -7.5 - 0.5
Danah Alsafat 26.2 91 0.0 0.0 4.6 - 0.7
Shuaiba Indus 33.8 420 2.4 2.4 42.4 17.8 1.8
Osos Holding 16.2 162 2.5 2.5 24.6 - 1.2
Source: Reuters
Kuwait Sector Valuation Matrix Indicators P/E
TTM P/B TTM P/S EV/EBITDA
Oil & Gas 11.9 1.6 1.7 4.3 Basic Materials 13.3 1.2 7.4 10.3 Industrials 15.0 1.9 2.7 10.7 Consumer Goods 17.9 3.1 1.2 9.7 Healthcare 18.9 2.6 1.4 11.4 Consumer Services 11.8 1.7 3.2 14.6 Telecommunications 11.3 1.3 1.6 5.2 Banking 14.4 1.4 4.7 9.0 Insurance 10.7 1.0 1.5 6.7 Real Estate 16.9 1.3 9.3 14.6 Financial Services 12.4 1.0 5.8 6.0 Technology 10.4 1.4 3.1 6.2
Source: Reuters
Kuwait Indices Performance Chart
Source: Reuters
85
95
105
115
125
135
Kuwait Price Index, 34.4% Kuwait Weighted Index, 16% KWT 15 Index, 12.1% Islamic Kuwait Index, 16.2%
Al Safat Investment Company Page 2 of 3
MENA Weekly Report
Apr 09, 2017
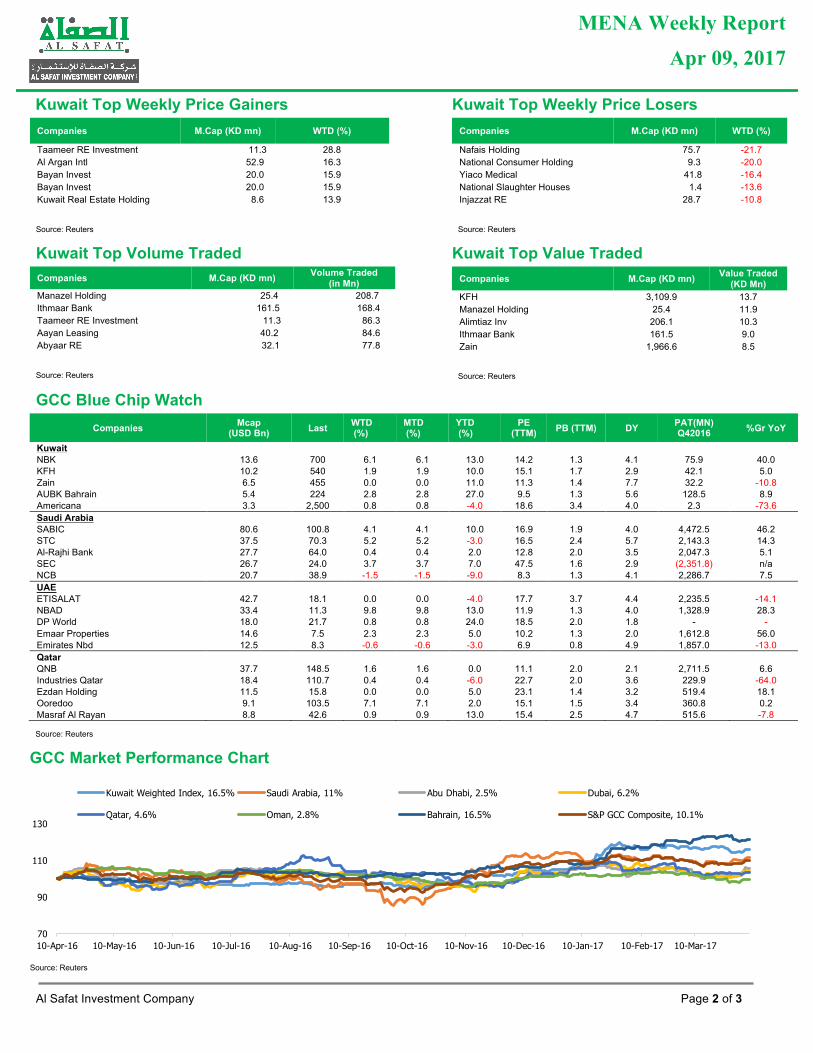
Kuwait Top Weekly Price Gainers Companies M.Cap (KD mn) WTD (%)
Taameer RE Investment 11.3 28.8 Al Argan Intl 52.9 16.3 Bayan Invest 20.0 15.9 Bayan Invest 20.0 15.9 Kuwait Real Estate Holding 8.6 13.9
Source: Reuters
Kuwait Top Volume Traded Companies M.Cap (KD mn) Volume Traded
(in Mn) Manazel Holding 25.4 208.7 Ithmaar Bank 161.5 168.4 Taameer RE Investment 11.3 86.3 Aayan Leasing 40.2 84.6 Abyaar RE 32.1 77.8
Source: Reuters
Kuwait Top Weekly Price Losers Companies M.Cap (KD mn) WTD (%)
Nafais Holding 75.7 -21.7 National Consumer Holding 9.3 -20.0 Yiaco Medical 41.8 -16.4 National Slaughter Houses 1.4 -13.6 Injazzat RE 28.7 -10.8
Source: Reuters
Kuwait Top Value Traded Companies M.Cap (KD mn) Value Traded
(KD Mn) KFH 3,109.9 13.7 Manazel Holding 25.4 11.9 Alimtiaz Inv 206.1 10.3 Ithmaar Bank 161.5 9.0 Zain 1,966.6 8.5
Source: Reuters
GCC Blue Chip Watch Companies Mcap
(USD Bn) Last WTD (%)
MTD (%)
YTD (%)
PE (TTM) PB (TTM) DY PAT(MN)
Q42016 %Gr YoY
Kuwait NBK 13.6 700 6.1 6.1 13.0 14.2 1.3 4.1 75.9 40.0 KFH 10.2 540 1.9 1.9 10.0 15.1 1.7 2.9 42.1 5.0 Zain 6.5 455 0.0 0.0 11.0 11.3 1.4 7.7 32.2 -10.8 AUBK Bahrain 5.4 224 2.8 2.8 27.0 9.5 1.3 5.6 128.5 8.9 Americana 3.3 2,500 0.8 0.8 -4.0 18.6 3.4 4.0 2.3 -73.6 Saudi Arabia SABIC 80.6 100.8 4.1 4.1 10.0 16.9 1.9 4.0 4,472.5 46.2 STC 37.5 70.3 5.2 5.2 -3.0 16.5 2.4 5.7 2,143.3 14.3 Al-Rajhi Bank 27.7 64.0 0.4 0.4 2.0 12.8 2.0 3.5 2,047.3 5.1 SEC 26.7 24.0 3.7 3.7 7.0 47.5 1.6 2.9 (2,351.8) n/a NCB 20.7 38.9 -1.5 -1.5 -9.0 8.3 1.3 4.1 2,286.7 7.5 UAE ETISALAT 42.7 18.1 0.0 0.0 -4.0 17.7 3.7 4.4 2,235.5 -14.1 NBAD 33.4 11.3 9.8 9.8 13.0 11.9 1.3 4.0 1,328.9 28.3 DP World 18.0 21.7 0.8 0.8 24.0 18.5 2.0 1.8 - - Emaar Properties 14.6 7.5 2.3 2.3 5.0 10.2 1.3 2.0 1,612.8 56.0 Emirates Nbd 12.5 8.3 -0.6 -0.6 -3.0 6.9 0.8 4.9 1,857.0 -13.0 Qatar QNB 37.7 148.5 1.6 1.6 0.0 11.1 2.0 2.1 2,711.5 6.6 Industries Qatar 18.4 110.7 0.4 0.4 -6.0 22.7 2.0 3.6 229.9 -64.0 Ezdan Holding 11.5 15.8 0.0 0.0 5.0 23.1 1.4 3.2 519.4 18.1 Ooredoo 9.1 103.5 7.1 7.1 2.0 15.1 1.5 3.4 360.8 0.2 Masraf Al Rayan 8.8 42.6 0.9 0.9 13.0 15.4 2.5 4.7 515.6 -7.8
Source: Reuters
GCC Market Performance Chart
Source: Reuters
70
90
110
130
10-Apr-16 10-May-16 10-Jun-16 10-Jul-16 10-Aug-16 10-Sep-16 10-Oct-16 10-Nov-16 10-Dec-16 10-Jan-17 10-Feb-17 10-Mar-17
Kuwait Weighted Index, 16.5% Saudi Arabia, 11% Abu Dhabi, 2.5% Dubai, 6.2%
Qatar, 4.6% Oman, 2.8% Bahrain, 16.5% S&P GCC Composite, 10.1%

Al Safat Investment Company Page 3 of 3
MENA Weekly Report
Apr 09, 2017
Kuwait Market Commentary • The Kuwait Market Price Index closed on a positive note at 7,030 points, a gain of 0.01%. The Weighted Index closed
at 420, a gain of 1.66%. The KSE 15 Index closed at 958, a gain of 2.59%. Islamic Kuwait Index closed at 91, a gain of 1.4%. Manazel Holding witnessed the highest volume traded at 208.7 Mn and KFH witnessed the highest value traded at KD 13.7 Mn. Banking was the top gainer, up 3.34%. Healthcare was the top loser, down 2.73%. Taameer Re Investment was the top gainer, up 28.8%, closing at KWf 47. Nafais Holding was the top loser, down 21.7%, closing at KWf 180.
GCC Market Commentary
• GCC markets were positive as evidenced by S&P GCC Index which gained by 1.4% compared to previous week. Abu Dhabi followed by Dubai and Kuwait were top performers with a gain of 3.9%, 2.5% and 1.7% respectively. Bahrain with a loss of 0.2% was the only decliner.
• Blue chips were positive. NBAD was the top gainer, closing 9.8% higher, while NCB was the top loser declining 1.5%.
Corporate News
• Kuwait Finance and Investment Company KFIC announced its financial results for the year ended Dec 31, 2016 in which it yielded a net profit of 211 thousand Kuwaiti Dinars at an EPS of 0.70 fils per share, compared with a profit worth of 985 thousand Kuwaiti Dinars, at an EPS of 3.2 fils for the year 2015.
• Global Investment House (“Global” or the “Company”), announced its financial results for the year ended Dec 31, 2016 reporting a net profit of KD 3.5 million ($11.3 million), total revenues of KD 14.7 million ($47.5 million), and fee and commission income of KD 11.5 million ($37.7 million) representing 78 percent of total revenues.
• The Dubai Gold and Commodities Exchange (DGCX), the Dubai Multi Commodities Centre (DMCC) and RakBank
have signed a memorandum of understanding (MoU) for the development of bullion products. One product that is in immediate consideration is a Retail Spot Gold contract that could be specifically targeted for retail investors and traders. All products will be submitted to the relevant regulatory authorities for approval prior to launch.
• Shares in the merged National Bank of Abu Dhabi and FGB – now known as First Abu Dhabi Bank – surged as
investors welcomed its forecast of higher profitability and a doubling of cost savings. The bank said in an investor presentation published on its website that cost synergies are forecast at Dh1 billion, twice the initial estimate of Dh500 million. They would occur over a period of three years and would be driven by a reduction in branches and headcount.
• RAKBank shareholders approved a cash dividend of 30 per cent Annual General Meeting (AGM) for the financial year
December 2016.
CONTACT DETAILS
Mr. Talal Al-Yousef Deputy Manager – Asset Management Tel: +965-22675248 E-mail: [email protected]
This report has been prepared and issued by Al Safat Investment Company. The report is owned by Al Safat and is privileged and proprietary and is subject to copyrights. Sale of any copies of this report is strictly prohibited. This report cannot be quoted without the prior written consent of Al Safat. Any user after obtaining Al Safat permission to use this report must clearly mention the source as “Al Safat“. This Report is intended to be circulated for general information only and should not to be construed as an offer to buy or sell or a solicitation of an offer to buy or sell any financial instruments or to participate in any particular trading strategy in any jurisdiction. The information and statistical data herein have been obtained from sources we believe to be reliable but in no way are warranted by us as to its accuracy or completeness. Al Safat has no obligation to update, modify or amend this report. For further information, please contact Al Safat at P.O. Box 20133 Al Safat 13062 Tel. +965 1877777