
Memory, Big Data, NoSQL and Virtualization
26
s
Transcript of Memory, Big Data, NoSQL and Virtualization

s


Plan• Storage hierarchy • CPU architecture • The TLB • The Huge Pages • The Transparent Huge Pages • VT-x (virtualization impact on memory access,
Couchbase benchmark, sysbench) • The QPI Link (Impala benchmark) • Hyperthreading (HPL/Linpack and HPCG) • Containers vs VMs (Docker)

Why should we care?• “Memory is the new disk! “ • “Disk is the new tape!” • “Tape is …”
• Is it really that easy?
latency (nanoseconds) vs scaled to “human time”
ns scaled to s
1 cpu cycle 0.3 1s
L1 cache hit 0.9 3s
L2 2.8 9s
L3 12.9 43s
LMA 60 3m
RMA 120 7m
TLB Cache miss 240 13m
SSD disk IO 100,000 4d
Rotational disk IO 10,000,000 1y
Internet San Francisco to United Kingdom 81,000,000 8y

Storage hierarchies - It used to be like this:la
tenc
y (n
anos
econ
ds)
0
2500000
5000000
7500000
10000000
1 cpu cycle L1 cache hit L2 L3 LMA RMA TLB cache miss SSD Disk
10,000,000
100,0004801206012.92.80.90.3
latency (nanoseconds)

Storage hierarchies - Now it’s more like this:la
tenc
y(na
nose
cond
s)
0
75
150
225
300
1 cpu cycle L1 cache hit L2 L3 LMA RMA TLB cache miss
240
120
6012.92.80.90.3
latency (nanoseconds)

CPU architecture - It used to be like this:
• Single core • Linear memory access times • Simple cache hierarchy • Very small memory capacities
CPU
Memory
Memory Ctrl
L1 cache

CPU architecture - Now it’s more like this:
• Multiple cores • Multiple memory controllers • QPI links • More complex cache hierarchies
socket A socket B
Memory Ctrl
Memory Memory
L1L2
CPU L1L2
CPU
L1L2
CPU L1L2
CPU
L1L2
CPU L1L2
CPU
L3 L3
L1L2
CPU L1L2
CPU
L1L2
CPU L1L2
CPU
L1L2
CPU L1L2
CPU
Memory Ctrl
QPI link

Implications
• Algorithms don’t have to tradeoff computational efficiency for memory efficiency any more. • Algorithms need to be parallel by design. • The QPI link becomes an issue (with LMA =1/2 RMA). • The TLB cache miss becomes an issue. • The memory frequency and DIMM placement becomes an issue.

The cache hierarchies
C1
L1L2
L3
Cn
L1L2
...
QPIMemory Ctrl. 4 chan
C1
L1L2
L3
Cn
L1L2
...
QPIMemory Ctrl. 4 chan
DRAM
DRAM
DRAM
DRAM
DRAM
DRAM
DRAM
DRAM
1 cycle 0.3 nsRegisters/Buffers
0.9 ns 2.8 ns
12.9 ns
QPI 60 ns
60 ns
64KB256KB
20MB
16GB16GB16GB16GB
PCIe ctrl.(40 lanes)
PCIe ctrl.(40 lanes)
CPU socket 1 CPU socket 2
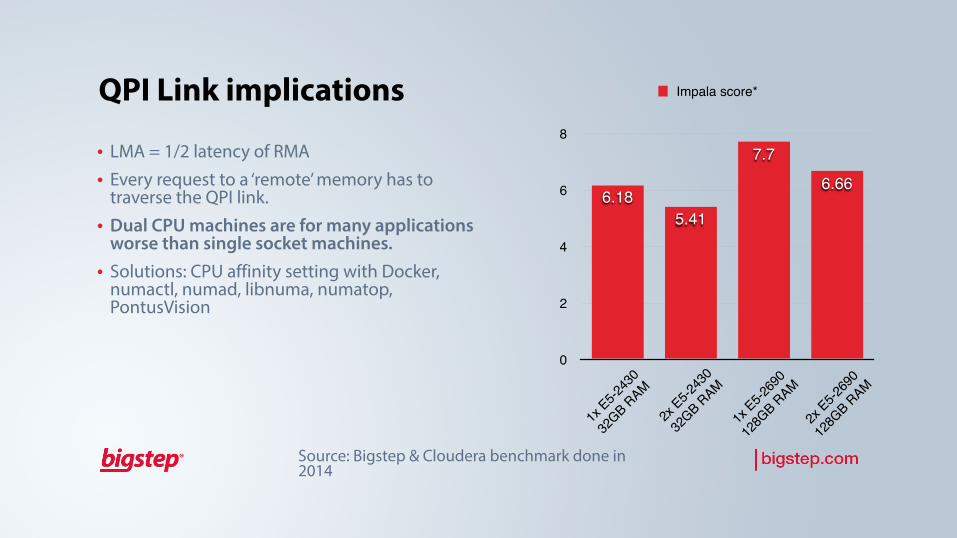
QPI Link implications
• LMA = 1/2 latency of RMA • Every request to a ‘remote’ memory has to
traverse the QPI link. • Dual CPU machines are for many applications
worse than single socket machines. • Solutions: CPU affinity setting with Docker,
numactl, numad, libnuma, numatop, PontusVision
0
2
4
6
8
1x E5-2
430
32GB RAM
2x E5-2
430
32GB RAM
1x E5-2
690
128G
B RAM
2x E5-2
690
128G
B RAM
6.66
7.7
5.416.18
Impala score*
Source: Bigstep & Cloudera benchmark done in 2014
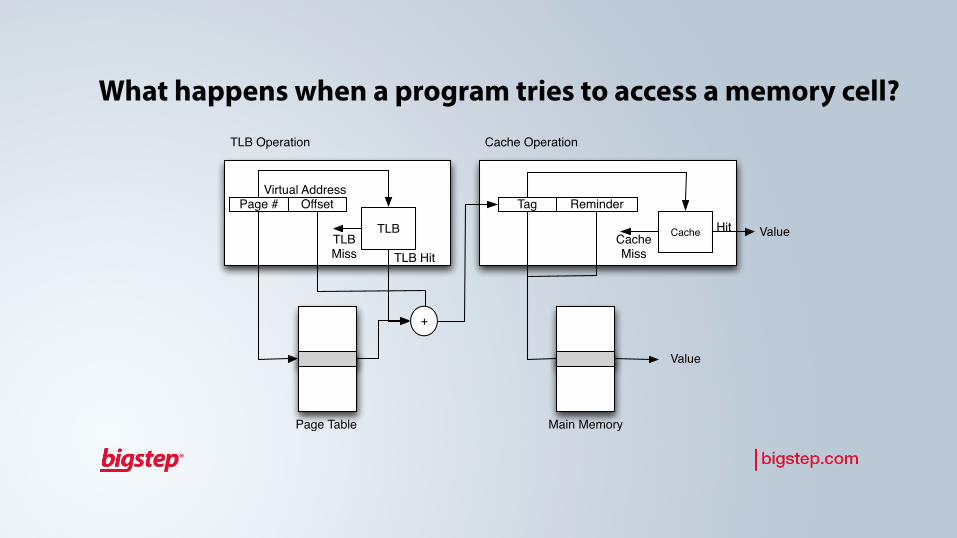
What happens when a program tries to access a memory cell?TLB Operation
Page # OffsetVirtual Address
TLB
Page Table
+
Tag Reminder
CacheTLBMiss TLB Hit
Main Memory
Cache Operation
CacheMiss
ValueHit
Value

How often does a TLB Miss occur?
Source: “Memory System Characterization of Big Data Workloads” by Martin Dimitrov et all.- Intel Corp. [2013]
TLB
Mis
ses
per t
hous
and
of
inst
ruct
ions
0
0.45
0.9
1.35
1.8
Hive Aggr C Hive join C NoSQL Index Sort NC WC NC
1.71.8
1.49
0.75
1.7
0.550.60.7
0.60.7
0.5
0.12
0.8
0.270.150.090.130.1
Instruction TLB miss per thousand of instructions Data TLB miss per thousand of instructions
c: compressed data nc: uncompressed data

The TLB and virtualization
• Impact: On big data technologies it occurs about once or twice per 1000 instructions (about every 1us) • One TLB miss on bare metal = twice the DRAM latency • One TLB miss on VM (with VT-X) = up to 12 times the DRAM latency • Solutions: Use huge pages, don’ t use virtualization, don’t use transparent huge pages
“THP is not recommended for database workloads.” source: Redhat perf. tuning guide
“[…] the TLB miss latency when using hardware assistance is significantly higher.” Source: Methodology for Performance Analysis of VMware vSphere under Tier-1 Applications

TLB and virtualization
Source: internal Bigstep benchmarks done in 2014 and presented at various events
0s
1.25s
2.5s
3.75s
5s
sysbench multi-threading performance
5s
1s
Native Virtual
0s
10s
20s
30s
40s
sysbench memory 1TB read (1M bs), write total time
32s25s
Native Virtual

TLB and virtualization
0
45,000
90,000
135,000
180,000
Average Requests/second 16 bytes records
Average Requests/second 512 bytes records
53,20068,840
179,366168,662
Bigstep (bare metal) AWS (VM based)
• 2 x FMCI 4.16 (4-Cores - 8 with HT, 16 GB RAM Centos 6.5) • 2 x m3.2xlarge
(8 cores, 30 GB of RAM) instances RHEL6.5
• Note: AWS is here just because they use virtualisation but this is true for every VM based hosts.
Source: Bigstep benchmarks done in 2014 and presented at Couchbase Live and HUG London

A word on Intel’s Hyper-Threading
• Hyper-threading is a method of executing 2 instructions in the same core at the same time (while the CPU gets the required memory required to execute an instruction the other one can execute some tasks) • Is this twice the performance? Actually it’s about the same or worse with it. • The caches are shared for HT ‘cores’. • Clouds sell a ‘virtual core’ which is actually a hyper-threaded core = half of a real core’s “performance”.

Containers vs VMs
GuestProcess
GuestProcess
Isolation enforcing layer
Host OS (linux)
Hardware
GuestOS
GuestOS
Virtualization layer
Host OS (linux)
Hardware
GuestProcess
GuestProcess
Containers VMs
• Native like Cache efficiency • No TLB miss amplification • NUMA node affinity control • Native performance

Containers vs VMs - isolation
LXC Xen
CPU Stress 0 0
Memory 88.2% 0.9%
Disk Stress 9% 0
Fork Bomb Did not run 0
Network Receiver 2.2% 0.9%
Network Sender 10.3% 0.3%
Source: Performance Evaluation of Container-based Virtualization for High Performance Computing Environments Miguel G et all. PUCRS 2014
The results represent how much the application performance is impacted by different stress tests in another VM/Container.

Containers vs NativeAv
erag
e re
spon
se ti
me
(us)
sm
alle
r is
bette
r
0
6
11
17
22
INSERT SELECT UPDATE
11
1921
10
1819
1 Node native 1 Node Native 1 docker container
Source: Bigstep’s Cassandra benchmark presented at C* summit London 2014

Network performance• Network is very much dependent on
memory access speeds and offloading capabilities. • Memory access is delayed so is a network
packet that goes through the virtual stack • In virtual hosts switching is done in
software hence has all these issues. • TOE and RDMA support are available in
some clouds (including Bigstep).
Source: Performance Evaluation of Container-based Virtualization for High Performance Computing Environments Miguel G et all. PUCRS 2014

Bare metal = no cloud goodies?New breed of “bare metal" clouds emerging. Bigstep is one of them:
• Pay per use (actually per second) • Single tenant bare metal • Brilliant performance • Provisioning times: 2-3 minutes (the time it takes a server to
boot up). • Stop and Resume support • Snapshot and rollback support • Upgrades and downgrades with a reboot • Low latency baremetal network • UI with drag and drop


Key take-aways for Big Data workloads• Start thinking in terms of memory & CPU architecture when sizing, operating and developing high
memory footprint applications. • Memory access times are the new performance metric, look for it. • Avoid virtualization whenever possible. • Checkout the new “baremetal” cloud providers. • Use Docker if you need consolidation ratios and better isolation. • Use numatop to checkout RMA to LMA ratios, use numad like irqbalance. Manually control with
numactl if required. • Always use huge pages, disable THP for databases.


