MEMORANDUM - The University of Kansas€¦ · MEMORANDUM To: Lisa Koch, Kansas Department of...
40
MEMORANDUM To: Lisa Koch, Kansas Department of Transportation From: Nicholas Pappas, University of Kansas Transportation Center Date: April 9, 2009 Re: Regional Zonal Analysis for Pilot Areas Using the four pilot cities for this analysis—Garden City, Hays, Hutchinson, and Salina—a series of maps depicting aggregate trip attractions within each zone and significant locations between zones are included in this document. Trip attractions include: a city population greater than 5,000; the presence of a VA outpatient clinic, cardiac center, oncology center, dialysis center, disability rehabilitation center, social services center, veteran employment center, pharmacy, and general employment center; and whether there is a presence of an institution for higher learning. In addition, all maps include a roadway flow overlay of Journey‐to‐Work county‐level data that is calculated from the centroid of each county. The roadway flow map was created in TransCAD, primarily using Journey‐to‐Work data from the U.S. Census (2000 figures), a national highway shapefile provided by the U.S. Department of Transportation, and highway classification averages from NCHRP Report 365. It is important to note that productions and attractions are assumed to start and end at each county’s centroid, not the population center. Output figures depict total flow in both directions per day. The boundaries for each zone were calculated by creating midpoint threshold distances between the locations of each attraction, assuming that people within those distances would travel to the trip attraction’s nearest respective location. This technique can be accomplished using two proximity tools called “Thiessen Polygons” 1 and “Generate Near Table” 2 in a GIS program. After several other techniques were performed, all trip attractions were weighted with respect to their importance and combined. Preference was given to variables in the following order: cities with a population of 5,000 or more and the presence of an institution of higher learning, then to health centers, then to social services centers, then to employment centers. The final output maps show zonal intensity as it pertains to trip attractions, with Zone 1 being the most intense and Zone 4 being the least intense. Counties within these zones were tabulated if one or more of the zones occupied more than half the county. The specific zone assigned to each county was determined by choosing the zone with the most presence in that county. For example, although there are many counties in Salina 1 A Thiessen Polygon is a polygon whose boundaries define the area that is closest to each point (i.e., a city) relative to all other points. Thiessen polygons are generated from a set of points; they are mathematically defined by the perpendicular bisectors of the lines between all points. 2 The “Generate Near Table” tool is used to determine the distance from each point to specifically defined points and display the results in a table.
Transcript of MEMORANDUM - The University of Kansas€¦ · MEMORANDUM To: Lisa Koch, Kansas Department of...

MEMORANDUM
To: LisaKoch,KansasDepartmentofTransportationFrom: NicholasPappas,UniversityofKansasTransportationCenterDate: April9,2009Re: RegionalZonalAnalysisforPilotAreasUsingthefourpilotcitiesforthisanalysis—GardenCity,Hays,Hutchinson,andSalina—aseriesofmapsdepictingaggregatetripattractionswithineachzoneandsignificantlocationsbetweenzonesareincludedinthisdocument.Tripattractionsinclude:acitypopulationgreaterthan5,000;thepresenceofaVAoutpatientclinic,cardiaccenter,oncologycenter,dialysiscenter,disabilityrehabilitationcenter,socialservicescenter,veteranemploymentcenter,pharmacy,andgeneralemploymentcenter;andwhetherthereisapresenceofaninstitutionforhigherlearning.Inaddition,allmapsincludearoadwayflowoverlayofJourney‐to‐Workcounty‐leveldatathatiscalculatedfromthecentroidofeachcounty.TheroadwayflowmapwascreatedinTransCAD,primarilyusingJourney‐to‐WorkdatafromtheU.S.Census(2000figures),anationalhighwayshapefileprovidedbytheU.S.DepartmentofTransportation,andhighwayclassificationaveragesfromNCHRPReport365.Itisimportanttonotethatproductionsandattractionsareassumedtostartandendateachcounty’scentroid,notthepopulationcenter.Outputfiguresdepicttotalflowinbothdirectionsperday.Theboundariesforeachzonewerecalculatedbycreatingmidpointthresholddistancesbetweenthelocationsofeachattraction,assumingthatpeoplewithinthosedistanceswouldtraveltothetripattraction’snearestrespectivelocation.Thistechniquecanbeaccomplishedusingtwoproximitytoolscalled“ThiessenPolygons”1and“GenerateNearTable”2inaGISprogram.Afterseveralothertechniqueswereperformed,alltripattractionswereweightedwithrespecttotheirimportanceandcombined.Preferencewasgiventovariablesinthefollowingorder:citieswithapopulationof5,000ormoreandthepresenceofaninstitutionofhigherlearning,thentohealthcenters,thentosocialservicescenters,thentoemploymentcenters.Thefinaloutputmapsshowzonalintensityasitpertainstotripattractions,withZone1beingthemostintenseandZone4beingtheleastintense.Countieswithinthesezonesweretabulatedifoneormoreofthezonesoccupiedmorethanhalfthecounty.Thespecificzoneassignedtoeachcountywasdeterminedbychoosingthezonewiththemostpresenceinthatcounty.Forexample,althoughtherearemanycountiesinSalina
1AThiessenPolygonisapolygonwhoseboundariesdefinetheareathatisclosesttoeachpoint(i.e.,acity)relativetoallotherpoints.Thiessenpolygonsaregeneratedfromasetofpoints;theyaremathematicallydefinedbytheperpendicularbisectorsofthelinesbetweenallpoints.2The“GenerateNearTable”toolisusedtodeterminethedistancefromeachpointtospecificallydefinedpointsanddisplaytheresultsinatable.

2
thatarepartlycomposedofZone2orZone4,eitherZone1orZone3hadmorepresence,and,therefore,wereassignedtothatcounty.Ultimately,countiesthathaverelativelyfewservicesthemselveswilllikelyobtaintheseservicesfromSalina.Additionally,amapshowingpopulationdensitypercounty(weightedforruralsettings)isalsoincluded.Followingeachpilotcityzonalanalysisisazonalinteractionmap,depictingserviceareaoverlaysfromadjacentpilotcitiesoradjoininglocations.Summarytablesofcountieswithineachregionareprovidedforeachsignificantlocation.AllpopulationfiguresandridershipcharacteristicdatawereobtainedfromtheU.S.Census.Withtheexceptionofdisabledpopulationdata,whichisderivedfrom2000data,allotherinformationisderivedfrom2007estimates.

3
TableofContents
PageI. WeightedPopulationDensity………………………………………………………………… 4
II. Journey‐to‐WorkTrafficAnalysis…………………………………………………………… 5
III. ZonalAnalyses
a. DodgeCityZonalAnalysis…………………………………..……………………… 9
b. GardenCityZonalAnalysis……………………………………..……………….... 12
c. GreatBendZonalAnalysis………………………………………..……………….. 15
d. HaysZonalAnalysis……………………………………………………………………. 18
e. HutchinsonZonalAnalysis…………………………………………………………. 22
f. LiberalZonalAnalysis……………………………………….………………………… 25
g. McPhersonZonalAnalysis……………………….…………………………………. 28
h. SalinaZonalAnalysis……………………………….………………………………….. 31
i. WichitaZonalAnalysis…………………….………………………………………….. 34
IV. InteractionAnalyses
a. GardenCityZonalInteractionAnalysis……………………………………….. 37
b. HaysZonalInteractionAnalysis………………………………………………….. 38
c. HutchinsonZonalInteractionAnalysis……………………………………….. 39
d. SalinaZonalInteractionAnalysis………………………………………………… 40

4
Thismapshowsweightedpopulationdensitiesforeachcounty,placinganemphasisonthemoreruralcounties.2007county‐leveldatawereobtainedthroughtheU.S.Census.

5
Journey‐to‐Workinter‐countytrafficflowsdisplaycounty‐leveldataobtainedfromthe2000U.S.Census.Duetothelimitationsofthedata,countycentroidshadtobedefinedinordertoaccuratelydisplaytheaggregatecountydataandavoidbiasinassumingthatapopulationcenternecessarilycontainsthemajorityofthetrips.Asaresult,themapshouldbereadassumingthatthepopulationcenterofthecountyisalsothecentroidofthecounty.Additionaldataisneeded—eitheratthetractlevelorblockgrouplevel—toestablishamoreaccuraterepresentationoftrafficflows.

6
GardenCityZonalAnalysis
ThefollowingtwopagesdescribeGardenCity’sdemographiccharacteristicsaswellastabulatethetripattractionsthatmakethepilotcityacenterofactivitytothosecountiesthatlacksuchattractions.The“LackofAttractions”tableorganizescountiesbytheirzonalintensity,ascanbeviewedonthemapthatfollows.An“X”indicatesalackofattractionforthatcounty,therebymakingthatcountyreliantonGardenCityforthatparticularservice.
PopulationCharacteristics
COUNTY 2007 Pop Pop %Pop Housing %Poverty %Unemp. Pop %Pop
Pop Den 65+ 65+Renter
Occupied Minority Minority
Cheyenne 2,901 3 750 26 285 8 3 86 3
Clark 2,240 2 511 23 212 11 3 121 5
Finney 38,728 30 3,116 8 4,325 11 5 11,479 30
Ford 34,237 31 3,458 10 3,927 10 5 10,283 30
Grant 7,394 13 773 10 655 8 5 1,851 25
Gray 5,790 7 738 13 547 6 3 561 10
Greeley 1,290 2 245 19 133 9 2 93 7
Hamilton 2,566 3 454 18 298 11 2 607 24
Haskell 4,217 7 470 11 394 9 3 726 17
Hodgeman 2,100 2 392 19 176 10 1 65 3
Kearny 4,506 5 516 11 407 9 3 945 21
Lane 1,835 3 400 22 179 6 2 43 2
Logan 2,736 3 594 22 264 5 4 89 3
Meade 4,627 5 785 17 434 7 3 492 11
Morton 3,124 4 499 16 334 8 4 372 12
Scott 4,465 6 639 14 465 4 2 263 6
Seward 23,410 37 2,072 9 2,678 14 5 9,189 39
Sherman 6,027 6 1,156 19 770 11 3 367 6
Stanton 2,154 3 317 15 247 12 3 422 20
Stevens 5,410 7 702 13 473 8 4 1,087 20
Thomas 7,448 7 1,189 16 922 8 6 261 4
Wallace 1,536 2 289 19 136 11 2 103 7
Wichita 2,236 3 369 17 226 11 3 355 16

7
GardenCityZonalAnalysis
PopulationCharacteristics(continued)
COUNTY Pop %Pop Total%
Households %Households%
Workforce%
Workforce Pop>16%Pop>
16
Hispanic Hispanic Householdswith1Vehicle
withNoVehicle
Walk‐to‐Work Carpool Disabled Disabled
Cheyenne 137 5 1,601 25 4 5 10 517 18
Clark 124 6 1,113 26 3 6 11 318 14
Finney 16,139 42 13,662 30 5 2 19 7,344 19
Ford 16,450 48 12,046 30 6 2 18 5,970 17
Grant 2,833 38 3,025 28 4 1 15 1,111 15
Gray 775 13 2,225 26 2 4 11 724 13
Greeley 157 12 688 22 2 8 13 285 22
Hamilton 708 28 1,207 27 4 5 15 596 23
Haskell 1,175 28 1,642 26 4 5 11 622 15
Hodgeman 81 4 970 21 4 4 10 296 14
Kearny 1,267 28 1,689 24 3 3 13 674 15
Lane 41 2 987 19 4 6 9 235 13
Logan 56 2 1,391 26 3 6 7 480 18
Meade 635 14 1,974 26 3 3 12 599 13
Morton 441 14 1,500 23 2 4 14 598 19
Scott 400 9 2,230 22 4 3 11 639 14
Seward 12,185 52 8,121 35 6 1 21 3,993 17
Sherman 508 8 3,143 23 3 3 8 1,104 18
Stanton 666 31 989 24 3 6 18 320 15
Stevens 1,420 26 2,279 27 3 3 10 754 14
Thomas 172 2 3,500 25 4 3 7 1,236 17
Wallace 98 6 772 17 2 8 8 145 9
Wichita 479 21 1,096 23 2 3 10 445 20

8
GardenCityZonalAnalysis
LackofAttractionsbyZone

9
TheGardenCityzonalmapdisplaystwolevelsofdata:tripattractiondatacodedintozonalintensities(theblueshadedpolygons)andJourney‐to‐Worktrafficflowsthatstandapartfromthetripattractiondata.Therefore,thetwolevelsofdatashouldbereadseparately.Areasofgreaterzonalintensities(darkblueareas)depictregionsinwhichresidentswillbemoreinclinedtoobtainservicesfromthepilotcitysincethecitycontainsthemajorityofservicesoftensought.Areasoflowerzonalintensities(lightblueareas)depictregionsinwhichresidentswillbeinclinedtoobtainsomeservices,butnotall.Giventheoption,residentsintheseregionsmaydecidetoobtainsomeserviceselsewhereduetocloserproximitytothoselocations.Often,servicesrequiredfromthepilotcityintheselightbluezonesarespecializedservices(i.e.,cardiaccenters,educationalinstitutions,orsocialservicescenters)asopposedtodailyservices(i.e.,pharmacies,stores,etc.).ForGardenCity,onlyKearneyCountyhasthemajorityofitsrespectiveareafallingintothehighestzonalintensityasidefromFinneyCountyitself.Additionally,trafficflowsindicaterelativelystronginteractionbetweenKearneyandHamiltoncounties.SinceHamiltonCountyexhibitsstrongtrafficflowsdespiteitsrelativelylowzonalintensity,furtherinvestigationofHamiltonCountyisrecommended.

10
TheGardenCityzonalinteractionmapdisplaysslightlydifferentinformationfromthepreviouszonalmap.Whiletrafficflowdataremainsthesame,thegrayzonesdepictregionsinwhichthereexistsaninteractionbetweenthepilotareasandanothersizeablecity.Thedarkbluezones(missing)depictregionsinwhichthereexistsnointeractionbetweenGardenCityandanothersizeablecity.ThisindicatesthatregionsinthedarkbluezonesarereliantonGardenCitymorethananyotherregionintheanalysisareabyvirtueoftherebeingnootherchoice.Fromthismap,wecanconcludethatthereisinteractionbetweenGardenCityandothercitiesthroughoutthefullextentoftheanalysisarea.
Overall,thecountiesinthisanalysisareacanbeorganizedintotwogroupsbasedontheirdependenceonGardenCityforservices,fromgreatestdependencetoleastdependence.ThosewiththegreatestdependencehavehighzonalintensitiesanddisplaystrongtrafficflowinteractionswithGardenCity—thisincludesKearnyCounty.ThosewiththelowestrelativedependencerelyonGardenCitytypicallyforspecializedservicesonlyanddonotdisplaystrongtrafficflowinteractions.InGardenCity’scase,thereisnocountythatreliesonthisanalysisareaalone.EvencountiesintheextremenorthhavesignificantinteractionwithHaysforservices.Therefore,itcanbeconcludedthattheonlycountywithsignificantdependenceonGardenCityisKearnyCounty.

11
HaysZonalAnalysis
ThefollowingtwopagesdescribeHays’sdemographiccharacteristicsaswellastabulatethetripattractionsthatmakethepilotcityacenterofactivitytothosecountiesthatlacksuchattractions.The“LackofAttractions”tableorganizescountiesbytheirzonalintensity,ascanbeviewedonthemapthatfollows.An“X”indicatesalackofattractionforthatcounty,therebymakingthatcountyreliantonHaysforthatparticularservice.
PopulationCharacteristics
COUNTY 2007 Pop Pop %Pop Housing %Poverty %Unemp. Pop %Pop
Pop Den 65+ 65+Renter
Occupied Minority Minority
Barton 28,141 31 5,007 18 3,195 11 5 2,536 9
Cheyenne 2,901 3 750 26 285 8 3 86 3
Decatur 3,104 3 832 27 324 9 1 81 3
Edwards 3,270 5 660 20 308 8 3 363 11
Ellis 26,494 29 3,792 14 4,006 7 4 1,308 5
Gove 2,674 2 662 25 222 8 2 52 2
Graham 2,662 3 714 27 240 9 3 129 5
Hodgeman 2,100 2 392 19 176 10 1 65 3
Jewell 3,260 4 870 27 306 10 2 41 1
Lane 1,835 3 400 22 179 6 2 43 2
Lincoln 3,370 5 728 22 315 9 2 70 2
Logan 2,736 3 594 22 264 5 4 89 3
Mitchell 6,277 9 1,350 22 660 8 4 173 3
Norton 5,576 6 1,045 19 468 7 4 408 7
Osborne 3,957 4 1,012 26 369 7 4 63 2
Pawnee 6,664 9 1,209 18 640 7 13 633 9
Phillips 5,373 6 1,223 23 487 8 2 97 2
Rawlins 2,569 2 676 26 262 7 2 38 1
Rooks 5,289 6 1,138 22 513 7 4 157 3
Rush 3,367 5 811 24 265 7 3 65 2
Russell 6,724 8 1,605 24 724 9 4 174 3
Scott 4,465 6 639 14 465 4 2 263 6
Sheridan 2,549 3 553 22 186 12 1 41 2
Sherman 6,027 6 1,156 19 770 11 3 367 6
Smith 4,034 5 1,142 28 347 9 3 56 1
Thomas 7,448 7 1,189 16 922 8 6 261 4
Trego 2,982 3 738 25 252 11 2 74 2
Wallace 1,536 2 289 19 136 11 2 103 7
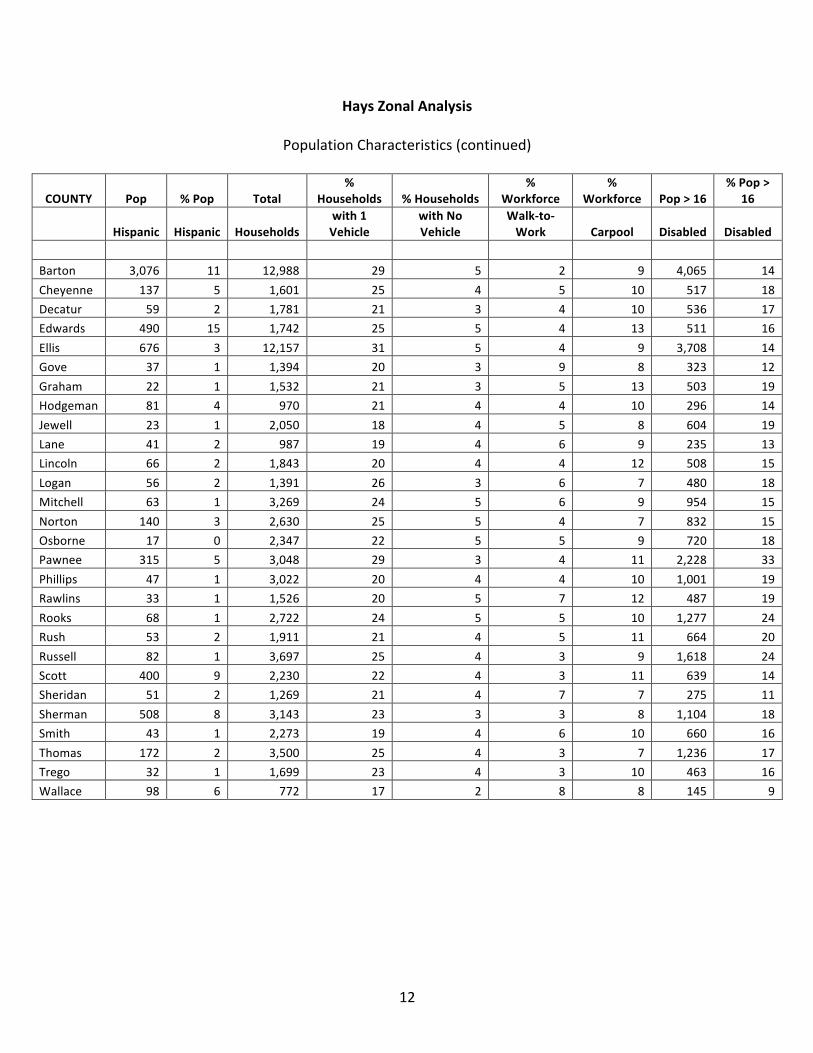
12
HaysZonalAnalysis
PopulationCharacteristics(continued)
COUNTY Pop %Pop Total%
Households %Households%
Workforce%
Workforce Pop>16%Pop>
16
Hispanic Hispanic Householdswith1Vehicle
withNoVehicle
Walk‐to‐Work Carpool Disabled Disabled
Barton 3,076 11 12,988 29 5 2 9 4,065 14
Cheyenne 137 5 1,601 25 4 5 10 517 18
Decatur 59 2 1,781 21 3 4 10 536 17
Edwards 490 15 1,742 25 5 4 13 511 16
Ellis 676 3 12,157 31 5 4 9 3,708 14
Gove 37 1 1,394 20 3 9 8 323 12
Graham 22 1 1,532 21 3 5 13 503 19
Hodgeman 81 4 970 21 4 4 10 296 14
Jewell 23 1 2,050 18 4 5 8 604 19
Lane 41 2 987 19 4 6 9 235 13
Lincoln 66 2 1,843 20 4 4 12 508 15
Logan 56 2 1,391 26 3 6 7 480 18
Mitchell 63 1 3,269 24 5 6 9 954 15
Norton 140 3 2,630 25 5 4 7 832 15
Osborne 17 0 2,347 22 5 5 9 720 18
Pawnee 315 5 3,048 29 3 4 11 2,228 33
Phillips 47 1 3,022 20 4 4 10 1,001 19
Rawlins 33 1 1,526 20 5 7 12 487 19
Rooks 68 1 2,722 24 5 5 10 1,277 24
Rush 53 2 1,911 21 4 5 11 664 20
Russell 82 1 3,697 25 4 3 9 1,618 24
Scott 400 9 2,230 22 4 3 11 639 14
Sheridan 51 2 1,269 21 4 7 7 275 11
Sherman 508 8 3,143 23 3 3 8 1,104 18
Smith 43 1 2,273 19 4 6 10 660 16
Thomas 172 2 3,500 25 4 3 7 1,236 17
Trego 32 1 1,699 23 4 3 10 463 16
Wallace 98 6 772 17 2 8 8 145 9

13
HaysZonalAnalysis
LackofAttractionsbyZone

14
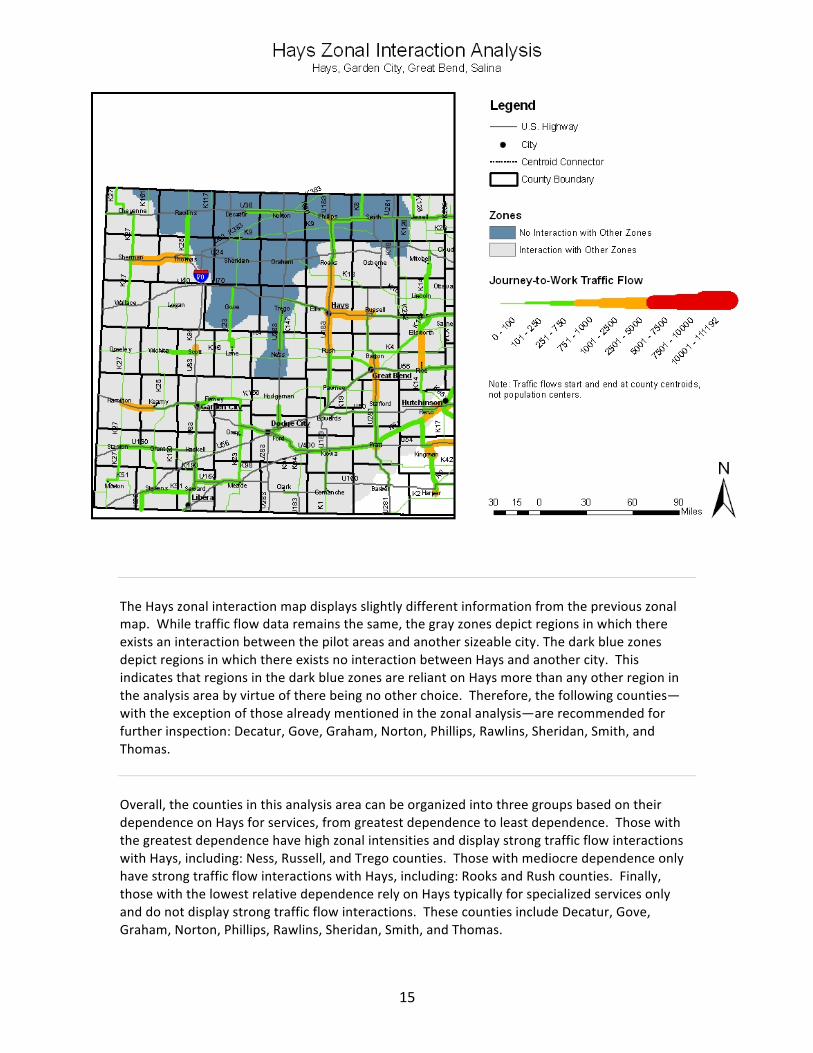
TheHayszonalmapdisplaystwolevelsofdata:tripattractiondatacodedintozonalintensities(theblueshadedpolygons)andJourney‐to‐Worktrafficflowsthatstandapartfromthetripattractiondata.Therefore,thetwolevelsofdatashouldbereadseparately.Areasofgreaterzonalintensities(darkblueareas)depictregionsinwhichresidentswillbemoreinclinedtoobtainservicesfromthepilotcitysincethecitycontainsthemajorityofservicesoftensought.Areasoflowerzonalintensities(lightblueareas)depictregionsinwhichresidentswillbeinclinedtoobtainsomeservices,butnotall.Giventheoption,residentsintheseregionsmaydecidetoobtainsomeserviceselsewhereduetocloserproximitytothoselocations.Often,servicesrequiredfromthepilotcityintheselightbluezonesarespecializedservices(i.e.,cardiaccenters,educationalinstitutions,orsocialservicescenters)asopposedtodailyservices(i.e.,pharmacies,stores,etc.).ForHays,thefollowingcountieshavethemajorityofeachcountyareafallingintothehighestzonalintensity:Ellis,Ness,Russell,andTrego.Additionally,trafficflowsindicaterelativelystronginteractionbetweenEllisCountyandRooks,Rush,andRussellcounties.Sincesomeofthesecountiesexhibitstrongtrafficflowsdespitetheirrelativelylowzonalintensities,furtherinvestigationofRooksandRushcountiesisrecommended.
15
TheHayszonalinteractionmapdisplaysslightlydifferentinformationfromthepreviouszonalmap.Whiletrafficflowdataremainsthesame,thegrayzonesdepictregionsinwhichthereexistsaninteractionbetweenthepilotareasandanothersizeablecity.ThedarkbluezonesdepictregionsinwhichthereexistsnointeractionbetweenHaysandanothercity.ThisindicatesthatregionsinthedarkbluezonesarereliantonHaysmorethananyotherregionintheanalysisareabyvirtueoftherebeingnootherchoice.Therefore,thefollowingcounties—withtheexceptionofthosealreadymentionedinthezonalanalysis—arerecommendedforfurtherinspection:Decatur,Gove,Graham,Norton,Phillips,Rawlins,Sheridan,Smith,andThomas.Overall,thecountiesinthisanalysisareacanbeorganizedintothreegroupsbasedontheirdependenceonHaysforservices,fromgreatestdependencetoleastdependence.ThosewiththegreatestdependencehavehighzonalintensitiesanddisplaystrongtrafficflowinteractionswithHays,including:Ness,Russell,andTregocounties.ThosewithmediocredependenceonlyhavestrongtrafficflowinteractionswithHays,including:RooksandRushcounties.Finally,thosewiththelowestrelativedependencerelyonHaystypicallyforspecializedservicesonlyanddonotdisplaystrongtrafficflowinteractions.ThesecountiesincludeDecatur,Gove,Graham,Norton,Phillips,Rawlins,Sheridan,Smith,andThomas.

16
HutchinsonZonalAnalysis
ThefollowingtwopagesdescribeHutchinson’sdemographiccharacteristicsaswellastabulatethetripattractionsthatmakethepilotcityacenterofactivitytothosecountiesthatlacksuchattractions.The“LackofAttractions”tableorganizescountiesbytheirzonalintensity,ascanbeviewedonthemapthatfollows.An“X”indicatesalackofattractionforthatcounty,therebymakingthatcountyreliantonHutchinsonforthatparticularservice.
PopulationCharacteristics
COUNTY 2007 Pop Pop %Pop Housing %Poverty %Unemp. Pop %Pop
Pop Den 65+ 65+Renter
Occupied Minority Minority
Barber 4,893 4 1,050 21 516 9 2 148 3
Comanche 1,937 2 483 25 231 9 0 42 2
Ellsworth 6,313 9 1,257 20 489 5 4 417 7
Kingman 7,999 9 1,622 20 687 9 2 237 3
Kiowa 2,900 4 638 22 345 8 3 115 4
McPherson 29,600 33 5,044 17 2,898 5 4 1,143 4
Pratt 9,516 13 1,742 18 1,052 8 5 561 6
Reno 63,371 51 10,603 17 7,248 9 4 5,688 9
Rice 10,411 14 1,862 18 919 10 6 631 6
Saline 53,989 75 7,705 14 6,573 6 3 6,760 13
Stafford 4,413 6 901 20 413 10 3 275 6
COUNTY Pop %Pop Total%
Households %Households%
Workforce%
Workforce Pop>16%Pop>
16
Hispanic Hispanic Householdswith1Vehicle
withNoVehicle
Walk‐to‐Work Carpool Disabled Disabled
Barber 104 2 2,716 25 3 5 10 979 20
Comanche 40 2 1,099 23 4 6 8 228 12
Ellsworth 249 4 3,238 21 4 4 14 1,039 16
Kingman 145 2 3,812 22 3 3 14 1,431 18
Kiowa 97 3 1,599 22 5 8 9 575 20
McPherson 701 2 12,199 26 5 5 8 1,791 6
Pratt 470 5 4,706 28 5 3 11 1,391 15
Reno 4,057 6 27,626 28 6 2 10 12,305 19
Rice 755 7 4,563 23 5 6 11 1,968 19
Saline 4,214 8 23,223 29 5 1 9 9,555 18
Stafford 336 8 2,408 25 5 6 12 821 19

17
HutchinsonZonalAnalysis
LackofAttractionsbyZone

18
TheHutchinsonzonalmapdisplaystwolevelsofdata:tripattractiondatacodedintozonalintensities(theblueshadedpolygons)andJourney‐to‐Worktrafficflowsthatstandapartfromthetripattractiondata.Therefore,thetwolevelsofdatashouldbereadseparately.Areasofgreaterzonalintensities(darkblueareas)depictregionsinwhichresidentswillbemoreinclinedtoobtainservicesfromthepilotcitysincethecitycontainsthemajorityofservicesoftensought.Areasoflowerzonalintensities(lightblueareas)depictregionsinwhichresidentswillbeinclinedtoobtainsomeservices,butnotall.Giventheoption,residentsintheseregionsmaydecidetoobtainsomeserviceselsewhereduetocloserproximitytothoselocations.Often,servicesrequiredfromthepilotcityintheselightbluezonesarespecializedservices(i.e.,cardiaccenters,educationalinstitutions,orsocialservicescenters)asopposedtodailyservices(i.e.,pharmacies,stores,etc.).ForHutchinson,onlyRiceCountyhasthemajorityofitsrespectiveareafallingintothehighestzonalintensityasidefromRenoCountyitself.Additionally,trafficflowsindicaterelativelystronginteractionbetweenRiceandEllsworthcounties.SinceEllsworthCountyexhibitsstrongtrafficflowsdespiteitsrelativelylowzonalintensity,furtherinvestigationofEllsworthCountyisrecommended.

19
TheHutchinsonzonalinteractionmapdisplaysslightlydifferentinformationfromthepreviouszonalmap.Whiletrafficflowdataremainsthesame,thegrayzonesdepictregionsinwhichthereexistsaninteractionbetweenthepilotareasandanothersizeablecity.Thedarkbluezones(missing)depictregionsinwhichthereexistsnointeractionbetweenHutchinsonandanothersizeablecity.ThisindicatesthatregionsinthedarkbluezonesarereliantonHutchinsonmorethananyotherregionintheanalysisareabyvirtueoftherebeingnootherchoice.Fromthismap,wecanconcludethatthereisinteractionbetweenHutchinsonandothercitiesthroughoutthefullextentoftheanalysisarea.
Overall,thecountiesinthisanalysisareacanbeorganizedintotwogroupsbasedontheirdependenceonHutchinsonforservices,fromgreatestdependencetoleastdependence.ThosewiththegreatestdependencehavehighzonalintensitiesanddisplaystrongtrafficflowinteractionswithHutchinson—thisincludesRiceCounty.ThosewiththelowestrelativedependencerelyonHutchinsontypicallyforspecializedservicesonlyanddonotdisplaystrongtrafficflowinteractions.InHutchinson’scase,thereisnocountythatreliesonthisanalysisareaalone.EvencountiestowardthesouthwesthavesignificantinteractionwithWichitaandLiberalforservices.Therefore,itcanbeconcludedthattheonlycountywithsignificantdependenceonHutchinsonisRiceCounty.

20
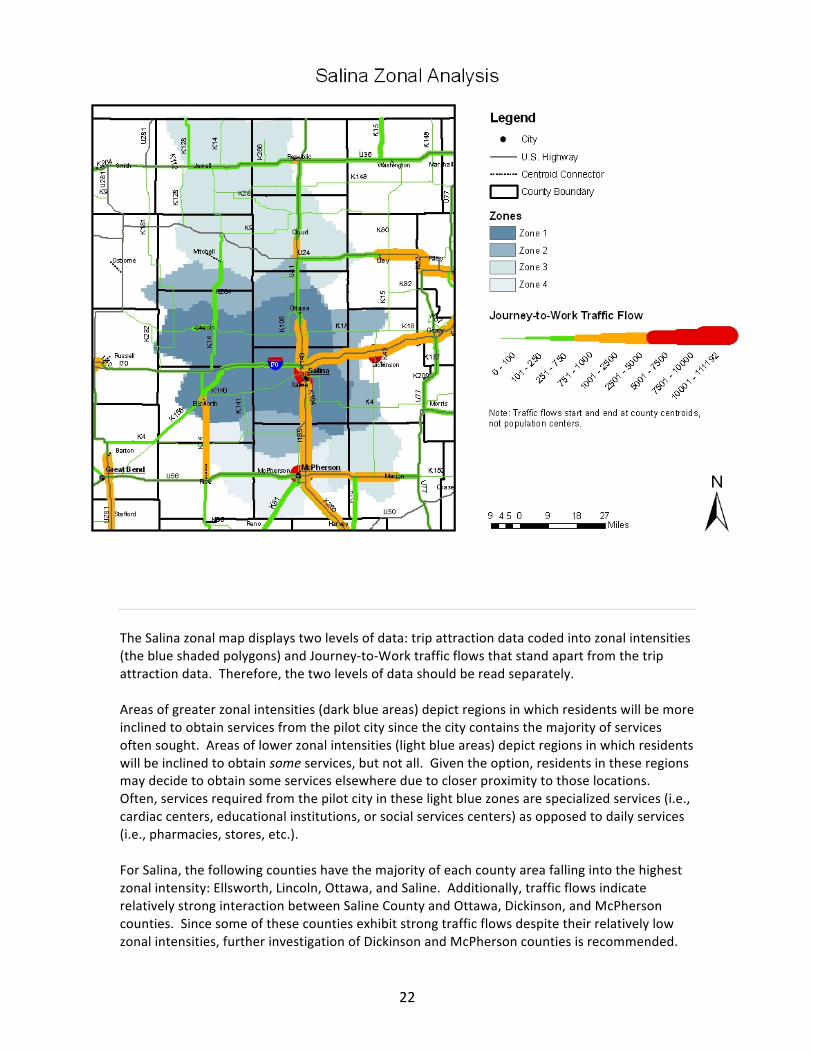
SalinaZonalAnalysis
ThefollowingtwopagesdescribeSalina’sdemographiccharacteristicsaswellastabulatethetripattractionsthatmakethepilotcityacenterofactivitytothosecountiesthatlacksuchattractions.The“LackofAttractions”tableorganizescountiesbytheirzonalintensity,ascanbeviewedonthemapthatfollows.An“X”indicatesalackofattractionforthatcounty,therebymakingthatcountyreliantonSalinaforthatparticularservice.
PopulationCharacteristics
COUNTY 2007 Pop Pop %Pop Housing %Poverty %Unemp. Pop %Pop
Pop Den 65+ 65+Renter
Occupied Minority Minority
Cloud 9,680 14 2,181 23 1,004 6 4 208 2
Ellsworth 6,313 9 1,257 20 489 5 4 417 7
Jewell 3,260 4 870 27 306 10 2 41 1
Lincoln 3,370 5 728 22 315 9 2 70 2
McPherson 29,600 33 5,044 17 2,898 5 4 1,143 4
Mitchell 6,277 9 1,350 22 660 8 4 173 3
Ottawa 6,098 8 1,046 17 429 6 4 188 3
Republic 5,026 7 1,368 27 465 7 3 92 2
Saline 53,989 75 7,705 14 6,573 6 3 6,760 13
COUNTY Pop %Pop Total%
Households %Households%
Workforce%
Workforce Pop>16%Pop>
16
Hispanic Hispanic Householdswith1Vehicle
withNoVehicle
Walk‐to‐Work Carpool Disabled Disabled
Cloud 104 1 4,763 26 4 4 10 1,588 16
Ellsworth 249 4 3,238 21 4 4 14 1,039 16
Jewell 23 1 2,050 18 4 5 8 604 19
Lincoln 66 2 1,843 20 4 4 12 508 15
McPherson 701 2 12,199 26 5 5 8 1,791 6
Mitchell 63 1 3,269 24 5 6 9 954 15
Ottawa 130 2 2,781 18 4 3 11 875 14
Republic 60 1 3,004 22 3 2 7 938 19
Saline 4,214 8 23,223 29 5 1 9 9,555 18

21
SalinaZonalAnalysis
LackofAttractionsbyZone
22
TheSalinazonalmapdisplaystwolevelsofdata:tripattractiondatacodedintozonalintensities(theblueshadedpolygons)andJourney‐to‐Worktrafficflowsthatstandapartfromthetripattractiondata.Therefore,thetwolevelsofdatashouldbereadseparately.Areasofgreaterzonalintensities(darkblueareas)depictregionsinwhichresidentswillbemoreinclinedtoobtainservicesfromthepilotcitysincethecitycontainsthemajorityofservicesoftensought.Areasoflowerzonalintensities(lightblueareas)depictregionsinwhichresidentswillbeinclinedtoobtainsomeservices,butnotall.Giventheoption,residentsintheseregionsmaydecidetoobtainsomeserviceselsewhereduetocloserproximitytothoselocations.Often,servicesrequiredfromthepilotcityintheselightbluezonesarespecializedservices(i.e.,cardiaccenters,educationalinstitutions,orsocialservicescenters)asopposedtodailyservices(i.e.,pharmacies,stores,etc.).ForSalina,thefollowingcountieshavethemajorityofeachcountyareafallingintothehighestzonalintensity:Ellsworth,Lincoln,Ottawa,andSaline.Additionally,trafficflowsindicaterelativelystronginteractionbetweenSalineCountyandOttawa,Dickinson,andMcPhersoncounties.Sincesomeofthesecountiesexhibitstrongtrafficflowsdespitetheirrelativelylowzonalintensities,furtherinvestigationofDickinsonandMcPhersoncountiesisrecommended.

23
TheSalinazonalinteractionmapdisplaysslightlydifferentinformationfromthepreviouszonalmap.Whiletrafficflowdataremainsthesame,thegrayzonesdepictregionsinwhichthereexistsaninteractionbetweenthepilotareasandanothersizeablecity.ThedarkbluezonesdepictregionsinwhichthereexistsnointeractionbetweenSalinaandanothercity.ThisindicatesthatregionsinthedarkbluezonesarereliantonSalinamorethananyotherregionintheanalysisareabyvirtueoftherebeingnootherchoice.Therefore,thefollowingcounties—withtheexceptionofthosealreadymentionedinthezonalanalysis—arerecommendedforfurtherinspection:Cloud,Jewell,Mitchell,andRepublic.Overall,thecountiesinthisanalysisareacanbeorganizedintothreegroupsbasedontheirdependenceonSalinaforservices,fromgreatestdependencetoleastdependence.ThosewiththegreatestdependencehavehighzonalintensitiesanddisplaystrongtrafficflowinteractionswithSalina,including:Ellsworth,Lincoln,andOttawacounties.ThosewithmediocredependenceonlyhavestrongtrafficflowinteractionswithSalina,including:DickinsonandMcPhersoncounties.Finally,thosewiththelowestrelativedependencerelyonSalinatypicallyforspecializedservicesonlyanddonotdisplaystrongtrafficflowinteractions.ThesecountiesincludeCloud,Jewell,Mitchell,andRepublic.

24
DodgeCityZonalAnalysis
ThefollowingtwopagesdescribeDodgeCity’sdemographiccharacteristicsaswellastabulatethetripattractionsthatmakethepilotcityacenterofactivitytothosecountiesthatlacksuchattractions.The“LackofAttractions”tableorganizescountiesbytheirzonalintensity,ascanbeviewedonthemapthatfollows.An“X”indicatesalackofattractionforthatcounty,therebymakingthatcountyreliantonDodgeCityforthatparticularservice.
PopulationCharacteristics
COUNTY 2007 Pop Pop %Pop Housing %Poverty %Unemp. Pop %Pop
Po Den 65+ 65+Renter
Occupied Minority Minority
Clark 2,240 2 511 23 212 11 3 121 5
Comanche 1,937 2 483 25 231 9 0 42 2
Ford 34,237 31 3,458 10 3,927 10 5 10,283 30
Gray 5,790 7 738 13 547 6 3 561 10
Hodgeman 2,100 2 392 19 176 10 1 65 3
Kiowa 2,900 4 638 22 345 8 3 115 4
Ness 2,898 3 792 27 311 7 2 71 2
COUNTY Pop %Pop Total%
Households%
Households%
Workforce%
Workforce Pop>16%Pop>
16
Hispanic Hispanic Householdswith1Vehicle
withNoVehicle
Walk‐to‐Work Carpool Disabled Disabled
Clark 124 6 1,113 26 3 6 11 318 14
Comanche 40 2 1,099 23 4 6 8 228 12
Ford 16,450 48 12,046 30 6 2 18 5,970 17
Gray 775 13 2,225 26 2 4 11 724 13
Hodgeman 81 4 970 21 4 4 10 296 14
Kiowa 97 3 1,599 22 5 8 9 575 20
Ness 86 3 1,767 21 2 8 12 478 16

25
DodgeCityZonalAnalysis
LackofAttractionsbyZone

26
TheDodgeCityzonalmapdisplaystwolevelsofdata:tripattractiondatacodedintozonalintensities(theblueshadedpolygons)andJourney‐to‐Worktrafficflowsthatstandapartfromthetripattractiondata.Therefore,thetwolevelsofdatashouldbereadseparately.Areasofgreaterzonalintensities(darkblueareas)depictregionsinwhichresidentswillbemoreinclinedtoobtainservicesfromthepilotcitysincethecitycontainsthemajorityofservicesoftensought.Areasoflowerzonalintensities(lightblueareas)depictregionsinwhichresidentswillbeinclinedtoobtainsomeservices,butnotall.Giventheoption,residentsintheseregionsmaydecidetoobtainsomeserviceselsewhereduetocloserproximitytothoselocations.Often,servicesrequiredfromthepilotcityintheselightbluezonesarespecializedservices(i.e.,cardiaccenters,educationalinstitutions,orsocialservicescenters)asopposedtodailyservices(i.e.,pharmacies,stores,etc.).ForDodgeCity,onlyGrayCountyhasthemajorityofitsrespectiveareafallingintothehighestzonalintensityasidefromFordCountyitself.Additionally,itappearsthatthereismoretrafficflowbetweenGrayandFordcountiesthanbetweenGrayandFinneycounties,indicatingapossibleinteractionwiththeGardenCitypilotarea.

27
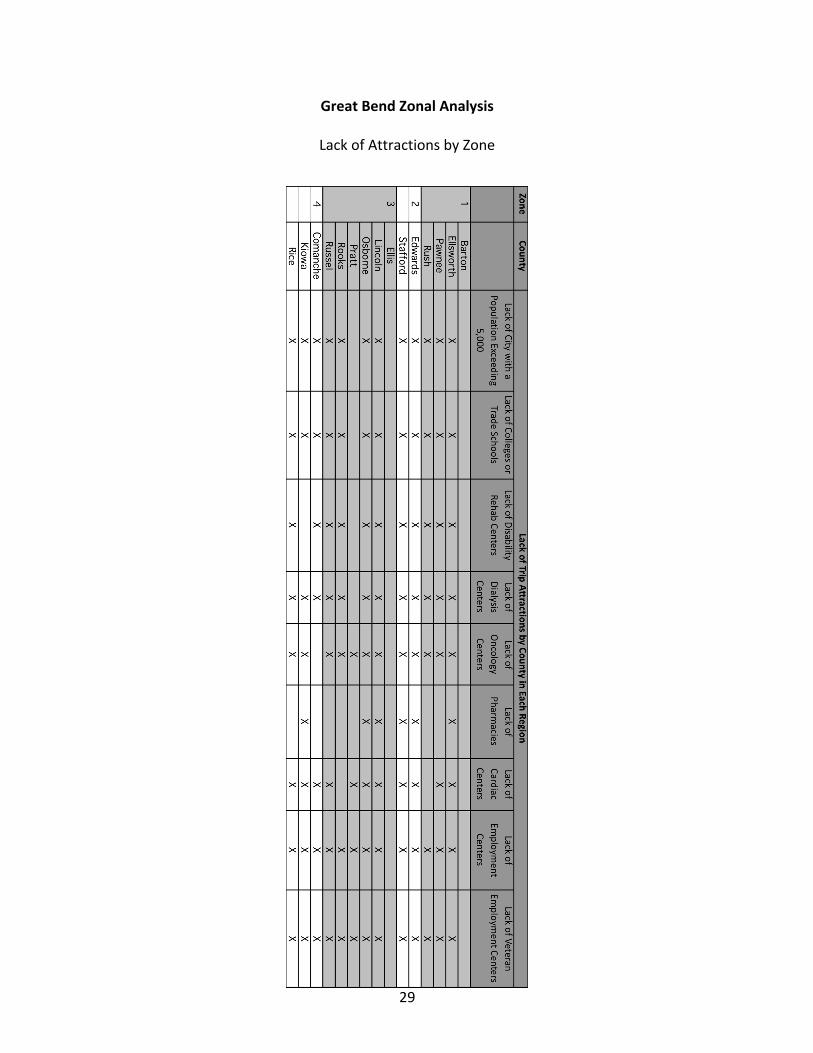
GreatBendZonalAnalysis
ThefollowingtwopagesdescribeGreatBend’sdemographiccharacteristicsaswellastabulatethetripattractionsthatmakethepilotcityacenterofactivitytothosecountiesthatlacksuchattractions.The“LackofAttractions”tableorganizescountiesbytheirzonalintensity,ascanbeviewedonthemapthatfollows.An“X”indicatesalackofattractionforthatcounty,therebymakingthatcountyreliantonGreatBendforthatparticularservice.
PopulationCharacteristics
COUNTY 2007 Pop Pop %Pop Housing %Poverty %Unemp. Pop %Pop
Pop Den 65+ 65+Renter
Occupied Minority Minority
Barton 28,141 31 5,007 18 3,195 11 5 2,536 9
Comanche 1,937 2 483 25 231 9 0 42 2
Edwards 3,270 5 660 20 308 8 3 363 11
Ellis 26,494 29 3,792 14 4,006 7 4 1,308 5
Ellsworth 6,313 9 1,257 20 489 5 4 417 7
Kiowa 2,900 4 638 22 345 8 3 115 4
Lincoln 3,370 5 728 22 315 9 2 70 2
Osborne 3,957 4 1,012 26 369 7 4 63 2
Pawnee 6,664 9 1,209 18 640 7 13 633 9
Pratt 9,516 13 1,742 18 1,052 8 5 561 6
Rice 10,411 14 1,862 18 919 10 6 631 6
Rooks 5,289 6 1,138 22 513 7 4 157 3
Rush 3,367 5 811 24 265 7 3 65 2
Russell 6,724 8 1,605 24 724 9 4 174 3
Stafford 4,413 6 901 20 413 10 3 275 6

28
GreatBendZonalAnalysis
PopulationCharacteristics(continued)
COUNTY Pop %Pop Total%
Households %Households%
Workforce%
Workforce Pop>16%Pop>
16
Hispanic Hispanic Householdswith1Vehicle
withNoVehicle
Walk‐to‐Work Carpool Disabled Disabled
Barton 3,076 11 12,988 29 5 2 9 4,065 14
Comanche 40 2 1,099 23 4 6 8 228 12
Edwards 490 15 1,742 25 5 4 13 511 16
Ellis 676 3 12,157 31 5 4 9 3,708 14
Ellsworth 249 4 3,238 21 4 4 14 1,039 16
Kiowa 97 3 1,599 22 5 8 9 575 20
Lincoln 66 2 1,843 20 4 4 12 508 15
Osborne 17 0 2,347 22 5 5 9 720 18
Pawnee 315 5 3,048 29 3 4 11 2,228 33
Pratt 470 5 4,706 28 5 3 11 1,391 15
Rice 755 7 4,563 23 5 6 11 1,968 19
Rooks 68 1 2,722 24 5 5 10 1,277 24
Rush 53 2 1,911 21 4 5 11 664 20
Russell 82 1 3,697 25 4 3 9 1,618 24
Stafford 336 8 2,408 25 5 6 12 821 19
29
GreatBendZonalAnalysis
LackofAttractionsbyZone

30
TheGreatBendzonalmapdisplaystwolevelsofdata:tripattractiondatacodedintozonalintensities(theblueshadedpolygons)andJourney‐to‐Worktrafficflowsthatstandapartfromthetripattractiondata.Therefore,thetwolevelsofdatashouldbereadseparately.Areasofgreaterzonalintensities(darkblueareas)depictregionsinwhichresidentswillbemoreinclinedtoobtainservicesfromthepilotcitysincethecitycontainsthemajorityofservicesoftensought.Areasoflowerzonalintensities(lightblueareas)depictregionsinwhichresidentswillbeinclinedtoobtainsomeservices,butnotall.Giventheoption,residentsintheseregionsmaydecidetoobtainsomeserviceselsewhereduetocloserproximitytothoselocations.Often,servicesrequiredfromthepilotcityintheselightbluezonesarespecializedservices(i.e.,cardiaccenters,educationalinstitutions,orsocialservicescenters)asopposedtodailyservices(i.e.,pharmacies,stores,etc.).ForGreatBend,thefollowingcountieshavethemajorityofeachcountyareafallingintothehighestzonalintensity:Barton,Pawnee,andRush.DuetoRushCountyandEllsworthCounty’srelativelystrongtrafficflowstoEllisandSalinecounties,respectively,interactionwiththeHaysandSalinapilotareasisapparentandshouldbeinvestigatedfurther.

31
LiberalZonalAnalysis
ThefollowingtwopagesdescribeLiberal’sdemographiccharacteristicsaswellastabulatethetripattractionsthatmakethepilotcityacenterofactivitytothosecountiesthatlacksuchattractions.The“LackofAttractions”tableorganizescountiesbytheirzonalintensity,ascanbeviewedonthemapthatfollows.An“X”indicatesalackofattractionforthatcounty,therebymakingthatcountyreliantonLiberalforthatparticularservice.
PopulationCharacteristics
COUNTY 2007 Pop Pop %Pop Housing %Poverty %Unemp. Pop %Pop
Pop Den 65+ 65+Renter
Occupied Minority Minority
Clark 2,240 2 511 23 212 11 3 121 5
Comanche 1,937 2 483 25 231 9 0 42 2
Finney 38,728 30 3,116 8 4,325 11 5 11,479 30
Ford 34,237 31 3,458 10 3,927 10 5 10,283 30
Grant 7,394 13 773 10 655 8 5 1,851 25
Gray 5,790 7 738 13 547 6 3 561 10
Greeley 1,290 2 245 19 133 9 2 93 7
Hamilton 2,566 3 454 18 298 11 2 607 24
Haskell 4,217 7 470 11 394 9 3 726 17
Kearny 4,506 5 516 11 407 9 3 945 21
Meade 4,627 5 785 17 434 7 3 492 11
Norton 5,576 6 1,045 19 468 7 4 408 7
Seward 23,410 37 2,072 9 2,678 14 5 9,189 39
Stanton 2,154 3 317 15 247 12 3 422 20
Stevens 5,410 7 702 13 473 8 4 1,087 20Wichita 2,236 3 369 17 226 11 3 355 16

32
LiberalZonalAnalysis
PopulationCharacteristics(continued)
COUNTY Pop %Pop Total%
Households %Households%
Workforce%
Workforce Pop>16%Pop>
16
Hispanic Hispanic Householdswith1Vehicle
withNoVehicle
Walk‐to‐Work Carpool Disabled Disabled
Clark 124 6 1,113 26 3 6 11 318 14
Comanche 40 2 1,099 23 4 6 8 228 12
Finney 16,139 42 13,662 30 5 2 19 7,344 19
Ford 16,450 48 12,046 30 6 2 18 5,970 17
Grant 2,833 38 3,025 28 4 1 15 1,111 15
Gray 775 13 2,225 26 2 4 11 724 13Greeley 157 12 688 22 2 8 13 285 22
Hamilton 708 28 1,207 27 4 5 15 596 23
Haskell 1,175 28 1,642 26 4 5 11 622 15
Kearny 1,267 28 1,689 24 3 3 13 674 15
Meade 635 14 1,974 26 3 3 12 599 13
Norton 140 3 2,630 25 5 4 7 832 15
Seward 12,185 52 8,121 35 6 1 21 3,993 17
Stanton 666 31 989 24 3 6 18 320 15
Stevens 1,420 26 2,279 27 3 3 10 754 14
Wichita 479 21 1,096 23 2 3 10 445 20

33
LiberalZonalAnalysis
LackofAttractionsbyZone

34
TheLiberalzonalmapdisplaystwolevelsofdata:tripattractiondatacodedintozonalintensities(theblueshadedpolygons)andJourney‐to‐Worktrafficflowsthatstandapartfromthetripattractiondata.Therefore,thetwolevelsofdatashouldbereadseparately.Areasofgreaterzonalintensities(darkblueareas)depictregionsinwhichresidentswillbemoreinclinedtoobtainservicesfromthepilotcitysincethecitycontainsthemajorityofservicesoftensought.Areasoflowerzonalintensities(lightblueareas)depictregionsinwhichresidentswillbeinclinedtoobtainsomeservices,butnotall.Giventheoption,residentsintheseregionsmaydecidetoobtainsomeserviceselsewhereduetocloserproximitytothoselocations.Often,servicesrequiredfromthepilotcityintheselightbluezonesarespecializedservices(i.e.,cardiaccenters,educationalinstitutions,orsocialservicescenters)asopposedtodailyservices(i.e.,pharmacies,stores,etc.).ForLiberal,thefollowingcountieshavethemajorityofeachcountyareafallingintothehighestzonalintensity:Meade,Seward,andStevens.Additionally,thereappearstobeasimilarlystrongtrafficflowbetweenSewardandHaskellcounties,asthereexistsbetweenHaskellandFinneycounties.ThisindicatesaclearinteractionwiththeGardenCitypilotarea,anissueworthfurtherinvestigation.

35
McPhersonZonalAnalysis
ThefollowingtwopagesdescribeMcPherson’sdemographiccharacteristicsaswellastabulatethetripattractionsthatmakethepilotcityacenterofactivitytothosecountiesthatlacksuchattractions.The“LackofAttractions”tableorganizescountiesbytheirzonalintensity,ascanbeviewedonthemapthatfollows.An“X”indicatesalackofattractionforthatcounty,therebymakingthatcountyreliantonMcPhersonforthatparticularservice.
PopulationCharacteristics
COUNTY 2007 Pop Pop %Pop Housing %Poverty %Unemp. Pop %Pop
Pop Den 65+ 65+Renter
Occupied Minority Minority
McPherson 29,600 33 5,044 17 2,898 5 4 1,143 4
COUNTY Pop %Pop Total%
Households %Households%
Workforce%
Workforce Pop>16%Pop>
16
Hispanic Hispanic Householdswith1Vehicle
withNoVehicle
Walk‐to‐Work Carpool Disabled Disabled
McPherson 701 2 12,199 26 5 5 8 1,791 6

36
McPhersonZonalAnalysis
LackofAttractionsbyZone
Zone County LackofTripAttractionsbyCountyinEachRegion
LackofCitywithaPopulationExceeding
5,000
LackofDisabilityRehabCenters
LackofPharmacies
LackofCardiacCenters
LackofEmployment
Centers
1 McPherson 2 (none) 3 (none) 4 (none)

37
TheMcPhersonzonalmapdisplaystwolevelsofdata:tripattractiondatacodedintozonalintensities(theblueshadedpolygons)andJourney‐to‐Worktrafficflowsthatstandapartfromthetripattractiondata.Therefore,thetwolevelsofdatashouldbereadseparately.Areasofgreaterzonalintensities(darkblueareas)depictregionsinwhichresidentswillbemoreinclinedtoobtainservicesfromthepilotcitysincethecitycontainsthemajorityofservicesoftensought.Areasoflowerzonalintensities(lightblueareas)depictregionsinwhichresidentswillbeinclinedtoobtainsomeservices,butnotall.Giventheoption,residentsintheseregionsmaydecidetoobtainsomeserviceselsewhereduetocloserproximitytothoselocations.Often,servicesrequiredfromthepilotcityintheselightbluezonesarespecializedservices(i.e.,cardiaccenters,educationalinstitutions,orsocialservicescenters)asopposedtodailyservices(i.e.,pharmacies,stores,etc.).ForMcPherson,onlyMcPhersonCountyitselfhasthemajorityofitsrespectiveareafallingintothehighestzonalintensity.However,relativelystrongtrafficflowswithSalineCountyindicateaninteractionwiththeSalinapilotarea,anissueworthfurtherinvestigation.

38
WichitaZonalAnalysis
ThefollowingtwopagesdescribeWichita’sdemographiccharacteristicsaswellastabulatethetripattractionsthatmakethepilotcityacenterofactivitytothosecountiesthatlacksuchattractions.The“LackofAttractions”tableorganizescountiesbytheirzonalintensity,ascanbeviewedonthemapthatfollows.An“X”indicatesalackofattractionforthatcounty,therebymakingthatcountyreliantonWichitaforthatparticularservice.
PopulationCharacteristics
COUNTY 2007 Pop Pop %Pop Housing %Poverty %Unemp. Pop %Pop
Pop Den 65+ 65+Renter
Occupied Minority Minority
Barber 4,893 4 1,050 21 516 9 2 148 3
Butler 63,253 44 7,921 13 5,003 6 4 3,582 6
Cowley 34,927 31 5,387 15 3,916 10 8 4,007 11
Harper 5,949 7 1,369 23 650 9 4 206 3
Kingman 7,999 9 1,622 20 687 9 2 237 3
Reno 63,371 51 10,603 17 7,248 9 4 5,688 9
Sedgwick 469,551 470 53,366 11 59,586 7 5 106,303 23
Sumner 24,460 21 3,802 16 2,145 8 5 1,286 5
COUNTY Pop %Pop Total%
Households %Households%
Workforce%
Workforce Pop>16%Pop>
16
Hispanic Hispanic Householdswith1Vehicle
withNoVehicle
Walk‐to‐Work Carpool Disabled Disabled
Barber 104 2 2,716 25 3 5 10 979 20
Butler 1,717 3 25,203 23 3 2 10 9,902 16
Cowley 2,254 6 15,680 28 5 3 11 7,768 22
Harper 97 2 3,189 25 5 5 12 1,107 19
Kingman 145 2 3,812 22 3 3 14 1,431 18
Reno 4,057 6 27,626 28 6 2 10 12,305 19
Sedgwick 47,857 10 201,982 30 5 1 9 84,552 18
Sumner 871 4 10,884 23 3 3 11 4,973 20

39
WichitaZonalAnalysis
LackofAttractionsbyZone

40
TheWichitazonalmapdisplaystwolevelsofdata:tripattractiondatacodedintozonalintensities(theblueshadedpolygons)andJourney‐to‐Worktrafficflowsthatstandapartfromthetripattractiondata.Therefore,thetwolevelsofdatashouldbereadseparately.Areasofgreaterzonalintensities(darkblueareas)depictregionsinwhichresidentswillbemoreinclinedtoobtainservicesfromthepilotcitysincethecitycontainsthemajorityofservicesoftensought.Areasoflowerzonalintensities(lightblueareas)depictregionsinwhichresidentswillbeinclinedtoobtainsomeservices,butnotall.Giventheoption,residentsintheseregionsmaydecidetoobtainsomeserviceselsewhereduetocloserproximitytothoselocations.Often,servicesrequiredfromthepilotcityintheselightbluezonesarespecializedservices(i.e.,cardiaccenters,educationalinstitutions,orsocialservicescenters)asopposedtodailyservices(i.e.,pharmacies,stores,etc.).ForWichita,onlySedgwickCountyitselfhasamajorityofitsrespectiveareawithinthehighestzonalintensity.Additionally,trafficflowsindicateminorinteractionwithRenoCounty,indicatingthattheHutchinsonpilotareamaybesomewhatself‐contained.