MEMORANDUM FORT LEWIS AGREED ORDER RI ... samples below detection limit when measured by the XRF....
18
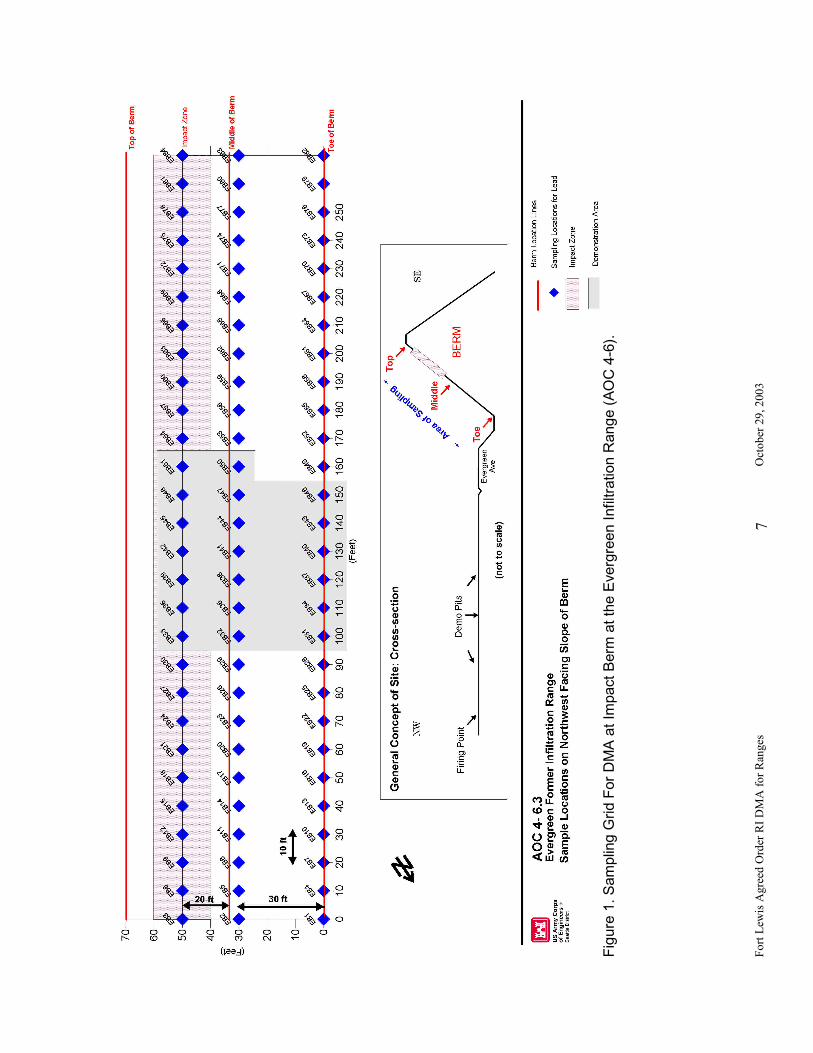
Fort Lewis Agreed Order RI DMA for Ranges October 29, 2003 1 MEMORANDUM FORT LEWIS AGREED ORDER RI DEMONSTRATION OF METHOD APPLICABILITY SAMPLING AND ANALYSIS PLAN ADDENDUM FORMER SMALL ARMS RANGES 1.0 INTRODUCTION This memorandum present the results of the Demonstration of Method Applicability conducted as part of the Fort Lewis Agreed Order Remedial Investigation Former Small Arms Ranges Sampling Plan Addendum. This memo has been updated with additional information, as requested by Ecology in the 25 September meeting. Sampling was conducted on the impact berm at the Evergreen former Infiltration Range and soil analyzed using both analytical laboratory and XRF methodologies, as presented below. Both sets of date were used to determine the correlation between the XRF and analytical laboratory results and appropriate XRF protocols for use in future rounds of sampling. A summary of the correlation, precision sample results and field duplicate comparison results are presented below. 2.0 SUMMARY OF FIELD ACTIVITIES As part of the first round of sampling for this project, soil samples were collected from 20 sample locations on three areas of the impact berm: the impact zone, below the impact zone and at the bottom of the berm. Figure 1 of Appendix A presents the sampling locations on the Evergreen impact berm. Two composite soil samples were collected at each location by compositing soils from similar depths from each of the holes. Sampling intervals were from 0 to 1 foot and from 1 foot to 2 feet at each sampling location. Fourteen samples were collected from the impact zone, 14 from below the impact zone, and 12 from the bottom of the berm. Each composite sample was sieved through a No. 10 sieve then placed into a gallon-sized plastic baggie and bag homogenized A cup aliquot was collected from each sample and measured by XRF and submitted to Severn Trent Laboratories (STL) for analysis of lead, arsenic, copper, antimony, zinc, tin, and iron using EPA Method 6010/6020. In addition, four co-located field duplicate locations were sampled and analyzed by XRF to determine field variability during the DMA. Three additional field duplicates were collected during the following site characterization sampling event. Sampling conditions encountered at the site included considerable tree growth at the bottom of the berm, loose upper layers of soil within the impact zone and the middle of the berm that sloughed continually, as well as numerous gravel from small pebbles to large cobbles, encountered from approximately 0.5 ft to 2 ft bgs.
Transcript of MEMORANDUM FORT LEWIS AGREED ORDER RI ... samples below detection limit when measured by the XRF....

Fort Lewis Agreed Order RI DMA for Ranges October 29, 2003 1
MEMORANDUM FORT LEWIS AGREED ORDER RI DEMONSTRATION OF METHOD APPLICABILITY SAMPLING AND ANALYSIS PLAN ADDENDUM FORMER SMALL ARMS RANGES 1.0 INTRODUCTION This memorandum present the results of the Demonstration of Method Applicability conducted as part of the Fort Lewis Agreed Order Remedial Investigation Former Small Arms Ranges Sampling Plan Addendum. This memo has been updated with additional information, as requested by Ecology in the 25 September meeting. Sampling was conducted on the impact berm at the Evergreen former Infiltration Range and soil analyzed using both analytical laboratory and XRF methodologies, as presented below. Both sets of date were used to determine the correlation between the XRF and analytical laboratory results and appropriate XRF protocols for use in future rounds of sampling. A summary of the correlation, precision sample results and field duplicate comparison results are presented below. 2.0 SUMMARY OF FIELD ACTIVITIES As part of the first round of sampling for this project, soil samples were collected from 20 sample locations on three areas of the impact berm: the impact zone, below the impact zone and at the bottom of the berm. Figure 1 of Appendix A presents the sampling locations on the Evergreen impact berm. Two composite soil samples were collected at each location by compositing soils from similar depths from each of the holes. Sampling intervals were from 0 to 1 foot and from 1 foot to 2 feet at each sampling location. Fourteen samples were collected from the impact zone, 14 from below the impact zone, and 12 from the bottom of the berm. Each composite sample was sieved through a No. 10 sieve then placed into a gallon-sized plastic baggie and bag homogenized A cup aliquot was collected from each sample and measured by XRF and submitted to Severn Trent Laboratories (STL) for analysis of lead, arsenic, copper, antimony, zinc, tin, and iron using EPA Method 6010/6020. In addition, four co-located field duplicate locations were sampled and analyzed by XRF to determine field variability during the DMA. Three additional field duplicates were collected during the following site characterization sampling event. Sampling conditions encountered at the site included considerable tree growth at the bottom of the berm, loose upper layers of soil within the impact zone and the middle of the berm that sloughed continually, as well as numerous gravel from small pebbles to large cobbles, encountered from approximately 0.5 ft to 2 ft bgs.

Fort Lewis Agreed Order RI DMA for Ranges October 29, 2003 2
3.0 EVALUATION OF LABORATORY vs. XRF DATA A summary of the XRF and laboratory results is presented below. There results were used to determine appropriate XRF methodologies for use in future sampling events for the former Small Arms Ranges RI project. 3.1 Comparison of XRF to Laboratory Results The sample results from both the XRF and laboratory analyses for each sample were compared to evaluate the correlation between the two methodologies. Table 1 of Appendix C presents the XRF and fixed lab cup analyses results for lead collected during the DMA. Figures 2 and 3 of Appendix B present the correlation of laboratory data to the entire lead data set and the 0 to 1000 mg/kg data sub-set. A summary of the correlations is presented below. 3.1.1 Correlations As shown on Figure 2, the correlation between XRF and laboratory analyses lead results was linear. The correlation coefficient (r2) factor for the entire sample set was 0.96. The average ratio of laboratory to XRF lead results was 1.3, with a 99th UCL of 1.6 for this ratio. The correlation for the data sub-set of 0 to 1000 mg/kg, presented in Figure 3, was also linear with an r2 value of 0.84 and an average ration of laboratory to XRF lead results of 1.07 with a 99th UCL of 1.6. 3.1.2 Correlations Near Detection Levels Per Ecology request, additional correlation samples were submitted for ICP analyses from samples below detection limit when measured by the XRF. This information was used to evaluate the accuracy of the XRF near the detection limit. A summary of the results is presented in Table 3, Appendix C. Only one sample submitted had fixed laboratory concentrations above the reporting limit. This information cannot be added to the correlation, since the XRF was all not detected. 3.2 Laboratory Results for Other Metals Review of the laboratory analysis of the sample aliquots for metals presented in Table 2 of Appendix C indicates that lead is the primary contaminate. Antimony and copper exceedances were detected only when lead was above 250 mg/kg. Arsenic, tin, and zinc had no exceedances. 3.3 Recommendations for Data Comparison Based on the uncertainty of XRF values near the action level, collaborative sampling was conducted on XRF equivalent concentrations near the action level to verify appropriate

Fort Lewis Agreed Order RI DMA for Ranges October 29, 2003 3
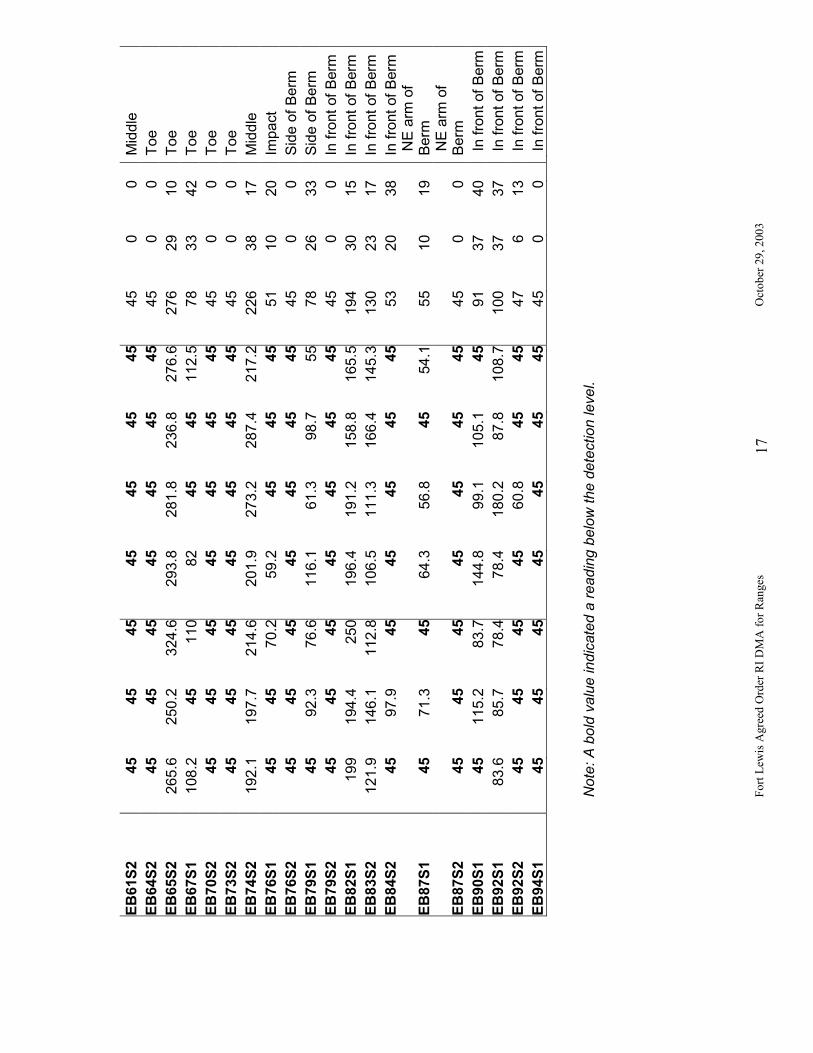
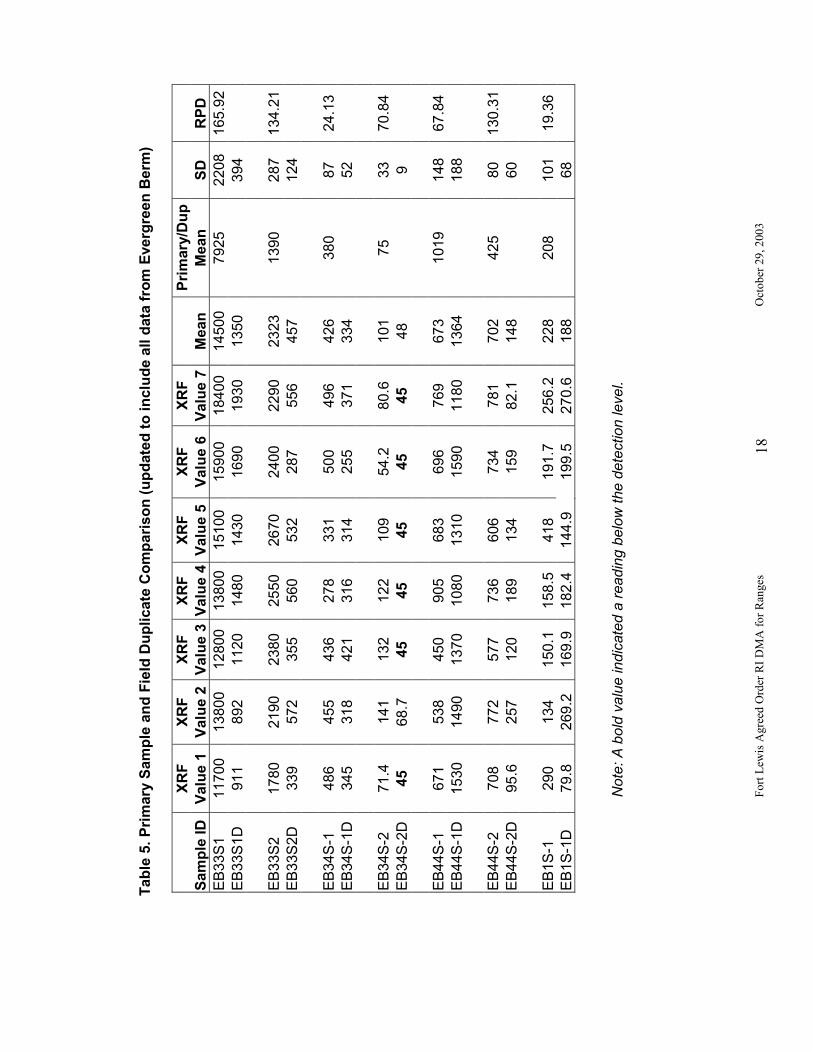
remedial actions are selected. Since the XRF and ICP measurements correlated with the exception of one sample, the XRF method detection level is deemed suitable for screening near the potential action level of 50 mg/kg. However, collaborative samples may be submitted for ICP analyses for XRF concentrations near detection limits depending on site conditions and potential remedial options. Based on the XRF and laboratory analytical data it is lead contamination will drive remedial actions for the Evergreen former infiltration range and the Miller Hill former pistol range. Therefore, it is recommended that collaborative analysis be limited for lead for theses ranges, as needed. As a different type of ammunition was used at the Skeet Range it is recommended that initial collaborative analysis include all metals (antimony, copper, iron, lead, tin, zinc and arsenic) until is it determined whether lead is the primary contaminate at this site. 4.0 XRF DATA Precision samples and co-located field duplicates were collected and XRF analyzed in order to determine within sample variability and field variability. Each precision sample was analyzed seven times by XRF. An RSD was determined for each precision sample. Four co-located field duplicates were chosen for comparison with the primary samples. An RPD was determined for the field duplicates and primary samples. 4.1 Precision Samples Results for the precision samples are presented in Table 4 in Appendix C (updated to include new data from Evergreen Range). Thirty eight percent of the RSD values are greater than 20% recommended in the SAP Addendum. Within sample variability may affect decision when sample results are near the action levels. 4.2 Co-located Field Duplicates Results of the field duplicated are presented in Table 5 in Appendix C (updated to include new data). Five out of seven RPD values exceed 50%. Within field variability may affect decision when sample results are near the action levels. 5.0 RECOMMENDATION FOR XRF SAMPLING STRATEGY REVISIONS Based on the review of the sampling data collected from the first round of sampling (September 2, 2003), the following modifications to protocols have been recommended for future sampling rounds. Additional modifications may be determined during subsequent rounds of sampling. To focus on reducing uncertainty near the action levels:

Fort Lewis Agreed Order RI DMA for Ranges October 29, 2003 4
1. Analyze precision samples when primary result is near the action levels relevant to decision making based on distribution data (below detection to 100 mg/kg; 200 to 300 mg/kg; and 900 to 1200 mg/kg). When focusing on potential remedial boundaries, if the precision sample average within matrix variability falls within the uncertainty region surrounding the action levels, then: 2. Collect and measure a XRF cup sample from the precision sample for comparison with the precision sample. If within matrix variability is appreciably different, evaluate the need for co-located field duplicate 2 feet from primary sample based on decision uncertainty. 3. Collect collaborative samples for fixed laboratory analysis on as needed basis focusing on XRF samples measured near the detection limit. 4. Evaluate options for collecting samples from the 2 to 3 foot depth interval at the site.
Fort Lewis Agreed Order RI DMA for Ranges October 29, 2003 5
APPENDIX A DMA SOIL SAMPLING
LOCATION MAP

For
t Lew
is A
gree
d O
rder
RI
DM
A f
or R
ange
s
Oct
ober
29,
200
3 7
F
igure
1.
Sam
plin
g G
rid
For
DM
A a
t Im
pact
Ber
m a
t th
e E
verg
reen
Inf
iltra
tion
Ran
ge
(AO
C 4
-6).

Fort Lewis Agreed Order RI DMA for Ranges October 29, 2003 8
APPENDIX B DMA SOIL SAMPLE
XRF CORRELATION FIGURES

For
t Lew
is A
gree
d O
rder
RI
DM
A f
or R
ange
s
Oct
ober
29,
200
3 9
XR
F a
nd
Fix
ed-L
ab D
ata
Co
rrel
atio
n a
t E
verg
reen
R2 =
0.9
671
0
5000
1000
0
1500
0
2000
0
2500
0
3000
0
3500
0
4000
0
4500
0
5000
0
010
000
2000
030
000
4000
050
000
6000
070
000
Fix
ed-L
ab IC
P V
alu
es (
mg
/kg
)
XRF Values (mg/kg)
F
igure
2. X
RF
Corr
ela
tion t
o F
ixed L
abora
tory
Analy
ses
(update
d t
o in
clude a
ll data
fro
m t
he
Eve
rgre
en B
erm
)

For
t Lew
is A
gree
d O
rder
RI
DM
A f
or R
ange
s
Oct
ober
29,
200
3 10
XR
F C
orr
ela
tio
n (
0 to
100
0 m
g/k
g)
y =
1.06
85x
R2 =
0.8
415
0
200
400
600
800
1000
1200
010
020
030
040
050
060
070
080
090
010
00
Fixe
d L
ab m
g/k
g
XRF mg/kg
F
igure
3. X
RF
Corr
ela
tion w
ithin
the 0
to 1
000
mg/k
g d
ata s
ubse
t

Fort Lewis Agreed Order RI DMA for Ranges October 29, 2003 11
APPENDIX C
DATA SUMMARY TABLES

Fort Lewis Agreed Order RI DMA for Ranges October 29, 2003 12
Table 1. DMA XRF Primary Samples and Collaborative Lab Analyses Data
Sample ID XRF
(mg/kg) Fixed-lab (mg/kg)
Depth
In Inches
Location on Berm
EB31S-1 613 622 0-12 Bottom EB31S-2 45 150 12-24 Bottom EB32S-1 11600 12300 0-12 Middle EB32S-2 2940 1750 12-24 Middle EB33S-1 18200 21600 0-12 Impact EB33S-2 3170 6770 12-24 Impact EB34S-1 492 335 0-12 Bottom EB34S-2 148 133 12-24 Bottom EB35S-1 2490 2610 0-12 Middle EB35S-2 630 2410 12-24 Middle EB36S-1 13300 21500 0-12 Impact EB36S-2 2180 2870 12-24 Impact EB37S-1 404 274 0-12 Bottom EB37S-2 45 23.4 12-24 Bottom EB38S-1 25400 31600 0-12 Middle EB38S-2 6590 7960 12-24 Middle EB39S-1 5830 6940 0-12 Impact EB39S-2 600 1130 12-24 Impact EB40S-1 918 746 0-12 Bottom EB40S-2 326 331 12-24 Bottom EB41S-1 2060 1870 0-12 Middle EB41S-2 738 768 12-24 Middle EB42S-1 31600 37100 0-12 Impact EB42S-2 5680 7290 12-24 Impact EB43S-1 762 639 0-12 Bottom EB43S-2 958 601 12-24 Bottom EB44S-1 1070 726 0-12 Middle EB44S-2 732 941 12-24 Middle EB45S-1 29300 33500 0-12 Impact EB45S-2 7420 13900 12-24 Impact EB46S-1 144 215 0-12 Bottom EB46S-2 62.2 61.5 12-24 Bottom EB47S-1 20500 24400 0-12 Middle EB47S-2 650 1250 12-24 Middle EB48S-1 41600 50800 0-12 Impact EB48S-2 19000 19400 12-24 Impact EB50S-1 838 1040 0-12 Middle EB50S-2 45 36.6 12-24 Middle EB51S-1 38400 62500 0-12 Impact EB51S-2 8380 15600 12-24 Impact Note: A bold value indicated a reading below the detection level.

Fort Lewis Agreed Order RI DMA for Ranges October 29, 2003 13
Table 2. Fixed Laboratory ICP Analyses Results for DMA
Parameter Antimony Copper Iron Lead Tin Zinc Arsenic
Method A/B 32 2960 na 250 48000 24000 20
EB31S1 8.85 U U 45.6 16400 622 8.85 U 33.1 6.35
EB31S2 9.16 U 24.8 16700 150 9.16 30 4.1
EB32S1 207 309 16000 12300 13.6 63.6 5
EB32S2 34.9 66.6 15800 1750 9.77 U 35.8 3.56
EB33S1 287 454 14800 21600 5.09 85.3 4.65
EB33S2 87.7 139 16700 6770 8.58 U 66.2 3.59
EB34S1 9.85 U 40.9 14000 335 9.85 U 32.4 4.24
EB34S2 10 U 30.2 17000 133 10 U 30.9 4.52
EB35S1 46.4 91.4 16000 2610 10.1 U 35.2 3.54
EB35S2 31.9 46.6 16700 2410 9.56 U 33.5 3.99
EB36S1 369 358 16500 21500 20.9 59.3 6.69
EB36S2 58.4 76 15400 2870 9.56 U 31.2 3.83
EB37S1 9.3 U 33.9 14300 274 9.3 U 26.6 3.83
EB37S2 9.29 U 21.2 16400 23.4 9.29 U 26.9 3.01
EB38S1 634 916 18000 31600 47.7 110 10.8
EB38S2 192 242 17800 7960 7.01 58.1 5.68
EB39S1 149 155 19500 6940 7.22 J 48.1 5.27
EB39S2 29.7 47.2 16300 1130 9.15 U 29.8 3.39
EB40S1 8.18 56.3 15700 746 9.85 U 31.7 4.92
EB40S2 9.28 U 44.7 17600 331 9.28 U 32 4.13
EB41S1 42.1 78.4 15500 1870 9.34 U 37.1 4.37
EB41S2 16.4 39.3 16900 768 10.2 U 31.3 3.87
EB42S1 673 1330 18600 37100 40.5 176 10.8
EB42S2 140 233 15400 7290 7.76 70.2 4.61
EB43S1 8.89 U 57.7 14700 639 8.89 U 31 4.8
EB43S2 10.2 U 48.1 14100 601 10.2 U 30.2 4.43
EB44S1 18.4 39.8 15900 726 9.41 U 34.2 3.99
EB44S2 21.8 51.8 16800 941 10.2 U 30.3 3.67
EB45S1 727 997 16800 33500 34.8 139 11.5
EB45S2 213 273 15400 13900 10 57.4 4.42
EB46S1 10.1 U 35.5 15400 215 10.1 U 28.2 4.46
EB46S2 9.98 U 28.5 16300 61.5 9.98 U 30.1 3.97
EB47S1 427 25100 17100 24400 15.8 2560 9.33
EB47S2 23.8 217 16300 1250 9.55 U 33.9 4.24

Fort Lewis Agreed Order RI DMA for Ranges October 29, 2003 14
Parameter Antimony Copper Iron Lead Tin Zinc Arsenic
Method A/B 32 2960 na 250 48000 24000 20
EB48S2 269 527 17500 19400 6.11 109 6.79
EB50S1 16.1 107 16100 1040 8.78 U 32.2 3.95
EB50S2 9.25 U 69.6 16700 36.6 ND 28 3.41
EB51S1 879 804 15100 62500 42.2 117 15.3
EB51S2 217 308 14800 15600 6.48 76.3 4.12 Table 3. XRF Non-detects and Fixed-Lab Analyses for Evergreen Berm Sample ID XRF Cup
Value(mg/kg)
Prec (±) Fixed-LabValue
(mg/kg)
Depth (in)
EB31S2 45 53 150 12-24
EB37S2 45 53 23.4 12-24
EB50S2 45 51 36.6 12-24
EB87S2 45 51 12.2 12-24
EB88S1 45 57 34 0-12
EB88S2 45 56 4.77 12-24
EB91S1 45 56 47 0-12
EB91S2 45 56 35.7 12-24
EB92S2 45 55 9.8 12-24
EB93S2 45 55 18.3 12-24
EB94S1 45 54 22.2 0-12
EB94S2 45 56 14.9 12-24
EB96S1 45 53 37.5 0-12
EB96S2 45 53 15.1 12-24
EB97S1 45 52 30.8 0-12
EB97S2 45 53 24.5 12-24

For
t Lew
is A
gree
d O
rder
RI
DM
A f
or R
ange
s
Oct
ober
29,
200
3 15
Tab
le 4
. P
reci
sio
n S
amp
le X
RF
Res
ult
s (i
n m
g/k
g)
and
RS
D (
incl
ud
es a
ll d
ata
fro
m E
verg
reen
Ber
m)
XR
FX
RF
XR
FX
RF
XR
FX
RF
XR
F
Sam
ple
ID
Valu
e 1
Valu
e 2
Valu
e 3
Valu
e 4
Valu
e 5
Valu
e 6
Valu
e 7
Mea
nS
DR
SD
Lo
cati
on
EB
1S1
290
269.2
150.1
158.5
418
191.7
256.2
248
93
38
Toe
EB
1S1D
79.8
261.4
169.9
182.4
144.9
199.5
270.6
187
66
35
Toe
EB
1S2
45
4545
4545
45114
55
26
48
Toe
EB
2S2
136.4
68.1
76.5
56.5
76.9
149.2
120.4
98
37
38
Mid
dle
E
B4S
2
4545
4545
4545
4545
00
Toe
EB
7S1
109.3
45
77.5
98
86.2
72.8
68.6
80
21
26
Toe
EB
7S2
45
4545
71.2
4545
4549
10
20
Toe
EB
10S
1 61.2
4579.5
4571.1
4545
56
15
26
Toe
EB
10S
2
4545
4545
4545
4545
00
Toe
EB
13S
1 45
4545
4545
4545
45
00
Toe
EB
13S
2
4545
4545
4545
4545
00
Toe
EB
16S
2
172.6
144.5
186.5
104.4
163.4
159.8
169.2
157
27
17
Toe
EB
19S
2
4572.6
4574.7
4545
4553
14
26
Toe
EB
20S
1
1040
1080
971.2
1040
1020
1089.6
1140
1054
54
5M
iddle
E
B22
S1
233.2
301
401.8
382.6
308.4
390
422
348
69
20
Toe
EB
22S
2
4545
4545
4545
4545
00
Toe
EB
25S
1 234.4
238.6
316
222
216
284.6
197.7
244
42
17
Toe
EB
25S
2
4545
4545
4545
4545
00
Toe
EB
28S
2
4545
4545
4545
4545
00
Toe
EB
31S
1
700
526
598
599
407
454
477
537
101
19
Toe
EB
31S
2
45
45
45
45
45
57
45
47
510
Toe
EB
33S
1
11700
13800
12800
13800
15100
15900
18400
14500
2208
15
Toe
EB
33S
2
1780
2190
2380
2550
2670
2400
2290
2323
287
12
Toe
EB
33S
1D
911
892
1120
1480
1430
1690
1930
1350
394
29
Mid
dle
E
B33
S2D
339
572
355
560
532
287
556
457
124
27
Mid
dle

For
t Lew
is A
gree
d O
rder
RI
DM
A f
or R
ange
s
Oct
ober
29,
200
3 16
EB
34S
1
486
455
436
278
331
500
496
426
87
21
Impact
E
B34
S1D
345
318
421
316
314
255
371
334
52
16
Impact
E
B34
S2
71.4
141
132
122
109
54.2
80.6
101
33
33
Toe
EB
34S
2D
4568.7
4545
4545
4548
919
Toe
EB
35S
1 2620
2080
4740
2020
2040
1630
2920
2579
1044
40
Mid
dle
E
B35
S2
522
576
556
509
488
557
636
549
49
9M
iddle
E
B36
S1
10100
10400
9140
11600
8930
9960
9890
10003
878
9Im
pact
E
B36
S2
1450
770
1070
1290
1570
1560
1380
1299
290
22
Impact
E
B40
S1
834
604
571
546
684
621
568
633
100
16
Toe
EB
40S
2
276
148
288
185
299
219
202
231
58
25
Toe
EB
41S
1
1290
1390
1300
1630
1210
1310
1670
1400
179
13
Mid
dle
E
B41
S2
813
575
683
765
514
496
491
620
134
22
Mid
dle
E
B42
S1
26700
25700
26500
27500
28000
26200
28300
26986
967
4M
iddle
E
B42
S2
5570
5600
5720
5460
6870
4210
5250
5526
781
14
Mid
dle
E
B43
S1
973
608
700
573
1040
695
651
749
183
24
Toe
EB
43S
2
300
331
294
271
333
405
364
328
46
14
Toe
EB
44S
1
671
538
450
905
683
696
769
673
148
22
Toe
EB
44S
1D
1530
1490
1370
1080
1310
1590
1180
1364
188
14
Toe
EB
44S
2 708
772
577
736
606
734
781
702
80
11
Toe
EB
44S
2D
95.6
257
120
189
134
159
82.1
148
60
41
Toe
EB
46S
1
295
233
278
349
233
251
220
266
45
17
Toe
EB
46S
2
4545
89.8
4598.2
4575.2
63
24
38
Toe
EB
52S
1 238.2
221
224.2
260.2
358.6
247.4
193.8
249
53
21
Toe
EB
52S
2
4545
102.1
74.5
45134.3
129.4
82
40
49
Toe
EB
55S
1
302.4
218.4
239.2
367
298.4
500.8
241
310
98
32
Mid
dle
E
B55
S2
4545
4545
4545
4545
00
Toe
EB
58S
2
4582.2
45111.1
102.9
4545
68
30
44
Toe
EB
61S
1
405
363.8
426
398.2
244.8
398.2
318.8
365
63
17
Toe
For
t Lew
is A
gree
d O
rder
RI
DM
A f
or R
ange
s
Oct
ober
29,
200
3 17
EB
61S
2
4545
4545
4545
4545
00
Mid
dle
E
B64
S2
45
4545
4545
4545
45
00
Toe
EB
65S
2
265.6
250.2
324.6
293.8
281.8
236.8
276.6
276
29
10
Toe
EB
67S
1 108.2
45110
82
4545
112.5
78
33
42
Toe
EB
70S
2
4545
4545
4545
4545
00
Toe
EB
73S
2
4545
4545
4545
4545
00
Toe
EB
74S
2
192.1
197.7
214.6
201.9
273.2
287.4
217.2
226
38
17
Mid
dle
E
B76
S1
45
4570.2
59.2
4545
4551
10
20
Impact
E
B76
S2
45
4545
4545
4545
45
00
Sid
e o
f B
erm
E
B79
S1
45
92.3
76.6
116.1
61.3
98.7
55
78
26
33
Sid
e o
f B
erm
E
B79
S2
45
4545
4545
4545
45
00
In fro
nt o
f B
erm
E
B82
S1
199
194.4
250
196.4
191.2
158.8
165.5
194
30
15
In fro
nt o
f B
erm
E
B83
S2
121.9
146.1
112.8
106.5
111.3
166.4
145.3
130
23
17
In fro
nt o
f B
erm
E
B84
S2
45
97.9
4545
4545
4553
20
38
In fro
nt o
f B
erm
EB
87S
1
4571.3
4564.3
56.8
4554.1
55
10
19
NE
arm
of
Berm
EB
87S
2
4545
4545
4545
4545
00
NE
arm
of
Berm
E
B90
S1
45
115.2
83.7
144.8
99.1
105.1
4591
37
40
In
front
of B
erm
E
B92
S1
83.6
85.7
78.4
78.4
180.2
87.8
108.7
100
37
37
In
front
of B
erm
E
B92
S2
45
4545
4560.8
4545
47
613
In
front of
Berm
E
B94
S1
4545
4545
4545
4545
00
In
fro
nt of
Berm
N
ote
: A
bold
valu
e in
dic
ated a
readin
g b
elo
w the d
ete
ctio
n le
vel.
For
t Lew
is A
gree
d O
rder
RI
DM
A f
or R
ange
s
Oct
ober
29,
200
3 18
T
able
5.
Pri
mar
y S
amp
le a
nd
Fie
ld D
up
lica
te C
om
par
iso
n (
up
dat
ed t
o in
clu
de
all
dat
a fr
om
Eve
rgre
en B
erm
)
X
RF
X
RF
X
RF
X
RF
X
RF
X
RF
X
RF
Pri
mar
y/D
up
S
amp
le ID
V
alu
e 1
Val
ue
2 V
alu
e 3
Val
ue
4 V
alu
e 5
Val
ue
6 V
alu
e 7
Mea
n
Mea
n
SD
R
PD
E
B33S
1
11700
13800
12800
13800
15100
15900
18400
14500
7925
2208
165.9
2
EB
33S
1D
911
892
1120
1480
1430
1690
1930
1350
394
E
B33S
2
1780
2190
2380
2550
2670
2400
2290
2323
1390
287
134.2
1
EB
33S
2D
339
572
355
560
532
287
556
457
124
E
B34S
-1
486
455
436
278
331
500
496
426
380
87
24.1
3
EB
34S
-1D
345
318
421
316
314
255
371
334
52
E
B34S
-2
71.4
141
132
122
109
54.2
80.6
101
75
33
70.8
4
EB
34S
-2D
45
68.7
45
45
45
45
45
48
9
E
B44S
-1
671
538
450
905
683
696
769
673
1019
148
67.8
4
EB
44S
-1D
1530
1490
1370
1080
1310
1590
1180
1364
188
E
B44S
-2
708
772
577
736
606
734
781
702
425
80
130.3
1
EB
44S
-2D
95.6
257
120
189
134
159
82.1
148
60
E
B1S
-1
290
134
150.1
158.5
418
191.7
256.2
228
208
101
19.3
6
EB
1S
-1D
79.8
269.2
169.9
182.4
144.9
199.5
270.6
188
68
Note
: A
bold
valu
e in
dic
ated a
readin
g b
elo
w the d
ete
ctio
n le
vel.