Melody Extraction from Polyphonic Music Signals using Pitch
12
IEEE TRANSACTIONS ON AUDIO, SPEECH, AND LANGUAGE PROCESSING 1 Melody Extraction from Polyphonic Music Signals using Pitch Contour Characteristics Justin Salamon* and Emilia G´ omez Abstract—We present a novel system for the automatic ex- traction of the main melody from polyphonic music recordings. Our approach is based on the creation and characterisation of pitch contours, time continuous sequences of pitch candidates grouped using auditory streaming cues. We define a set of contour characteristics and show that by studying their distributions we can devise rules to distinguish between melodic and non-melodic contours. This leads to the development of new voicing detection, octave error minimisation and melody selection techniques. A comparative evaluation of the proposed approach shows that it outperforms current state-of-the-art melody extraction systems in terms of overall accuracy. Further evaluation of the algorithm is provided in the form of a qualitative error analysis and the study of the effect of key parameters and algorithmic components on system performance. Finally, we conduct a glass ceiling analysis to study the current limitations of the method, and possible directions for future work are proposed. Index Terms—Predominant Melody Estimation, Multi-pitch Estimation, Music Information Retrieval, Audio Content Descrip- tion, Pitch Contour. I. I NTRODUCTION A. Definition and Motivation G IVEN the audio recording of a piece of polyphonic music, the task of melody extraction involves automati- cally extracting a representation of the main melodic line. By polyphonic we refer to music in which two or more notes can sound simultaneously, be it different instruments (e.g. voice, guitar and bass) or a single instrument capable of playing more than one note at a time (e.g. the piano). To define the extracted melody representation, we must first have a clear definition of what the main melody actually is. As stated in [1], the term melody is a musicological concept based on the judgement of human listeners, and we can expect to find different definitions for the melody in different contexts [2], [3]. In order to have a clear framework to work within, the Music Information Retrieval (MIR) community has adopted in recent years the definition proposed by [1], “. . . the melody is the single (monophonic) pitch sequence that a listener might reproduce if asked to whistle or hum a piece of polyphonic music, and that a listener would recognise as being the ‘essence’ of that music when heard in comparison”. We use this definition for the purpose of this study and, as in previous studies, select the evaluation material such that given the above definition human listeners could easily agree on what the main Copyright (c) 2010 IEEE. Personal use of this material is permitted. However, permission to use this material for any other purposes must be obtained from the IEEE by sending a request to [email protected]. J. Salamon and E. G´ omez are with the Music Technology Group (MTG) of the Department of Information and Communication Technologies, Universitat Pompeu Fabra, Barcelona, Spain, e-mail: {justin.salamon,emilia.gomez}@upf.edu melody is, regardless of the musical genre of the piece. This is important as it allows us to generate an objective ground truth in order to quantitatively compare different approaches. The melody representation used in this study is the one proposed by [4], namely a sequence of fundamental frequency (F0) values corresponding to the perceived pitch of the main melody. It is important to note that whilst pitch and F0 are different concepts (the former being perceptual and the latter a physical quantity), as common to the melody extraction literature we will use the term pitch to refer to the F0 of the melody. As argued in [4] such a mid-level description (avoid- ing transcription into, for example, Western score notation) has many potential applications such as Query by Humming [5], music de-soloing for the automatic generation of karaoke accompaniment [6] and singer identification [7], to name a few. Determining the melody of a song could also be used as an intermediate step towards the derivation of semantic labels from musical audio [8]. Note that we consider not only sung melodies but also those played by instruments, for example a jazz standard in which the melody is played by a saxophone. B. Related Work Many methods for melody extraction have been proposed. Of these perhaps the largest group are what could be referred to as salience-based methods, which derive an estimation of pitch salience over time and then apply tracking or transition rules to extract the melody line without separating it from the rest of the audio [3], [4], [9], [10]. Such systems follow a common structure – first a spectral representation of the signal is obtained. The spectral representation is used to compute a time-frequency representation of pitch salience, also known as a salience function. The peaks of the salience function are considered as potential F0 candidates for the melody. Different approaches exist for computing the salience function, [11] uses harmonic summation with weighting learned from instrument training data, whilst [4] lets different F0s compete for har- monics, using Expectation-Maximization (EM) to re-estimate a set of unknown harmonic-model weights. Finally, the melody F0s are selected using different methods of peak selection or tracking. In some systems a subsequent voicing detection step (determining whether the main melody is present or absent in each time frame) is also included. A detailed review of such systems is provided in [1]. Another set of approaches attempt to identify the melody by separating it from the rest of the audio using timbre-based source separation techniques [12], [13]. Such systems use two separate timbre models, one for the melody (sometimes specif- ically human singing voice) and the other for the accompani- ment. Some systems incorporate grouping principles inspired
Transcript of Melody Extraction from Polyphonic Music Signals using Pitch

IEEE TRANSACTIONS ON AUDIO, SPEECH, AND LANGUAGE PROCESSING 1
Melody Extraction from Polyphonic Music Signalsusing Pitch Contour Characteristics
Justin Salamon* and Emilia Gomez
Abstract—We present a novel system for the automatic ex-traction of the main melody from polyphonic music recordings.Our approach is based on the creation and characterisation ofpitch contours, time continuous sequences of pitch candidatesgrouped using auditory streaming cues. We define a set of contourcharacteristics and show that by studying their distributions wecan devise rules to distinguish between melodic and non-melodiccontours. This leads to the development of new voicing detection,octave error minimisation and melody selection techniques.
A comparative evaluation of the proposed approach showsthat it outperforms current state-of-the-art melody extractionsystems in terms of overall accuracy. Further evaluation of thealgorithm is provided in the form of a qualitative error analysisand the study of the effect of key parameters and algorithmiccomponents on system performance. Finally, we conduct a glassceiling analysis to study the current limitations of the method,and possible directions for future work are proposed.
Index Terms—Predominant Melody Estimation, Multi-pitchEstimation, Music Information Retrieval, Audio Content Descrip-tion, Pitch Contour.
I. INTRODUCTION
A. Definition and Motivation
G IVEN the audio recording of a piece of polyphonicmusic, the task of melody extraction involves automati-
cally extracting a representation of the main melodic line. Bypolyphonic we refer to music in which two or more notes cansound simultaneously, be it different instruments (e.g. voice,guitar and bass) or a single instrument capable of playingmore than one note at a time (e.g. the piano). To define theextracted melody representation, we must first have a cleardefinition of what the main melody actually is. As stated in[1], the term melody is a musicological concept based onthe judgement of human listeners, and we can expect to finddifferent definitions for the melody in different contexts [2],[3]. In order to have a clear framework to work within, theMusic Information Retrieval (MIR) community has adopted inrecent years the definition proposed by [1], “. . . the melody isthe single (monophonic) pitch sequence that a listener mightreproduce if asked to whistle or hum a piece of polyphonicmusic, and that a listener would recognise as being the‘essence’ of that music when heard in comparison”. We usethis definition for the purpose of this study and, as in previousstudies, select the evaluation material such that given the abovedefinition human listeners could easily agree on what the main
Copyright (c) 2010 IEEE. Personal use of this material is permitted.However, permission to use this material for any other purposes must beobtained from the IEEE by sending a request to [email protected].
J. Salamon and E. Gomez are with the Music Technology Group(MTG) of the Department of Information and CommunicationTechnologies, Universitat Pompeu Fabra, Barcelona, Spain, e-mail:{justin.salamon,emilia.gomez}@upf.edu
melody is, regardless of the musical genre of the piece. Thisis important as it allows us to generate an objective groundtruth in order to quantitatively compare different approaches.
The melody representation used in this study is the oneproposed by [4], namely a sequence of fundamental frequency(F0) values corresponding to the perceived pitch of the mainmelody. It is important to note that whilst pitch and F0 aredifferent concepts (the former being perceptual and the lattera physical quantity), as common to the melody extractionliterature we will use the term pitch to refer to the F0 of themelody. As argued in [4] such a mid-level description (avoid-ing transcription into, for example, Western score notation)has many potential applications such as Query by Humming[5], music de-soloing for the automatic generation of karaokeaccompaniment [6] and singer identification [7], to name afew. Determining the melody of a song could also be used asan intermediate step towards the derivation of semantic labelsfrom musical audio [8]. Note that we consider not only sungmelodies but also those played by instruments, for example ajazz standard in which the melody is played by a saxophone.
B. Related WorkMany methods for melody extraction have been proposed.
Of these perhaps the largest group are what could be referredto as salience-based methods, which derive an estimation ofpitch salience over time and then apply tracking or transitionrules to extract the melody line without separating it fromthe rest of the audio [3], [4], [9], [10]. Such systems follow acommon structure – first a spectral representation of the signalis obtained. The spectral representation is used to compute atime-frequency representation of pitch salience, also knownas a salience function. The peaks of the salience function areconsidered as potential F0 candidates for the melody. Differentapproaches exist for computing the salience function, [11] usesharmonic summation with weighting learned from instrumenttraining data, whilst [4] lets different F0s compete for har-monics, using Expectation-Maximization (EM) to re-estimatea set of unknown harmonic-model weights. Finally, the melodyF0s are selected using different methods of peak selection ortracking. In some systems a subsequent voicing detection step(determining whether the main melody is present or absent ineach time frame) is also included. A detailed review of suchsystems is provided in [1].
Another set of approaches attempt to identify the melodyby separating it from the rest of the audio using timbre-basedsource separation techniques [12], [13]. Such systems use twoseparate timbre models, one for the melody (sometimes specif-ically human singing voice) and the other for the accompani-ment. Some systems incorporate grouping principles inspired

IEEE TRANSACTIONS ON AUDIO, SPEECH, AND LANGUAGE PROCESSING 2
by auditory scene analysis (ASA), most often frequency prox-imity [4]. Other grouping principles have also been exploited –in [14] grouping principles based on frequency and amplitudeproximity and harmonicity are incorporated into a separationframework based on spectral clustering, where a monophonicpitch tracker is later applied to the separated melody source.
Algorithms that exploit the spatial information in stereorecordings have also been proposed. In [15] stereophonicinformation is used to estimate the panning of each source,and a production model (source/filter) is used to identifyand separate the melody. Melody extraction is used as anintermediate step to tune the separation parameters to theestimated melody. Finally, purely data-driven approaches havealso been studied, such as [16] in which the entire short-timemagnitude spectrum is used as training data for a supportvector machine classifier.
Despite the variety of proposed approaches, melody ex-traction remains a challenging and unsolved task, with cur-rent state-of-the-art systems achieving overall accuracies1 ofaround 70%2. The complexity of the task is twofold – firstly,the signal representation of polyphonic music contains thesuperposition of all instruments which play simultaneously.When considering the spectral content of the signal, theharmonics of different sources superimpose making it veryhard to attribute specific frequency bands and energy levelsto specific instrument notes. This is further complicated bymixing and mastering techniques such as adding reverberation(blurs note offsets) or applying dynamic range compression(reduces the difference between soft and loud sources, increas-ing interference). Secondly, even once we obtain a pitch-basedrepresentation of the signal, the task of determining whichpitches constitute the main melody needs to be solved [17].This in turn entails three main challenges – determining whenthe melody is present and when it is not (voicing detection),ensuring the estimated pitches are in the correct octave (avoid-ing octave errors), and selecting the correct melody pitch whenthere is more than one note sounding simultaneously.
C. Method Introduction, Contributions and Paper Outline
Though promising results have been achieved recently byseparation-based methods [13], salience-based approaches arestill amongst the best performing systems, as well as beingconceptually simple and computationally efficient. In thispaper a novel salience-based melody extraction method ispresented. The method is centred on the creation and char-acterisation of pitch contours – time continuous sequences ofF0 candidates generated and grouped using heuristics basedon auditory streaming cues [18] such as harmonicity, pitchcontinuity and exclusive allocation. We define a set of musicalfeatures which are automatically computed for each contour.By studying the feature distributions of melodic and non-melodic contours we are able to define rules for distinguishingbetween the contours that form the melody and contoursthat should be filtered out. Combining these rules with voice
1Overall accuracy is defined in Section III-B.2Music Information Retrieval Evaluation eXchange [Online]. Available:
http://www.music-ir.org/mirex/wiki/Audio Melody Extraction (Dec. 2011).
leading principles [19], novel techniques are developed for ad-dressing the challenges mentioned earlier – voicing detection,avoiding octave errors and selecting the pitch contours thatbelong to the main melody.
The idea of F0 candidate grouping (or tracking) is not newto the literature [10], [20]. ASA inspired grouping principleshave been employed in melody extraction systems based onsource separation [14], as well as in [9] where pitch contoursare first segmented into notes out of which the melody isselected. While the structure of our system is somewhatsimilar, the presented method differs in several importantways. To begin with, a wider set of contour characteristicsbeyond the basic pitch height, length and mean salience isconsidered. The method does not require segmentation intonotes, and makes use of contour features that would be lostduring pitch quantisation such as vibrato and pitch deviation.Furthermore, these features are exploited using new techniquesfollowing the study of contour feature distributions.
The main contribution of the paper is the contour char-acterisation and its application for melodic filtering. Thecontribution can be summarised as follows: a method for thegeneration and characterisation of pitch contours is described,which uses signal processing steps and a salience functionspecifically designed for the task of melody extraction. A setof pitch contour features is defined and their distributions arestudied, leading to novel methods for voicing detection, octaveerror minimisation and melody selection.
In addition to the main contribution, a comparative eval-uation with state-of-the-art systems is provided, including astatistical analysis of the significance of the results. We alsostudy the effect of optimising individual stages of the system[21] on its overall performance, and assess the influence ofdifferent algorithmic components. These evaluations are com-plemented with a qualitative error analysis and glass ceilinganalysis to determine the current limitations of the approachand propose directions for future work.
The outline of the remainder of the paper is as follows. InSection II the proposed melody extraction method is described.In Section III the evaluation process is described, including thetest collections and metrics used for evaluation. In Section IVthe results of the evaluation are presented, followed by a qual-itative error analysis, component evaluation and a glass ceilingstudy. Finally in Section V we conclude with a discussion ofthe proposed method and the obtained results, providing somesuggestions for future improvements as well as a discussionon the remaining challenges in melody extraction.
II. PROPOSED METHOD
Our approach is comprised of four main blocks, as depictedin Figure 1. In the following sections we describe each ofthe four blocks in detail. The motivation for choosing specificprocessing steps and parameter values for the first two blocksof the system is discussed in Section IV-C.
A. Sinusoid ExtractionThe sinusoid extraction process is divided into three stages
as depicted in Figure 1: filtering, spectral transform andsinusoid frequency/amplitude correction.

IEEE TRANSACTIONS ON AUDIO, SPEECH, AND LANGUAGE PROCESSING 3
Audio signal
Sinusoid extraction
Salience function
Pitch contour creation
Melody selection
Iterative
Melody F0 sequence
Spectral peaks
Time-frequency salience
Pitch contours ontouPitch co urs
Fig. 1. Block diagram of the system’s four main blocks: sinusoid extraction,salience function computation, pitch contour creation and melody selection.
1) Filtering: We apply an equal loudness filter [22], whichenhances frequencies to which the human listener is moreperceptually sensitive (and attenuates those to which theyare not). This is done by taking a representative average ofthe equal loudness curves [23] and filtering the signal by itsinverse. The filter is implemented as a 10th order IIR filtercascaded with a 2nd order Butterworth high pass filter (forfurther details see [22]). The filter is well suited for melodyextraction, as it enhances mid-band frequencies where we canexpect to find the melody, and attenuates low-band frequencieswhere low pitched instruments (e.g. the bass) can be found.
2) Spectral Transform: After filtering, we apply the Short-Time Fourier Transform (STFT) given by:
Xl(k) =M−1∑n=0
w(n) · x(n+ lH)e−j2πN kn, (1)
l = 0, 1, . . . and k = 0, 1, . . . , N − 1
where x(n) is the time signal, w(n) the windowing function,l the frame number, M the window length, N the FFT lengthand H the hop size. We use the Hann windowing functionwith a window size of 46.4ms, a hop size of 2.9ms and a ×4zero padding factor, which for data sampled at fS = 44.1kHzgives M = 2048, N = 8192 and H = 128. The relativelysmall hop size (compared to other MIR tasks [24]) is selectedto facilitate more accurate F0 tracking during the creation ofpitch contours. The decision to use the STFT rather than sometype of multi-resolution transform [4], [10], [20] is justified inSection IV-C. Given the FFT of a single frame Xl(k), spectralpeaks pi are selected by finding all the local maxima ki of themagnitude spectrum |Xl(k)|.
3) Frequency/Amplitude Correction: The location of thespectral peaks is limited to the bin frequencies of the FFT,
which for low frequencies can result in a relatively largeerror in the estimation of the peak frequency. To overcomethis quantisation we use the approach described in [25], inwhich the phase spectrum φl(k) is used to calculate thepeak’s instantaneous frequency (IF) and amplitude, whichprovide a more accurate estimate of the peak’s true frequencyand amplitude. The choice of this correction method overalternative approaches is explained in Section IV-C.
The IF fi of a peak pi found at bin ki is computed fromthe phase difference ∆(k) of successive phase spectra usingthe phase vocoder [26] method as follows:
fi = (ki + κ(ki))fSN, (2)
where the bin offset κ(ki) is calculated as:
κ(ki) =N
2πHΨ(φl(ki)− φl−1(ki)−
2πHN
ki
), (3)
where Ψ is the principal argument function which maps thephase to the ±π range. The instantaneous magnitude ai iscalculated using the peak’s spectral magnitude |Xl(ki)| andthe bin offset κ(ki) as follows:
ai =12
|Xl(ki)|WHann
(MN κ(ki)
) , (4)
where WHann is the Hann window kernel.
B. Salience Function Computation
The extracted spectral peaks are used to construct a saliencefunction – a representation of pitch salience over time. Thepeaks of this function form the F0 candidates for the mainmelody. The salience computation in our system is based onharmonic summation similar to [11], where the salience ofa given frequency is computed as the sum of the weightedenergies found at integer multiples (harmonics) of that fre-quency. Unlike [11], only the spectral peaks are used in thesummation, to discard spectral values which are less reliabledue to masking or noise. Using the peaks also allows usto apply the aforementioned frequency correction which hasbeen shown to improve the frequency accuracy of the saliencefunction [21].
The important factors affecting the salience computation arethe number of harmonics considered Nh and the weightingscheme used. The choice of these parameters is discussed inthe results section of the paper (IV-C).
Our salience function covers a pitch range of nearly fiveoctaves from 55Hz to 1.76kHz, quantized into b = 1 . . . 600bins on a cent scale (10 cents per bin). Given a frequency fin Hz, its corresponding bin B(f) is calculated as:
B(f) =
1200 · log2
(f55
)10
+ 1
. (5)
At each frame the salience function S(b) is constructedusing the spectral peaks pi (with frequencies fi and linearmagnitudes ai) returned by the sinusoid extraction step (i =

IEEE TRANSACTIONS ON AUDIO, SPEECH, AND LANGUAGE PROCESSING 4
1 . . . I , where I is the number of peaks found). The saliencefunction is defined as:
S(b) =Nh∑h=1
I∑i=1
e(ai) · g(b, h, fi) · (ai)β , (6)
where β is a magnitude compression parameter, e(ai) is amagnitude threshold function, and g(b, h, fi) is the functionthat defines the weighting scheme. The magnitude thresholdfunction is defined as:
e(ai) ={
1 if 20 log10(aM/ai) < γ,0 otherwise, (7)
where aM is the magnitude of the highest spectral peak inthe frame and γ is the maximum allowed difference (in dB)between ai and aM . The weighting function g(b, h, fi) definesthe weight given to peak pi, when it is considered as the hth
harmonic of bin b:
g(b, h, fi) ={
cos2(δ · π2 ) · αh−1 if |δ| ≤ 1,0 if |δ| > 1, (8)
where δ = |B(fi/h) − b|/10 is the distance in semitonesbetween the harmonic frequency fi/h and the centre frequencyof bin b, and α is the harmonic weighting parameter. The non-zero threshold for δ means that each peak contributes not justto a single bin of the salience function but also to the binsaround it (with cos2 weighting). This avoids potential prob-lems that could arise due to the quantization of the saliencefunction into bins, and also accounts for inharmonicities. In theresults section of this paper (IV-C) we discuss the optimisationof the aforementioned parameters for melody extraction, andexamine the effect it has on the global performance of thesystem, comparing melody extraction results before and afterparameter optimisation.
C. Creating Pitch Contours (Peak Streaming)
Once the salience function is computed, its peaks at eachframe are selected as potential melody F0 candidates. At thisstage, some melody extraction methods attempt to track themelody directly from the set of available peaks [4], [27]. Ourapproach however is based on the idea that further information(which can be exploited to select the correct melody pitch) canbe extracted from the data by first grouping the peaks into pitchcontours – time and pitch continuous sequences of saliencepeaks. Each contour has a limited time span correspondingroughly to a single note in the shortest case or a short phrasein the longest. Though F0 grouping is not a new concept [9],[20], in this paper the characterisation of pitch contours isexplored in new ways, resulting in original solutions to thechallenges mentioned in Section I-B.
Before the streaming process is carried out, we first filter outnon-salient peaks to minimise the creation of “noise” contours(non-melody contours). The filtering process is carried outin two stages: first, peaks are filtered on a per frame basisby comparing their salience to that of the highest peak inthe current frame. Peaks below a threshold factor τ+ of the
salience of the highest peak are filtered out. In the secondstage the salience mean µs and standard deviation σs of allremaining peaks (in all frames) are computed. Peaks withsalience below µs − τσ · σs are then filtered out, where τσdetermines the degree of deviation below the mean salienceaccepted by the filter. The first filter ensures we only focuson the most predominant pitch candidates at each frame,whilst the second, a precursor to our voicing detection method,removes peaks in segments of the song which are generallyweaker (and more likely to be unvoiced). This filtering has aninherent trade-off – the more peaks we filter out the less noisecontours will be created (thus improving the detection of non-voiced segments and the correct selection of melody contours),however the greater the risk of filtering out salience peakswhich belong to the melody (henceforth “melody peaks”). Theselection of optimal values for τ+ and τσ is discussed at theend of this section.
The remaining peaks are stored in the set S+, whilst thepeaks that were filtered out are stored in S−. The peaks arethen grouped into contours in a simple process using heuristicsbased on auditory streaming cues [18]. We start by selectingthe highest peak in S+ and add it to a new pitch contour. Wethen track forward in time by searching S+ for a saliencepeak located at the following time frame (time continuitycue) which is within 80 cents (pitch continuity cue) from thepreviously found peak. A matching peak is added to the pitchcontour and removed from S+ (exclusive allocation principle).This step is repeated until no further matching salience peaksare found. During the tracking we must ensure that shorttime gaps in the pitch trajectory do not split what shouldbe a single contour into several contours. To do so, onceno matching peak is found in S+, we allow the tracking tocontinue for a limited amount of frames using peaks fromS−. The underlying assumption is that melody peaks whosesalience is temporarily masked by other sources will be storedin S−, and tracking them allows us to stay on the correcttrajectory until we find a peak in S+. If the gap length exceeds100ms (see below for selection of threshold and parametervalues) before a peak from S+ is found the tracking is ceased.We then go back to the first peak of the contour and repeatthe tracking process backwards in time. Once the tracking iscomplete we save the contour and the entire process is repeateduntil there are no peaks remaining in S+.
To select the best parameters for the contour creation (τ+,τσ , the maximum allowed pitch distance and gap length), wecompared contours generated from different excerpts to theexcerpts’ melody ground truth and evaluated them in terms ofpitch accuracy (distance in cents between the ground truth andthe contours) and voicing (i.e. whether the contours exactlycover the ground truth or are otherwise too long or too short).This process was repeated in a grid search until the parameterswhich resulted in the most accurate tracking were found (0.9,0.9, 80 cents and 100ms respectively). For τ+ and τσ wealso measured the amount of melody peaks (and non-melodypeaks) before and after the filtering. This analysis revealedthat as τ+ is increased the number of non-melody saliencepeaks drops dramatically, whilst the number of melody peaksreduces very gradually. Using the selected parameter values

IEEE TRANSACTIONS ON AUDIO, SPEECH, AND LANGUAGE PROCESSING 5
the number of non-melody peaks is reduced by 95% whilstmelody peaks are reduced by less than 17% (and this losscan be recovered by the gap tracking). The result is that thepercentage of melody peaks out of the total number of peaksgoes up on average from 3% initially to 52% after filtering.The quality of contour formation is discussed in Section IV-G.
D. Pitch Contour Characterisation
Once the contours are created, the remaining challenge isthat of determining which contours belong to the melody. Todo so, a set of contour characteristics is defined which willbe used to guide the system in selecting melody contours.Similarly to other systems, we define features based on contourpitch, length and salience. However, by avoiding the quantisa-tion of contours into notes [9] we are able to extend this set byintroducing features extracted from the pitch trajectory of thecontour, namely its pitch deviation and the presence of vibrato.Note that whilst [9] also keeps a non-quantised version of eachcontour for use at a later stage of the algorithm, it does notexploit it to compute additional contour features. Furthermore,as shall be seen in the next section, we use not only the featurevalues directly but also their distributions. The characteristicscomputed for each contour are the following:• Pitch mean Cp: the mean pitch height of the contour.• Pitch deviation Cσp : the standard deviation of the con-
tour pitch.• Contour mean salience Cs: the mean salience of all
peaks comprising the contour.• Contour total salience CΣs: the sum of the salience of
all peaks comprising the contour.• Contour salience deviation Cσs : the standard deviation
of the salience of all peaks comprising the contour.• Length Cl: the length of the contour.• Vibrato presence Cv: whether the contour has vibrato
or not (true/false). Vibrato is automatically detected bythe system using a method based on [28]: we apply theFFT to the contour’s pitch trajectory (after subtracting themean) and check for a prominent peak in the expectedfrequency range for human vibrato (5-8Hz).
In Figure 2 we provide examples of contours created forexcerpts of different musical genres (the relative sparsenessof non-melody contours can be attributed to the equal loud-ness filter and salience peak filtering described earlier). Byobserving these graphs we can propose contour characteristicsthat differentiate the melody from the rest of the contours:vibrato, greater pitch variance (in the case of human voice),longer contours, a mid-frequency pitch range and (thoughnot directly visible in the graphs) greater salience. Theseobservations concur with voice leading rules derived fromperceptual principles [19]. To confirm our observations, wecomputed the feature distributions for melody and non-melodycontours using the representative data-set described in SectionIII-A3. Note that in most (but not all) of the excerpts inthis data-set the melody is sung by a human voice. Theresulting distributions are provided in Figure 3, where foreach feature we plot the distribution for melody contours(solid red line) and non-melody contours (dashed blue line). In
plots (c), (d) and (e) the feature values are normalised by themean feature value for each excerpt. We see that the aboveobservations are indeed evident in the feature distributions.Additionally, for vibrato presence we found that 95% of allcontours in which vibrato was detected were melody contours.The consideration of various contour characteristics meansaccompanying instruments will not necessarily be selected asmelody if they exhibit a certain melodic characteristic. Forexample, a contour produced by an accompanying violin withvibrato may still be discarded due to its pitch height. Finally,we note that basing our system on pitch contours gives us thepossibility of introducing new contour features in the future,as well as using these features for other MIR tasks such asgenre classification [29] or singing style characterisation.
0 1 2 3 4 50
2000
4000
6000(a)
Time (s)
Fre
quency (
cents
)0 1 2 3 4 5
0
2000
4000
6000(b)
Time (s)
Fre
quency (
cents
)
0 1 2 3 4 50
2000
4000
6000(c)
Time (s)
Fre
quency (
cents
)
0 1 2 3 4 50
2000
4000
6000(d)
Time (s)
Fre
quency (
cents
)Fig. 2. Pitch contours generated from excerpts of (a) vocal jazz, (b) opera,(c) pop and (d) instrumental jazz. Melody contours are highlighted in bold.
1000 2000 3000 4000 5000 60000
0.1
0.2
(a)Pitch mean distribution (cents)
0 100 200 300 400 5000
0.4
0.8
(b)Pitch standard deviation distribution (cents)
0 1 2 30
0.075
0.15
(c)Contour mean salience distribution
0 1 2 3 4 50
0.15
0.3
(d)Contour salience standard deviation distribution
0 2 4 6 8 100
0.4
0.8
(e)Contour total salience distribution
0 2 4 60
0.4
0.8
(f)Contour length distribution (seconds)
Fig. 3. Pitch contour feature distributions: (a) Pitch mean, (b) Pitch std. dev.,(c) Mean salience, (d) Salience std. dev., (e) Total salience, (f) Length. Thered solid line represents the distribution of melody contour features, the bluedashed line represents the distribution of non-melody contour features.

IEEE TRANSACTIONS ON AUDIO, SPEECH, AND LANGUAGE PROCESSING 6
E. Melody Selection
We now turn to describe how the melody is chosen out of allthe contours created in the previous step of our method. Ratherthan selecting melody contours, we pose this task as a contourfiltering problem, where our goal is to filter out all non-melodycontours. As seen in the block diagram in Figure 1, this processis comprised of three steps: voicing detection, octave errorminimisation/pitch outlier removal, and final melody selection.In the first two steps contour characteristics are used to filterout non-melody contours, and in the final step the melodyfrequency at each frame is selected out of the remainingcontours.
1) Voicing Detection: Voicing detection is the task ofdetermining when the melody is present and when it is not.For example in plot (a) of Figure 2 the melody is presentbetween seconds 0-3 and 4-5, but not between 3-4 where non-melody contours are found. To filter out these contours we takeadvantage of the contour mean salience distribution given inplot (c) of Figure 3. Though the distributions are not perfectlyseparated, we see that by setting a threshold slightly below theaverage contour mean salience of all contours in the excerptCs, we can filter out a considerable amount of non-melodycontours with little effect on melody contours. We define thefollowing voicing threshold τv based on the distribution meanCs and its standard deviation σCs :
τv = Cs − ν · σCs (9)
The parameter ν determines the lenience of the filtering – ahigh ν value will give more false positives (i.e. false melodycontours) and low value more false negatives (i.e. filter outmelody contours). The sensitivity of the system to the valueof ν is discussed in Section IV-E. We also compared using thecontour total salience CΣs instead of the mean salience in theequation above, but the latter was found to give better results.This is likely due to the bias of the contour total saliencetowards longer contours, which is not beneficial at this stageas we risk removing short melody contours. At a later stagelength will be exploited to guide the system when a choicemust be made between alternative concurrent contours.
In the previous section we also noted that if the systemdetected vibrato in a contour, it was almost certainly a melodycontour. Furthermore, in plot (b) of Figure 3 we see thatthere is a sudden drop in non-melody contours once the pitchdeviation goes above 20 cents, and once the deviation is greaterthan 40 cents the probability of a contour being a non-melodycontour is less than 5%. We use this information to tune ourvoicing filter, by giving “immunity” to contours where vibratowas detected (Cv = true) or whose pitch deviation is above 40cents (Cσp > 40). In this way we ensure that contours whichhave relatively low salience but strong melodic characteristicsare not filtered out at this stage.
2) Octave Errors and Pitch Outliers: One of the mainsources of errors in melody extraction systems is the selectionof a harmonic multiple/sub-multiple of the correct melody F0instead of the correct F0, commonly referred to as octaveerrors. Various approaches have been proposed for the min-imisation of octave errors, usually performed directly after
the calculation of the salience function and on a per-framebasis [20], [30]. When we consider a single frame in isolation,determining whether two salience peaks with a distance of oneoctave between them were caused by two separate sources orwhether they are both the result of the same source (one peakbeing a multiple of the other) can prove a difficult task. On theother hand, once we have created the pitch contours, detectingthe presence of octave duplicates becomes a relatively straightforward task, as these manifest themselves as contours withpractically identical trajectories at a distance of one octavefrom each other. In practice, to compare contour trajectorieswe compute the distance between their pitch values on a per-frame basis for the region in which they overlap, and computethe mean over this region. If the mean distance is within1200±50 cents, the contours are considered octave duplicates.An example of octave duplicates can be observed in Figure 2plot (b) between seconds 3-4s where the correct contour is atabout 4000 cents and the duplicate at about 2800 cents.
In this paper we propose a method for octave error minimi-sation that takes advantage of this type of temporal informationin two ways. Firstly, as mentioned above, we use the creationof pitch contours to detect octave duplicates by comparingcontour trajectories. Secondly, we use the relationship be-tween neighbouring contours (in time) to decide which ofthe duplicates is the correct one. Our approach is based ontwo assumptions: firstly, that most (though not all) of thetime the correct contour will have greater salience than itsduplicate (the salience function parameters were optimised tothis end). Secondly, that melodies tend to have a continuouspitch trajectory avoiding large jumps, in accordance with voiceleading principles [19].
To implement these principles, we iteratively calculate a“melody pitch mean” P (t), i.e. a pitch trajectory that rep-resents the large scale time evolution of the melody’s pitch.When octave duplicates are encountered, the assumption isthat the contours directly before and after the duplicates willpull P (t) towards the duplicate at the correct octave. Thus, theduplicate closest to P (t) is selected as the correct contour andthe other is discarded. Similarly, we use P (t) to remove “pitchoutliers” – contours more than one octave above or below thepitch mean. Filtering outliers ensures there are no large jumpsin the melody (continuity assumption), and may also filter outnon-voiced contours that were not captured by the voicingdetection algorithm. The distance between a contour and P (t)is computed as before, by averaging the per-frame distancesbetween them. The complete process can be summarised as:
1) Calculate P (t) at each frame as the weighted mean ofthe pitch of all contours present in the frame.
2) Smooth P (t) using a 5-second sliding mean filter (lengthdetermined empirically) with a hop size of 1 frame. Thislimits the rate at which the melody pitch trajectory canchange, ensuring continuity and avoiding large jumps.
3) Detect pairs of octave duplicates and, for each pair,remove the contour furthest from P (t).
4) Recompute P (t) using the remaining contours, follow-ing Steps 1-2.
5) Remove pitch outliers by deleting contours at a distanceof more than one octave from P (t).
IEEE TRANSACTIONS ON AUDIO, SPEECH, AND LANGUAGE PROCESSING 7
6) Recompute P (t) using the remaining contours, follow-ing Steps 1-2.
7) Repeat Steps 3-6 twice more, each time starting withall contours that passed the voicing detection stage, butusing the most recently computed melody pitch meanP (t). The number of iterations was chosen followingexperimentation suggesting this was sufficient for ob-taining a good approximation of the true trajectory ofthe melody. In the future we intend to replace the fixediteration number by a stabilisation criterion.
8) Pass the contours remaining after the last iteration to thefinal melody selection stage.
It was found that the pitch mean P (t) computed in Step 1most closely approximates the true trajectory of the melodywhen each contour’s contribution is weighted by its totalsalience CΣs. This biases the mean towards contours which aresalient for a longer period of time, which is desirable sincesuch contours are more likely to belong to the melody, asevident from the distributions in Figure 3 (e) and (f).
An example of running steps 1-6 is provided in Figure 4.In plot (a) we start with a set of contours, together with thesmoothed melody pitch mean P (t) (Steps 1-2) represented bythe dashed red line. In the next plot (b), octave duplicates aredetected, and the duplicate farther from the melody pitch meanis removed (Step 3). Next (c) the mean P (t) is recomputed(Step 4), and pitch outliers are detected and removed (Step 5).Finally P (t) is recomputed once more (Step 6), displayed inplot (d) together with the remaining contours.
Fig. 4. Removing octave duplicates and pitch outliers. (a) Steps 1-2: the initialsmoothed melody pitch mean P (t) is computed (dashed red line). (b) Step 3:an octave duplicate is detected and removed. (c) Steps 4-5: P (t) is recomputedand two pitch outliers are removed. (d) Step 6: P (t) is recomputed.
3) Final Melody Selection: In this final step we need toselect from the remaining contours the peaks which belongto the main melody (recall that each peak represents an F0candidate). Whilst in other systems this step often involvesfairly complicated peak tracking using streaming rules ornote transition models, in our system these considerationshave already been taken into account by the contour creation,characterisation and filtering process. This means that oftenthere will only be one peak to choose. When there is still morethan one contour present in a frame, the melody is selectedas the peak belonging to the contour with the highest totalsalience CΣs. If no contour is present the frame is regarded asunvoiced. In order to evaluate raw pitch and chroma accuracy(see III-B) we also provide an F0 estimate for unvoiced frames
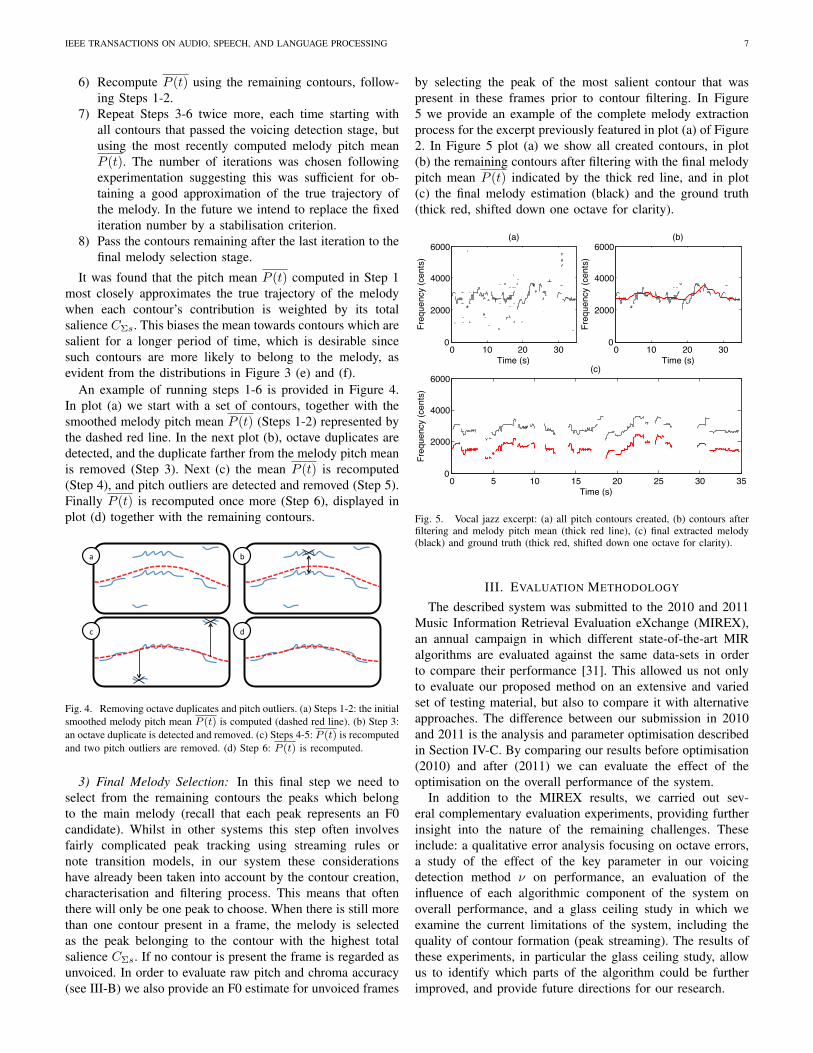
by selecting the peak of the most salient contour that waspresent in these frames prior to contour filtering. In Figure5 we provide an example of the complete melody extractionprocess for the excerpt previously featured in plot (a) of Figure2. In Figure 5 plot (a) we show all created contours, in plot(b) the remaining contours after filtering with the final melodypitch mean P (t) indicated by the thick red line, and in plot(c) the final melody estimation (black) and the ground truth(thick red, shifted down one octave for clarity).
0 5 10 15 20 25 30 350
2000
4000
6000(c)
Time (s)
Fre
quency (
cents
)
0 10 20 300
2000
4000
6000(a)
Time (s)
Fre
quency (
cents
)
0 10 20 300
2000
4000
6000(b)
Time (s)
Fre
quency (
cents
)
Fig. 5. Vocal jazz excerpt: (a) all pitch contours created, (b) contours afterfiltering and melody pitch mean (thick red line), (c) final extracted melody(black) and ground truth (thick red, shifted down one octave for clarity).
III. EVALUATION METHODOLOGY
The described system was submitted to the 2010 and 2011Music Information Retrieval Evaluation eXchange (MIREX),an annual campaign in which different state-of-the-art MIRalgorithms are evaluated against the same data-sets in orderto compare their performance [31]. This allowed us not onlyto evaluate our proposed method on an extensive and variedset of testing material, but also to compare it with alternativeapproaches. The difference between our submission in 2010and 2011 is the analysis and parameter optimisation describedin Section IV-C. By comparing our results before optimisation(2010) and after (2011) we can evaluate the effect of theoptimisation on the overall performance of the system.
In addition to the MIREX results, we carried out sev-eral complementary evaluation experiments, providing furtherinsight into the nature of the remaining challenges. Theseinclude: a qualitative error analysis focusing on octave errors,a study of the effect of the key parameter in our voicingdetection method ν on performance, an evaluation of theinfluence of each algorithmic component of the system onoverall performance, and a glass ceiling study in which weexamine the current limitations of the system, including thequality of contour formation (peak streaming). The results ofthese experiments, in particular the glass ceiling study, allowus to identify which parts of the algorithm could be furtherimproved, and provide future directions for our research.

IEEE TRANSACTIONS ON AUDIO, SPEECH, AND LANGUAGE PROCESSING 8
A. Test Collections
1) MIREX: Four music collections were used in theMIREX evaluations (2010 and 2011), as detailed in TableI. Note that each clip from the MIREX09 collection wasmixed at three different levels of signal-to-accompanimentratio resulting in three different test collections, which togetherwith the other collections makes a total of six test collections.
TABLE IMUSIC COLLECTIONS USED FOR EVALUATION IN MIREX 2010/2011.
Collection DescriptionADC2004 20 excerpts of roughly 20s in the genres of pop, jazz and
opera. Includes real recordings, synthesized singing andaudio generated from MIDI files. Total play time: 369s.
MIREX05 25 excerpts of a 10-40s duration in the genres of rock,R&B, pop, jazz and solo classical piano. Includes realrecordings and audio generated from MIDI files. Totalplay time: 686s.
MIREX08 Four 1 minute long excerpts from north Indian classicalvocal performances. There are two mixes per excerpt withdiffering amounts of accompaniment for a total of 8 audioclips. Total play time: 501s.
MIREX09 374 Karaoke recordings of Chinese songs (i.e. recordedsinging with karaoke accompaniment). Each recording ismixed at three different levels of signal-to-accompanimentratio {-5dB, 0dB, +5dB} for a total of 1,122 audio clips.Total play time: 10,022s.
2) Parameter Optimisation: For optimising system parame-ters, a separate collection of 14 excerpts of various genres wasused. Further details about this collection and the optimisationprocedure are provided in [21]. A summary of the resultsobtained in [21] is provided in section IV-C.
3) Additional experiments: For the voicing detection(IV-E), component evaluation (IV-F) and glass ceiling study(IV-G), we used a representative test set freely available toresearchers. This set includes 16 of the ADC2004 excerpts, 13excerpts similar to those used in the MIREX05 collection, and40 excerpts similar to those used in the MIREX09 collection.
B. Evaluation Metrics
The algorithms in MIREX were evaluated in terms of fivemetrics, as detailed in [1]:• Voicing Recall Rate: the proportion of frames labeled
voiced in the ground truth that are estimated as voicedby the algorithm.
• Voicing False Alarm Rate: the proportion of frameslabeled unvoiced in the ground truth that are estimatedas voiced by the algorithm.
• Raw Pitch Accuracy: the proportion of voiced framesin the ground truth for which the F0 estimated by thealgorithm is within ± 1
4 tone (50 cents) of the ground truthF0. Algorithms may also report F0 values for frames theyestimated as unvoiced so that the raw pitch accuracy isnot affected by incorrect voicing detection.
• Raw Chroma Accuracy: same as the raw pitch accuracyexcept that both the estimated and ground truth F0s aremapped into a single octave. This gives a measure ofpitch accuracy ignoring octave errors which are commonin melody extraction systems.
• Overall Accuracy: this measure combines the perfor-mance of the pitch estimation and voicing detection tasksto give an overall performance score for the system. Itis defined as the proportion of frames (out of the entirepiece) correctly estimated by the algorithm, where fornon-voiced frames this means the algorithm labeled themas non-voiced, and for voiced frames the algorithm bothlabeled them as voiced and provided a correct F0 estimatefor the melody (i.e. within ± 1
4 tone of the ground truth).
IV. RESULTS
The results obtained by our optimised algorithm are pre-sented in Table III (Section IV-D). For completeness, we startby presenting the results of MIREX 2010, followed by aqualitative error analysis of our submission. Next, we providea summary of the optimisation process carried out in [21],and then we present the results obtained by our optimisedalgorithm in MIREX 2011. Then, we describe the additionalevaluation experiments carried out to assess the influence ofspecific parameters and algorithmic components. Finally, wepresent the results of a glass ceiling analysis of our algorithm.
A. Comparative Evaluation: MIREX 2010
Five algorithms participated in the 2010 audio melodyextraction task of the MIREX campaign. In Table II we presentthe overall accuracy results obtained by each system for eachof the test collections. Systems are denoted by the initials oftheir authors – HJ [32], TOOS [33], JJY (who submitted twovariants) [34] and SG (our submission). For completeness, wealso include the results obtained by the best performing systemfrom the previous year’s campaign [10], denoted KD. In thelast column we provide the mean overall accuracy computedover all six collections3.
TABLE IIOVERALL ACCURACY RESULTS: MIREX 2010.
2004 2005 2008 2009 2009 2009 MeanAlgorithm 0dB -5dB +5dBHJ 0.61 0.54 0.77 0.76 0.63 0.83 0.69TOOS 0.54 0.61 0.72 0.72 0.63 0.79 0.67JJY2 0.72 0.61 0.80 0.63 0.47 0.79 0.67JJY1 0.70 0.62 0.80 0.63 0.47 0.79 0.67SG 0.70 0.62 0.78 0.74 0.58 0.81 0.70KD 0.86 0.75 0.81 0.68 0.52 0.78 0.73
We see that of the systems participating in 2010, oursystem achieved the highest mean overall accuracy, surpassedonly by the best performing system from the previous year.Nonetheless, the performance of all systems is very similar(with the exception of KD for the 2004 and 2005 data-sets4). We performed an analysis of variance (ANOVA) ofthe results obtained by the algorithms participating in 2010,revealing that for the 2004, 2005 and 2008 data-sets there
3The mean is not weighted by the size of the data-sets due to the orderof magnitude difference in size between the 2009 data-sets and the othercollections which, though smaller, are more representative of the type ofmaterial one would encounter in a real world scenario.
4A possible explanation for this is KD’s better ability at extracting non-vocal melodies, which constitute a larger proportion of these collections.

IEEE TRANSACTIONS ON AUDIO, SPEECH, AND LANGUAGE PROCESSING 9
was in fact no statistically significant difference between anyof the algorithms (for a p-value < 0.05). This is probablyin part due to the small size of these collections. For thethree 2009 collections, a statistically significant difference wasfound between most algorithms, though the artificial natureof these collections (karaoke accompaniment, amateur singingand no studio mixing or post production) makes them lessrepresentative of a real-world scenario. In conclusion, thecomparable performance of most systems suggests that furthererror analysis would be of much value. Only through analysingthe types of errors made by each algorithm can we get a betterunderstanding of their advantages and pitfalls.
B. Qualitative Error Analysis
Following the conclusions of the previous section, weperformed a qualitative error analysis of our submission,focusing on octave errors. We noted that for the MIREX05collection there was a significant difference between the rawpitch accuracy and the raw chroma accuracy. This disparity iscaused due to the selection of contours at the wrong octave.In Figure 6 we display the raw pitch accuracy versus theraw chroma accuracy obtained by our algorithm in each ofthe collections (a), and the per-song results for the MIREX05collection (b).
ADC2004 MIREX2005 MIREX2008 MIREX09 0dB MIREX09 5dB MIREX09+5dB0
0.2
0.4
0.6
0.8
1
accura
cy
(a)
0 5 10 15 20 250
0.5
1
song ID
accura
cy
(b)
pitch
chroma
pitch
chroma
Fig. 6. (a) Mean pitch and chroma accuracies for each test collection. (b)Per-song pitch and chroma accuracies for the MIREX05 collection.
Examining the per-song results we discovered that thelargest differences between pitch and chroma accuracy occurmainly in non-vocal excerpts, especially solo piano pieces.This suggests that whilst our octave selection method workswell for vocal music, further work would be required to adaptit for instrumental music, especially that performed by a single(polyphonic) instrument.
C. Process Analysis and Parameter Optimisation
In [21] the first two blocks of the system, sinusoid extractionand salience function computation, were studied with the goalof identifying the processing steps and parameter values mostsuitable for melody extraction. In this section we provide abrief summary of the conclusions reached in that study, whichwere used to select the processing steps and parameter valuesfor the first two blocks of the system presented in this paper.The effect of the optimisation is shown in the following sectionwere the MIREX 2011 results are presented.
In the first part of the study carried out in [21] alternativesignal processing methods were compared for each of the threestages in the sinusoid extraction process (filtering, spectraltransform and frequency/amplitude correction). For filtering,it was shown that the equal loudness filter (c.f. II-A1) consid-erably reduces the energy of non-melody spectral peaks whilstmaintaining almost all energy of melody peaks.
Next we evaluated the spectral transform. Some melodyextraction systems use a multi-resolution transform insteadof the STFT which has a fixed time-frequency resolution[4], [10], [20]. The motivation for using a multi-resolutiontransform is that it might be beneficial to have greater fre-quency resolution in the low frequency range where peaksare bunched closer together and are relatively stationary overtime, and higher time resolution for the high frequency rangewhere we can expect peaks to modulate rapidly over time(e.g. the harmonics of singing voice with a deep vibrato).In the study we compared the STFT to the multi-resolutionFFT (MRFFT) proposed in [25]. Interestingly, it was shownthat the MRFFT did not provide any statistically significantimprovement to spectral peak frequency accuracy and only amarginal improvement to the final melody F0 accuracy (lessthan 0.5 cents). Following these observations we opted forusing the STFT in the proposed system.
For frequency/amplitude correction two methods were com-pared: parabolic interpolation [35] and instantaneous fre-quency using the phase vocoder method [26]. It was shown thatboth methods provide a significant improvement in frequencyaccuracy compared to simply using the bin locations of theFFT, and that the phase-based method (used in this paper)performs slightly better (no significant difference though).
In the second part of the study, an evaluation was carriedout to study the effect of the weighting parameters α and β,the magnitude threshold γ and the number of harmonics Nhon the resulting salience function. The salience function wascomputed with different parameter value combinations using agrid search and the resulting salience peaks were evaluated us-ing metrics specifically designed to estimate the predominanceof the melody compared to other pitched elements present inthe salience function. This led to the determination of optimalvalues for the salience function parameters: α = 0.8, β = 1,γ = 40 and Nh = 20. For comparison, the values used inMIREX 2010 were 0.8, 2, 40 and 8 respectively, empiricallyassigned based on initial experiments carried out before themore comprehensive parameter optimisation study in [21].
D. Comparative Evaluation: MIREX 2011
Eight participants took part in the MIREX 2011 melodyextraction campaign, including our optimised system (SG)5.The overall accuracy results are provided in Table III. For easycomparison, our result from 2010 is repeated in the last rowof the table. We see that our optimised system achieves thehighest overall accuracy in four of the six test-sets. Conse-quently, our method also achieves the highest mean overallaccuracy (surpassing KD), making it the best performing
5Detailed information about all participating algorithms can be found at:http://nema.lis.illinois.edu/nema out/mirex2011/results/ame/mirex09 0dB/

IEEE TRANSACTIONS ON AUDIO, SPEECH, AND LANGUAGE PROCESSING 10
TABLE IIIOVERALL ACCURACY RESULTS: MIREX 2011.
2004 2005 2008 2009 2009 2009 MeanAlgorithm 0dB -5dB +5dBTY 0.47 0.51 0.70 0.52 0.41 0.56 0.53TOS 0.59 0.57 0.72 0.74 0.62 0.82 0.68LYRS 0.73 0.59 0.72 0.47 0.36 0.54 0.57HCCPH 0.44 0.45 0.64 0.50 0.39 0.59 0.50CWJ 0.73 0.57 0.69 0.53 0.40 0.62 0.59YSLP 0.85 0.65 0.73 0.52 0.39 0.66 0.63PJY 0.81 0.65 0.71 0.74 0.54 0.83 0.71SG 0.74 0.66 0.83 0.78 0.61 0.85 0.75SG (2010) 0.70 0.62 0.78 0.74 0.58 0.81 0.70
melody extraction algorithm to be evaluated on the currentMIREX test-sets (2009 to date). When comparing our resultsbefore optimisation (2010) and after (2011), we see that forall collections there is a notable improvement in accuracy. Theincrease can be attributed to better voicing detection (resultingin lower voicing false alarm rates), better contour generation(higher pitch and chroma accuracies) and less octave errors(smaller difference between pitch and chroma accuracies). Wenote that whilst the system’s parameters have been optimised,it could still be improved through the introduction of newcontour characteristics or additional signal processing steps.These options are discussed further in Section IV-G.
E. Voicing
In Section II-E1 we proposed a new voicing detectionmethod in which the determination of voiced sections is basedon the study of contour feature distributions. The method wasin part responsible for the successful results in MIREX, whereour system achieved the best trade-off between voicing recalland voicing false alarm rates. In this section we study thesensitivity of our system to the method’s key parameter ν(Equation 9). Recall that ν determines the lenience of thefiltering: increasing ν makes it more lenient (less contoursare filtered out), whilst decreasing ν makes it stricter (morecontours are filtered out). In Figure 7 we plot the overallaccuracy, voicing recall and voicing false alarm rates for eachcollection in our representative test set, as a function of ν.
1 0.8 0.6 0.4 0.2 0 0.2 0.4 0.6 0.8 10
10
20
30
40
50
60
70
80
90
100
Me
tric
sco
re
ADC2004Overall accuracy
ADC2004Voicing recall
ADC2004Voicing false alarm
MIREX05Overall accuracy
MIREX05Voicing recall
MIREX05Voicing false alarm
MIREX09Overall accuracy
MIREX09Voicing recall
MIREX09Voicing false alarm
Fig. 7. Overall accuracy, voicing recall and voicing false alarm rates versusthe voicing parameter ν.
As expected, the trade-off between the voicing recall andvoicing false alarm rates is clearly visible. As ν is increased
(reducing the filtering threshold τv) the recall rate goes up forall collections, but so does the false alarm rate. The optimalvalue for ν is the one which gives the best balance betweenthe two, and can be inferred from the overall accuracy. Wesee that this optimal value is slightly different for each ofthe three collections. This is because the relationship betweenthe salience distribution of melody contours and the saliencedistribution of non-melody contours (c.f. Figure 3 plot (c)) isaffected by the type of musical accompaniment used, whichvaries between the collections. Nonetheless, the optimal νvalues for the three collections lie within a sufficiently limitedrange (0.0-0.4) such that a satisfactory compromise can bemade (e.g. for the collections under investigation, ν = 0.2).Finally, this (albeit small) difference between the optimal νvalues suggests that whilst the proposed approach alreadyprovides good results, further contour characteristics wouldhave to be considered in order to improve voicing detectionrates across a wide range of musical styles and genres. Asfuture work we propose the development of a voiced contourclassifier trained using a wider set of contour features.
F. Component Evaluation
As with the voicing filter, each algorithmic component ofthe system influences its overall performance. In Table IVwe evaluate the complete system on the representative testset (III-A3) each time removing one component, in this wayassessing its effect on overall performance. The componentsremoved are: equal loudness filter (EQ), peak frequency cor-rection (FC), voicing filter (VF), octave duplicate and outlierremoval (OO). We also tested replacing the optimised saliencefunction parameters with the MIREX 2010 configuration (SF),as well as removing different combinations of components.
TABLE IVSYSTEM PERFORMANCE WITH DIFFERENT COMPONENTS REMOVED.
Component Voicing Voicing Raw Raw OverallRemoved Recall False Alarm Pitch Chroma Accuracy
None 0.86 0.19 0.81 0.83 0.77EQ 0.83 0.19 0.79 0.81 0.75FC 0.85 0.19 0.79 0.82 0.76
EQ & FC 0.83 0.18 0.77 0.80 0.75SF 0.85 0.24 0.77 0.81 0.74VF 0.92 0.42 0.81 0.83 0.72OO 0.87 0.24 0.79 0.83 0.75
VF & OO 0.95 0.56 0.79 0.83 0.67All 0.95 0.64 0.71 0.78 0.60
We see that each component has a direct effect on theoverall accuracy. Importantly, we note that there is a stronginteraction between components. For example, without thevoicing filter (VF) accuracy goes down by 5% and withoutthe octave duplicate and outlier removal (OO) it goes downby 2%, but if both were removed the accuracy would dropby 10%. This reveals that the latter step (OO), in addition toits primary role, also improves voicing detection by removingnon-voiced contours that were missed by the voicing filter.If all components were removed the combined effect wouldcause a drop of 17% in overall accuracy, which is 4% morethan the sum of all individual accuracy decreases combined.

IEEE TRANSACTIONS ON AUDIO, SPEECH, AND LANGUAGE PROCESSING 11
G. Glass Ceiling Analysis
As a final evaluation step, we test to see what would bethe best result our algorithm could possibly achieve, assumingwe had a perfect contour filtering approach. To do this, wecompare all contours generated for an excerpt with its groundtruth, and keep only those which overlap with the referencemelody. These contours are then passed to the final melodyselection stage as before, and the resulting melody is evaluatedagainst the ground truth. In Table V we present for eachcollection the best result obtained by our algorithm, followedby the result obtained using the perfect filtering simulation.
TABLE VRESULTS ACHIEVED BY SYSTEM AND GLASS CEILING RESULTS.
Collection Voicing Voicing Raw Raw OverallRecall False Alarm Pitch Chroma Accuracy
ADC2004 0.83 0.11 0.79 0.81 0.760.84 0.05 0.84 0.84 0.84
MIREX05 0.88 0.23 0.83 0.84 0.780.86 0.07 0.84 0.85 0.86
MIREX09 0.87 0.24 0.81 0.84 0.760.86 0.14 0.85 0.85 0.83
Comparing the results obtained by our system to the resultsusing the perfect filtering simulation, we can make severalimportant observations. First of all, we see that the overallaccuracy using the perfect contour filtering simulation is below100%. As suggested by the title of this section, this revealsa glass ceiling, i.e. a top limit on the overall accuracy thatcould be obtained by the system in its current configuration.We begin by discussing the differences between our system’sresults and the glass ceiling results, and then analyse thelimitations of the system that result in this glass ceiling limit.
We start by drawing the reader’s attention to the raw chromametric. We see that the chroma accuracy of our system ispractically equal to the glass ceiling result. This suggests thatthe system can almost perfectly select the correct contourwhen faced with two or more simultaneous contours (that arenot octave duplicates). Turning to the raw pitch accuracy, theresults obtained by the system are on average only 3.5% belowthe glass ceiling result. Again, this implies that whilst thereis still room for improvement, the octave error minimisationmethod proposed in the paper is certainly promising. Themain difference between our system and the glass ceilingresults is the voicing false alarm rate. Though already oneof the best voicing detection methods in MIREX, we see thatfurther improvements to the method would provide the mostsignificant increase in the overall accuracy of our system.
Finally, we consider the possible cause of the identifiedglass ceiling limit. Assuming the system can perform perfectcontour filtering, the overall accuracy is determined entirelyby the accuracy of the contour formation. If all melodycontours were perfectly tracked, the raw pitch and chromascores of the glass ceiling should reach 100%. This impliesthat to increase the potential performance of our system, wewould have to improve the accuracy of the contour formation.Currently, our tracking procedure takes advantage of temporal,pitch and salience information. We believe that an importantpart of the puzzle that is still missing is timbre information.
Timbre attributes have been shown to provide important cuesfor auditory stream segregation [36], suggesting they couldsimilarly be of use for pitch contour tracking. Furthermore, theextraction of pitch specific timbre attributes could lead to thedevelopment of a contour timbre feature Ct, that could be usedin the melody selection process by introducing rules basedon timbre similarity between contours. Another possibilityfor improving contour formation would be the suppression ofnoise elements in the signal before the salience function iscomputed. For instance, we could apply harmonic/percussivesource separation such as in [33], [37] to minimise the disrup-tions in the salience function caused by percussive instruments.
V. CONCLUSION
In this paper we presented a system for automaticallyextracting the main melody of a polyphonic piece of musicfrom its audio signal. The signal processing steps involvedin the extraction of melody pitch candidates were described,as well as the process of grouping them into pitch contours.It was shown that through the characterisation of these pitchcontours and the study of their distributions, we can identifycharacteristics that distinguish melody contours from non-melody contours. It was then explained how these features areused for filtering out non-melody contours, resulting in novelvoicing detection and octave error minimisation methods.
The proposed system was evaluated in two MIREX cam-paigns, where the latest version of our algorithm (2011) wasshown to outperform all other participating state-of-the-artmelody extraction systems. The results were complementedwith a qualitative error analysis, revealing that the differentcharacteristics of instrumental music complicate the task ofoctave error minimisation, requiring further adjustments to theproposed method for this type of musical content. The MIREX2011 results confirmed the expected increase in performancefollowing the optimisation of system parameters [21]. Weevaluated the influence of individual algorithmic componentson system performance, and noted that the interaction betweendifferent components can be important for maintaining highaccuracies. Finally, a glass ceiling analysis confirmed that inmost cases the proposed contour filtering process is successfulat filtering out non-melody contours, though a further increasein accuracy could still be achieved by reducing the voicingfalse alarm rate of the system. In addition, it was determinedthat to increase the potential performance of the systemwe would have to improve its contour formation stage, andpossible methods for achieving this were proposed.
ACKNOWLEDGMENT
We would like to thank J. Bonada, R. Marxer, J. Serra,P. Herrera, M. Haro and F. Fuhrmann for their suggestions. Wewould also like to thank the IMIRSEL team at the Universityof Illinois at Urbana-Champaign for running MIREX. Finally,we would like to thank the anonymous reviewers for their valu-able feedback and suggestions for improvement. This researchwas funded by the Programa de Formacion del ProfesoradoUniversitario (FPU) of the Ministerio de Educacion de Espana,BUSCAMEDIA (CEN-20091026), DRIMS (TIN2009-14247-C02) and COFLA (P09-TIC-4840).

IEEE TRANSACTIONS ON AUDIO, SPEECH, AND LANGUAGE PROCESSING 12
REFERENCES
[1] G. E. Poliner, D. P. W. Ellis, F. Ehmann, E. Gomez, S. Steich, andB. Ong, “Melody transcription from music audio: Approaches andevaluation,” IEEE Trans. on Audio, Speech and Language Process.,vol. 15, no. 4, pp. 1247–1256, 2007.
[2] R. Typke, “Music retrieval based on melodic similarity,” Ph.D. disser-tation, Utrecht University, Netherlands, 2007.
[3] M. Ryynanen and A. Klapuri, “Automatic transcription of melody, bassline, and chords in polyphonic music,” Computer Music J., vol. 32, no. 3,pp. 72–86, 2008.
[4] M. Goto, “A real-time music-scene-description system: predominant-f0 estimation for detecting melody and bass lines in real-world audiosignals,” Speech Communication, vol. 43, pp. 311–329, 2004.
[5] R. B. Dannenberg, W. P. Birmingham, B. Pardo, N. Hu, C. Meek, andG. Tzanetakis, “A comparative evaluation of search techniques for query-by-humming usig the MUSART testbed,” J. of the American Soc. forInform. Science and Technology, vol. 58, no. 5, pp. 687–701, Feb. 2007.
[6] J.-L. Durrieu, G. Richard, and B. David, “An iterative approach tomonaural musical mixture de-soloing,” in Proc. IEEE Int. Conf. onAcoust., Speech and Signal Process. (ICASSP), Apr. 2009, pp. 105–108.
[7] A. Mesaros, T. Virtanen, and A. Klapuri, “Singer identification in poly-phonic music using vocal separation and pattern recognition methods,”in Proc. 8th Int. Conf. on Music Inform. Retrieval, 2007, pp. 375–378.
[8] X. Serra, R. Bresin, and A. Camurri, “Sound and music computing:Challenges and strategies,” J. of New Music Research, vol. 36, no. 3,pp. 185–190, 2007.
[9] R. P. Paiva, T. Mendes, and A. Cardoso, “Melody detection in poly-phonic musical signals: Exploiting perceptual rules, note salience, andmelodic smoothness,” Computer Music J., vol. 30, pp. 80–98, Dec. 2006.
[10] K. Dressler, “Audio melody extraction for mirex 2009,” in 5th MusicInform. Retrieval Evaluation eXchange (MIREX), 2009.
[11] A. Klapuri, “Multiple fundamental frequency estimation by summingharmonic amplitudes,” in Proc. 7th Int. Conf. on Music Inform. Retrieval,Victoria, Canada, Oct. 2006, pp. 216–221.
[12] A. Ozerov, P. Philippe, F. Bimbot, and R. Gribonval, “Adaptation ofbayesian models for single-channel source separation and its applicationto voice/music separation in popular songs,” IEEE Trans. on Audio,Speech, and Language Process., vol. 15, no. 5, pp. 1564–1578, Jul.2007.
[13] J.-L. Durrieu, “Automatic transcription and separation of the mainmelody in polyphonic music signals,” Ph.D. dissertation, TelecomParisTech, 2010.
[14] M. Lagrange, L. G. Martins, J. Murdoch, and G. Tzanetakis, “Normal-ized cuts for predominant melodic source separation processing,” IEEETrans. on Audio, Speech and Language Process., vol. 16, no. 2, pp.278–290, Feb. 2008.
[15] J.-L. Durrieu, A. Ozerov, C. Fevotte, G. Richard, and B. D. David,“Main instrument separation from stereophonic audio signals using asource/filter model,” in Proc. 17th European Signal Process. Conf. (EU-SIPCO), Glasgow, Aug. 2009, pp. 15–19.
[16] G. Poliner and D. Ellis, “A classification approach to melody transcrip-tion,” in Proc. 6th Int. Conf. on Music Inform. Retrieval, London, Sep.2005, pp. 161–166.
[17] A. Cheveigne, “Pitch perception models,” in Pitch, ser. Springer Hand-book of Auditory Research, R. R. Fay, A. N. Popper, C. Plack, R. Fay,A. Oxenham, and A. Popper, Eds. Springer New York, 2005, vol. 24,pp. 169–233.
[18] A. Bregman, Auditory scene analysis. Cambridge, Massachussetts: MITPress, 1990.
[19] D. Huron, “Tone and voice: A derivation of the rules of voice-leadingfrom perceptual principles,” Music Perception, vol. 19, no. 1, pp. 1–64,2001.
[20] P. Cancela, “Tracking melody in polyphonic audio,” in 4th MusicInform. Retrieval Evaluation eXchange (MIREX), 2008.
[21] J. Salamon, E. Gomez, and J. Bonada, “Sinusoid extraction and saliencefunction design for predominant melody estimation,” in Proc. 14thInt. Conf. on Digital Audio Effects (DAFx-11), Paris, France, Sep. 2011,pp. 73–80.
[22] (2011, Dec.) Equal loudness filter. [Online]. Available:http://replaygain.org/
[23] D. W. Robinson and R. S. Dadson, “A re-determination of the equal-loudness relations for pure tones,” British J. of Applied Physics, vol. 7,pp. 166–181, 1956.
[24] G. Peeters, “A large set of audio features for sound description (similarityand classification) in the cuidado project,” Institut de Recherche etCoordination Acoustique/Musique (IRCAM), Tech. Rep., 2004.
[25] K. Dressler, “Sinusoidal extraction using an efficient implementation ofa multi-resolution FFT,” in Proc. 9th Int. Conf. on Digital Audio Effects(DAFx-06), Montreal, Canada, Sep. 2006, pp. 247–252.
[26] J. L. Flanagan and R. M. Golden, “Phase vocoder,” Bell SystemsTechnical Journal, vol. 45, pp. 1493–1509, 1966.
[27] V. Rao and P. Rao, “Vocal melody extraction in the presence of pitchedaccompaniment in polyphonic music,” IEEE Trans. on Audio Speechand Language Process., vol. 18, no. 8, pp. 2145–2154, Nov. 2010.
[28] P. Herrera and J. Bonada, “Vibrato extraction and parameterization in thespectral modeling synthesis framework,” in Proc. Workshop on DigitalAudio Effects (DAFx-98), 1998, pp. 107–110.
[29] J. Salamon, B. Rocha, and E. Gomez, “Musical genre classificationusing melody features extracted from polyphonic music signals,” inProc. IEEE Int. Conf. on Acoust., Speech and Signal Process. (ICASSP),Kyoto, Japan, Mar. 2012.
[30] A. Klapuri, “A method for visualizing the pitch content of polyphonicmusic signals,” in Proc. 10th Int. Soc. for Music Inform. Retrieval Conf.,Kobe, Japan, 2009, pp. 615–620.
[31] J. S. Downie, “The music information retrieval evaluation exchange(2005–2007): A window into music information retrieval research,”Acoustical Science and Technology, vol. 29, no. 4, pp. 247–255, 2008.
[32] C. Hsu and J. R. Jang, “Singing pitch extraction by voice vibrato/tremoloestimation and instrument partial deletion,” in Proc. 11th Int. Soc. forMusic Inform. Retrieval Conf., Utrecht, The Netherlands, Aug. 2010,pp. 525–530.
[33] H. Tachibana, T. Ono, N. Ono, and S. Sagayama, “Extended abstract foraudio melody extraction in mirex 2010,” in 6th Music Inform. RetrievalEvaluation eXchange (MIREX), Aug. 2010.
[34] S. Joo, S. Jo, and C. D. Yoo, “Melody extraction from polyphonic audiosignal mirex2010,” in 6th Music Inform. Retrieval Evaluation eXchange(MIREX), Aug. 2010.
[35] X. Serra, Musical Sound Modeling with Sinusoids Plus Noise. Swets& Zeitlinger, 1997, pp. 91–122.
[36] P. Iverson, “Auditory stream segregation by musical timbre: Effects ofstatic and dynamic acoustic attributes,” J. of Experimental Psychology:Human Perception and Performance, vol. 21, no. 4, pp. 751–763, Aug.1995.
[37] N. Ono, K. Miyamoto, H. Kameoka, J. Le Roux, Y. Uchiyama,E. Tsunoo, T. Nishimoto, and S. Sagayama, “Harmonic and percussivesound separation and its application to mir-related tasks,” in Advances inMusic Information Retrieval, ser. Studies in Computational Intelligence,Z. Ras and A. Wieczorkowska, Eds. Springer Berlin / Heidelberg,2010, vol. 274, pp. 213–236.
Justin Salamon obtained a B.A. (Hons.) in Com-puter Science from the University of Cambridge,UK, in 2007. In 2008 he obtained his M.Sc. inCognitive Systems and Interactive Media from Uni-versitat Pompeu Fabra (UPF), Barcelona, Spain.Currently he is a researcher and PhD student atthe Music Technology Group (MTG), UPF. As partof his doctoral studies he was a visiting researcherat the Sound Analysis-Synthesis research team ofthe Institut de Recherche et Coordination Acous-tique/Musique (IRCAM), Paris, France. His main
field of interest is Music Information Retrieval (MIR), with a focus oncontent-based MIR and audio and music processing, including musical streamestimation, melody and bass line extraction and characterisation, query-by-humming/example, classification, music and melodic similarity and indexing.
Emilia Gomez is a post-doctoral researcher andassistant professor (Professor Lector) at the MusicTechnology Group (MTG), Department of Infor-mation and Communication Technologies (DTIC),Universitat Pompeu Fabra (UPF). She graduated asa Telecommunication Engineer specialized in SignalProcessing at Universidad de Sevilla. Then, shereceived a DEA in Acoustics, Signal Processing andComputer Science applied to Music (ATIAM) atIRCAM, Paris. In July 2006, she completed her PhDin Computer Science and Digital Communication at
the UPF, on the topic of Tonal Description of Music Audio Signals. Her mainresearch interests are related to melodic and tonal description of music audiosignals, computer-assisted music analysis and computational ethnomusicology.


![[Entertainment Management]Polyphonic HMI](https://static.fdocuments.net/doc/165x107/545606e0af79594f558b4b0d/entertainment-managementpolyphonic-hmi.jpg)


![Melody Extraction from Polyphonic Music Signalsdpwe//pubs/SalGER14-melody.pdfversus guitar solo). In practice, research has focused on what we [FIg1] Melody extraction: obtaining a](https://static.fdocuments.net/doc/165x107/6110b0462cd22b665d489e52/melody-extraction-from-polyphonic-music-dpwepubssalger14-melodypdf-versus-guitar.jpg)