Mega City Pollution Molinas 2004
38
CRITICAL REVIEW ISSN 1047-3289 1. Air & Waste Manage. Assoc. 54:644-680 Coight 2004 Air & Waste Maragement Associafon Megacities and Atmospheric Pollution Mario J. Molina and Luisa T. Molina Massachusetts Institute of Technology, Cambridge, Massachusetts Mario J. Molina Luisa T. Molina ABSTRACT About half of the world's population now lives in urban areas because of the opportunity for a better quality of life. Many of these urban centers are expanding rapidly, leading to the growth of megacities, which are defined as metropol- itan areas with populations exceeding 10 million inhabit- ants. These concentrations of people and activity are exert- ing increasing stress on the natural environment, with impacts at urban, regional and global levels. In recent de- cades, air pollution has become one of the most important problems of megacities. Initially, the main air pollutants of concem were sulfur compounds, which were generated mostly by burning coal. Today, photochemical smog-in- duced primarily from traffic, but also from industrial activ- ities, power generation, and solvents-has become the main source of concem for air quality, while sulfur is still a major problem in many cities of the developing world. Air pollu- tion has serious impacts on public health, causes urban and regional haze, and has the potential to contribute signifi- cantly to climate change. Yet, with appropriate planning, megacities can efficiently address their air quality problems through measures such as application of new emission con- trol technologies and development of mass transit systems. This review is focused on nine urban centers, chosen as case studies to assess air quality from distinct perspectives: from cities in the industrialized nations to cities in the developing world. While each city-its problems, resources, and outlook-is unique, the need for a holistic approach to the complex environmental problems is the same. There is no single strategy in reducing air pollution in megacities; a mix of policy measures will be needed to imlprove air qual- ity. Experience shows that strong political will coupled with public dialog is essential to effectively implement the regu- lations required to address air quality problems. INTRODUCTION Nearly half of the world's population (48%) in 2000 lived in urban areas, and the number of urban dwellers is expected to grow by 2% per year during the coming three decades. I Table 1 shows that world population is expected to increase from 6.1 billion in 2000 to 8.1 billion in 2030, with nearly all of this growth concentrated in urban areas (from 2.9 billion to 4.9 billion). Urban populations in less developed regions will double from 2 billion to 3.9 bil- lion. These concentrations of people and their activities have consequences at urban, regional, continental, and global scales. 2 However, as centers of economic growth, education, technological advancement, and culture, large cities also offer opportunities to manage the growing pop- ulation in a sustainable way. The growth of urban environments presents a major challenge. This review addresses the effects of large urban areas on the Earth's atmosphere, in the cities themselves and beyond their borders. The topic is broad, and hence only a selection of the relevant issues is considered. Urban planning, industrial development, transportation, and other topics are discussed in the context of their interac- tions with air quality. A megacity is often defined as a metropolitan area with more than 10 million inhabitants. This definition is arbitrary, as major urban centers often include people who are not located within a city's political boundaries. Nine urban centers are examined in this review as case studies: 1) Los Angeles, CA; 2) Mexico City, Mexico; 3) Toronto, Canada; 4) Delhi, India; 5) Beijing, China; 6) Santiago, Chile; 7) Sao Paulo, Brazil; 8) Bogota, Colombia; and 9) Cairo, Egypt. These cities range from urban areas with relatively clean air in industrialized nations to highly polluted cities in the developing world. In particular, these cities have been active in assessing and reporting on air quality and are aggressively undertaking efforts to improve it. In this review, the driving forces behind the forma- tion and growth of megacities are described. The nature of megacities, their air quality problems, and the associated science are briefly addressed. The situations in the case-study 644 Journal of the Air & Waste Manacgement Association Volume 54 June 2004
Transcript of Mega City Pollution Molinas 2004
CRITICAL REVIEW ISSN 1047-3289 1. Air & Waste Manage. Assoc. 54:644-680
Coight 2004 Air & Waste Maragement Associafon
Megacities and Atmospheric Pollution
Mario J. Molina and Luisa T. MolinaMassachusetts Institute of Technology, Cambridge,Massachusetts
Mario J. Molina Luisa T. Molina
ABSTRACTAbout half of the world's population now lives in urbanareas because of the opportunity for a better quality of life.Many of these urban centers are expanding rapidly, leadingto the growth of megacities, which are defined as metropol-itan areas with populations exceeding 10 million inhabit-ants. These concentrations of people and activity are exert-ing increasing stress on the natural environment, withimpacts at urban, regional and global levels. In recent de-cades, air pollution has become one of the most importantproblems of megacities. Initially, the main air pollutants ofconcem were sulfur compounds, which were generatedmostly by burning coal. Today, photochemical smog-in-duced primarily from traffic, but also from industrial activ-ities, power generation, and solvents-has become the mainsource of concem for air quality, while sulfur is still a majorproblem in many cities of the developing world. Air pollu-tion has serious impacts on public health, causes urban andregional haze, and has the potential to contribute signifi-cantly to climate change. Yet, with appropriate planning,megacities can efficiently address their air quality problemsthrough measures such as application of new emission con-trol technologies and development of mass transit systems.
This review is focused on nine urban centers, chosen ascase studies to assess air quality from distinct perspectives:from cities in the industrialized nations to cities in thedeveloping world. While each city-its problems, resources,and outlook-is unique, the need for a holistic approach tothe complex environmental problems is the same. There isno single strategy in reducing air pollution in megacities; amix of policy measures will be needed to imlprove air qual-ity. Experience shows that strong political will coupled withpublic dialog is essential to effectively implement the regu-lations required to address air quality problems.
INTRODUCTION
Nearly half of the world's population (48%) in 2000 livedin urban areas, and the number of urban dwellers is
expected to grow by 2% per year during the coming threedecades. I Table 1 shows that world population is expectedto increase from 6.1 billion in 2000 to 8.1 billion in 2030,with nearly all of this growth concentrated in urban areas(from 2.9 billion to 4.9 billion). Urban populations in lessdeveloped regions will double from 2 billion to 3.9 bil-lion. These concentrations of people and their activitieshave consequences at urban, regional, continental, andglobal scales.2 However, as centers of economic growth,education, technological advancement, and culture, largecities also offer opportunities to manage the growing pop-ulation in a sustainable way.
The growth of urban environments presents a majorchallenge. This review addresses the effects of large urbanareas on the Earth's atmosphere, in the cities themselvesand beyond their borders. The topic is broad, and henceonly a selection of the relevant issues is considered. Urbanplanning, industrial development, transportation, andother topics are discussed in the context of their interac-tions with air quality.
A megacity is often defined as a metropolitan areawith more than 10 million inhabitants. This definition isarbitrary, as major urban centers often include peoplewho are not located within a city's political boundaries.Nine urban centers are examined in this review as casestudies: 1) Los Angeles, CA; 2) Mexico City, Mexico; 3)Toronto, Canada; 4) Delhi, India; 5) Beijing, China; 6)Santiago, Chile; 7) Sao Paulo, Brazil; 8) Bogota, Colombia;and 9) Cairo, Egypt. These cities range from urban areaswith relatively clean air in industrialized nations to highlypolluted cities in the developing world. In particular,these cities have been active in assessing and reporting onair quality and are aggressively undertaking efforts toimprove it.
In this review, the driving forces behind the forma-tion and growth of megacities are described. The nature ofmegacities, their air quality problems, and the associatedscience are briefly addressed. The situations in the case-study
644 Journal of the Air & Waste Manacgement Association Volume 54 June 2004

Molina and Molina
Table 1. Distribution of global population by size of settlement (1950-2030).
Population (in billions)
Major Area 1950 1975 2000 2003 2030
Wodd 2.52 4.07 6,07 6.3 8.13
More developed regions 0.81 1.05 1.19 1.2 1.24
Less developed regions 1.71 3.02 4.88 5.1 6,89
Urban populatonWorld 0,73 1,52 2.86 3,04 4.94
More developed regions 0.43 0.7 0.88 0.9 1,01
Less developed regions 0.31 0.81 1.97 2.15 3.93Rural populatonWorld 1,79 2.55 3.21 3.26 3.19
More developed regions 0.39 0.34 0.31 0.31 0.23
Less developed regions 1.4 2,21 2,9 2.95 2.96
Source: United Nations Population Division, World Urbanization Prospects, The 2003
Revision.)
megacities are discussed, as are their air quality manage-
ment programs. Air quality management tools available
for large urban centers are summarized and an outlook of
the air quality situation in coming years is given. A more
detailed description of air quality management strategiesapplied in the nine case study cities is available as an
online supplement to this review.3
CAUSES AND CONSEQUENCES OF URBANGROWTHThe number and size of megacities increased dramaticallyduring the second half of the twentieth century. In 1800,
London was the only major city in the world, with a
population of 1 million. Cities with a population of at
least 1 million increased to three by the beginning of thetwentieth century; today, there are 281. The average pop-ulation of the 100 largest cities was 200,000 in 1800; this
increased to 2.1 million by 1950, 5 million by 1990, and
7.7 million by 2002.4 In 1900, 9 of the 10 largest cities
were in North America and Europe, whereas today only 3
(Los Angeles, New York, and Tokyo) are in the developed
world. In 1950, New York and Tokyo were the only
megacities. That number grew to 4 (Tokyo, New York,
Shanghai, and Mexico City) by 1975 and to 20 by 2000,
and is estimated to reach 22 by 2015.1Most of the world's urban population still lives in
cities of fewer than 10 million inhabitants; many of these
cities are growing faster than the megacities.1 A metropol-itan area (large population center that consists of several
towns or cities clustered together) usually combines a
conurbation proper (the contiguous built-up area) with
peripheral zones not themselves necessarily urban in
character but closely bound to the conurbation by em-
ployment or commerce. For example, the Mexico City
metropolitan area (MCMA), often simply called Mexico
City, consists of 16 delegations of the Federal District and
37 contiguous municipalities from the State of Mexico
and one municipality from the State of Hidalgo, some
with populations over 1 million, that make up the total
population of -20 million for this megacity.Currently, there are 100 metropolitan areas with of-
ficial populations exceeding 3 million. Whether severalmetropolitan areas are located in succession, they are
sometimes grouped together as a megalopolis. A megalop-olis consists of several large cities and their surroundingareas in sufficient proximity to be considered a singleurban complex. The French geographer Jean Gottmann5
coined the term "megalopolis" to describe the northeast-
ern United States, a vast metropolitan area ("BosWash")
more than 480 km long, stretching from Boston in the
north to Washington, DC, in the south.6
Megacity is a general term for cities together with
their suburbs or recognized metropolitan area usually
with a total population in excess of 10 million people.
There is no exact definition of its boundaries, where it
starts and where it ends. As a result, the term "mega-city" is used loosely in this review, referring to large
agglomerations of people with their consequent employ-ment, housing, transportation, and security needs.
Levels of urbanization correlate with national in-come, and within a country, wealth is concentrated in
urban areas. Developed countries are more urbanized, and
urban areas may produce -60% of a country's gross na-
tional product.7 This higher income is a major cause of
growth, as people from the countryside move to the city
for the jobs, education, and services that an urbanizedcenter provides. Conflict, land degradation, and the de-
pletion of natural resources also motivate migration, es-
pecially in Africa,8 and international migration is anotherfactor. But the largest contributor to growth in urbansettings is the increasing number of people in the world,especially in the developing world.
One of the main hypotheses in environmental eco-
nomics suggests that as the per capita income of a nation
increases, the environmental quality deteriorates up to a
point. After that point, environmental quality improves
as incomes continue to rise. The-relationship has an "in-
verted U" shape and is known as the Kuznet's Curve.9 The
environmental deterioration related to increasing income
at low-income levels is probably associated with increased
industrialization. The association between improvementin environmental quality and higher income is less obvi-
ous. Wealthier nations can more easily prioritize environ-mental quality, implement more stringent control mea-
sures to reduce pollution, develop new technologies, and
enforce environmental regulations more strictly. How-ever, they may also export pollution, for example, by
Journal of the Air & Waste Management Association 645Volume 54 June 2004
Molina and Molina
establishing factories or powerplants in other nations, byexporting used vehicles that are more polluting, or bysimply purchasing goods that are produced in lower in-come, more environmentally compromised countries.'(
Transportation is a major source of air pollution inmany cities, especially in developing countries. The grow-ing problems of congestion, accidents, and lack of secu-rity are also worrisome. Yet transportation is also a criticalenabler of economic activity and beneficial social interac-tions. The challenge facing megacities is how to reducethe adverse environmental impacts and other negativeeffects of transportation without giving up the benefits ofmobility. This dilemma becomes most pressing underconditions of rapid urban growth, which is likely to in-crease travel demand significantly.l'
Growth in large cities is often accompanied by in-creases in urban poverty. The urban poor, who are oftenunskilled and unable to compete for scarce resources orprotect themselves from harmful environmental condi-tions, are most affected by urbanization, especially indeveloping nations.8 Land development processes tend toserve middle and higher income classes, forcing the poorto settle in high densities on marginal lands within citiesor on the urban periphery. These urban area expansionsoften start as illegal settlements, sometimes in areas at riskfrom environmental hazards (such as floods and land-slides), and without access to basic services (such as waterand sanitation). More than half the population of MexicoCity lives in such settlements."' As the peripheries ofcities enlarge, agricultural land, forests, and wetlands areconsumed. Sand and gravel are excavated and removedfor increased construction; woodlands are depleted forfuel; and rivers, lakes, streams, and coastal waters arepolluted by untreated sewage and runoff.
Urbanization and industrialization have importantconsequences for the Earth's atmosphere.12 Biomass andcoal used for heating and cooking pollute indoor andoutdoor air. Disturbed land, unpaved roads, and construc-tion add to atmospheric dust levels. Transport is oftenaccomplished with old city buses and poorly maintainedtwo-stroke engines operating with adulterated fuels thatare not conducive to passing "smog tests." Undesirableproperties near polluting industries are often settled firstby the economically disadvantaged, further adding totheir atmospheric pollution exposure. The regional andglobal dispersion of pollutants generated locally causesacid deposition, and changes in the Earth's radiation bal-ance. Concerns about tropospheric ozone (03) and par-ticulate matter (PM) have heightened recently becausethe long-range transport of these pollutants influences airquality and its effects on climate are felt in regions farfrom their sources.
Cities create heat islands that can also aggravate pol-lution. Between 1990 and 2000, the average annual tem-perature in Mexico City increased from 14.8 °C to 16.8'C.13 Higher ambient temperatures enhance 03 and somesecondary PM formation. Warmer temperatures in thesummer increase the demand for cooling and electricenergy consumption, leading to yet higher temperaturesin the city.
Deterioration in urban environmental conditions canhave serious effects on human health and welfare, partic-ularly for the poor.14 Air and water pollution causechronic and infectious respiratory and water-borne dis-eases, and result in increased mortality rates.'5-19 How-ever, worldwide epidemiological and demographic infor-mation suggests that survival rates are better in cities thanin rural areas because of better access to health services. 7
Although local environmental problems diminish as cit-ies become wealthier, environmental problems arise onlarger scales. Wealthier urban residents rely heavily onfossil fuels and electricity that create more gaseous, liquid,and solid wastes.2 0
A city's ecological footprint (EF)21 is the biologicalproductive area required to l3roduce the resources used,and to assimilate the wastes generated, by a definedpopulation at a specified standard of living.8 EF is a mea-sure of the biological capacity of the Earth to create newresources and absorb waste. The Earth has -11.4 billionhectares of productive land and sea space; about one-fourth of the Earth's surface area is unproductive. Dividedamong the Earth's 6 billion people in 2000, this equates toan average of 1.9 hectares per person. In 1999, the EF wasless than 1.4 hectares per capita for the average Africanand Asian, 5 hectares for the average western European,and 9.6 hectares for the average North American. Theglobal average EF during 1999 was 2.3 hectares per person,20% more than the 2000 estimate, and a substantial in-crease from the 1961 EF of -1.3 hectares per person. TheEF is likely to grow to 1800/o-220% of the Earth's capacityby 2050,22 clearly an unsustainable situation.
The world's richest countries, with 20% of the globalpopulation, account for 86% of total private consump-tion, whereas the poorest 20% of the world's populationaccounts for just 1.3% of consumption. A child borntoday in an industrialized country will add more to con-sumption and pollution over his or her lifetime than30-50 children born in developing countries. The EF ofwealthier consumers is a major cause for the exceedanceof the Earth's carrying capacity. 2 3 A typical North Amer-ican city with a population of 650,000 people wouldrequire 30,000 kM2 , an area roughly the size of VancouverIsland in Canada, to meet its domestic needs-withoutincluding the environmental demands of industry. Incontrast, a city of the same size in India would require
646 Journal of the Air & Waste Management Association Volume 54 June 2004
Molina and Molina
only 2900 km2.8 However, when properly managed, EFsfrom urban areas can be smaller than those of a similar
number of people in nonurban settings.Cities can concentrate populations in a way that re-
duces land pressure and provides proximity to infrastruc-ture and services.7 ,Z4 Well-planned, densely populated
settlements can reduce the need for land conversion andprovide opportunities for energy savings. Sustainable
development must include 1) appropriate air quality man-
agement plans that include the establishment of adequate
monitoring capabilities for the surveillance of the envi-
ronmental quality and health status of the populations; 2)adequate access to clean technologies, including the pro-vision of training and development of extensive interna-tional information networks; and 3) improvement of datacollection and assessment so that national and interna-tional decisions can be based on sound information.2 5 ,2 6
Urban air pollution is not a new problem, and effec-tive emission reduction strategies are available for most
emission sources. The formulation and implementationof effective integrated air quality management strategieswill be crucial to address this challenge and to protect
human health and welfare, as well as ecosystems.
AIR POLLUTION IN MEGACITIESMegacities often contain high concentrations of PM; 03;sulfur dioxide (SO,); nitric oxide (NO) and nitrogen diox-ide (NO2 ), the sum of which is known as nitrogen oxides(NO,<; carbon monoxide (CO); volatile organic com-pounds (VOCs), and hydrocarbons (HC, a VOC subset).27a
PM is often reported as mass concentration in the totalsuspended particulates (TSP), PM1o, and PM2 .5 (particles
with aerodynamic diameters of less than -40, 10, and 2.5lim, respectively). The major PM chemical components
are sulfate (SO42 -), nitrate (NO3-), ammonium (NH4 '),
organic carbon (OC), elemental carbon, and soil (aweighted sum of mineral elements such as aluminum [Al],silicon [Si], calcium [Ca], titanium [Ti], and iron [Fe]).Long-lived greenhouse gases (GHG) such as carbon diox-ide (CO2 ), methane (CH4 ), and chlorofluorocarbons areimportant on global scales. 27,28
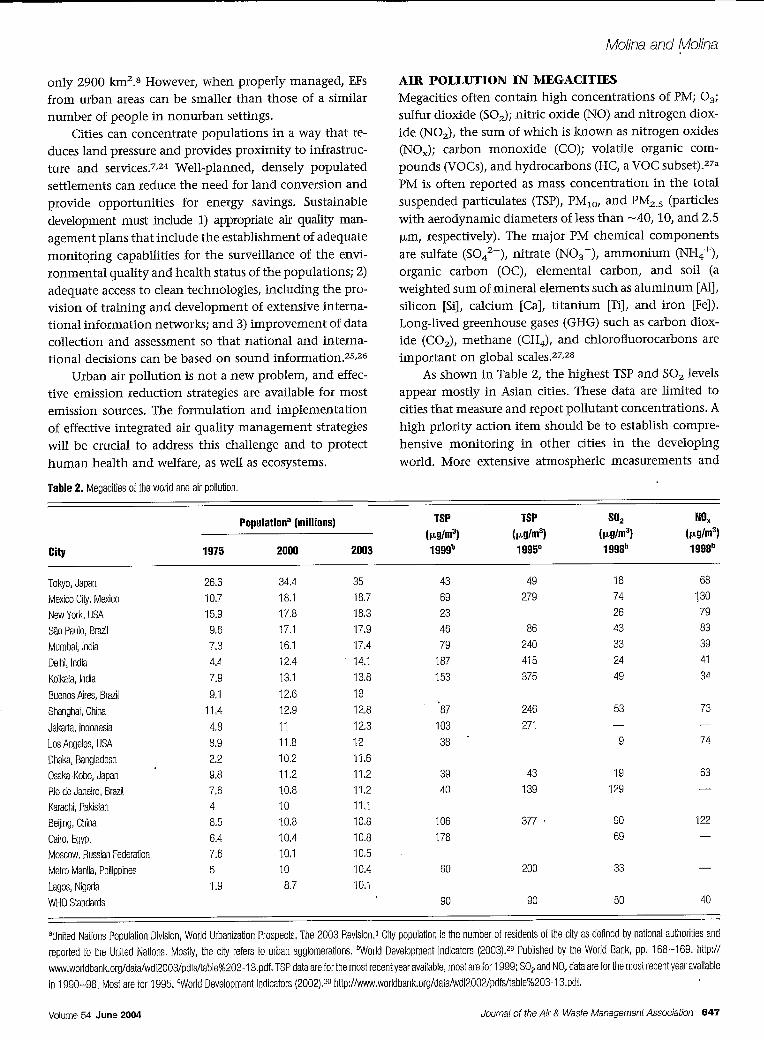
As shown in Table 2, the highest TSP and SO2 levelsappear mostly in Asian cities. These data are limited tocities that measure and report pollutant concentrations. Ahigh priority action item should be to establish compre-hensive monitoring in other cities in the developing
world. More extensive atmospheric measurements and
Table 2. Megacities of the world and air pollution.
Populationa (millions) TSP TSP SO2 NO,(jIg/m
3) (1Lg/m
3) (jig/n
3) (1Lg/M
3)
City 1975 2000 2003 1 99b 1995c 1 gg8b 1 98b
Tokyo, Japan 26.6 34.4 35 43 49 18 68
Mexico City, Mexico 10.7 18.1 18.7 69 279 74 130
New York, USA 15.9 17.8 18.3 23 26 79
Sao Paulo, Brazil 9.6 17,1 17,9 46 86 43 83
Mumbal, India 7.3 16.1 17.4 79 240 33 39
Delhi, India 4.4 12.4 14.1 187 415 24 41
Kolkata, India 7.9 13.1 13.8 153 375 49 34
Buenos Aires, Brazil 9.1 12.6 13
Shanghai, China 11.4 12.9 12.8 87 246 53 73
Jakarta, Indonesia 4.8 11 12.3 103 271 - -
Los Angeles, USA 8.9 11.8 12 38 9 74
Dhaka, Bangladesh 2.2 10.2 11.5
Osaka-Kobe, Japan 9,8 11.2 11.2 39 43 19 63
Rio de Janeiro, Brazil 7.6 10.8 11.2 40 139 129
Karachi, Pakistan 4 10 11.1
Beijing, China 8.5 10.8 10.8 106 377 90 122
Cairo, Egypt 6.4 10.4 10.8 178 69
Moscow, Russian Federation 7.6 10.1 10.5
Metro Manila, Philippines 5 10 10.4 60 200 33
Lagos, Nigeda 1.9 8.7 10.1
WHO Standards 90 90 50 40
alUnited Nations Population Division, World Urbanization Prospects, The 2003 Revision, City populabon is the number of residents of the city as defined by national authorities and
reported to the United Natons. Mostly, the city refers to urban agglomerations. VWorld Development Indicators (2003).29 Published by the World Bank, pp. 168-169. http://
www,worldbank.org/data/wdi2003/pdfs/table%203-1 3.pdf. TSP data are for the most recent year available, most are for 1999, S02 and NO, data are for the most recent year available
in 1990-98, Most are for 1995. "World Development Indicators (2002).30 http://www,worldbank.org/data/wdi2002/pdfs/table%203- 13.pdf.
Journal of the Air & Waste Management Association 647VolumeP 54 June 2004
Molina and Molina
modeling are needed to define optimal emission controlstrategies. Policy-makers should use this information tobalance the economic and social benefits of health im-provements against the costs of emission control. In prac-tice, because of large uncertainties in air pollution andhealth effects science, measurements and air quality mod-els are best used to help prioritize controls on differentprimary emitters to achieve various air quality improve-ment goals.
Some pollution control decisions are easy. Exposureto SO2 and So4
2 - from burning coal was identified duringLondon's "killer smog" events in the 1940s and 1950s,which were correlated with increased sickness and death.Switching to low-sulfur fuels improved this situation.Nevertheless, areas with high sulfur levels remain in someregions of the developing world. Determining the causesof high PM and 03 concentrations is not as straightfor-ward. NO. and VOCs, much of which are emitted by thetransportation sector, are transformed in the presence ofsunlight to produce 03, nitric acid (HNO3), and otheroxidants in a complex series of chemical reactions. Thesereactions also generate secondary PM organic com-pounds, N03- and So4
2 -. The relationship between NO.,VOCs, and 03 is nonlinear: fresh emissions of NO destroy03. High levels of NO2 scavenge hydroxyl (OH) radicals,the reactive spp. that initiate the breakdown of VOCs.Reductions of NO. or VOC emissions may have little orno effect on, or may even increase, 03 concentrations.
The application and validation of air quality modelsrequires spatially and temporarily resolved emissions dataas well as knowledge of the meteorology (including solarradiation). In addition to commonly measured O3, NO,NO2, CO, and PM mass, individual VOCs and PMchemical compositions are needed. This detailed informa-tion is rarely available, however. Special studies areneeded in megacities to better understand the causes ofsuch emissions and to measure progress in limiting them.The following measurements from special studies in Mex-ico City demonstrate useful techniques that could be ap-plied in other megacities:
* Routine hourly measurements of PM1 o, 03, NO,NO2 , and CO acquired from the Mexican Auto-matic Air Quality Monitoring Network (Red Auto-mdtica de Monitoreo Atmosferico) provide a long-term record to determine the temporal andspatial characteristics of air pollution.
* Remote sensing of emissions from individual ve-hicles, obtained from absorption spectra of IRand UV light projected through the exhaustplume, quantifies NO, CO, CO2, and HC. Thesetests indicated that 4% of the automobiles con-tributed 30% of the tailpipe HC emissions, and25% of the vehicles contributed 50% of the CO
emissions in 1991.31 Most vehicles emitted 3-6%CO, suggesting that they were deliberately tunedfor power without regard for emission reduc-tions. Similar measurements in 1994 showed-50% decrease in average CO and HC emissions,demonstrating the effectiveness of catalytic con-verters required on cars sold after 1991.32
Remotely-sensed emissions in 200033 foundhigher emissions in lower income areas of thecity. Nevertheless, average vehicle emissions de-creased by 70% for CO and 90% for HC relative to1991 values. For all these spp., the median emis-sion is notably less than the average, which oc-curs because a fraction of vehicles have highemissions and thus disproportionately impactthe average emissions. Past data shows that emis-sions of CO and HC decrease sharply after 1988,and NO. emissions decrease sharply for cars man-ufactured after 1992.
* PAHs originate from emissions of motor vehicles,oil refineries, forest fires, and cooking. PAH con-centrations along Mexico City roadways rangefrom 60 to 910 ng/m3 .34 These levels are approx-imately five times higher than concentrationsmeasured in the United States and are among thehighest measured ambient values reported. Thelarge concentrations are likely due to a combina-tion of old diesel-powered vehicles and the city'srelatively dirty light-duty vehicle fleet, half ofwhich lacked catalytic converters in 2003.
* In the spring of 2003, an MIT-led multinationalteam of experts conducted an intensive, five-weekfield campaign in the MCMA. The overall goal is tocontribute to the understanding of the air qualityproblem in megacities by conducting measure-ments and modeling studies of atmospheric pollut-ants in the MCMA and to provide a scientific basefor devising emissions control strategies.
EFFECTS OF EXCESSIVE POLLUTION INMEGACITIESEmissions and ambient concentrations of pollutants inmegacities can have widespread effects on the health oftheir populations, urban and regional haze, and ecosys-tem degradation. Impacts on health, visibility, regionalecosystem (including acid and fixed nitrogen deposition,photochemical oxidant damage, and photosyntheticallyactive radiation), regional climate change, and global pol-lutant transport are evaluated.
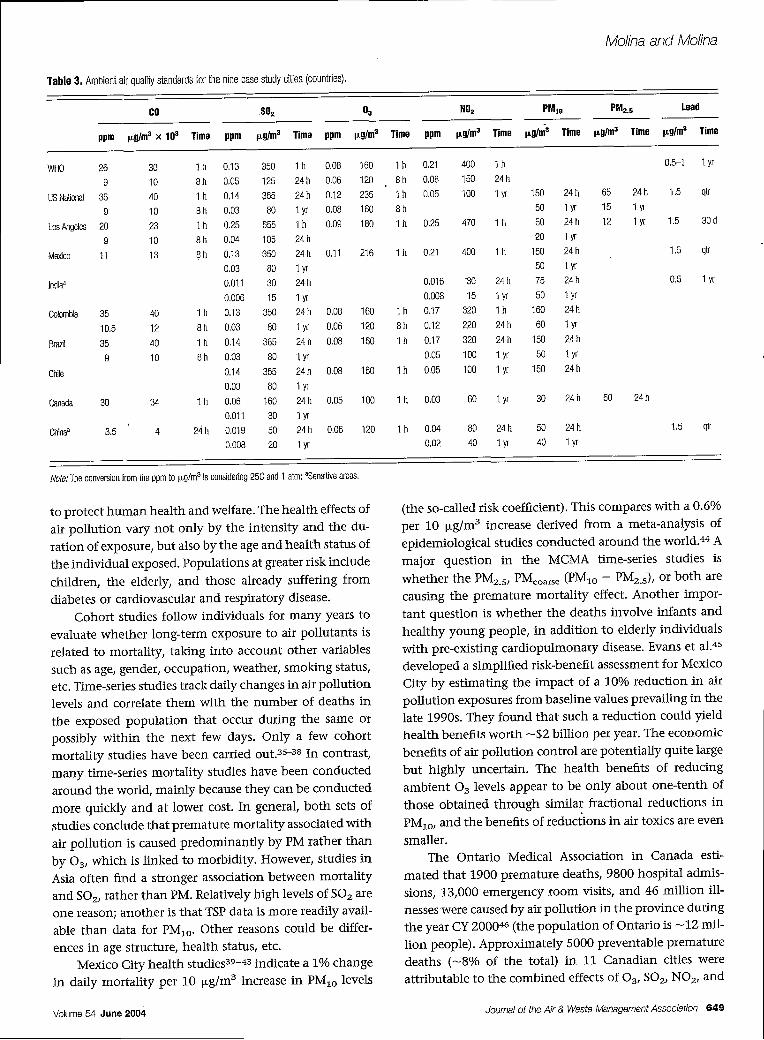
Adverse Health ImpactsTable 3 lists recommended air quality values set by vari-ous countries and the World Health Organization (WHO)
648 Journal of the Air & Waste Management Association Volume 54 June 2004
Molina and Molina
Table 3. Ambient air quality standards for the nine case study cites (countries),
Co So, 0° NO2 PM1, PM,, Lead
ppm iglm3 x 103 Time ppm Lg/m3 Time ppm g/m3 Time ppm 1Lg/m 3 Time LgIm
3 Time iiglm3 Time Ligi/m Time
WHO 26 30 1 h 0.13 350 1 h 0.08 160 1 h 0.21 400 1 h 0.5-1 1 yr
9 10 8h 0.05 125 24h 0.06 120 8h 0,08 150 24h
USNational 35 40 1h 0,14 365 24h 0.12 235 1h 0.05 100 1yr 150 24h 65 24h 1.5 qtr
9 10 8 h 0.03 80 1 yr 0.08 160 8 h 50 1 yr 15 1 yr
LosAngeles 20 23 1h 0.25 655 1h 0.09 180 1h 0.25 470 1h 50 24h 12 1 yr 1.5 30d
9 10 8h 0.04 105 24h 20 1 yr
Mexdco 11 13 Sh 0.13 350 24h 0.11 216 1 h 0.21 400 1 h 150 24h 1.5 qtr
0.03 80 1 yr 50 1 yr
tndiaa 0.011 30 24h 0.016 '30 24h 75 24h 0.5 1 yr
0.006 15 1 yr 0.008 15 1 yr 50 1 yr
Colombia 35 40 1 h 0.13 350 24h 0.08 160 1 h 0.17 320 1 h 160 24h
10.5 12 8h 0.03 80 1 yr 0.06 120 8h 0.12 220 24h 60 1yr
Brazil 35 40 1 h 0.14 365 24h 0.08 160 1 h 0.17 320 24h 150 24h
9 10 8 b 0.03 80 1 yr 0.05 100 1 yr 50 1 yr
Chile 0.14 365 24h 0.08 160 1 h 0.05 100 1 yr 150 24h
0.03 80 1 yr
Canada 30 34 1 h 0.06 160 24h 0.05 100 1 h 0.03 60 1 yr 30 24h 50 24h
0.011 30 1 yr
Chinaa 3.5 4 24h 0.019 50 24h 0.06 120 1 h 0.04 80 24h 50 24h 1.5 qt
0.008 20 1 yr 0.02 40 1 yr 40 1 yr
Note: The conversion from the ppm to p.9/M3iS considering 25C and 1 atm: 'Sensitive areas.
to protect human health and welfare. The health effects of
air pollution vary not only by the intensity and the du-
ration of exposure, but also by the age and health status of
the individual exposed. Populations at greater risk include
children, the elderly, and those already suffering from
diabetes or cardiovascular and respiratory disease.
Cohort studies follow individuals for many years to
evaluate whether long-term exposure to air pollutants is
related to mortality, taking into account other variables
such as age, gender, occupation, weather, smoking status,
etc. Time-series studies track daily changes in air pollution
levels and correlate them with the number of deaths in
the exposed population that occur during the same or
possibly within the next few days. Only a few cohort
mortality studies have been carried out.35 -3 8 In contrast,
many time-series mortality studies have been conducted
around the world, mainly because they can be conducted
more quickly and at lower cost. In general, both sets of
studies conclude that premature mortality associated with
air pollution is caused predominantly by PM rather than
by 03, which is linked to morbidity. However, studies in
Asia often find a stronger association between mortality
and SO2, rather than PM. Relatively high levels of SO2 are
one reason; another is that TSP data is more readily avail-
able than data for PM1 o. Other reasons could be differ-
ences in age structure, health status, etc.
Mexico City health studies39 -4 3 indicate a 1% change
in daily mortality per 10 [Jg/m 3 increase in PM1 0 levels
(the so-called risk coefficient). This compares with a 0.6%
per 10 Rg/m 3 increase derived from a meta-analysis of
epidemiological studies conducted around the world. 44 A
major question in the MCMA time-series studies is
whether the PM 2, 5 , PMcoarse (PM1 0 - PM2,.), or both are
causing the premature mortality effect. Another impor-
tant question is whether the deaths involve infants and
healthy young people, in addition to elderly individuals
with pre-existing cardiopulmonary disease. Evans et al.45
developed a simplified risk-benefit assessment for Mexico
City by estimating the impact of a 10% reduction in air
pollution exposures from baseline values prevailing in the
late 1990s. They found that such a reduction could yield
health benefits worth -$2 billion per year. The economic
benefits of air pollution control are potentially quite large
but highly uncertain. The health benefits of reducing
ambient 03 levels appear to be only about one-tenth of
those obtained through similar fractional reductions in
PM1o, and the benefits of reductions in air toxics are even
smaller.The Ontario Medical Association in Canada esti-
mated that 1900 premature deaths, 9800 hospital admis-
sions, 13,000 emergency room visits, and 46 million ill-
nesses were caused by air pollution in the province during
the year CY 200046 (the population of Ontario is -12 mil-
lion people). Approximately 5000 preventable premature
deaths (-8% of the total) in 11 Canadian cities were
attributable to the combined effects of 03, SO,, NO2 , and
Journal of the Air & Waste Management Association 649Volume 54 June 2004
Molina and Molina
CO.47 Other studies in 1995 estimated that pollutioncaused 1000 premature deaths and 5500 hospital admis-sions in the Greater Toronto area, 4 8 and 298 prematLiredeaths and 539 hospitalizations in Hamilton.4 9 Thenumber of deaths in the Greater Toronto area believed tobe caused by air pollution was comparable to that causedby lung cancer (1048) and stroke (1347). Sahsuvarogluand Jerret50 reported 374 deaths, 607 respiratory hospitaladmissions, and 2000 cardiac hospital admissions inHamilton during 1997 due to air pollution.
In Delhi, India, Pande et al.51 found increases of morethan 20% in chronic obstructive pulmonary disease(COPD) and acute coronary events attributable to air pol-lution. Cropper et al.52 found a significant relationship inDelhi between PM pollution and daily nontraumaticdeaths, as well as deaths from certain causes (e.g., cardio-vascular and respiratory diseases). On average, a 100FLg/m3 increase in TSP was associated with a 2.3% increasein mortality. Although air pollution in Delhi appears tohave less impact on mortality, the number of life-yearssaved per-death-avoided is greater in Delhi than in U.S.cities. In U.S. cities, PM has its greatest influence on dailydeaths among people 65 years and older, whereas in Delhithe largest impact occurs in the 15-44 age group. Thisimplies that, on average, for each avoided death associ-ated with air pollution, more life-years would be saved inDelhi than in U.S. cities.
In Beijing, China, Xu et al.53 found a significant as-sociation between SO2 levels and daily mortality through-out the year. The mortality risk was estimated to increaseby 11% with each doubling in SO2 concentrations (aver-ages were 120 and 67 tg/m3 in 1998 and 2002, respec-tively). A significant association was also found betweenTSP and mortality by Xu et al. 53 Dong et al. 55 found astatistically significant association between air pollutionlevels and daily mortality during 1990 and 1991. Theinfluence of TSP on patients with cardiovascular diseaseand of SO2 on patients with respiratory disease was greaterthan that on other patients. The air pollutants were espe-cially harmful to patients older than 65. Zhang et al.5 6
observed statistically significant correlations betweenso42- concentrations and mortality from all causes, aswell as on mortality because of cardiovascular disease,malignant tumors, and lung cancer. Zhang et al.57 showeda significant association of the air quality index withmortality, especially in the winter and among those 55years and older with COPD and other respiratory diseases.Similar findings, reported by Chang et al.,5 8 showed anincrease of -20% in mortality from COPD for an SO2increase of 100 p,g/m' and of -3% in respiratory deathsfor a TSP increase of 100 pg/m'3.
Xu et al.5 4 collected 1990 data from a community-based hospital in Beijing to assess the association of air
quality with daily nonsurgery outpatient visits, and foundsignificant associations with both SO 2 and TSP levels.Chang et al.59 also found significant associations betweenair pollutant concentrations and outpatient visits forcolds, pneumonia, and bronchitis for children in Beijingfrom 1998 to 2000. Wang et al. 6 0 found a significantassociation with SO, and NO2. Zhang et al.61 attributed adecrease in the levels of vital capacity and max voluntaryventilation to high TSP and NO, levels. Xu et al.6 2 re-ported that long-term exposure to high levels of TSP andSO2 in Beijing was correlated with significantly reducedpulmonary function in adults; the associations werestronger among smokers than nonsmokers. Exposure toTSP and S02, or to a more complex pollution mixture,appears to contribute to excess risk of preterm delivery inBeijing. In a prospective cohort study,63 all pregnantwomen living in four residential areas of Beijing wereregistered and followed from early pregnancy until deliv-ery. Xu et al.63 found a significant dose-dependent asso-ciation of gestational age with TSP and SO2 concentra-tions.
In Santiago, Chile, Sanhueza et al.64 found that PM,,has the strongest association with premature mortality,with lower associations for 03 and SO2 . Using dailycounts of nonaccidental deaths in Santiago from 1988 to1996, Cifuentes et al.6 5 found a significant associationbetween mortality and PM levels, with finer particles be-ing more important than coarse particles. The concentra-tion of PAHs and the mutagenicity of airborne particles inSantiago have been investigated and compared with thosein Tokyo.66 Ochoa and Roberts67 reported the estimatedcancer risks posed by exposure to suspended PM in San-tiago. Ilabaca et al.68 investigated the association betweenPM2 .5 and hospital visits for pneumonia and other respi-ratory illnesses among children. These studies demon-strate the adverse effect of pollution on human health.
In Sao Paulo, Brazil, Saldiva et al.6 9 found significanteffects of PM on respiratory functions in children. Anincrease in the mortality of elderly people in Sao Pauloassociated with high PM,0 levels has also been docu-mented.7 0 ,71
Visibility ImpairmentThe connection between air pollutants and visibility im-pairment is related mostly to PM2 5 concentrations, but itis often accompanied by high levels of other pollutants.7 2
Urban haze is the most commonly perceived effect ofexcessive concentrations. In Beijing, China, visibility isoften low, in part because of the relatively high frequencyof foggy days. Nevertheless, the sky overhead is almostalways gray, even in the absence of fog or clouds. Berginet al.73 concluded that during June 1999, combustion-related particles rather than wind-blown dust were mainly
650 Journal of the Air & Waste Management Association Volume 54 June 2004
Molina and Molina
responsible for visibility degradation. It is well docu-
mented that Asian sand storms and dust cause poor visi-
bility during the spring.74 Song et al.75 developed regression
equations to estimate visual range as a function of PM2.5
mass concentration.In Ontario, Canada, the visual range without the
effect of anthropogenic PM is estimated to be between 86
and 120 km; visual range decreases to between 35 and 50
km in the presence of PM. These calculations were based
on average 24-hr PM 2.5 or PM, 0 levels; the results vary
with the season, changing PM concentrations, and rela-tive humidity levels.76
In Santiago, Chile, the study of air pollution startedaround 1980, when researchers noticed unusually hazydays during winter. These studies were related to TSP and
its chemical characterization. 7 7 -1' Trier and Silva 82 mea-
sured the optical properties of PM in Santiago and foundhigh extinction and absorption coefficients. Trier andHorvath 83 found high daily variability in the extinction
coefficient, from 0.018 km-' in the morning to 0.15
km-' in the afternoon, attributing this result mainly to a
change in the mixing height and finding a high correla-tion with TSP levels. Trier and Firinguetti8 4 performed a
time-series investigation of visibility. Horvath et al.85
found high variability in optical absorption coefficient on
a time scale of a few hours because of changes in meteo-rological conditions. Concentrations between 1.3 and 25
,ag/mi of black carbon (BC) were estimated on the basis ofobserved light absorption. Gramsch et al.86 reported a
strong correlation between optical absorption coefficientsand traffic patterns in Santiago. Maximum absorptioncoefficient often occurs during the morning rush hour(7:00-8:00 a.m.), with the lowest value found either early
in the morning (3:00-5:00 a.m.) or in the afternoon
(2:00-5:00 p.m.). The absorption coefficient also shows a
strong seasonal dependence, with values 10-20 times
higher in winter than in summer. Most of the absorption
is attributed to BC, mainly from vehicle exhaust. Using a
low-cost optical instrument, Gramsch et al.87 compared
the absorption coefficient with PM and carbon concen-
trations.A "black cloud" has often appeared above the Nile
Delta and Cairo, Egypt, during October. 8 8' 89 After the rice
harvest, farmers burn rice straw to clear fields for the next
crop. There is a prevalent upper-air high pressure systemover the Nile Delta during such episodes. Nighttime
cloudless skies also contribute to a decrease in surface
temperature, leading to a steep thermal inversion.9 0 Aerial
photoreconnaissance identified the locations and inten-
sities of the emissions.91 Straw building has been encour-
aged as an alternative use for rice straw that minimizes
vegetative combustion. 9 2
I .ARegional Ecosystem ImpactsAcid and Fixed Nitrogen Deposition. The detrimental im-pacts of acids that form from SO2 and NO, emissions onsensitive lakes, streams, forests, and farmlands have beenwell documented. 9 3 A related issue involves fertilizationeffects caused by the deposition of airborne fixed nitrogenspp. (PM NH4+ and NO3
2 - and their gas phase precursors)to buffered soils and surface waters that are not suscepti-ble to acidification. Combined with fixed nitrogen andphosphorous from fertilizer, animal waste, and humansewage sources, atmospheric deposition of fixed nitrogencan over-fertilize soils, lakes, streams, and estuaries, lead-ing to changes in primary productivity and, potentially,to eutrophication. 9 4 Atmospheric nitrogen deposition caneven affect the ocean by stimulating phytoplanktonblooms.95 -97 High levels of fixed nitrogen deposition canhave significant effects on ecosystem diversity, even whendeposition receptor areas are not heavily acidified. Forinstance, Stevens et al.98 report that British grasslandssubject to long-term chronic levels of nitrogen depositionhave significantly lower levels of spp. diversity than thoseexposed to lower deposition rates; at average depositionrates of 17 kg N ha-' per year for central Europe, a 23%reduction in plant spp. was found.9 8 As the number of
motor vehicles in developing world megacities increases,NO, emissions will increase dramatically;9 9 consequently,the impact of fixed nitrogen deposition on downwindecosystems can be expected to rise rapidly.
Photochemical Oxidant Damage. Photochemically pro-duced oxidants and their precursors frequently producehigh levels of 03 and other oxidants that transport fromone major city to the next, subjecting the interveningsuburbs, forests, and agricultural areas to high oxidantexposures.9 9 100 Exposure to 03 and related photochemi-cal oxidants is known to damage both native and agricul-
tural vegetation.10 0 03 damage may affect crop yields inagricultural areas impacted by emissions from majorcities in China.'101 10 3 Model calculations predict semi-
continental to continental-scale plumes of high summer03 associated with urban and industrial emissions fromthe urban complexes in the midwestern and easternUnited States, western and central Europe, and EastAsia.104
Gregg et al.' 0s report greater plant growth in NewYork City compared with a rural environment and at-tribute the effect to the higher 03 levels in the rural area.Fenn et al.106 document the significant damage to forestssurrounding the Mexico City air basin caused by exposure
to high levels of photochemical oxidants, mainly 03.
PhotosyntheticallyActiveRadiation. Recentmodelanalysesdemonstrate the impact of Asian megacity SO2 emissions on
Journal of the Air & Waste Management Association 651Volume 54 June 2004
Molina and Molina
regional pollution. High SO2 and other gaseous precursorscan result in high levels of fine PM, with absorption andscattering properties that significantly influence both thedirect and diffuse components of photosynthetically activeradiation.'0 7 In fact, the resulting haze over eastern Chinahas decreased solar radiation reaching the surface since1954.108 Attenuation of photosynthetically active radia-tion by both atmospheric PM and by PM deposited onplant leaves may significantly impact the solar radiationavailable for photosynthesis in agricultural regions inChina.102,109
Regional Climate ChangeEmissions from megacities may also play a role in regionalclimate impacts. High levels of GHG associated with ma-jor cities2 7 have a direct impact on IR radiative forcingglobally."10 Furthermore, the powerful but shorter-livedtropospheric 03 will have a more pronounced regionaleffect. 104
Fine PM can have a direct effect on short wavelengthradiative forcing by scattering and/or absorbing solar ra-diation. Satellite observations show an albedo reductionbecause of absorbing aerosols and their impact on cloudabsorbance over urbanized regions in China."'
Surface temperature records in urbanized regions ofChina'0 8 "112,113 and India"13 show a measurable coolingsince the 1950s. Analyses of meteorological data inheavily urbanized regions of China demonstrate signifi-cant downward trends in both sunshine duration (1% to3% per decade) and max daily temperatures (0.2-0.6 °Cper decade).' 0 8,112 The observed cooling trends are consis-tent with the predicted effects of elevated soot levels infine PM,113 and are achieved despite a general warmingobserved for most of the globe over the same time period.
High PM loadings that increase the number of effec-tive cloud condensation nuclei can also influence precip-itation levels by lengthening cloud lifetimes and sup-pressing rain and snow as a result of nucleating more, butsmaller, cloud droplets. Satellite observations show signif-icant rainfall suppression downwind of major cities.114
High PM loadings with a large fraction of absorbing sootparticles are predicted to reduce cloudiness by absorptiveheating of cloud particles,' 15 although the impact oncloud cover may also be affected by the increased atmo-spheric circulation."13
Yet another consequence of long-range transport.in-volves impacts on urban populations of sand, dust orsmoke that originate beyond the urban centers, giving riseto episodic pollution events. For example, dust and sandstorms that originate in the dry regions of northern Chinaand Mongolia and blow across parts of China, the Koreanpeninsula, and Japan are now taking place nearly fivetimes as often as in the 1950s. These dust storms are also
growing in intensity, and occur during the spring monthsas cold air masses from Siberia whip deserts and soils east-ward after the dry continental winter.' 58 In April 2002,dust levels in Seoul-1200 km from their source-reached2070 aig/m'. The effects in Beijing are also striking.159 '16 0
Between 1994 and 1999, the Gobi Desert in China ex-panded by 52,400 km2 , moving closer to Beijing. Up to400 million people are threatened by the fast-advancingdeserts. Nearly 30% of China's land area is affected bydesertification caused by over-farming, grazing, and de-forestation. The annual direct economic losses are esti-mated to be around $6 billion. China, Mongolia, Japan,and South Korea are pooling their efforts to reduce theimpact. Backed by the U.N. Environmental Program, theGlobal Environment Facility, the Asian DevelopmentBank, the U.N. Economic and Social Commission for Asiaand the Pacific, and the U.N. Convention to CombatDesertification, they are setting up a monitoring and earlywarning system for dust and sand storms, which is aimedat standardizing data collection and sharing informationthroughout the region.
Global Pollutant TransportSatellite, aircraft, and ground-based observations through-out the global atmosphere are confirming model simula-tions that air pollution can be transported over long dis-tances, for example, from eastern Asia to the westernUnited States, from North America to Europe, and frommid-latitudes to the Arctic.116 -12 0 Tropospheric oxidants,changes in precipitation chemistry, and reduced visibilityare already significant environmental issues in much ofthe industrial Northern Hemisphere.i01,12l,1 22 Globally,current levels of pollution-related tropospheric PM and03 are significant contributors to the atmospheric "green-house" radiation budget.'23-127 Long-term changes inglobal OH concentrations, and therefore in the atmo-spheric residence times of many gases, are a matter ofgreat interest but remain highly uncertain.' 2 8 ,12 9
Recent field campaigns have studied pollutants inthe remote troposphere,"30-133 the outflow from EastAsia,13 4-'43 the Indian subcontinent,' 4 3 and North Amer-ica.' 44 -148 Several regional-scale studies have been carriedout in the United States' 4 9-'53 and Europel 54 -157 thatdemonstrated the enormous pollutant potential of majorcites and "megalopolis" regions, as well as the fact thatsignificant quantities of gaseous pollutants and fine par-ticles can be transported and detected over intercontinen-tal scales. These insights have erased the distinction be-tween air quality (long thought to be a local- to regional-scale issue) and global atmospheric chemistry (focused onconcems about GHG-induced climate change, stratospheric03 depletion, and tropospheric oxidative capacity). It isnow clear that the gaseous pollutants and fine particles
652 Journal of the Air & Waste Management Association Volume 54 June 2004

Molina and Molina
dispersed from heavily polluted regions may have signif-icant impacts on continental to global scales.2 8
,117
However, to date, relatively few measurements havebeen carried out on the polluted outflow from megacitiesin tropical and subtropical latitudes. Given the high
growth rates and rapid industrialization and motorizationof these megacities of the developing world,27 it is likely
that regional and even intercontinental transport of pol-
lutants at low latitudes will grow rapidly, posing an evengreater challenge.
AIR QUALITY CASE STUDIES IN MEGACITIESAir quality in nine urban centers is summarized below to
identify similarities and differences among the problemsthat are important to megacities throughout the world.
The combined effect of natural and anthropogenic emis-
sions (e.g., industrial, vehicle exhaust, vegetative burning,
cooking, and resuspended dust), topographic features,and meteorology result in significant environmental deg-
radation.
South Coast Air Basin, Los Angeles, CaliforniaThe Los Angeles metropolitan area is the second-mostpopulated urban area in the United States, after the NewYork metropolitan area. The multi-county South CoastAir Basin (SoCAB) is bordered by mountains on the eastand north, and by the Pacific Ocean on the west andsouth. The area of the basin is -17,500 km2 with a pop-
ulation of 16 million. During summer, the SoCAB is oftenunder the influence of a large-scale subsidence inversion
that traps a layer of cool marine air. Pollutants emittedfrom various sources are pushed inland during the day byan on-shore breeze. Approximately 10 million gasolinevehicles and 250,000 diesel vehicles travel in the SoCAB,which (in conjunction with other emitters) results in poorair quality.161 PM,O has decreased over the last decade.Similarly, CO concentrations have been reduced. Peak 03
for Los Angeles has decreased from 500 ppb in 1980 to lessthan 200 ppb in 2000, and the number of days above 03standard has declined since 1975. However, 03 concen-trations have recently leveled and may even be increasingas a result of population growth, additional vehicle kilo-meters traveled, and increased sales of low-economy sportutility vehicles.'6 2 Nevertheless, federal and/or state stan-
dards were exceeded during 2002 at one or more monitorsfor PM,,, PM 2, 5 , 03, NO2, and CO, particularly in thespring and summer.162 a As other emissions are controlled,nonroad emissions of PM2, 5 are exceeding on-roademissions. Dust from paved and unpaved roads is also alarge emitter. Motor vehicles are the largest source ofVOCs, but solvent evaporation, an area-wide source, ac-counts for 20% of VOC emissions. 162 b NO, emissions aredominated by on-road emissions because the SoCAB
contains few large, stationary sources and requires strin-gent controls on those that remain.
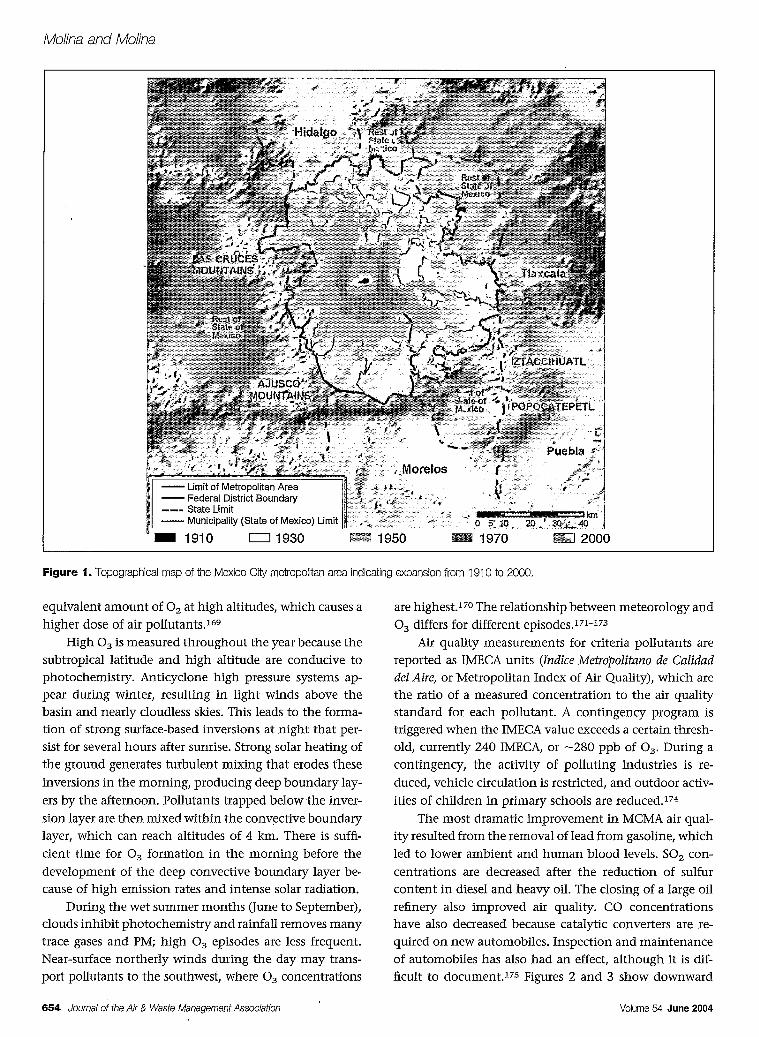
Mexico City Metropolitan Area, MexicoThe MCMA attracted migrants from other parts of thecountry because of fast economic growth as the nationbegan to industrialize. The population grew rapidly, from3 million in 1950 to 18 million in 2000, and occupiedland increasingly far from the historic center. In the lasthalf-century alone, the urbanized area of the region hasincreased by 13 times, from just 118 km2 in 1940 toalmost 1500 km2 in 1995 (see Figure 1). The expansionpushed the city beyond the Federal District and into othermunicipalities of the State of Mexico, as well as into someparts of the State of Hidalgo." Current and projectedpopulation growth stresses the urban environmental bal-ance. 163 -165 The MCMA population density of 12,200 in-habitants/km 2 in 2000 is among the largest in the world,
but it is exceeded, for example, by the Asian cities ofMumbai, Kolkata, and Hong Kong.'6 6 Densities have alsofluctuated in response to the sporadic efforts of the Stateof Mexico to control irregular settlement expansion.16 6
Population growth has also generated extraordinary de-mand for transportation, health services, and housing.'6 7
The MCMA lies in an elevated basin at an altitude of2240 m above the mean sea level (MSL). The nearly flatbasin covers -5000 km2 of the Mexican Plateau and isconfined on three sides (east, south, and west) by moun-
tain ridges, with a broad opening to the north and a
narrower gap to the south-southwest. The surroundingridges vary in elevation, with several peaks reaching
nearly 4000 m, but the air basin is at 800-1000 m. Twomajor volcanoes, Popocatepetl (5452 m) and Ixtaccihuatl(5284 m), are on the mountain ridge southeast of thebasin. The metropolitan area is on the southwest side ofthe basin and covers -1500 km
2 .167
The MCMA's large population, 35,000 industries, 3.5million vehicles, complex topography, and meteorologycause high pollution levels. The mountains, together withfrequent thermal inversions, trap pollutants within thebasin. The high elevation and intense sunlight also
contribute to photochemical processes that create 03 andother secondary pollutants. More than 40 million L of
fuel consumed.per day produce thousands of tons ofpollutants. Air pollution is generally worst in the winter,
when rain is less common and inversions more frequent.Owing to the high altitude, MCMA air contains
-23% less oxygen (02) than at sea level. Consequently,internal combustion engines need to be carefully tuned tothe proper 0 2-to-fuel ratio to minimize inefficient com-bustion and increased emissions.31 ,16 8 People at higher
altitudes are more susceptible to respiratory ailmentsthan those at sea level. More air must be inhaled for an
Journal of the Air & Waste Management Association 653Volume 5;4 June 2004
Molina and Molina
�t �'I,.
- mit of Metropolitan Area- Federal District Boundary--- State Limit- Municipality (State of Mexico) Limit
_ 1910 =E 1930
195 0 ME - 1 Puebla 19-0
.Koeo ( ;-
I I
111 1950 Ci 1970 *. 2000
Figure 1. Topographical map of the Mexico City metropolitan area indicabng expansion from 1910 to 2000.
equivalent amount of 02 at high altitudes, which causes ahigher dose of air pollutants.169
High 03 is measured throughout the year because thesubtropical latitude and high altitude are conducive tophotochemistry. Anticyclone high pressure systems ap-pear during winter, resulting in light winds above thebasin and nearly cloudless skies. This leads to the forma-tion of strong surface-based inversions at night that per-sist for several hours after sunrise. Strong solar heating ofthe ground generates turbulent mixing that erodes theseinversions in the morning, producing deep boundary lay-ers by the afternoon. Pollutants trapped below the inver-sion layer are then mixed within the convective boundarylayer, which can reach altitudes of 4 km. There is suffi-cient time for 03 formation in the morning before thedevelopment of the deep convective boundary layer be-cause of high emission rates and intense solar radiation.
During the wet summer months (June to September),clouds inhibit photochemistry and rainfall removes manytrace gases and PM; high 03 episodes are less frequent.Near-surface northerly winds during the day may trans-port pollutants to the southwest, where 03 concentrations
are highest.17 0 The relationship between meteorology and03 differs for different episodes.17 1-17 3
Air quality measurements for criteria pollutants arereported as IMECA units (Indice Metropolitano de Calidaddel Aire, or Metropolitan Index of Air Quality), which arethe ratio of a measured concentration to the air qualitystandard for each pollutant. A contingency program istriggered when the IMECA value exceeds a certain thresh-old, currently 240 IMECA, or -280 ppb of 03. During acontingency, the activity of polluting industries is re-duced, vehicle circulation is restricted, and outdoor activ-ities of children in primary schools are reduced. 17 4
The most dramatic improvement in MCMA air qual-ity resulted from the removal of lead from gasoline, whichled to lower ambient and human blood levels. SO 2 con-centrations are decreased after the reduction of sulfurcontent in diesel and heavy oil. The closing of a large oilrefinery also improved air quality. CO concentrationshave also decreased because catalytic converters are re-quired on new automobiles. Inspection and maintenanceof automobiles has also had an effect, although it is dif-ficult to document.17 5 Figures 2 and 3 show downward
654 Journal of the Air & Waste Management Association Volume 54 June 2004

Molina and Molina
Figure 2. Trends in 03, NO2, CO, and SO2 concentrations for the MCMA showing the averages of data at five representative RAMA sites. (Source: INE,
2004, Almanaque de Datos y Tendencias de la Calidad del Are en Ciudades Mexicanas.)
trends for most pollutants, but PM-,, 03, and NO2 are not
decreasing as rapidly as desired. The PM,o and 03 stan-
dards are the ones most often exceeded in the MCMA.
Emission inventories have been developed in the
MCMA since 1986.176-178 VOC-to-NO, M ratios are -3:1
ppbC/ppbNO in the inventory, but they are 15:1 or
higher in ambient air.17 4 This is consistent with inaccu-
rate emission models that were discovered in California in
the early 1990s.179-182 More recent emission invento-
ries 33,18 3-187 have been developed. Table 4 shows the
emission inventory for the year 2000. There are substan-
tial differences in the emission inventory reported in the
different years. These can be explained partly by changes
in emissions over time, but they are more likely the result
of differences in emission inventory methodology.174
Greater Toronto Area and Central OntarioRegion, Canada
Ontario is Canada's most populated region and its third
largest province, covering -1 million km2 .188 The Central
Ontario Region (COR) extends from Long Point in the
south, through the Niagara, Hamilton, and Waterloo Re-
gions, to the east of the Greater Toronto area (GTA). The
area is bounded by Lakes Ontario and Erie to the south.
In 2003, the total population of Canada was 31.6 mil-
lion, with 12.1 million in Ontario, 7.3 million in the COR,
and 5.4 million in the GTA.189,1
90 The population growth
rate of the COR is estimated to be -1.5% from 2000-2010,
with a population density of -50 inhabitants/km2 . The GTA
has an average population density of 3000-4000 inhabit-
ants/km2 with a max of 6700 inhabitants/km2.1'9
The climate in the COR is one of the mildest of any
region of Canada, which has contributed to the area's
industrialization and habitation. 19 2 The region lies across
a major storm track; high and low pressure systems pass-
ing over the area produce wide variations in meteorology.
Moisture from the Great Lakes in fall and winter increases
precipitation, while the latent heat of the Great Lakes
protects the region from winter cold. In spring and sum-
mer, the cooler waters of the Great Lakes moderate the
heat of the tropical air that approaches the area.19 3
Hourly measurements of PM2 ,3, 03, SO2 , NO2 , Co,
and total reduced sulfur were used to estimate an air
quality index. 03 was responsible for almost all of the
poor air quality hours recorded during 2001 in the COR.
Since 1971, SO2 and CO concentrations have decreased
by more than 80%. NO, concentrations have decreased
by -49% over the past 26 yr. Current concentrations of
Journal of the Air & Waste Management Association 655
Ozone (ppb) 300 NO2 (ppb)350 * -- 1-hr.95% 1-hr. 95%
300 - -1 -hr. 50% 250 --- 1- hr. 10%y / . +~~~sAnn. avg, 1 \ -hr,.standard
250 - 200 ------------
200 - 150
150 1-hr. standard 100
100 -
50 - ~ _ _50
50- .1986 1990 1994 1998 2002 1986 1990 1994 1998 2002
16 CO (ppm) 160 - SO 2 (ppb)
14 -A 8-hr. 50% 140 24-hr. standard
12 - -- 8-hr.10% 120 - D*aily95%
10- 8-hr.standard 100- -uDaily50%
8- 80
6- 60-
4 4 0
2 - 20 -Annual standar
0 0
1986 1990 1994 1998 2002 1986 1990 1994 1998 2002
Volume 54 June 2004

Mollna and Molina
Figure 3. Trends in PM10, TSP, and lead concentrations for the MCMA showing the averages of data at five representative RAMA sites. (Source: sameas Figure 2.)
S02, NO., and CO do not exceed provincial and federalair quality criteria, but PM 2, 5 , PM,o, and 03 are above thecriteria. Though the average 03 concentration varies overtime, it shows a general increase from 1982-2001.
Table 4. 2000 MCMA Emission inventory by sector (tons per day).
PM10 PM2.5 SO2 CO NO. CH4 VOC NH3
Stationary sources 8 2 28 27 68 0 60 1Area-wide sources 1 1 0 18 29 462 542 36On-road motor
vehicles 9 7 11 5479 370 31 513 6Other mobile sources 6 5 1 52 61 1 20 0Vegetation and sois 5 1 N/A N/A 2 N/A 42 N/ATotal 28 17 40 5577 530 494 1177 42Statonary sources 27% 9% 70% 0% 13% 0% 5% 1%Area-wide sources 5% 8% 0% 0% 5% 93% 46% 84%On-road motor
vehicles 31 % 45% 27% 98% 70% 6% 44% 15%
Other mobile sources* 20% 31% 3% 1 % 11% 0% 2% 0%Vegetaton and soils 17% 6% N/A N/A 0% N/A 4% N/A
*Not includrg construcfton equipment and locomoives (included in Area-Wide Sources).Source: 2000 Emission Inventory for the MCMA, http://www.sma.dftgob.mx.
Note: N/A = Not applicable; N/S = Not Significant; N/E = Not Estimated.
The COR contributes over 49% of the NO., VOC,and CO emissions, while the remainder originateelsewhere. Over 58% of NO, and CO emissions in theCOR are from mobile sources, while -50% of PM andVOC emissions are attributable to area sources. TheCOR's proximity to the border makes it vulnerable tothe long-range transport of pollutants from the UnitedStates.
Between January and November of 2003, there were53 days with an Air Quality Index >31 in Toronto, and 14(26%) of them were caused by PM2 5. There were 77 suchdays in Hamilton, 46 (60%) of which were caused byPM2 5.94 Elevated 03 concentrations are generally re-corded on hot, sunny days from May to September, be-tween noon and early evening, with much of the 03
originating from cross-boundary transport. For the sameland use, 03 levels in southern Ontario decrease fromsouthwest to northeast because of the combination oftrans-boundary sources and synoptic meteorology.
In 2001, transportation and fuel combustion ac-counted for more than 50% of PM2 .5 emissions in On-tario. More than half of the elevated PM2 .5 in Ontario andas much as 90% of the PM2 .5 in the border cities may betransported from the United States.' 9 5 NO_ concentrations
656 Journal of the Air & Waste Managenment Association Volume 54 June 2004

Mollna and Mol/na
did not change significantly from 1991-2001, but there
has been a general decrease from 1970.
The Ontario transportation sector emitted -63%195of the NO,, and 85% of the CO, with the highest NO2 level
of 27.1 ppb recorded in Toronto, based on estimates in
2001. The max annual average of CO was found in To-
ronto, while the max 1-hr average was recorded in Ham-ilton. Between 1992 and 2001, the annual average CO
concentration (based on nine sites in Ontario) did notshow a trend (0.6-0.9 ppm), but the composite average of
the 1-hr maxima decreased by 29%. These CO reductions
occurred despite a 17% increase in vehicle-kilometerstraveled over the same 10-yr period. The transportationsector accounted for -29% of anthropogenic VOC emis-
sions in Ontario in 2001, while general solvent use ac-
counted for 24%.19' Benzene, toluene, and o-xylene de-
creased from 1993-2001.The major S02 emission sources in the COR and across
Ontario are metallurgical industries such as copper smelters,and iron and steel mills.'9 6 Other major sources include
utilities, petroleum refineries, and pulp and paper mills.Lesser sources include residential, commercial, and indus-trial heating. In 1995, point sources contributed -71% and
86% of SO2 emission in the COR and Ontario, respectively.Similarly, in 2001, -83% of the SO2 emissions in Ontariowere from smelters, utilities, refineries, and the primarymetal sectors. Historically, the highest SO2 concentrationsin the COR have been recorded in the vicinity of large local
industrial sources. Lee et al.197 found that long-range trans-port contributes to the So4
2 - pollution within the COR.
The implementation of regulations on smelting operationsand the Ontario government's "Countdown Acid Rain" pro-
gram resulted in a significant decrease of SO2 emissions from
1991 to 1994, and it has remained constant.
Delhi, India
Delhi, the capital city of India, is located in the northernpart of the country at an elevation of 216 m above MSL,with an area of 1483 km2 .198,199 The Yamuna River and
the terminus of the forested Aravali hill range are the two
main geographical features of the city. The average an-
nual rainfall in Delhi is 700 mm, three-fourths of whichfalls in July, August, and September.20 0
In 1901, Delhi was a small town with a population of
only 0.4 million people. Its population started to increase
after it became the capital of British India in 1911. As
India achieved independence in 1947, a large number ofpeople migrated from Pakistan and settled in Delhi. The
population growth rate was 90% in the decade 1941-1951. Delhi's population increased from 4 million in 1971to -14 million in 2001.200 In 1965, Delhi had a cloudless,
bright blue sky; by the 1990s, haze was common and
pollutant levels were high, especially during winter.2 0 1During the same period, the number of vehicles increased
more than 19-fold, from 0.18 million to 3.46 million.20 2
About two-thirds of the registered motor vehicles are
two-wheeled scooters with two-stroke engines. The num-
ber of small-scale industrial units grew from 8200 in 1951
to 120,000 in 1996.200
Delhi's climate is semi-arid, with an extremely hotsummer, average rainfall, and cold winters. The annualaverage temperature is 25.3 °C, while average monthlytemperatures range from 14.3 °C in January to 34.5 °C inJune.2 0 3 During winter, frequent ground-based tempera-ture inversions restrict atmospheric mixing; coupled withtraffic emissions, this leads to high pollution events inDelhi.20 3 During summer, large amounts of wind-blowndust carried by strong westerly winds from the Thar desert
result in elevated PM. 199 These dust storms are followedby the monsoon season (July to mid-September), which is
the least polluted because frequent rains wash out pollut-ants. The prevailing wind in Delhi is northwesterly, ex-cept during the monsoon season, when it is southeaster-ly,204 causing spatial and seasonal variations in the
pollution profile.Nine ambient air quality monitors operate in
Delhi,20 5 including five industrial and four residentialsites.2 06 Most of the monitoring stations measure TSP,
SO2, and NO2 . PM lead, benzo-(a)-pyrene, and 03 are alsomeasured regularly at a major traffic intersection.2 0 5' 20 7
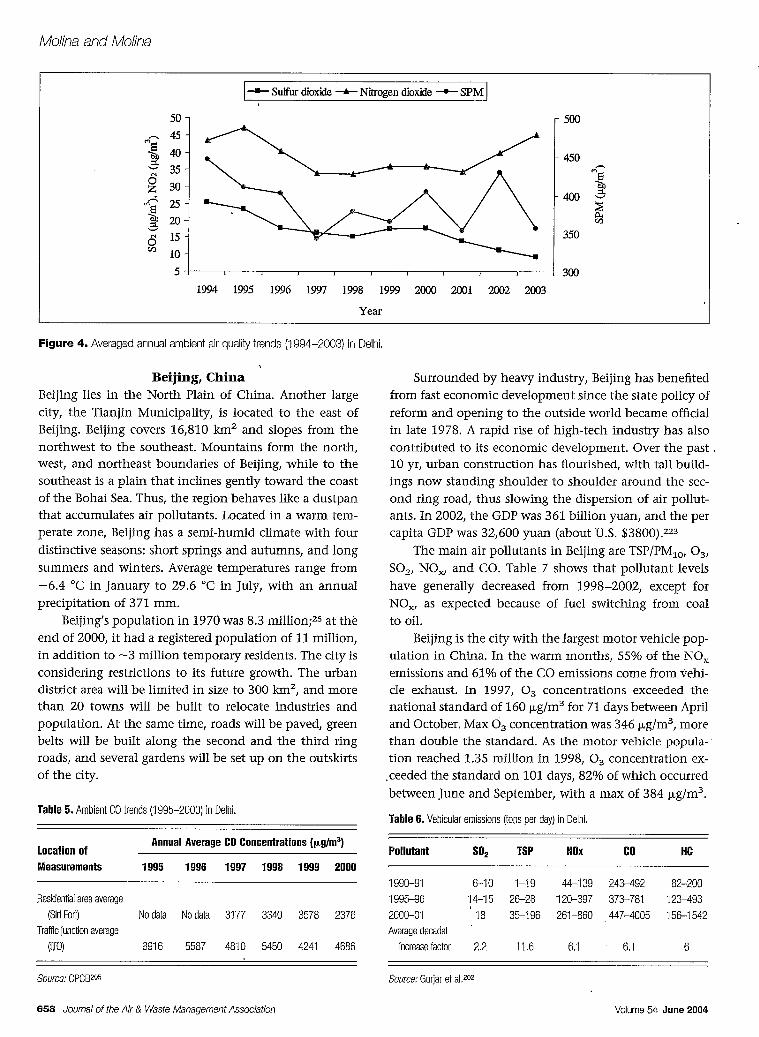
Figure 4 shows trends for several pollutants. Annualaverages of SO2 and NO2 often exceeded national standardsof 15 pg/m3 from 1994 to 2003. In 1997, mean 24-hr NO2
levels exceeded the national standard of 30 lg/m3 at 8 of 18
locations.2 0 8 Further, annual and monthly averaged TSP lev-
els205 have almost always exceeded the national standards.While ambient.SO2 levels show a decreasing trend in Delhi(as expected after the introduction of low-sulfur fuel), NO2
concentrations are increasing since 2001. Table 5 shows thatambient CO concentrations in Delhi have consistently vio-lated the CO standard of 2000 pLg/m 3 for residential areas.During 1997, 03 levels were 150-200 pRg/m 3 for 1-hr and100-200 ,ag/m 3 for 8-hr averages.20 6 Varshney and Aggar-
wal'9 8 and Singh et al.19 9 observed 1-hr average 03 concen-
trations exceeding the prescribed WHO standard of 100
pg/m3 at various locations in Delhi. Compared with other
large Indian cities such as Mumbai, Chennai, and Kolkata,the accumulation of air pollutants in Delhi during winter ismore critical. 20 3
Several emission inventories have been developed forDelhi.20 2
,209-217 Table 6 shows vehicular emissions in
Delhi and their increases relative to base year 1990-1991.Within the past decade, emissions were doubled for SO,
and increased -6-fold for NO., CO, and HC, and nearly
12-fold for TSP.
Journal of the Air & Waste Mlanagement Association 657Volurne 54 June 2004
Mo/ina and Molina
Figure 4. Averaged annual ambient air quality trends (1994-2003) in Delhi.
Beijing, ChinaBeijing lies in the North Plain of China. Another largecity, the Tianjin Municipality, is located to the east ofBeijing. Beijing covers 16,810 km2 and slopes from thenorthwest to the southeast. Mountains form the north,west, and northeast boundaries of Beijing, while to thesoutheast is a plain that inclines gently toward the coastof the Bohai Sea. Thus, the region behaves like a dustpanthat accumulates air pollutants. Located in a warm tem-perate zone, Beijing has a semi-humid climate with fourdistinctive seasons: short springs and autumns, and longsummers and winters. Average temperatures range from-6.4 °C in January to 29.6 °C in July, with an annualprecipitation of 371 mm.
Beijing's population in 1970 was 8.3 million;2 5 at theend of 2000, it had a registered population of 11 million,in addition to -3 million temporary residents. The city isconsidering restrictions to its future growth. The urbandistrict area will be limited in size to 300 kM2 , and morethan 20 towns will be built to relocate industries andpopulation. At the same time, roads will be paved, greenbelts will be built along the second and the third ringroads, and several gardens will be set up on the outskirtsof the city.
Table 5. Ambient CO trends (1995-2000) in Delhi.
Location of Annual Average CO Concentrations (ILgIm3)
Measurements 1995 1996 1997 1998 1999 2000
Residential area average(Sirt Fort) No data No data 3177 3340 3578 2376
Traffic juncUion average(ITO) 3916 5587 4810 5450 4241 4686
Source: CPCB205
Surrounded by heavy industry, Beijing has benefitedfrom fast economic development since the state policy ofreform and opening to the outside world became officialin late 1978. A rapid rise of high-tech industry has alsocontributed to its economic development. Over the past10 yr, urban construction has flourished, with tall build-ings now standing shoulder to shoulder around the sec-ond ring road, thus slowing the dispersion of air pollut-ants. In 2002, the GDP was 361 billion yuan, and the percapita GDP was 32,600 yuan (about U.S. $3800).223
The main air pollutants in Beijing are TSP/PM1 O, 03,
SO2, NOR, and CO. Table 7 shows that pollutant levelshave generally decreased from 1998-2002, except forNO., as expected because of fuel switching from coalto oil.
Beijing is the city with the largest motor vehicle pop-ulation in China. In the warm months, 55% of the NO,emissions and 61% of the CO emissions come from vehi-cle exhaust. In 1997, 03 concentrations exceeded thenational standard of 160 pg/m3 for 71 days between Apriland October. Max 03 concentration was 346 pg/m3 , morethan double the standard. As the motor vehicle popula-tion reached 1.35 million in 1998, 03 concentration ex-.ceeded the standard on 101 days, 82% of which occurredbetween June and September, with a max of 384 Rg/m
3 .
Table 6. Vehicular emissions (tons per day) in Delhi,
Pollutant s02 TSP NOx CO HC
1990-91 6-10 1-19 44-139 243-492 82-2001995-96 14-15 26-28 120-397 373-781 123-4932000-01 18 35-196 261-860 447-4005 156-1542Average decadal
increase factor 2.2 11.6 6.1 6.1 6
Source: Gurjar et aI.202
658 Joumal of the Air & Waste Management Association
| Sulfur dioxide A Nitrogen dioxide - SPM
50 - 500
45 -
40 - 450'-35 -r
z 303400~25-
15 35En2 10
S 300
1994 1995 1996 1997 1998 1999 2000 2001 2002 2003
Year
Volume 54 June 2004
Molina and Molina
Table 7. Annual mean concentrations (p.gIm3) of air pollutants in Beijing1998-2002.
Year SO2 NO2 PM1, TSP cO
1998 120 74 Not measured 378 3.31999 80 77 180 364 2.92000 7,1 71 162 353 2.7
2001 64 71 165 370 2.6
2002 67 76 166 373 2.5Change In the
1998-2002pedod -44.2% +2.7% -7,8% -1,3% -24.2%
Source: http://www,bjepb.gov,cn.
Elevated PM concentrations have been found in Bei-
jing. Shi et al.2 2 4 reported some PM1 0 levels over 400
p.g/m 5 (weekly average), 655 pig/m 3 (12-hr average), and
230 p.g/m3 (annual average). The annual average PM 2.5
concentration was 106 p.g/m3, which is approximatelyseven times larger than the U.S. annual National Ambient
Air Quality Standard (NAAQS) of 15 pvg/m3 . He et al. 225,226
measured an annual average PM 2.5 concentration of -120p.g/m3 , with a weekly PM2 5 concentration ranging from
37 to 357 p.g/m 3. Bergin et al.73 reported a daily average
value for PM 2 .5 of 136 ± 48 ,ug/m3 , which is twice the
24-hr U.S. NAAQS of 65 pug/m 3. Daily averages were 513 +
212 lug/m3 for TSP and 192 + 47 pg/m3 for PM10, respec-
tively.7 3
Major anthropogenic SO2 sources are fossil fuel andcoal combustion, the metallurgical industry, 'and themanufacturing of sulfuric acid. Between 1994 and 2002,
SO2 emissions decreased from 360 to 190 million tonnes.
The main VOC sources are fossil fuel combustion (mainlyin stationary stoves and motor vehicles), solvent use,
paint applications, degreasing operations, dry cleaning,
chemical production, and asphalt.2 27 Ispoprene and
monoterpenes were the main biogenic emissions, ac-
counting for 48% and 22% of VOC emissions, re-
Table 8 shows the contribution of different sources to
the emissions and ambient concentration of PM1o, SO2,
and NO. in Beijing. PM1 0 is largely contributed by fugi-
tive dust and industries; major sources of SO2 are heating
and industries, while traffic and industrial activities were
the most important sources of NO,. 230,
2 31
Santiago, Chile
Santiago, the capital of Chile, occupies -135 km2 and has
a population of 5.3 million, which represents -40% of
the Chilean population. It is located in central Chile at an
elevation of 520 m above MSL in the middle of a valley
and is surrounded by two mountain ranges: the Andes
Mountains and the Cordillera de la Costa. The climate in
Santiago is mediterranean: summers are hot and dry with
temperatures reaching 35 °C, while winters are more hu-
mid, with temperatures ranging from a few degrees above
freezing to 15 'C. The unique topographic and meteoro-
logical patterns restrict the ventilation and dispersion of
air pollutants within the valley, making Santiago partic-
ularly susceptible to poor air quality, especially during the
winter (April to September).
Air pollution in Santiago results from a growing econ-
omy, rapid urban expansion, industrial sources, and an
increasing rate of automobile use. Although the city has a
state-run underground metro system, cars and trucks are
becoming increasingly popular as the number of private
automobiles in Santiago has increased to nearly 1 million.
The city also has a large fleet of diesel buses that are poorly
maintained and contribute substantially to air pollution.
Santiago ranks as one of the most polluted cities in
the world and frequently confronts air-quality alerts and
pollution emergencies. Since the early 1990s, the Chilean
government has taken numerous steps to mitigate air
pollution levels. These steps include an air pollution alert
system-based on the max PM concentration in the city's
air, and -a rotating schedule that restricts the number of
cars allowed on the streets on given days. One of the
commitments undertaken by the current administration
spectively.2 2 8 Measurements ofspectiv ely228 MeasurementS of Table 8. Emission and ambient concentration contribution to PM10, 802, and NO, in Beijing urban districts in l999 (%I.W7flrc h,-i- 1oOn~ 100r,nt 0Q
indicate that benzene, tolu-
ene, ethylbenzene, and xylene
(BTEX) were the main constitu-
ents of ambient VOCs in Bei-
jing. The BTEX concentrations
have increased considerably in
recent years as a consequence
of the rapid growth in the
transportation and industrial
sectors: in 1999 ethylbenzene
increased by 220%, xylenes by
133%, and toluene by 91%.229
PM,, SO2 NO,
Source Emission Concentration Emission Concentration Emission Concentration
Indusbv 26.9 21.6 23.9 39.6 25.9 13.2
Heating 10.2 6A4 26.2 48.1 11.3 8.1
Civil 4.1 8.6 1 4 1.5 2.7Traffic 8.2 13.8 - - 34.5 73.6
Fugitive dust 39.5 48.7 - - - -
Other sources 11.1 0.9 48.9 8.3 26.8 24
Total 100 100 100 100 100 100
Source: He et al.230,231
Journal of the Air & Waste Management Association 659Volunne 54 June 2004
Mollna and Molina
is to modernize the metropolitan region's public transpor-tation system. Santiago has also partnered with U.S. De-partment of Energy Clean Cities International program toincrease the use of alternative fuels in Santiago's publictransportation sector.
One of the first studies of air quality in Chile was acomparison of the pollutant levels in Caracas, Venezuela,and Santiago, and the relationship of those levels to me-teorological conditions. 80 Subsequent studies measureddaily gaseous pollution levels,232 the suspended particles,8 'and their size distribution. 7 9 Contaminants in rainwater 7 7
and elemental composition of TSP233a were also reported.Trier and Silva82 found high extinction and absorptioncoefficients in Santiago, whereas Horvath et al.233b com-pared outdoor and indoor soot concentration.
In the 1990s, the number of publications related toair quality increased considerably. Romero et al.2 34 dis-cussed changes in land use, seasonal and daily weathercycles, and geographical and cultural factors that contrib-ute to pollution. Rappengluck et al.235 discussed the evo-lution of photochemical smog, which included 03, NO.,and CO, peroxyacetyl nitrate, and nonmethane HCs, andestimated that over 50% of the max daytime 03 andalmost all peroxyacetyl nitrate are formed within the ur-ban plume. Kavouras et al.236 reported a PM source appor-tionment study in Santiago. Based on the loadings ofPAHs and n-alkanes, four factors (sources) were identified:high-temperature combustion, fugitive emissions from oilresidues, biogenic sources, and unburned fuels. The re-sults of this study are in good agreement with the esti-mates made by Chen et al.2 37 Further study by Kavouras etal. 238 reported source contributions of PAHs in severalcities in Chile and compared the results with Santiago.Tsapakis et al.239 reported on-road and nonroad engineemissions as the main sources of carbonaceous aerosols infine particle samples in Santiago.
Air quality forecasting is an important subject in San-tiago because during winter restrictions are placed on cityactivities according to the predicted pollution levels.Rutlland et al.240 described the meteorological conditionsthat trigger high pollution episodes. Air pollution poten-tial is defined based on various meteorological episodes.The results are used extensively for air quality forecastingin Santiago.
Perez et al.2 41 developed a neural network model to
predict PM23 concentration several hours in advance.Prediction errors vary from 30% for early hours to 60% forlate hours. Silva et al. 242 extended the model to predictPM1 O. Concentrations of NO and NO2 in Santiago werepredicted with meteorological variables using persistence,linear regression, and a multilayer neural network.2 43
Jorquera et al.244 estimated the trends and impactsof public policies on air quality levels using data from
1989-1998. The yearly decreases in PM,o concentrationswere found to lie between -1.5 and -3.3%, while thedecrease for PM2 5 was between -5 and -7%. A boxmodel approach was employed to assess the contributionof different economic activities to air pollution levels. Theapproach was applied to SO 2, NO,, and CO, includingexplicitly the seasonal behavior of meteorological vari-ables. The results show that dispersion conditions in thefall and winter are 20-30% of the summertime values,explaining the poor air quality in those seasons. Oldercars and diesel vehicles contribute more than half of theNO, and CO emissions. Ambient SO 2 concentrations arelargely dominated by stationary sources.2 4 5 The relativeimportance of mobile sources to PM2, 5 levels has doubledin the last decade, whereas stationary source contribu-tions have been reduced to half the value of the early1990S.
2 4 6
The possibility of building a model for SO2 forecast-ing has been investigated by Perez2 47a with persistence,linear regression and a three-layer neural network model.The best fit is obtained with a neural network that em-ploys SO2 concentrations every six hours on the previousday plus the forecasted meteorological variables as input.Using an index of multivariate effectiveness, Silva andQuiroz2 47 b found that the air quality-monitoring networkcan be optimized by excluding the least informative sta-tion with respect to the variables under study, which werePM,O, 03, SO2 , and CO.
The role played in regional and global climate by theextensive and persistent deck of stratocumulus at the westcoast of subtropical South America was studied by Gar-reaud et al.24 8 The characteristics of the coastal-low epi-sodes along the subtropical west coast of South Americawere also investigated. 2 4 9 The mean structure and evolu-tion were determined using a composite analysis of 57episodes during 1991, 1993, and 1994. In addition, Gar-reaud25 0 studied the characteristics of cold air incursionsover subtropical South America.
Sao Paulo, BrazilSao Paulo is -60 km from the southeast coast of Brazil, atan elevation of 800 m above MSL. The Greater Sao Pauloarea has 18 million inhabitants in 39 municipalities cov-ering -8000 km2, two-thirds of which are urbanized.
The metropolitan area is home to a strong industrialbase, which is responsible for -16% of Brazil's gross na-tional product. In addition, vehicle population has dou-bled in the last decade, reaching 3.5 million; mass trans-port is not efficient and covers only a small area of thecity. A significant fraction of the bus and automobile fleetis more than 10 yr old, with high emission factors. Thefuel used in Brazil is mostly gasohol (gasoline with 23%ethanol), and a small fraction of the automobile fleet runs
660 Journal of the AJr & Waste Management Association Volumne 54 June 2004
Mollna and Molina
on pure ethanol. As a consequence, the atmosphere isheavily loaded with aldehydes, in particular acetaldehydeand formaldehyde (HCHO).2 5l1252 Concentrations ofHCHO in downtown Sao Paulo range from 4-8 ppb,while acetaldehyde concentrations range from 6-11ppb.25 1
,254 03 formation rates are significantly affected by
these high aldehyde concentrations. Evaporative emis-sions from gas stations and vehicles are also significant.Automobiles with low emission factors that can run withany mixture of gasoline/alcohol started to be produced in2003, and these are expected to improve air quality.
SSo Paulo suffers from severe air pollution from PM10,03, and aldehydes. During winter, shallow inversion lay-ers trap pollutants within the 200-400 m range for sev-eral days, resulting in elevated pollutant concentra-tions.2 5 3 Ambient SO 2 concentrations are low, and mostof it comes from the sulfur content in diesel fuel. Theaverage CO concentrations are in the 2-4 ppm range, butin some heavy traffic areas the 8-hr averages exceed the airquality standard of 9 ppm. As measured at the 33 moni-toring stations within the city, the range of NO2 values isfrom 25-75 1ig/m
3 , well below the annual air qualitystandard of 100 p,g/m .254
The 24-hr PM1 o standard of 150 pLg/m 3 is frequentlyexceeded, mostly during wintertime; average annualPM1 o concentrations reached 75 pg/m3 at some stations.Vehicular emissions are responsible for -35% of PM 1o,while industrial emissions account for -25%, re-sus-pended dust '-20%, secondary sulfates -10%; other smallsources such as wood combustion, garbage incineration,metallurgical emissions, marine aerosol, etc., account forthe remaining PM 0 .255 -257 Secondary organic aerosol isan important fraction of PM2 .5, as is BC, which accountsfor -11%.
Bogota, ColombiaBogota is the capital of Colombia and also its administra-tive and political center. In 2003, the population was 6.5million, with a growth rate of 2.4% per year. The popu-lation density is -3700 inhabitants/km 2 .258 The city'selevation is 2640 m above MSL on the highest plateau inthe Colombian Andes, and occupies an area of 1732 km2 .Mountains on the east and south border the city; most ofthe urban area is flat, but there is some development inhilly areas in the southern part of the city.
Bogota has a high-mountain tropical climate, with anaverage temperature of 14 'C. The dry season is Decemberto March, and the rainy seasons are April to May andSeptember to November. During August, there are usuallyheavy winds from the north. The weather is stronglyinfluenced by El Nifio.2 58 Bogota has -900,000 privatevehicles,2 5 9 and a large number of highly polluting smallindustries (e.g., brick and quicklime manufacturing).
Bogota has an air quality monitoring network(DAMA, Departamento Tecnico Administrativo del MedioAmbiente) composed of nine stations. In addition to me-teorological parameters, the network monitors TSP, PM1 0,O3, SO2 , NO2, and CO. Between 1998 and 2002, the airquality network showed reductions in average annualconcentrations of CO (-28%), NO2 (-13%), and 03
(-6%).260 However, there was a 120%o increase in PM, 0 anda 15% increase in SO2 during the same period, with bothpollutants showing noncompliance with local standardsin 2002.260
Bogota operates the successful TransMilenio Pro-gram. The bus rapid transit (BRT) system deployed in thisprogram has resulted in travel time and operational costreductions, as well as in a decline in traffic accidents. 2 6 'Furthermore, air pollutant emission reductions have beenachieved as a consequence of replacing an obsolete transitfleet, running more efficient bus transit operations, andshifting to more efficient transportation. Hidalgo26' esti-mated the emission reductions from baseline levels be-cause of the implementation of the TransMilenio Pro-gram. The estimate assumes the replacement of 1500obsolete buses by 709 new buses, and a 26% reduction inauto trips.
Cairo, EgyptCairo, the capital of Egypt, is the largest city in Africa andthe Middle East. It is located on the banks and islands ofthe Nile in the north of Egypt. The population of theCairo urban agglomeration is 10.8 million, and is pro-jected to reach 13.1 million by the year 2015.1 GreaterCairo consists of Cairo, Giza, and Kalubia, and has apopulation of more than 20 million.
Cairo has a hot, dry desert climate. The monthlyaverage temperature ranges from 14 °C in January to 29 'Cin July. The max daily temperature can reach 43 °C in thesummer. The average annual rainfall is only 22 mm, andthe monthly max of -7 mm occurs in December.
Although Cairo itself is only -1000 yr old, parts ofthe metropolis date back to the time of the Pharaohs. Thefirst Muslim settlement of Egypt was Al-Fustat, now a partof old Cairo. Cairo was conquered and controlled by ahost of invaders, including the Mamluks, the Turks, andNapoleon Bonaparte of France. In the nineteenth century,one of the city's rulers, Khedive Ismail (1863-1879),sought to transform Cairo into a European-style city. This,along with the British occupation of Cairo in 1891, led tothe development of new suburbs for affluent Egyptiansand foreigners. By the turn of the century, most commer-cial activity was also moving into modern Cairo. Theurbanization of the Greater Cairo area has been facilitatedby an extensive flood control program and improved
Journal of the Air & Waste Management Associat,on 661Volurne 54 June 2004
Molina and Molina
transport facilities developed.over the past 30 yr. Cairo is
the only city in Africa with a metro system.
Although the conservation of agricultural land has
long been a priority of Egyptian development policy,
much of the critically needed arable land in Cairo is being
lost to urban development, half of which is illegal; the
remainder is planned developments in the desert. Cairo
has about one-third of Egypt's population and 60% of
that nation's industry. It is one of the world's most
densely populated cities, with one of the lowest provi-
sions of road space per capita and a dramatic growth inthe number of private vehicles. The government has ex-acerbated this situation by spending on bridges and over-
passes, and by heavily subsidizing fuel, all of which pro-
motes the use of private vehicles.Emissions from industry and motor vehicles cause
high ambient concentrations of PM, SO2, 03, NOR, and
CO in Cairo.26 3 However, continuous measurements of
these pollutants need to be conducted to establish the
extent of the air quality problem.Lead levels in Cairo are among the highest in the
world, and are estimated to cause between 15,000 and
20,000 deaths a year, according to a 1996 report by the
Egyptian Environmental Affairs Agency. PM lead concen-trations ranged from 0.5 [Lg/m
3 in a residential area to 3
pg/m3 at the city center, and the high lead levels,were
mainly attributable to motor vehicle emissions.26 3 Stur-
chio et al.262 measured lead and TSP at 11 sites; the con-'centrations ranged from 0.08 pLg/m 3 and 25 pg/m3 , re-
spectively, at one site to over 3 pLg/m 3 and 1100 ,ag/m 3 ,
respectively, at the city center. Because Cairo began to
phase out leaded gasoline in 1996, Sturchio et al.262 con-
cluded that local lead smelters emitted the majority ofatmospheric lead. Rodes et al.264 measured PM2 .5 and
PMcoa,se concentrations during a source apportionment
study in Cairo from 1994 to 1995. The annual averagePM,o concentrations exceeded the 24-hr U.S. NAAQS of
150 pg/m3 at almost all sampled sites.To develop and implement a pollution control strat-
egy in Cairo and to reduce the health impact of air pol-
lution, the Cairo Air Improvement Project (CAIP) wasestablished.2 64 Source attribution studies were performedas part of this project to assess the impact of various
sources (e.g., lead smelters, motor vehicles, oil combus-
tion, vegetative burning, geological material) on ambientpollutant levels.26 6
The design of the CAIP network, and ambient PM andlead measurement results, have been reported by Labib et
al.26 7 For the period 2000-2001, high levels of PM were
reported for all sites, with annual average PM1o and PM2 51levels generally exceeding 150 [tg/m
3 and 75 p.g/m 3 , re-
spectively. Max PM levels were observed in the highly in-dustrialized areas of the city. In spite of the introduction of
unleaded fuel, ambient lead remains a major problem. For2000, the annual average PM1 o and PM 2. 5 lead levels inmost contaminated sites exceeded 20 pg/m3 . Observed
levels were reduced by -40% in 2001 through CAIP-initiated efforts.
To determine the sources of pollution episodes, in-tensive PM1 o, PM2 .5 , and VOC monitoring was carried out
at six to eight sites in the greater Cairo area during a fall
and winter period in 1999, and during a summer period in2002.266 Crustal components Si, CA, Fe, and Al were sig-
nificant at all sites. The majority of crustal material was inthe PMcoaxse fraction. OC and elemental carbon were ma-
jor components of PM at all sites. The likely sources in-clude mobile emissions, open burning, and fossil fuelcombustion. The highest average VOC concentrationswere found at a mobile-source dominated site: 2037 +
1369 ppb during the fall and 1849 ± 298 ppb during the
winter. 26 6 The temporal variations of VOCs were consis-
tent among the six sites during winter.The most abundant VOCs were isopentane and n-
pentane, which are associated with evaporative emissionsfrom motor vehicles; C2 compounds (e.g., ethane,
ethene); prQpane; isobutene; and n-butane, which comesfrom compressed natural gas (CNG) and liquefied petro-
leum gas (LPG). Methyl tertiary-butyl ether-a gasolineadditive-toluene and benzene were also abundant.
AIR QUALITY ASSESSMENT TOOLS FOR
MEGACITIESAir quality management in megacities takes place in fourstages. 26 8 The initial stage of problem identification rec-
ognizes that existing air quality is unacceptable and de-
termines the causes of excessive levels. Having deter-
mined the type and severity of the problem, policy isformulated to solve it. Implementation of policy follows,in which the strategies to reduce emissions are enacted
and enforced. Assuming that the problem was correctlyidentified and that appropriate policy has been formu-lated and successfully implemented, the control situationis achieved. Although the initial problem might havebeen resolved, management capabilities are required toensure that the control situation persists. Changes inemissions affecting the urban area and a more precisedefinition of the problem may identify new air quality
issues to be resolved, and the management cycle is initi-
ated again. Continued monitoring is needed for problem
definition and maintaining the control situation.Throughout each cycle it is essential to ensure that the
public remains informed of the status of their air quality.The design of emission controls requires detailed in-
formation on the status of the air quality (provided by
monitoring networks) and the principal sources of pollu-tion and their location, as characterized by the emission
662 Journal of the A/r & Waste Management Association Volurre 54 June 2004
Molina and Molina
inventory. Combining the information from monitoringand emission estimates with knowledge of dispersion
characteristics for the city and chemical transformationsof pollutants enables air quality models to be developed.Such models are powerful tools for air quality managers,
but there is no perfect model that can be applied to
formulate an effective air quality management strategy. It
is important to consider an overall view of urban air
quality rather than to focus on single-pollutant or isolated
problems.
Air Quality Monitoring NetworksAmbient monitoring at representative exposure locations
is carried out to represent the effects from the aggregate of
all emissions. Monitoring is conducted to examine exces-
sive pollutant levels, determine compliance with stan-dards, identify and quantify source contributions, deter-
mine exposures, evaluate the effectiveness of emissionreductions, and perform air quality modeling.2 6 9 Dataquality objectives, network design and managementstructures, monitoring locations, instrumentation, opera-tion and maintenance of systems, quality assurance and
control procedures, data review, data validation, and datausage vary depending on the monitoring objectives.
Many monitoring systems are based on recommen-dations for EPA compliance monitoring. 2 7 0 These include
the U.S.-regulated criteria pollutants of PM (TSP, PM 10,
and PM2, 5 mass), 03, SO2 , NO2 , and CO. Meteorologicaldata should also be monitored concurrently at air quality
monitoring sites. In some areas, visibility and acid depo-
sition may be important. Several different methods can beapplied for these measurements that vary in the complex-
ity, reliability, and detail of data. These range from simplepassive sampling techniques to highly sophisticated con-tinuous analyzers and remote sensors. Assessing which
measurement technique is the most appropriate dependson the objective for which the measurements are to be
conducted, as well as the resources available to achieve
this objective. Current state-of-the-art continuous analyz-
ers and remote sensors are able to provide highly time-
resolved data that can be used to understand pollutionevolution and distribution. However, most of these in-
struments are expensive to purchase and maintain, and
they require considerable technical support, which often
is not available in developing countries.The selection of monitoring locations also depends
on network objectives. One primary reason for monitor-ing ambient air pollutants is to provide information forestimating their likely effects, particularly on environ-mental and human health; therefore, monitoring stationsare often established in population centers. They can benext to busy roads, in city center locations, or at a loca-
tfon of particular concern, such as a school or hospital.
Background and boundary monitoring stations are also
established to determine pollutants transported into and
out of megacities.In many urban areas, individuals spend a consider-
able amount of time indoors, where concentrations of
pollutants are often quite different from those experi-enced outdoors. Indoor air pollution can be generated by
the penetration of outdoor air. It can also be generated by
indoor sources, such as combustion processes for heating
and cooking, and other daily activities, such as cleaning.
Therefore, an integrated assessment of indoor and out-
door exposure will allow the most appropriate, effective,
and equitable controls on exposure to be imposed.
Once air quality data have been generated, quality
assurance and control procedures should be developed
and followed to ensure that the measurements obtained
meet the specified level of accuracy and precision, and
that those which do not are removed through data vali-
dation.
Emission InventoriesThe most direct way to confirm that specific emission-control technologies are working effectively is to measurechanges in the rate at which pollutants are released from
relevant sources. Continuous emission monitors for PM,
SO2, and NO, have been used for on-site stack sampling
of large stationary sources, but these are not practical for
the millions of smaller and mobile sources in a typical
megacity. Temporally and spatially averaged emission in-
ventories are constructed for this purpose.Emission inventories tabulate emission rates from in-
dividual sources and source categories for the pollutantsof interest. Although emission inventories are an essentialtool for managing and regulating pollution, large uncer-
tainties in emission rates, temporal cycles, spatial distri-
bution, and source identification often confound the de-
velopment of cost-effective control strategies. Emission
inventories apply an emission factor that represents the
mass of emissions per unit of activity (e.g., grams of PM2*5
per kg of fuel consumed) times an activity factor (e.g., kg
of fuel sold over a time period). Emission factors and
activity levels are highly uncertain for vehicle exhaust,
one of the largest source categories in megacity invento-
ries. It is essential to reduce these uncertainties to manage
air quality more effectively.EPA publishes national emission inventories for cri-
teria pollutants and hazardous air pollutants. The Emis-
sion Factors and Inventory Group of the EPA maintains a
national emission inventory that characterizes emissionsof criteria and hazardous air pollutants. Although these
contain data for U.S. megacities, similar products are not
easily obtainable from other countries.
Journal of the Air & Waste Management Associaton 663Volume 54 June 2004
Molina and Molina
To estimate the accuracy of the emission inventoryit is useful to have an independent check with analternative method that might be based on receptor mod-eling source apportionment 2 7 1,2 7 2 using emission ratios,multivariate methods, inverse air quality modeling, andequilibrium models. Receptor models relate speciatedemissions to speciated source profiles. To the degree thata source profile is not unique (and many are not) or someemission spp. may be disproportionately removed bychemical reaction, deposition, or adsorption, source/receptor analysis will have uncertainties. Receptor modelsource apportionment shows the importance of sources tothe emission problem directly, even whether the resultsare somewhat uncertain. Frequently, source/receptoranalysis can point to a source that may have been over-looked. The benefit of an unequivocal and easily c6mmu-nicated "top-down" approach has value beyond confirm-ing a "bottom-up" emission inventory. Receptor modelsource apportionment has found large discrepancies be-tween ambient measurements and emission inventoriesfor transportation-related vehicle exhaust and roaddust.272,273
Mobile Source Emissions. Mobile source emission mod-e1s274
,275 include the time and emission factors for vehi-
cles while parked and at idle, for the frequency of coldand warm starts, and for vehicles at various speeds incongested and noncongested driving. Emission factors arederived from laboratory measurements of evaporative andtailpipe emissions for simulated driving on a dynamom-eter. Vehicles selected for measurements come from dif-ferent vehicle types, technologies, and ages. However,on-road vehicle emissions may vary by orders of magni-tude from vehicle to vehicle even within the same type,technology, and age because of deterioration and breakage of the fuel delivery and emission control system. Alimited number of vehicles can be tested in the labora-tory, and the most poorly maintained are rarely volun-teered to be tested; high-emitting vehicles are often un-derrepresented in the vehicle samples that have beentested in the laboratory.2 7 6
Remote sensing has been used to estimate on-roadvehicle emissions, usually while vehicles are in light-ac-celeration driving. An advantage of this technique is itsability to measure large numbers of vehicles, although theemission measurements represent less than 1 sec of driv-ing for each vehicle. The technique has been used to: 1)verify the reduction of emissions from installing catalystson vehicles in Mexico City, 27 7 2) evaluate the reducedemission deterioration in newer vehicles,27 8 3) serve asthe basis for estimating fuel-based emission invento-ries,27 9 and 4) estimate the distribution of on-road high-emitting vehicles in various vehicle fleets.2 80 Lidar-based
remote sensors can detect low levels of PM emissions.2 81
Remote sensing cannot measure evaporative emissions,and high evaporative emitters have not been identified bythis technique.
On-board diagnostic (OBD) systems automaticallymonitor and document problems that lead to increasedemissions from individual vehicles in an on-board com-puter. OBD systems alert the motorist by turning on themalfunction indicator light to indicate that repair isneeded. Motorist response to the "malfunction indicatorlight on" is being studied, especially for vehicles that areno longer under warranty, in which case the motoristwould have to pay for diagnosis and repair. Newer OBDIIsystems, 2 82 installed on U.S. vehicles from 1996 onward,monitor evaporative emission control systems better thancurrent vehicle emission inspection tests, and EPA is rec-ommending that OBDII be used to inspect vehicles. Thenewest OBDIII systems link on-board diagnostics withwireless communication so that emission systems can bemonitored at a central facility. OBDIII is currently beingevaluated on high-mileage vehicle fleets, especially taxis,in Los Angeles and the San Francisco Bay Area.2 83
,284
In roadway tunnel studies, 2 85 air quality monitors aredeployed inside tunnels and along roadways to character-ize integrated emissions from vehicle fleets with minimalinterference from other sources and atmospheric transfor-mation. Tunnel measurements have led to revisions ofemission models,2 8 6 determined the effect of reformu-lated gasoline on HC spp. emitted by vehicles,2 87 andquantified carbonyl and PAH emissions.
Mobile laboratories are designed to measure multiplepollutants while following vehicles on the road.2 88 ,2 89,289a
These systems draw a portion or all of the exhaust plumethrough a series of instruments for characterization. Theyare often used as chase vehicles to sample individualplumes from preceding vehicles. Measurements made inthe laboratory dilute the exhaust before analysis and theexcess air and time delay change particle size dependingon sampling conditions.
Portable emission measurement systems are used on avehicle to measure real-time emissions.29 0 These operateon battery power and can be located in the trunk or backseat of a vehicle, with sampling from the exhaust pipe orthe diluted plume beyond the exhaust pipe. A cooperativeresearch program to examine commercially available por-table emission measurement systems devices is being or-ganized.2 91
Aircraft and Satellite Observations. In addition to ground-based measurement, aircraft and satellite observations areuseful for verifying elements of emission inventoriesand the location and extent of air pollution. Advancedmultispectral satellite sensors can quantify trace gas
664 Journal of the Air & Waste Management Association Volume 54 June 2004
Molina and Molina
concentrations and sometimes relate them to sources. The
Global Ozone Monitoring Experiment (GOME) onboard the
European Space Agency's Second European Remote Sens-
ing Satellite (ERS-2) provides continuous spectral measure-
ments of nadir backscattered earth radiances and solar
irradiances in the UV/visible wavelength range. GOME
measures integrated column concentrations of SO2, NO2,
and HCHO that are often emitted by fossil fuel combus-
tion.2 9 2- 29 4 Satellite plume detection can track long-range
transport of gases and particles2 95 -29 8 and help researchers
understand how meteorological situations influence air
pollution on local, regional, and global scales.2 99,3 00
The scanning imaging spectrometer for atmospheric
chartography (SCIAMACHY) on the European Space
Agency Envisat satellite detects tropospheric gases andparticles from lower earth orbit. The smaller ground pixelsize of SCIAMACHY (30 km x 60 km) is comparable to the
size of megacities, offering the possibility of estimating
total emissions from these large urban expanses to create
and verify inventories. SCIAMACHY's high spatial resolu-
tion also creates a higher probability of finding cloud-free
ground pixels. SCIAMACHY extends the spectroscopic
range into the IR' to provide column-concentrations
measurements for 02, 03, SO2, NO2, N,O, bromine
oxide, H2 0, HCHO, CO, C0 2 , CH4, other gases, clouds,
and PM. 301 Validation from aircraft measurements and
model intercomparisons, together with new spectralinterpretation algorithms,2 9 6 will make satellite data a
quantitative tool for air quality research and manage-
ment.
Air Quality StandardsAmbient air quality standards define pollutant levels
that should not be exceeded if public health is to be
protected. These standards require definition and ju~stifi-
cation for acceptable levels, averaging times, allowablenumber of exceedances, sampling frequency, measure-
ment method, and sampling locations. All of these com-ponents of an air quality standard affect the extent of
emission control required for their attainment. Most air
quality standards are established to prevent adverse hu-
man health effects for a particular pollutant. Since pollut-ant to health effect relationships are uncertain,3 0 2 the
form and level of ambient standards vary from country to
country, and this variability will affect the levels of con-
trol applied in different megacities. Ambient standards
should provide a management tool that can be used pro-
gressively to improve air quality while at the same time
remaining a realistically attainable target. Standards are
effective only when compliance is measured and en-
forced.
Air Quality ForecastingAir quality forecasting3 O3-3 05 uses source and receptormodels to estimate the severity of future pollution events.These forecasts are communicated to the public via massmedia so they can make decisions about their dailyactivities. Most forecasts produce one- to three-day ad-vance estimates of pollutant concentrations. In phenom-enological forecasts, an expert familiar with past air qual-ity and meteorological information recognizes patternsthat are conducive to high pollution levels. This informa-tion is used subjectively, relying on past experience. Em-pirical models use artificial intelligence computer pro-grams to recognize patterns and project them into thefuture. Chemical transport models coupled to detailedmeteorological forecasts are also being employed for fore-casting.
Air Quality Simulation ModelsAir quality simulation models3 06
,307 combine and system-
atize knowledge of emissions, meteorology, and atmo-spheric chemistry to estimate ambient concentrations:These models can be used to explain past episodes, toevaluate the potential effects of different emission reduc-tion strategies, or to make air quality forecasts. Air qualitymodels in common use include:
* California/Carnegie Institute of Technology(CIT) Model,3 08 which was developed and appliedin the SoCab1 82 and the MCMA.309 This modeluses the SAPRC99 photochemical transformationmechanism 3 1 0 or the CalTech AtmosphericMechanism. 31 1
* MODELS-3/CMAQ Model,3 12 the U.S. EPA model,
which has been widely adopted within the mod-eling community in the United States. It is able torun the CB-IV,313 RADM2,314 and SAPRC99
chemical mechanisms.* CAMx Model,3 1 5 based on the earlier Urban Air-
shed Model (UAM)3 16-318 which has also been
widely used in California and more recently inHouston, TX.
* Multiscale Coupled MM5/Chemistry Model/Weather Research and Forecast with ChemistryModel (MCCM, WRF-Chem),3 19 links the Fifth-
Generation NCAR/Penn State Mesoscale (MM5)meteorological model 32 0 and atmospheric chem-istry models. This work is being continued withthe development of WRF-Chem, placing theRADM2 chemical mechanism in-line with the
WRF model.Advanced air quality models contain modules for
inorganic and organic aerosols using modal and sectionalrepresentations for particle size. For inorganic aerosols,the ISORROPIA equilibrium module3 2 1 is used by CMAQ
Journal of the Air & Waste Management Association 665Volurne 54 June 2004
Molina and Molina
and CA`Mx models. The CIT model includes the SCAPE2models32 2 and WRF-Chem uses the MADE equilibriummodule.3 23 Secondary organic aerosol models also differfor the CIT311 and CAMx32 4 models, while CMAQ andWRF-Chem models use the formulation of Schell et al.325
A Master Chemical Mechanism (MCM) is being con-structed using a large set of kinetics and product data forthe elementary reaction steps of the VOC oxidation pro-cess.326 ,327 The process of aromatic HC oxidation is be-coming better understood, 32 8 -3 33 leading to MCM up-dates that have been evaluated against simulationchamber measurements.2 96 ,33 4 ,33 5
The MM5 336,337 and CALMET338 meteorological mod-
els generate three-dimensional wind fields from basicphysics and from observations. CALMET is best suited toareas without complex terrain and with dense meteoro-logical measurement networks. For complex flows, forexample, in mountainous terrain or coastal areas,CALMET can be used as a filter to merge the results ofprognostic models such as MM5 or RAMS339 with avail-able observations or as an interface between prognosticand air quality models. Martilli et al.340 proposed an im-proved parameterization for urban surfaces, which is es-pecially important in megacities, to take into accountradiation trapping and shadowing along with turbulenceeffects based on simplified building geometries. MM5 isnow in its last major release and will be replaced byWRF-Chem.341
EMISSION CONTROL STRATEGIESMolina et al., 3 an online supplement to this review, pro-vides a detailed summary of different control measuresthat have been applied and are being considered for thenine case study megacities. There is a wide range of waysin which the same strategies can be implemented, butthey can be classified into three major categories: 1)technology-based regulatory mandates on processes,fuels, and emission treatment; 2) economic instrumentssuch as incentives, emission taxes, and emission trading;and 3) policy adaptation such as land-use planning, in-frastructure development, and transport management.
Regulatory controls include emission limits imposedon industry and vehicles. These usually are based on tech-nological limitations such as Maximum Available ControlTechnology for new emitters or Best Available RetrofitTechnology for existing sources. Lloyd and Cackette 3 42
note that regulated emission limits often spur technolog-ical development, especially with respect to vehicle emis-sions. Economic instruments apply the power of the mar-ket to encourage use of cleaner technology and fuels, andare often based on the "polluter pays" concept.
Infrastructure modification can be applied to mobileand stationary sources. Road works and land use planning
can reduce emissions from mobile sources, such as thebuilding of ring-roads around heavily congested and pol-luted areas and the development of public transport toreduce vehicle usage. Large stationary emission sourcescan be moved out of the urban area, as has been done inLos Angeles and Mexico City."1 Policy instruments can beused to reduce exposure to pollutants, for example, byencouraging investment in industries or their relocationaway from residential areas.
The most effective air quality management strategiesuse a combination.of these approaches together with pub-lic outreach programs, and enforcement through persua-sion and incentives, to produce an equitable and appro-priate reduction in emissions.
Technology-Based RegulationsAdministrative and legislative frameworks are needed toensure adherence to regulatory emission controls. Moni-toring, reporting and auditing programs for effective con-trol of sources often require considerable technical, hu-man, and financial resources. Legislation enablingeffective penalties to discourage violation of emission lim-its is essential. Cost analysis ensures that appropriate mea-sures are taken so that the costs of establishing, carryingout, and enforcing the regulations are not disproportion-ate to their benefit. Cost analysis can also help to chooseamong alternative emission reduction strategies or to de-termine when making a strategy more stringent is nolonger beneficial.
A U.S. National Research Council (NRC)342a panelrecommended that regulatory agencies target groups ofpollutants coming from the same sources rather thanfocus on single pollutants. Since air pollutants are trans-ported from state to state and across international borderswithout regard for political boundaries, the study recom-mends that future regulations need to reach beyond in-dividual cities, counties, and states. For megacities, thisshould apply as well to sovereign nations. The NRC panelnoted that regulations for new cars and light trucks havegreatly reduced vehicle emissions, but less progress hasbeen made in the United States in reducing emissionsfrom older heavy-duty diesel trucks, nonroad vehicles,and faulty automobiles. Although regulations governingnew power plants and large factories have led to substan-tial reductions in emissions, many older "grandfathered"plants remain large sources of pollution. The study rec-ommended that more emphasis be placed on measurableresults than on the process of creating implementationplans. Improved tracking of emissions is needed to accu-rately assess which populations are at the highest risk ofhealth problems from pollution and also to better mea-sure the success of pollution-control strategies.
666 Journal of the Air & Waste Management Association Volurne 54 June 2004
Molina and Molina
Over the last 30 years there have been radical im-provements to fuels and technologies, which have con-tributed to a reduction in air pollution. However, thereare significant constraints on what improvements to fuelsand technologies alone can deliver. In many megacities,reductions in per-vehicle emission levels have been offsetby increases in the numbers of vehicles and greater use ofthe same vehicle. For this reason, motor vehicle emissionsmust be a major focus of regulation in every megacity.Fortunately, transportation technology is rapidly advanc-ing, and megacities in developing countries may be in aposition to leapfrog older technologies.
Hybrid Vehicles. California required that 2% of vehiclesales had to be zero-emission vehicles by 1998. It wasbelieved that battery-powered electric vehicles wouldmeet the need, but available batteries limited their rangeto barely 100 km, and the vehicles did not sell. However,electric vehicle research created the technology for usingsmaller batteries that could be continuously rechargedby a small gasoline-powered generator. These hybridgasoline-electric vehicles have been shown to be near-zero-emission vehicles, efficient, and popular. At lowspeeds, where internal combustion engines are least effi-cient and most polluting, the hybrid drives the wheelswith an electric motor. At higher speeds, where an electricmotor lacks sufficient power, a small internal combustiongasoline engine provides an assist. The engine can directlyspin the wheels or spin a generator to provide electricity.The Toyota Prius, which uses both a gasoline engine andan electric motor for propulsion, averages 23.2 km perliter (88 miles per gallon)-about double the mileage of acomparable gasoline car. Within a decade, the gas-electriccombination could be offered in every category of vehiclethe automaker sells, from subcompacts to heavy-dutypickup trucks.3 43 Although hybrid vehicle purchase costsare higher than a comparable nonhybrid, the additionalcost is recovered over time from fuel-cost savings. How-ever, an additional expense may occur, possibly when thehybrid is owned by the second or third owner, when thebattery needs replacement. Currently batteries are war-ranteed for 100,000 miles, and the replacement costshould be on the order of replacing a transmission.
Toyota is marketing its hybrid vehicles to the Mexi-can government and is testing the Prius to learn how toadapt its performance to Mexico City's driving condi-tions.34 4 The Chinese government is also impdsing strictemission and fuel economy standards to encourage auto-makers to introduce hybrid vehicles in its urban areas.
Fuel Cell Vehicles. Hydrogen (H2)-powered fuel cell vehi-cles reduce transportation pollution because the combus-tion of 02 and H2 creates only water vapor as an emission
product. Although the H2 may have been produced froma fossil fuel, the fossil fuel conversion process would mostlikely be at a central facility where emission controls aremore easily applied, and at a lower cost than that ofindividual vehicle controls. H2 can also be produced byelectrolysis of water with energy from solar- or wind-powered generators, and this would provide substantialglobal CO2 emission reductions in addition to the NO,,VOC, and PM 2.5 reductions that affect urban and regionalenvironments. One of 14 vehicles in Japan may use fuelcells by 2020. In the United States, the President's Hydro-gen Fuel Initiative forecasts H2 fuel cell vehicles will enterthe commercial mass market in 2020.345 However, De-Cicco et al.346 believe current market or regulatory forcesare not sufficient to result in fuel cells supplanting con-ventional vehicles in the United States and that othertechnologies will be needed to address transportation en-ergy and pollution problems over the next two decades.In addition to developing the vehicle itself, H2 -poweredvehicles will need a new fuel infrastructure.
A fuel cell can convert H2 into electric energy muchmore efficiently than internal combustion engines canconvert gasoline into mechanical energy. However, a fos-sil fuel well-to-wheels analysis of the energy efficiency offuel generation to energy delivered does not see H2 fuelcell vehicles as a way to reduce CO2 emissions in the next20 years, especially compared with more technologicallydemonstrated options. Improving mainstream gasolineand diesel engines and transmissions, and expanding theuse of hybrids, will better reduce CO2 emissions untilnonfossil means for generating H2 become cost-effective.3 47
Hydrogen-Powered Intemal-Combustion Engine and HybridVehicles. While automakers are advancing fuel cell vehi-cle technologies, the SCAQMD is developing H2 refuelingtechnologies. This is viewed as a bridging technology thatwill provide an incentive to develop H2 storage and fuel-ing technologies. The H2 internal combustion engine ve-hicle project will convert 35 Toyota Prius hybrids to runon H2 instead of gasoline, as well as compare differentfueling strategies and H2 production methods. TheSCAQMD is co-sharing the project cost with a number ofindustries. The Toyota Prius was selected for this demon-stration project because of its advanced hybrid technol-ogy. H2 will be provided for these vehicles through avariety of methods, but mostly through electrolysis,which uses electricity and water. If the electricity werefrom nuclear power, no CO2 emissions would be created.If the electricity were generated from renewable powersources, for example, wind and solar, then there are nopollutant emissions. Whether this can ultimately be donecost-effectively is not yet known. Although use of renew-ables is currently an expensive strategy, the SCAQMD
Journal of the Air & Waste Management Association 667Volume 54 June 2004

Molina and Molina
intends to demonstrate various electrolysis processes toadvance the technology, improve competition, gain ex-perience, and, therefore, reduce the costs to accelerate
commercialization. 162
Ultra-Low Sulfur Fuels. Ultra-low sulfur fuels (S < 10-15ppmw) enable much better emission control technologyand result in less pollution from existing vehicles. Ultra-low sulfur diesel fuel allows the use of diesel particulatefilters and NO. traps.3 42
,349 Greater benefits and cost-
effectiveness are achieved by one major decrease in sulfurcontent than are obtained by incremental reductions overa period of years.3 50 Human health and environmental
benefits because of sulfur reduction exceed costs by afactor of 10.351 However, the natural tendency of govern-ments is to proceed in several steps because financing therequired oil refinery upgrades is costly.
Alternative Fuels. LPG (a mixture of propane and butane)and CNG (methane) are replacing gasoline and diesel fuelin some megacities. Hong Kong converted its entire taxifleet from diesel to CNG. Sao Paulo, Brazil, uses ethanolwhich has a higher 02 content than gasoline. LPG andCNG reduce emissions when they replace low-grade liq-uid fuels in unsophisticated vehicles. The InternationalAssociation for Natural Gas Vehicles shows that Euro III
buses using low-sulfur diesel fuel with continuously re-generating particulate traps emit low PM, but emissions
are still higher than those from CNG-fueled buses, evenwhen the CNG buses have oxidation or three-way cata-lysts. Emissions of aldehydes and mutagenicity were less
for the buses using CNG. Carcinogenic PAHs in CNGemissions were not detected.3 5 2
CNG fueling also mitigates against adulteration witha cheaper fuel. This was a factor in the replacement ofdiesel with CNG buses in Delhi, since the diesel fuel wasfrequently blended with less expensive, and much morepolluting, kerosene sold for home cooking. Brazil usesmore ethanol as automotive fuel than other countries
because of a subsidy for ethanol produced from sugarcane. Although ethanol has no sulfur and low PM and
PAH emissions, it results in higher ambient concentra-tions of alcohols and aldehydes.3 5 3
Economic InstrumentsRegulations take a "command-and-control" approach toemission reductions. Market-based programs are an alter-native to command-and-control regulations3 5 4 ,355 that al-low a broad mix of emission reduction options to beexercised among a group of emitters. These include emis-sion trading and congestion pricing.
Emission Trading. Emission trading has been most widelyapplied to reducing U.S. utility SO, emissions and isgaining favor for global CO2 trading. A group of sourcesemitting into an airshed may be able to reduce overallemissions more cost-effectively by applying stringentcontrols to a few facilities and less stringent controls toothers. This is best accomplished by setting an emissioncap for a region and allocating allowances to the sourceswithin that region. The allowances can be sold by sourcesthat emit less than their allowances to those that emitmore. The price of each allowance will depend on the costof control and the overall emission cap. A source thatinstalls high-efficiency pollution controls has excess cred-its to sell that can offset the cost of control. In some cases,emission reduction targets may be best met by changingthe process or by fuel switching. Successful emission trad-ing includes the following requirements: 1) emissions arenot a local health risk, 2) tradable emissions are measuredaccurately and measurements can be audited, and 3) ad-ministrative costs of operating the trading program arenot excessive (in comparison to the cost of administeringa command-and-control program).
There are two basic kinds of international markets forGHG emission trading. In a "formal" emission tradingmarket (sometimes called "cap and trade"), an interna-tional agreement sets a cap on aggregate emissions for aperiod of time and allocates GHG emission allowancesamong the participating countries for that period. Thenational governments then allocate these allowances tobusinesses within their countries. Emitters must hold al-lowances to cover every unit they emit; they can controlemissions, buy additional allowances if their abatementcosts are high, or sell allowances if their abatement costsare low.
In an "informal" market, an international agreementsets aggregate and national caps on emissions but doesnot allocate formal allowances. Each country may meetits cap through contracts for "abatement services" ob-tained both within and outside its territory. Emitters seek-ing to invest in abatement services may do so in theirhome country, and they may also purchase "credits" foremission reductions generated in other countries, includ-ing those not subject to an overall emission cap.3 56
The SoCAB has established SO2 and NO, credits un-der its Regional Clean Air Incentives Market (RECLAIM)program, which replaces certain command-and-controlregulations with market incentives for facilities that meetthe inclusion criteria. RECLAIM included 335 facilities atthe end of the 2000 compliance year. More than(U.S.)$650 million in RECLAIM Trading Credits (RTC)have been traded since the adoption of RECLAIM, ofwhich more than $48 million occurred in 2002. The an-nual average prices for SO 2 and NO, RECLAIM Trading
668 Journal of the Air & Waste Management Association Volume 54 June 2004

Molina and Molina
Credits during 2002 were below the backstop price of
$15,000 per ton.348
Emission reduction credits may be pegged at less thanone-to-one; the emissions traded are required to be morethan the credit received. This further reduces emissions
with every trade. Emission caps may decrease over time to
take advantage of (or even force) improvements in emis-sion reduction technology. Allowances may also be pur-
chased by environmental advocates and those perma-
nently retired, thereby effectively limiting the upper limiton overall emissions.
Congestion Pricing. Effective February 2003, London im-
plemented a program that charges drivers each time they
enter the central city, similar to the toll charged at majorbridge crossings. A 22 km2 area, 1.2% of greater London,
is subject to the charge. This congestion zone was alwayscrowded with traffic and is also surrounded by perimeter
roads that serve as its boundaries. Charges for individualvehicle registrations can be paid weekly, monthly, or an-
nually. The charge is enforced by fixed and mobile cam-eras that are linked to automatic license plate number
recognition technology. If no record of the £5 charge is
paid by midnight, an £80 penalty is assessed against the
vehicle owner. Persistent evaders are booted or towed.
Exemptions and discounts (average 6000 per day) are
provided for military vehicles, emergency services, taxis
and licensed minicabs, disabled persons, buses, some al-
ternative-fuel vehicles, and some health service workers.There is also a 90% discount for residents of the conges-
tion zone.For the first six months, passenger vehicle traffic de-
creased by 20% while bus usage increased by 14% duringthe peak traffic hours. Bus delays because of traffic con-gestion decreased and bus speeds increased, as did bus
reliability measured in waiting time. There is a concernabout negative financial impact on the local retail sectorand on wider economic activity.3 5 7
For congestion pricing to be successful, the public
needs to support the program. Extended studies and com-
munications between city officials and the public were
made to achieve this in London. Revenues are used only
to reduce congestion and to improve public roads and
transportation. Payments can be adjusted whether con-gestion levels change, since the purpose of the congestioncharge is to elicit a behavioral response from the motoring
public.The cost of congestion is estimated as the cost of the
fuel wasted by driving in a less efficient way, and by the
time lost, compared with free-flowing traffic. It is esti-
mated that drivers wasted 21.6 billion L of fuel, or -60 L
per person per year, in the 75 areas studied by the Texas
Transportation Institute.35 8 Annually, 3.5 billion hours of
extra travel time are caused by traffic congestion. The
total cost of congestion has risen to nearly (U.S.)$70billion a year, which is $4.5 billion more than for theprevious year. Santos 35 9 provides a different approach
that gives lower estimates of marginal congestion costs fordifferent types of roads in the U.K.
Policy ImplementationUrban policy-making is a complicated process that is in-
fluenced more by political and sociological factors thanby scientific knowledge. Good urban planning is needed
to improve megacity air quality by encouraging people to
live closer to where they work, developing cost-effective
and convenient mass transit networks, creating economicactivities outside of megacities to reduce migration incen-tives, and strategically locating industries. Owing to thelimited terms of many politicians and the lack of publicawareness of the benefits, much of this policy is left tochance rather than to careful planning.
BARRIERS TO AIR QUALITY MA-NAGEMENTThe nine case studies of air quality management in Mo-lina et al.3 show that institutional capacity for controlling
pollution is closely linked to financial capacity. Environ-mental planning agencies find themselves with inade-
quate budgets to address statutory mandates. There are
conflicting interests among different government institu-tions; interagency conflicts often need to be resolved
through political means. Megacities usually have multiplemunicipal governments with no regional authority forpollution and transporation issues. In some countries,because of the relatively weak political standing given toenvironmental issues, it is difficult to address air pollutionwhen other needs are more pressing. When environmen-tal and economic development policies conflict, eco-
nomic development has more influence. Independentlyfunded metropolitan institutions are essential to imple-ment effective, but sometimes unpopular, policies to
manage air quality.However, as the economic well-being of megacity
inhabitants increases, so does their concern about theirenvironment, including the air they breathe and oftensee. In the United States, especially in California, citizens
have been vocal about their desire for clean air. The HongKong government has responded promptly to citizens'concerns when the air quality was deemed unacceptable.In Bogota and Santiago, stakeholder participation pro-vided support for measures adopted in the public interest.In Mexico City, however, citizens have shown a fatalisticattitude toward the pollution problem and have been
reluctant to pressure the government for action, except in
the early 1990s, when air quality was at its worst. While
the transport sector and other interest groups have strong
Journai of the Air & Waste Management Association 669Volume, 54 June 2004

Molina and Molina
lobbies, consumers have not organized to demand anefficient, safe, and clean transportation service. In Cairo,as in many lower income megacities, most of the popu-lation is struggling to survive and air pollution is not ahigh priority concern. Although wealthier people in thesecities are aware of and concerned about air pollution, theyare also concerned that the infrastructure might not beable to handle this problem.
Many countries have come up with ideas for control-ling air pollution, but they don't have the technical train-ing to define and implement these ideas. They do nothave sufficient information to establish emission stan-dards, emission inventories, and monitoring networks.Monitoring and modeling capacities are weak and there isa lack of research on health effects. Although severalinternational organizations can provide technical assis-tance, it is better if local groups convince their govern-ments that there is an environmental pollution problem.In the long term, capacity building will be more effectiveto removing barriers than short-term technical help fromoutsiders.
SUMMARY AND FUTURE OUTLOOKAlthough megacities are defined as those with more than10 million inhabitants, there are more than 100 citiesworldwide that contain the same types of problems, andcould even be classified as megacities. These are contigu-ous urban areas that are magnets to growth owing to theconcentration of economic activity, services, and oppor-tunity. Urban areas are growing faster than nonurbanareas, and higher levels of pollution accompany thisgrowth. However, owing to their dense populations, in-creasing wealth, and central governments, megacities canimplement policies that can minimize environmentaldegradation, including air pollution.
Air pollution adversely affects human health throughthe cardiovascular and respiratory systems. Health studiesthroughout the world have reached similar conclusions:PM, 03, and other air pollutants attack the cardiovascularand respiratory systems and are associated with prema-ture mortality as well as sickness. S02 and NO. are themain precursors of acid rain pollution that can harmforests, lakes, and river ecosystems, and also have beenblamed for damaging buildings and statues in cities. SO2and NO, can be generated hundreds of kilometers awayfrom the areas affected by acid rain. Agricultural practicessuch as "slash and burn" generate smoke and precursorsof photochemical smog. These emissions added to theoutflow from urban centers lead to the degradation of airquality on regional scales and also potentially affect cli-mate.
Reducing sulfur in fuel and after-combustion exhausttreatments are strategies that have minimized sulfur air
pollution in practically all cities of the developed world,as well as in many urban centers of the developing world.Much has also been learned about reducing emissions ofphotochemical smog precursors-NO. and VOCs-frommotor vehicles and industrial activities. Efficient cleantechnologies have led to new car emissions of smogprecursors 50-100 times smaller than those from oldercars without emission controls. However, appropriatemaintenance of cars with emission controls, even thenewest cars, is an important issue because when controlsfail emissions increase. Vehicle maintenance is expensiveand establishing regulations and enforcing them for largenumbers of vehicles is difficult, particularly in placeswhere the population has limited economic resources.Fine particulate matter and hazardous VOCs are emittedfrom diesel vehicles, especially those that are old and notwell maintained. New emission control technologies haverecently been developed to reduce particulate matter fromdiesel vehicles, although these technologies require tiltra-low sulfur diesel fuel, which is more expensive to pro-duce. New urban buses designed to use natural gas havelow PM emissions, but may emit high levels of unburnedor partially burned fuel. Conversions of existing vehiclesto use natural gas or LPG must be done correctly if lowemissions are to be achieved.
A variety of measures have been applied to reducemotor vehicle emissions besides engine improvement andexhaust controls. Some of these measures are also aimedat reducing traffic congestion, which in turn exacerbatesemissions. Further, people using congested roads or livingnearby have increased exposure to air pollutants. Oneway to reduce congestion is by limiting the circulation ofvehicles. London has started doing this by charging vehi-cles to enter part of the city. Another example is the "nodrive day" program, which may have unintended conse-quences if not properly designed. In the Mexico City area,it appears to have induced the purchase of a second ve-hicle, often older and more polluting. A more effectivestrategy, restricting the circulation of the vehicles onlyduring peak hours, is being implemented in Bogota, San-tiago, and Sao Paulo.
Given the expected scale of urban population growthin the coming decades,, continued growth in the numberof vehicles will pose an enormous challenge in managingmegacities, especially in the developing nations. Effectivestrategies to control vehicle growth and traffic intensity insome cities can be adopted in others facing similar chal-lenges.
Scientific KnowledgeAir pollution science has progressed steadily in the pastdecades because of improvements in the ability to mea-sure pollutants, precursors, and reactive intermediates.
670 Journal of the Air & Waste MVanagement Association Volume 54 June 2004
Molina and Molina
This information has facilitated the development of im-proved computer models of the complex photochemistrythat cause the formation of ozone, other oxidants and
secondary particulate matter. These scientific advances
motivate further research to gain a better understanding
of how air pollution is formed in megacities and how best
to control it.The MCMA 2003 field measurement campaign dem-
onstrated that it is now possible to measure in real time,
that is, on a time scale of seconds, the gas-phase concen-
trations of a variety of key intermediates in the formation
of photochemical smog, as well as the size-resolved com-position of suspended particles. Such highly time-
resolved data allowed close correlation of photochemicalpollutant precursors, intermediates and products and willlend a better understanding of closely coupled photo-
chemical processes. On the other hand, much remains to
be learned about the complex chemical processes thatcharacterize the atmospheric oxidation of all but the sim-
plest hydrocarbons. Laboratory research and quantum
chemical calculations need to be conducted to furtherelucidate these gas-phase oxidation mechanisms at a mo-
lecular level.In addition, there is a need to better elucidate the
processes that lead to the formation, chemical evolution,growth and removal of atmospheric particles-in partic-ular those containing organic spp. because of their impor-tance for human health and climate change. Although it
is well established that atmospheric particulate matter-PM1 O and PM2 5 -have strong impacts on human health,an important gap exists in our knowledge of the chemical
identity of the particles that actually do the damage.
Organic chemicals such as PAHs adsorbed on soot, as well
as some heavy metals contained in fine particles, are pos-
sible culprits, although it is likely that a variety of com-
pounds are hazardous. Further developments in labora-tory and field instruments for real-time particle
characterization will pay large scientific dividends. It isalso not known what role physical parameters, includingparticle size, surface area, or particle mass play in degrad-ing human-health. Advances in health studies will requirea close collaboration between epidemiologists, physiolo-gists and atmospheric scientists.
However, we should stress that enough is knownalready to amply justify emission control measures aimed
at reducing ambient levels of criteria air pollutants that
exceed current standards. In many cities of the develop-
ing world the concentrations of many criteria pollutants
are not routinely measured, even when the concentra-tions are known or suspected to be high. Thus, there is a
pressing need to start monitoring air pollutant levels rou-
tinely in such cities.
Field measurement campaigns focused on the char-acterization of the outflow of air pollutants from megaci-ties need to be carried out to assess their regional andglobal impacts. There is also a clear need to establishlong-term measurement programs to characterize airquality on a regional to global scale. Such measurementsare challenging: the relatively short atmospheric resi-dence times of spp. such as ozone, NO_ and aerosols (daysto months) require frequent measurements and good spa-
tial coverage, in contrast to long-lived spp. such as CO2
and chlorofluorocarbons, whose global concentration canbe characterized with less than a dozen properly locatedmonitoring stations. A better understanding of the poten-tial climate effects of atmospheric particles, particularlythose containing black carbon or soot, is also required.
Interdisciplinary ResearchTo address the pressing environmental problems con-fronting megacities, it is essential to bring together world-class national and international experts in science, engi-neering, economics, and other social and politicalsciences to engage in collaborative research that leads to
both holistic assessments of the complex environmentalproblems and the development of practical solutions.This will necessarily involve face to-face interactionsamong all relevant stakeholders, including the civic lead-ers responsible for protecting the health of megacity pop-ulations. Cost-effective solutions to such complex prob-lems can only be developed through consensus building.
The methodology adopted must be multidisciplinary,taking into account political, scientific, technical, socialand economic aspects. The social, economic and politicalbarriers characteristic of the megacity problem will needto be recognized and analyzed. A strategy to overcome
these barriers-which might include advocacy, publicpressure, education, etc.-will have to be developedjointly with the relevant stakeholders. Furthermore, var-ious research activities, financial analysis, coordinationand communication among government officials, stake-holders, and experts in the academic and industrial sec-tors will all be required to successfully develop and im-plement air quality improvement plans.
Institutional ImprovementMost urban environmental problems can only be success-fully solved by establishing a strong regional authoritycommitted to reducing pollution. Furthermore, substan-tial progress requires good communication with the pub-
lic. Successful examples of this approach are found in Los
Angeles and Bogota. Deficiencies in air quality manage-ment are also exacerbated by a lapse in integrating rele-
vant metropolitan policies for transportation, land useand air quality, and lack of connection with policies
Journal of the Air & Waste Management Association 671Volume 54 June 2004
Molina and Molina
affecting population, energy supply, and other key urbanfactors. Strong political will is essential to develop insti-tutional capacity, ensure that funding is available andproperly allocated, and to increase local, state, and federalcoordination.
Air pollution is transported from state to state andacross international borders. Therefore, air quality man-agement agencies should be given greater statutory re-sponsibility and authority to deal with these problems ina regional context, and international coordination andcollaboration should be strongly encouraged.
Regulation and EnforcementAn important outcome of the megacity case studies is theimportance of enforcement of emission control strategies.Enabling legislation is important, but enforcement is alsonecessary. If reducing air pollution is not a priority for amegacity, it will almost surely become a worsening prob-lem. Many developing countries have extensive regula-tions on pollution which, however, all too often are notapplied effectively because of the lack of proper institu-tions, legal systems, political will, and competent gover-nance. Unfortunately, established political and adminis-trative institutions are usually obsolete for dealing withthe problems that occur with the expansion of megacities,particularly where economic and social change is rapid.Political leadership is needed to cut through overlappingand conflicting jurisdictions and short-time horizons. Ex-periences in some cities (like Bogota and Santiago) showthat radical and integrated packages of transport mea-sures, based upon management of road space and anenhanced role for high quality bus and rapid transportsystems can deliver efficiency and equity and be econom-ically, environmentally and socially sustainable. But thisis not possible without strong political leadership.
Stakeholder InvolvementOver the past few decades, there have been significantpolitical changes with profound implications for urbanareas and for the urban and global environment. There isincreased pressure from the citizens for participation, ac-countability and transparency in government. Efforts toimprove urban governance involve activities such as pro-moting participatory processes and developing effectivepartnerships with and among all stakeholders of civilsociety, particularly the private and community sectors.Public participation adds legitimacy to these policies andhelps to bring about their success. Many policies will notwork unless stakeholders have ownership and share re-sponsibility for their implementation. Stakeholder partic-ipation can also provide support for unpopular but cost-effective measures adopted in the public interest,especially if these measures are transparent to the public.
In this way, the accountability of public officials andinstitutions can be greatly improved and long-termcontinuity is facilitated, in spite of frequent personnelchanges in government agencies.
Capacity BuildingSome of the common obstacles in the air quality manage-ment in many megacities, especially of the developingnations, include insufficient understanding of the con-nection between the underlying scientific, economic, andsocial issues, and difficulty in comprehensively address-ing the problem with limited personnel, resources, andinfrastructure. There is a clear need to increase the num-ber of professionals-in government, industry, and aca-demic institutions-with a basic understanding of thedifferent aspects of environmental problems.
Sustainable TransportationThere is a strong linkage between air quality and thetransportation sector. First, transportation emissions arethe major cause of air quality problems in many largeurban centers, and the trend in the megacities of thedeveloping world is for these emissions to become thedominant source of air pollutants. Second, economicgrowth is closely linked to personal and freight transpor-tation and efficient mobility, so restrictions to transpor-tation activities, while perhaps improving air quality, couldhinder economic growth. On the other hand, without anytraffic control or infrastructure improvement the increasingnumber of vehicles will cause congestion resulting in bothpoor air quality and hindered economic growth.
The, challenge is thus to improve air quality whileensuring personal and freight mobility. It is clear that nosingle strategy will suffice to achieve this difficult goal.Rather, what is required is a set of integrated strategicoptions involving cleaner fuels, advanced vehicle tech-nologies, institutional change, infrastructure investment,operations improvements, and active stakeholder partic-ipation. Quantitative analyses of transportation strategiesinvolving multi- and inter-modal networks need to becarried out, taking into account both personal mobilityand freight transportation needs.
Reduction in per-vehicle emission levels resultingfrom new, clean technologies is often largely offset byincreases in the numbers of vehicles in many large urbancenters. This growth in the size of the vehicle fleet has inturn generated serious congestion and air quality prob-lems. Growth in vehicle ownership needs to be decoupledfrom daily vehicle usage, an approach that requires theavailability of very efficient public transportation. Histor-ically rapid urban public transport systems were builtunderground or on dedicated rail lines. A much less ex-pensive alternative is to use surface streets and BRT
672 Journal of the Air & Waste Management Association Volume 54 June 2004
Molina and Molina
systems, such as the one developed in Bogota, whereprime road space was allocated to low emission buses,
resulting in reduced travel duration, improved air quality,and increased pedestrian space and bike use, while de-
creasing private vehicle use. Santiago de Chile has also
initiated a BRT and integrated bus-metro system, revers-ible street directions, and land-use planning structure tosignificantly reduce trip duration. A BRT system is alsounder development in the Mexico City metropolitan area,which already has an extensive metro system.
Clean Vehicle and Fuel TechnologyIn terms of mobile source emissions, new vehicle technol-ogy has been responsible for enormous improvements innew vehicle emissions performance. In California, 40years of such improvements have resulted in a slow but
consistent reduction in air pollution despite the hugeincrease in the numbers of vehicles and vehicle miles
traveled. The use of clean vehicle technologies in devel-
oping countries is occurring because vehicle emissionscontrols are being applied worldwide, as gasoline fuelquality has been improved through removal of lead. Thenext generation of new gasoline vehicle emissions controltechnology will depend on reducing sulfur to very lowlevels. Emissions from diesel trucks, motorcycles, andtwo-stroke engines have not progressed as rapidly. Issuessuch as fuel contamination and limited financial re-sources make dealing with pollution from these vehiclesdifficult. Progress is being made in some countries by fuelswitching to CNG and removing two-stroke engines.
Improved Inspection and Maintenance ProgramFitting vehicles with advanced emission control technol-ogies is not sufficient; appropriate maintenance is essen-tial. Further, old vehicles remain in the fleet because thecost of replacement is often perceived as being too highfor populations in the developing world, because the con-sequent public health costs are not taken into account. Infact, these countries frequently use the cast off vehiclesthat people in the developing world no longer want, oftenbecause the vehicle is polluting too much. This problem isparticularly difficult to solve with heavy-duty vehicles,because the existing fleet is likely to remain functional for
decades and cannot be ignored. Heavy-duty vehicle emis-sions standards are evolving, and one of the technologiesof growing interest is the retrofit of oxidation catalystswith particulate traps for diesel engines. In Hong Kong,for example, 40,000 diesel vehicles were successfully ret-rofit with oxidation catalysts.
Appropriate maintenance and a good emissions in-spection and maintenance program may be difficult toimplement, and yet the alternative is more expensive.There are several requirements for a successful inspection
and maintenance program: very strict enforcement,public awareness, good inspector training, and separationof testing and repair. Government enforcement and au-diting is also very important.
CONCLUSIONSMuch progress has been made in combating air pollutionproblems in developed and some developing worldmegacities. However, there continue to be many areaswhere comprehensive solutions appear to be elusive. Bylearning from the experiences in other regions, govern-ment officials may be able to overcome problems thatappear insurmountable. There is no single strategy foraddressing air pollution problems in megacities. A mix ofpolicy measures best suited for each city's challenges andcustoms will be needed to improve air quality. An impor-tant lesson learned throughout the world is that address-ing air quality issues effectively requires a holistic ap-proach: one that takes into account scientific, technical,existing infrastructure, economic, social, and political fac-tors. A successful result will be to arrive at integratedcontrol strategies that are effectively implemented andembraced by the public.
ACKNOWLEDGMENTSThe authors gratefully acknowledge the contribution of R.Slott, Massachusetts Institute of Technology; C.E. Kolb,Aerodyne Research, Inc.; P.K. Gbor, F. Meng, R. Singh, 0.Galvez, and JJ. Sloan, University of Waterloo; W. Ander-son, Boston University; X.Y. Tang, M. Shao, T. Zhu, Y.H.
Zhang, and M. Hu, Peking University; B.R. Gurjar, MaxPlanck Institute for Chemistry; P. Artaxo, Institute of
Physics, University of Sao Paulo; P. Oyola, Santiago; E.Gramsch, Universidad de Santiago; D. Hidalgo, S.A.Akiris, Bogota; and A. Gertler, Desert Research Institute,who provided valuable comments, unpublished data,text, and figures for this review. We also appreciate thehelp of M. Zavala, B. de Foy, R. Volkamer, and C. Pastor.Finally, we thank Judith C. Chow and John Watson of theDesert Research Institute of the University and Commu-nity College System of Nevada for their careful commentsand reviews.
REFERENCES1. United Nations Population Division. World Urbanization Prospects:
Tlhe 2003 Revision; 2004. Available at: http://www.un.org/esa/popu-lation/publications/wup2003/2003WUPHighlights.pdf.
2. Chow, J.C.; Engelbrecht, J.P.; Watson, J.G.; Wilson, W.E.; Frank,N.H.; Zhu, T. Designing Monitoring Networks to Represent OutdoorHuman Exposure. Ceiemosphere 2002, 49(9), 961-978.
3. Molina, L.T.; Molina, Mj.; Slott, R.; Kolb, C.E.; Gbor, P.K.; Meng, F.;Singh, R.; Galvez, O.; Sloan, Jj.; Anderson, W.; Tang, X.Y.; Shao, M.;Zhu, T.; Zhang, Y.H.; Hu, M.; Gurjar, B.R.; Artaxo, P.; Oyola, P.;Gramsch, E.; Hidalgo, D.; Gertler, A. 2004 Critical Reviewv Supplement:Air Quality in Selected Megacities; J. Air & Waste Manage. Assoc. 2004(online only). Available at: http://www.awma.org/journal.
4. United Nations CyberSchoolBus. Cities of Today, Cities of Tomorrow!2004. Available at: http://un.org/cyberschoolbus/habitat/projdesc.asp.
Joumal of the Air & Waste Management Association 673Volume 54 June 2004
Molina and Molina
5. Gottmann, J. Megalopolis: The Urbanized Northeastern Seaboard of theUnited States; The Twentieth Century Fund: New York, 1961.
6. Birdsall, S.S.; Florin, J. An Outline ofAmerican Geographiy; 1998. Avail-able at: http://usinfo.state.gov/products/pubs/geography/geogO4.htm.
7. United Nations Centre for Human Settlements. State of the World'sCities 2001; United Nations Centre for Human Settlements (Habitat):Nairobi, 2001.
8. United Nations Environmental Program. Global Environmental Out-look 3; Earthscan Publications, Ltd.: London, 2003.
9. Kuznets, S. Economic Growth and Income Inequality. Am. Econ. Rev.1955, 45(1), 1-28.
10. Levin, S. Fragile Dominion, Complexity and, the Commons; Helix Books,Perseus Publishing, 1999.
11. Molina, L.T.; Molina, Mj. Air Quality in thze Mexico Megacity: AnIntegrated Assessment; Molina, L.T., Molina, Mj., Eds.; Kluwer Aca-demic Publishers: Dordrecht, The Netherlands, 2002.
12. National Research Council. GlobalAir Quality: An Imperative for Long-Term Observational Strategies; National Academy Press: Washington,DC, 2001.
13. Thundiyil, K. Rising Temperatures and Expanding Magacities: Im-proving Air Quality in Mexico City through Urban Heat Island Mit-igation; Master Thesis, MIT, Cambridge, MA, 2003.
14. Hardoy, J.E.; Mitlin, D.; Satterthwaite, D. Environmental Problems inThird World Cities; Earthscan: London, 1992.
15. Hardoy, J.E.; Caimcross, S.; Satterthwaite, D. Thle Poor Die Young:Housing and Healtlh in T7hird World Cities; Hardoy, J.E., Cairncross, S.,Satterthwaite, D., Eds.; Earthscan: London, 1990.
16. McGranahan, G. Household Environmental Problems in Low-In-come Cities: An Overview of Problems and Prospects for Improve-ment. Habitat Intemational 1993, 17(2), 105-121.
17. Satterthwaite, D. Sustainable Cities or Cities that Contribute to Sus-tainable Development? Urban Studies 1997, 34(10), 1667-1691.
18. Listorti, J.A. Is Environmental Health Really a Part of EconomicDevelopment- or only an Afterthought? Environ. Urbanization 1999,11, 1.
19. Organization for Economic Cooperation and Development. Shapingthe Urban Environment in the 21st Century: From Understanding to Ac-tion. A DACReference Manual on Urban Environmental Policy; Organi-zation for Economic Cooperation and Development: Paris, 2000.
20. Butler, B.E. Consultation with National Experts: Managing Contam-inated Land. U/NEP Industry and Environment 1996, 19, 2.
21. Rees, W.E.; Wackernagel, M. Our Ecological Footprint: Reducing HunanImpact on the Earthz; New Sodety Publishers: Gabriola, BC, Canada,1995.
22. World Wildlife Fund. Living Planet Report; 2002. Available at: http://www.panda.org/news-facts/publications/general/livingplanet/index.cfm.
23. United Nations Population Fund. Thze State of the World Population;2001. Available at: http://www.unfpa.org/swp/2001/english.
24. Hardoy, J.E.; Mitlin, D.; Satterthwaite, D. Environmental Problems in anUrbanizing World; Earthscan: London, 2001.
25. United Nations Environmental Program/World Health Organization.Urban Air Pollution in Megacities of the World; Blackwell Publisher:Oxford, 1992.
26. GEMS/AIR. Air Quality Management and Assessment Capabilities in 20Major Cities; The Monitoring and Assessment Research Center: Lon-don, 1996.
27. Decker, E.H.; Elliot, S.; Smith, F.A.; Blake, D.R.; Rowland, F.S. Energyand Material Flow Through the Urban Environment. Ann. Rev. EnergyEnviron. 2000, 25, 685-740.
27a. Carmichael, G.R.; Ferm, M.; Thongboonchoo, N.; Woo, J.H.; Chan,L.Y.; Murano, K.; Viet, P.H.; Mossberg, C.; Bala, R.; Boonjawat, J.;Upatum, P.; Mohan, M.; Adhikary, S.P.; Shrestha, A.B.; Pienaar, Jj.;Brunke, E.B.; Chen, T.; Jie, T.; Guoan, D.; Peng, L.C.; Dhiharto, S.;Harjanto, H.; Jose, A.M.; Kimani, W.; Kirouane, A.; Lacaux, J.; Rich-ard, S.; Barturen, O.; Cerda, J.C.; Athayde, A.; Tavares, T.; Cotrina,J.S.; Bilici, E. Measurements of Sulfur Dioxide, Ozone and AmmoniaConcentrations in Asia, Africa, and South America Using PassiveSamplers. Attmos. Environ. 2003, 37(9-10), 1293-1308.
28. Mayer, M.; Wang, C.; Webster, M.; Prinn, R.G. Linking Local AirPollution to Global Chemistry and Climate. j. Geophiys. Res. 2000,105, 22869-22896.
29. World Bank. World Development Indicators; World Bank: New York,2003.
30. World Bank World Development Indicators; World Bank: New York,2002; pp 174-175.
31. Beaton, S.P.; Bishop, G.A.; Stedman, D.H. Emission Characteristics ofMexico City Vehicles. JAWVMA 1992, 42(11), 1424-1429.
32. Bishop, G.A.; Stedman, D.H.; de la Garza Castro, J.; Davalos, Fj.On-Road Remote Sensing of Vehicle Emissions in Mexico. Enivron.Sci. Technol. 1997, 31(12), 3505-3510.
33. Comisi6n Ambiental Metropolitana/lnstituto Mexicano del Petr6 leo.Auditoria Integral al Programa de Verificacidn Velhicutlar; Reportpublished by Comisi6n Ambiental Metropolitana and Instituto Mexi-cano del Petr6leo: Mexico City, November 2000.
34. Marr, L.C.; Grogan, L.A.; Wohrnschimmel, H.; Molina, L.T.; Molina,Mj. Vehicle Traffic as a Source of Particulate Polycyclic AromaticHydrocarbon Exposure in the Mexico City Metropolitan Area. Envi-inn. Sci. Technol. 2004, 38, 2584-2592.
35. Dockery, D.W.; Pope, C.A., III; Xu, X.; Spengler, J.D.; Ware, J.H.; Fay,M E.; Ferris, B.G.; Speizer, F.E. An Association Between Air Pollutionand Mortality in Six U. S. Cities. N. Engl. J. Med. 1993, 329(24),1753-1759.
36. Pope, C.A.; Thun, MJ.; Namboodiri, M.M.; Dockery, D.W.; Evans,J.S.; Speizer, F.E.; Heath, C.W. Particulate Air Pollution as a Predictorof Mortality in a Prospective Study of U. S. Adults. Am. J. Respir. Crit.Care Med. 1995, 151(3.1), 669-674.
37. Abbey, D.E.; Nishino, N.; McDonnell, W.F.; Burchette, RJ.; Knutsen,S.F.; Beeson, W.L.; Yang, J.X. Long-Term Inhalable Particles andOther Air Pollutants Related to Mortality in Nonsmokers. Am. J.Respir. Crit Care Med. 1999, 159, 373-382.
38. Krewski, D.; Burnett, R.T.; Goldberg, M.S.; Hoover, K.; Siemiatycki,J.;Jarrett, M.; Abrahamowicz, M.; White, W.H. Particle EpidemiologyReanalysis Project Part II: Sensitivity Analysis; Health Effects Institute:Cambridge, MA, 2000.
39. Borja-Aburto, V.H. ; Loomis, D.P.; Bangdiwala, S.I.; Shy, C.M.; Ras-con-Pacheco, R.A. Ozone, Suspended Particulates, and Daily Mortal-ity in Mexico City. Am. I. Epidemiol. 1997, 145(3), 258-268.
40. Borja-Aburto, V.H.; Castillejos, M.; Gold, D.R.; Bierzwinski, S.; Loo-mis, D.P. Mortality and Ambient Fine Particles in Southwest MexicoCity, 1993-1995. Environ. Health Perspect 1998, 106(12), 849-855.
41. Loomis, D.; Castillejos, M.; Gold, D.R.; McDonnell, W.; Borja-Aburto,V.H. Air Pollution and Infant Mortality in Mexico City. Epidemiology1999, 10(2), 118-123.
42. Castillejos, M.; Borja-Aburto, V.H.; Dockery, D.W.; Gold, D.R.; Loo-mis, D. Airborne Coarse Particles and Mortality in Mexico City. Inhal.Toxicol. 2000, 12(Suppl 1), 61-72.
43. Tellez-Rojo, M.M.; Romieu, L.; Ruiz-Velasco, S.; Lezana, M.A.;Hernandez-Avila, M. Daily Respiratory Mortality and Air Pollution inMexico City: Importance of Considering Place of Death. Eur. Respir. J.2000, 16, 391-396.
44. Levy, J.I.; Hammitt, J.K.; Spengler, J.D. Estimating the Mortality Im-pacts of Particulate Matter: What can be Leamed from Between-StudyVariability? Environ. Healthz Perspect. 2000, 108, 109-117.
45. Evans, J.; Levy, J.; Hammitt, J.; Santos-Burgoa, C.; Castillejos, M.;Caballero-Ramirez, M.; Hernandez-Avila, M.; Riojas-Rodriguez, H.;Rojas-Bracho, L.; Serrano-Trespalacios, P.; Spengler,.J.D.; Suh, H.Health Benefits of Air Pollution Control. In Air Quality in the MexicoMegacity: An Integrated Assessment; Molina, L.T., Molina, MJ., Eds.;Kluwer Academic Publishers: Dordrecht, The Netherlands, 2002; pp105-136.
46. Ontario Medical Association. The Illness Cost of Air Pollution in On-tario: A Summary of Findings; 2000.
47. Bumett, R.T.; Cakmak, S.; Brook, J.R. The Effect of the Urban Ambi-ent Air Pollution Mix on Daily Mortality Rates in 11 Canadian Cities.Canadian J. Public Healtlh 1998, 89(3), 152-156.
48. Toronto Public Health. Toronto Air Quality Index: Healthi Link Analysis;Toronto, 2001.
49. Pengley, D.; Szakolcai, A.; Birmingham, B.; Cole, D.; Muller, P.;Bailey, S.; Bell, R.; Socha, A. Human Health Risk Assessrnent for PriorityAir Pollutants; McMaster Institute of Environment Health, McMasterUniversity: Hamilton, 1997.
50. Sahsuvaroglu, T.; Jerret, M.A. A Public Health Assessment of Mortalityand Hospital Admissions Attributed to AirPollution in Hamilton; McMas-ter Institute of Environment Health, McMaster University: Hamilton,2003.
51. Pande, J.N.; Bhatta, N.; Biswas, D.; Pandey, R.M.; Ahluwalia, G.;Siddaramaiah, N.H.; Khilnani, G.C. Outdoor Air Pollution and Emer-gency Room Visits at a Hospital in Delhi. IndJ Chest Diseases &-AlliedSd 2002, 44(1), 13-19.
52. Cropper, M.L.; Simon, N.B.; Alberini, A.; Sharma, P.K. 77Te HealthEffects of Air Pollution in Delhi, India; PRD Working Paper #1860;Policy research working paper by The World Bank, 1997.
53. Xu, X.; Gao, J.; Dockery, D.W.; Chen, Y. Air Pollution and DailyMortality in Residential Areas of Beijing, China. Arch. Environ. Health1994, 49(4), 216-222.
54. Xu, X.; Dockery, D.W.; Christiani, D.C.; Li, B.; Huang, H. Associationof Air Pollution with Hospital Outpatient Visits in Beijing. Arch.Environ. Healtli 1995, 50, 214-220.
55. Dong, J.; Xu, X.; Chen, Y.; Dorkery, D.W.; Jiang, J. Research on theRelationship Between Air pollution and Daily Mortality in BeijingUrban Resident in 1990-1991. 1. Hygiene Research 1995, 24(4), 212-214.
56. Zhang, J.; Song, H.; Tong, S.; Li, L.; Liu, B.; Wang, L. Ambient SulfateConcentration and Chronic Disease Mortality in Beijing. Sci. TotalEnviron. 2000, 262(1-2), 63-71.
57. Zhang, J.; Zhou, Q.; Xie, S.; Xie, X. Study on the Association BetweenAmbient Air Quality and Daily Death in Beijing. 1. Environ. Healti2003, 20(2), 75-78.
674 Journal of the Air & Waste Management Association Volume 54 June 2004

Molina and Molina
58. Chang, G.; Pan, X.; Xie, X.; Gao, Y. Time Series Analysis on theRelationship Between Air Pollution and Daily Mortality in Beijing. J.Hygiene Research 2003, 32(6), 565-568.
59. Chang, G.; Wang, L.; Pan, X. Study on the Association BetweenAmbient Air Pollutant and Hospital Outpatient Visit or EmergencyRoom Visit in Beijing. Chiina J. of Sclool Doctor 2003, 17(4), 295-297.
60. Wang, L.; Xu, X.; Zhou, Y.; Zhang, J.; Zeng, B.; Du, Z.; Chen, A.;Huang, X. Relationship Between Air Pollution and Changes in Chil-dren's Peak Expiratory Flow (PEF). J. Environ. Healthi 1994, 11(6),243-246.
61. Zhang, J.; Wang, L.; Pan, X. The Effects of Air Pollution on Pupil'sPulmonary Function in Beijing. J. Environ. Health 1995, 12(5), 206-209.
62. Xu, X.; Wang, L. Synergistic Effects of Air Pollution and PersonalSmoking on Adult Pulmonary Function. Arch. Environ. Health 1998,53, 44-53.
63. Xu, X.; Ding, H.; Wang, X. Acute Effects of Total Suspended Particlesand Sulfur Dioxides on Preterm Delivery: A Community-Based Co-hort Study. Arch. Environ. Healthz 1995, 50, 407-415.
64. Sanhueza, P.; Vargas, C.; Jimenez, J. Daily Mortality in Santiago andits Relationship with Air Pollution. Rev. Medica de Chile 1999, 127(2),235-242.
65. Cifuentes, L.A.; Vega, J.; Kopfer, K.; Lave, L.B. Effect of the FineFraction of Particulate Matter Versus the Course Mass and OtherPollutants on Daily Mortality in Santiago, Chile. JAWMA 2000,50(8), 1287-1298.
66. Koyano, M.; Endo, O.; Katoh, M.; Valdivia, R.; Marileo, M.I.; Morita,K.; Goto, S.; Matsushita, H. Polynuclear Aromatic Hydrocarbon Con-centration and Mutagenicity of Airborne Particles in Urban Air: Com-parison of Tokyo Area and Santiago. J. of Healthi Sd. 2002, 48(3),256-262.
67. Ochoa-Acuhta, H.; Roberts, S.M. An Estimation of Cancer Risks Posedby Exposure to Particulate Matter in Air in Santiago, Chile. Toxicol.Sd. 2003, 72(1), 1909.
68. Ilabaca, M.; Olaeta, I.; Campos, E.; Villaire, J.; Tellez-Rojo, M.M.;Romieu, I. Association Between Levels of Fine Particulate and Emer-gency Visits for Pneumonia and Other Respiratory Illnesses amongChildren in Santiago, Chile. JAWMA 1999, 49(PM), PM154-PM163.
69. Saldiva, P.H.N., Lichtenfels, AJ.F.C.; Paiva, P.S.O.; Barone, I.A.; Mar-tins, M.A.; Massad, E.; Pereira, J.C.R.; Xavier, V.P.; Singer, J.M.; Bohm,G.M. Association.Between Air Pollution and Mortality Due to Respi-ratory Diseases in Children in Sao Paulo, Brazil: A Preliminary Report.Environ. Res. 1994, 65(2), 218-225.
70. Saldiva, P.H.N.; Pope, C.A., III; Schwartz, J.; Dockery, D.W.; Lichten-fels, Aj.F.C.; Salge, J.M.; Barone, I.; Bohm, G.M. Air Pollution andMortality in Elderly People: A Time-Series Study in Sao Paulo, Brazil.Arch. Environ. Healthi 1995, 50(2), 159-163.
71. Braga, A.L.F.; Saldiva, P.H.N.; Pereira, L.A.A.; Menezes, JJ.C.; Concel-cao, G.M.S.; Lin, C.A.; Zanobett, A.; Schwartz, J.; Dockery, D.W.Health Effects of Air Pollution Exposure on Children and Adolescentsin Sao Paulo, Brazil. Pediatric Pulmnonology 2001, 31, 106-113.
72. Watson, J.G. Visibility: Science and Regulation. JAVWMA 2002, 52(6),628-713.
73. Bergin, M.H.; Cass, G.R.; Xu, J.; Fang, C.; Zeng, L.M.; Yu, T.; Salmon,L.G.; Kiang, C.S.; Tang, X.Y.; Zhang, Y.H.; Chameides, W.L. AerosolRadiative, Physical, and Chemical Properties in Beijing during June1999. f. Geophys. Res. 2001, 106(D16), 17969-17980.
74. Yang, D.; Yan, P.; Xu, X. Characteristics of Aerosols under Dust andSand Weather in Beijing. f. Appl. Meteorol. 2002, 13, 185-194.
75. Song, Y.; Tang, X. Source Apportionment on Fine Particles in Beijing.Environ. Sci. 2002, 23(6), 11-16.
76. Health Canada. National Ambient Air Quiality Objectives for ParticulateMatter: Aestlietic Effects; 2003. Available at: http://www.hc.sc.gc.ca/hecs-sesc/air_quality/publications/particulate_matter_exec_summary/aesthetic effects.htm.
77. Caceres, T.; Rubio, M.A.; Lissi, E. Rain Water Composition in San-tiago de Chile. Contribuciones Cientfficas y Tecn. 1980, 48(XVII).
78. Caceres, T.; Soto, H.; Lissi, E.; Cistemas, R. Indoor House Pollution:Appliance Emissions and Indoor Ambient Concentrations. Atmos.Environ. 1983, 17(5), 1009-1013.
79. Ortiz, J.; Solezzi, S.; Prendez, M.M. Size Composition of Particles inthe Atmosphere of Santiago. Bol. Soc. Chiil. Quim. 1982, 27(1), 286-289.
80. Sanhueza, E.; Lisi, E.; Rubio, M.A. Comparative Study of the EmissionLevels in Two Latin American Capitals: Caracas and Santiago. In StiIntemational Congress on Pure Air, Buenos Aires, Argentina, 1982.
81. Trier, A. Observations on Inhalable Atmospheric Particulates in San-tiago, Chile. f. Aerosol Sci. 1984, 15, 419-421.
82. Trier, A.; Silva, C. Inhalable Urban Atmospheric Particulate Matter ina Semi-Arid Climate. Atmos. Environ. 1987, 21, 977-983.
83. Trier, A.; Horvath, H. A Study of the Aerosol of Santiago de Chile - II.Mass Extinction, Coefficients, Visibilities and Angstrom Exponents.Atmos. Environ. 1993, 27A(3), 385-395.
84. Trier, A.; Firinguetti, L. A Time Series Investigation of Visibility in anUrban Atmosphere. Atmos. Environ. 1994, 28(5), 991-996.
85. Horvath, H.; Catalan, L.; Trier, A. A Study of Aerosol of Santiago deChile III: Light Absorption Measurements. Atmos. Environ. 1997,31(22), 3737-3744.
86. Gramsch, E.; Catalan, L.; Ormeno, I.; Palma, G. Traffic and SeasonalDependence of the Absorption Coefficient in Santiago de Chile. Appl.Opt 2000, 39(27), 4895-4901.
87. Gramsch, E.; Catalfn, L.; Ormeflo, I.; Palma, G.; Oyola, P. Monitoringof the Light Absorption Coefficient in Santiago de Chile and Com-parison with Aerosol and Elemental Carbon Mass. Rev. Mex. Fis.2002, 48(3), 128-130.
88. Torriero, E.A. As Egyptians Burn Hay, Black Clouds Smell like City ison Fire. Chiicago Tribune, 2002. Available at: http://www.bradenton.cori/mld/bradenton/news/world/4840088.htm.
89. Tabbara, A. Cairo's Mysterious 'Black Cloud'; 2003. Available at: http://middle-east-online.com/english/?id= 7600= 7600&format=O.
90. El-Shahawy, M.A.; Hanna, A.F. Meteorological Conditions Leading toAir Pollution Episodes in Greater Cairo City (Egypt). Geoplhys. Res.Abstracts 2003, 5(00103). Available at: http://www.cosis.net/ab-stracts/EAE03/00103/EAE03-J-00103.pdf.
91. Agence France Presse. Cairo's 'Black Cloud' Sparks Debate. BusinessDay 2004. Available at: http://www.bday.co.za/bday/content/direct/1,3523,1471013-6078-0,00.html.
92. Sirri, 0. Black and Still Black. Cairo Time 2002, 6(38 (Nov. 28-Dec 11,2002)). Available at: http://www.cairotimes.com/news/pollutionO638.html.
93. National Acid Precipitation Assessment Program. 1990 Integrated As-sessment Report, 24 Volumes; National Acid Precipitation AssessmentProgram: Washington, DC, 1990.
94. Galloway, J.N. Anthropogenic Mobilization of Sulphur and Nitrogen:Immediate and Delayed Consequences. Annu. Rev. Energy Environ.1996, 21, 261-292.
95. Paerl, H.W. Enhancement of Marine Primary Productivity byNitrogen-Enhanced Acid Rain. Nature 1985, 316, 747-749.
96. Owens, NJ.P.; Galloway, J.N.; Duce, R.A. Episodic Atmospheric Nitro-gen Deposition to Oligotrophic Oceans. Nature 1992, 357, 397-399.
97. Michaels, A.F.; Siegel, D.A.; Johnson, Rj.; Knap, A.H.; Galloway, J.N.Episodic Inputs of Atmospheric Nitrogen to the Sargasso Sea: Con-tributions to New Production and Phytoplankton Blooms. GlobalBiogeochiem. Cycles 1993, 7, 339-351.
98. Stevens, Cj.; Dise, N.B.; Mountford, J.O.; Gowling, DJ. Impact ofNitrogen Deposition on the Species Richness of Grasslands. Science2004, 303, 1876-1879.
99. Guttikunda, S.K.; Carmichael, G.R.; Calori, G.; Eck, C.; Woo, J.H. TheContribution of Megacities to Regional Sulfur Pollution in Asia. At-mos. Environ. 2003, 37(1), 11-22.
100. U.S. Nuclear Regulatory Commission. Rethiinking thie Ozone Problem inUrban and Regional Air Pollution; National Academy Press: Washing-ton, DC, 1991.
101. Chameides, W.L.- Kasibhatla, P.S.; Yienger,J.; Levy, H., ll. Growth ofContinental-Scale Metro-Agro-Plexes, Regional Ozone Pollution andWorld Food Production. Science 1994, 264, 74-77.
102. Chameides, W.L.; Hu, H.; Liu, S.C.; Bergin, M.; Zhou, X.; Mearns, L.;Wang, G.; Kiang, C.S.; Saylor, R.D.; Luo, C.; Huang, Y.; Steiner, A.;Giorgi, F. Case Study of the Effects of Atmospheric Aerosols andRegional Haze on Agriculture: An Opportunity to Enhance CropYields in China through Emission Controls? Proceed. Nat. Acad. Sci.1999, 26, 3626-3633.
103. Chameides, W.L.; L, X.S.; Tang, X.Y.; Zhou, Xj.; Luo, C.; Kiang, C.S.;St. John, J.; Saylor, R.D.; Liu, S.; Lam, K.S.; Wang, T.; Giorgi, F. IsOzone Pollution Affecting Crop Yields in China? Geop7hys. Res. Lett.1999, 26, 867-870.
104. Akimoto, H. Global Air Quality and Pollution. Science 2003, 302,1716-1719.
105. Gregg, J.W.; Jones, C.G.; Dawson, T.E. Urbanization Effects on TreeGrowth in the Vicinity of New York City. Natuire 2003, 424,183-187.
106. Fenn, M.E.; Bauer, L.I.; Hemandez-Tejeda, T. Urban Air Pollution andForests; Fenn, M.E., Bauer, L.I., Hernandez-Tejeda, T., Eds.; Springer:New York, 2002.
107. Cohan, D.S.; Xu, J.; Greenwald, R.; Bergin, M.H.; Chameides, W.L.Impact of Atmospheric Aerosol Light Scattering and Absorption onTerrestrial Net Primary Productivity. Global Biogeochiem. Cycles 2002,16, doi:10.1029/2001GB001441.
108. Kaiser, D.P.; Quian, Y. Decreasing Trends in Sunshine Duration overChina for 1954-1998: Indication of Increased Haze Pollution? Geo-phtys. Res. Lett. 2002, 29, 2042-2045.
109. Bergin, M.H.; Greenwald, R; Xu, J.; Berta, Y.; Chameides, W.L. Influ-ence of Aerosol Dry Deposition on Photosynthetically Active AvailableRadiation to Plants. Geophlys. Res. Lett. 2001, 28, 3605-3608.
110. Intergovernmental Panel on Climate Change. Climate Chlange 2001:Thie Scientific Basis, Houghton, J.T., Ed.; Cambridge University Press:Cambridge, 2001.
111. Krmger, O.; Grassel, H. Albedo reduction by absorbing aerosols overChina. Geophlys. Res. Lett. 2004, 31, doi:10.1029/2003GL019111.
Journal of the Air & Waste Management Association 675Volume 54 June 2004

Molina and Molina
112. Quian, Y.; Giorgi, F. Regional Climatic Effects of AnthropogenicAerosols? The Case of Southwestern China. Geophys. Res. Lett. 2000,27, 3521-3524.
113. Menon, S.; Hansen, J.E.; Nazarenko, L.; Luo, Y. Climate Effects ofBlack Carbon Aerosols in China and India. Science 2002, 297(5590),2250-2252. Available at: http://www.sdencemag.org/cgi/reprint/297/5590/2250.pdf.
114. Rosenfeld, D. Suppression of Rrain and Snow by Urban and IndustrialAir Pollution. Science 2000, 287, 1793-1796.
115. Ackerman, A.S.; Toon, O.B.; Stevens, D.E.; Heymsfield, AJ.; Ra-manathan, V.; Welton, EJ. Reduction of Tropical Cloudiness by Soot.Science 2000, 288(5468), 1042-1047.
116. Berntsen, T.K.; Karlsdottir, S.;Jaffe, D.A. Influence of Asian Emissionson the Composition of Air Reaching the Northwestern United States.Geophys. Res. Lett. 1999, 26, 2171-2174.
117. Jacob, DJ.; Logan, J.A.; Murti, P.P. Effect of Rising Asian Emissions onSurface Ozone in the United States. Geophiys. Res. Lett. 1999, 26,2175-2178.
118. Stohl, A.; Trickl, T. A Textbook Example of Long Range Transport:Simultaneous Observations of Ozone Maxima of Stratospheric andNorth American Origin in the Free Troposphere over Europe. J.Geophys. Res. 1999, 104, 30445-30462.
119. Yienger, JJ.; Galanter, M.; Holloway, T.A.; Phadnis, Mj.; Guttikunda,S.K.; Carmichael, G.R.; Moxim, WJ.; Levy, H. The Episodic Nature ofAir Pollution Transport from Asia to North America. J. Geophys. Res.2000, 105, 26931-26945.
120. Edwards, D.P.; Lamarque, J.F.; Attie, J.L.; Emmons, L.K.; Richter, A.;Cammas, J.P.; Gille, J.C.; Francis, G.L.; Deeter, M.N.; Wamer, J.;Ziskin, D.C.; Lyjak, L.V.; Drummond, J.R.; Burrows, J.P. TroposphericOzone over the Tropical Atlantic: A Satellite Perspective. J. Geophys.Res. 2003, 108, 4237-4258.
121. National Acid Precipitation Assessment Program. Acid Deposition:State of Science and Technology, Volume I-Emissions, Atmnospheric Pro-cesses, and Deposifion; National Acid Precipitation Assessment Pro-gram: Washington, DC, 1991.
122. U.S. Nuclear Regulatory Commission. Protectdng Visibility in NationalParks and Wildemess Areas; National Academy Press, 1993.
123. Kiehl, J.T.; Schneider, T.L.; Portmann, R.W.; Solomon, S. ClimateForcing Due to Tropospheric and Stratosphernc Ozone. J. Geophys.Res. 1999, 104, 31239-31254.
124. Gauss, M.; Myhre, G.; Pitari, G.; Prather, MJ.; Isaksen, I.S.A.; Bernt-sen, T.K.; Brasseur, G.P.; Dentener, FJ.; Derwent, R.G.; Hauglustaine,D.A.; Horowitz, L.W.; Jacob, DJ.; Johnson, M.; Law, K.S.; Mickley,LJ.; Mtiller, J.F.; Plantevin, P.H.; Pyle, J.A.; Rogers, H.L.; Stevenson,D.S.; Sundet, J.K.; van Weele, M.; Wild, 0. Radiative Forcing in the21st Century Due to Ozone Changes in the Troposphere and theLower Stratosphere. J. Geophys. Res. 2003, 108(D9), 4292-4312.
125. Intergovernmental Panel on Climate Change. Climate Chanzge 2001:The Scientific Basis, Houghton,J.T., Ding, Y., Griggs, DJ., Noguer, M.,van der Linden, PJ., Dal, X., Maskell, K., Johnson, C.A., Eds.; Cam-bridge University Press: Cambridge, 2001.
126. Ramanathan, V.; Crutzen, PJ. New Directions: Atmospheric BrownClouds. Atmos. Environ. 2003, 37, 4033-4035.
127. Crutzen, PJ. The Growing Urban Heat and Pollution Island Effect:Impact on Chemistry and Climate. Atmos. Environ. 2004, in press.
128. Prinn, R.G.; Huang, J.; Weiss, R.F.; Cunnold, D.M.; Fraser, PJ.; Sim-monds, P.G.; McCulloch, A.; Harth, C.; Salameh, P.; O'Doherty, S.;Wang, R.HJ.; Porter, L.; Miller, B.R. Evidence for Substantial Varia-tions of Atmospheric Hydroxyl Radicals in the Past Two Decades.Science 2001, 282, 1882-1998.
129. Dentener, F.; Peters, W.; Krol, M.; van Weele, M.; Bergamaschi, P.;Lelieveld, J. Interannual Variability and Trend of CH4 Lifetime as aMeasure for OH Changes in the 1979-1993 Time Period. J. Geophys.Res. 2003, 108, 4442-4453.
130. Bates, T.S.; Huebert, BJ.; Gras, J.L.; Griffiths, F.B.; Durkee, P.A. Inter-national Global Atmospheric Chemistry (IGAC) Project's First Aero-sol Characterization Experiment (ACE 1): Overview. J, Geophys. Res.1998, 103(D13), 16297-16318.
131. Ridley, B.A.; Robinson, E. The Mauna Loa Observatory Photochem-istry Experiment. J. Geophys. Res. 1992, 97, 10285.
132. Atlas, E.A.; Ridley, B.A. The Mauna Loa Observatory PhotochemistryExperiment: Introduction. J. Geophys. Res. 1996, 101, 10285.
133. Atlas, E.L.; Ridley, B.A.; Cantrell, C.A. The Tropospheric Ozone Pro-duction about the Spring Equinox (TOPSE) Experiment: Introduc-tion. J. Geophys. Res. 2003, 108, 8353-8362.
134. Huebert, BJ.; Bates, T.; Russell, P.B.; Shi, G.; Kim, YJ.; Kawamura, K.;Carmichael, G.; Nakajima, T. An Overview of ACE-Asia: Strategies forQuantifying the Relationships Between Asian Aerosols and TheirClimatic Impacts. J. Geoplhys. Res. 2003, 108, 8633-8652.
135. Hoell, J.M.; Davis, D.D.; Liu, S.C.; Newell, R.; Shipham, M.; Akimoto,H.; McNeal, Rj.; Bendura, RJ.; Drewry, J.W. Pacific Exploratory Mis-sion-West A (PEM-West A): September-October 1991. 1. Geophys. Res.1996, 101, 1641.
136. Hoell, J.M.; Davis, D.D.; Liu, S.C.; Newell, R.; Akimoto, H.; McNeal,R1J.; Bendura, RJ. The Pacific Exploratory Mission-West Phase B:February-March 1994. J. Geoplhys. Res. 1997, 102, 28223.
137. Hoell, J.M.; Davis, D.D.; Jacob, DJ.; Rodgers, M.O.; Newell, R.E.;Fuelberg, H.E.; McNeal, RJ.; Raper, J.L.; Bendura, Rj. PacificExploratory Mission in the Tropical Pacific. J. Geophtys. Res. 1999,104, 5567-5583.
138. Talbot, R.W. Chemical Characteristics of Continental Outflow fromAsia to the Troposphere over the Western Pacific Ocean DuringFebruary-March 1994: Results from PEM-West B. J. Geophlys. Res.1997, 102, 28255.
139. Raper, J.L.; Kleb, M.M.; Jacob, DJ.; Davis, D.D.; Newell, R.E.; Fuel-berg, H.E.; Bendura, RJ.; Hoell, J.M.; McNeal, Rj. Pacific ExploratoryMission in the Tropical Pacific: PEM-Tropics B, March-April 1999. J.Geophlys. Res. 2001, 106, 32401-32426.
140. Jacob, DJ.; Crawford, J.; Kleb, M.M.; Connors, V.S.; Bendura, RJ.;Raper, J.L.; Sachse, G.W.; Gille, J.; Emmons, L.; Heald, J.C. Transportand Chemical Evolution over the Pacific (TRACE-P) Mission: Design,Execution, and First Results. J. Geophiys. Res. 2003, 108, 9000.
141. Davis, D.D. An Assessment of Western North Pacific Ozone Photo-chemistry Based on Springtime Observations from NASA's PEM-WestB (1994) and TRACE-P (2001) Field Studies. J. Geophlys. Res. 2003,108, 8829.
142. Carmichael, G.R. Regional-Scale Chemical Transport Modeling inSupport of Intensive Field Experiments: Overview and Analysis of theTRACE-P Observations. J. Geophlys. Res. 2003, 108, 8823.
143. Lelieveld, J.; Crutzen, PJ.; Ramanathan, V.; Andreae, M.O.; Bren-ninkmeijer, C.A.M.; Campos, T.; Cass, G.R.; Dickerson, R.R.; Fischer,H.; de Gouw, J.A.; Hansel, A.; Jefferson, A.; Kley, D.; de Laat, A.TJ.;Lal, S.; Lawrence, M.G.; Lobert, J.M.; Mayol-Bracero, O.L.; Mitra, A.P.;Novakov, T.; Oltmans, SJ.; Prather, K.A.; Reiner, T.; Rodhe, H.;Scheeren, H.A.; Sikka, D.; Williams, J. The Indian Ocean Experiment:Widespread Air Pollution from South and Southeast Asia. Science2001, 291(5506), 1031-1036.
144. Russell, P.B.; Hobbs, P.V.; Stowe, L.L. Aerosol Properties and Radia-tive Effects in the United States East Coast Haze Plume: An Overviewof the Troposphere Aerosol Radiative Forcing Observational Experi-ment (TARFOX). J. Geophlys. Res. 1999, 104(D2), 2213-2222.
145. Prados, A.I.; Dickerson, R.R.; Doddridge, B.G.; Milne, P.A.; Moody,J.L.; Merrill, J.T. Transport of Ozone and Pollutants from NorthAmerica to the North Atlantic Ocean During the 1996 Atmosphere/Ocean Chemistry Experiment (AEROCE) Intensive. J. Geophiys. Res.1999, 104, 26219.
146. Raes, F.; Bates, T.; McGovern, F.; Van Liedekerke, M. The 2nd AerosolCharacterization Experiment (ACE-2): General Overview and MainResults. Tellhis B 2000, 52, 111-125.
147. Fehsenfeld, F.C.; Daum, P.; Leaitch, W.R.; Trainer, M.; Parrish, D.D.;Hubler, G. Transport and Processing of 03 and 03 Precursors overthe North Atlantic: An Overview of the 1993 North Atlantic RegionalExperiment (NARE) Summer Intensive. J. Geophlys. Res. 1996, 101,28877.
148. Penkett, S.A.; Volz-Thomas, A.; Fehsenfeld, F.C. Preface to SpecialSection: North Atlantic Regional Experiment (NARE II). J. Geoplhys.Res 1998, 103, 13353.
149. Cowling, E.B.; Chameides, W.L.; Kiang, C.S.; Fehsenfeld, F.C.;Meagher, J.F. Introduction to Special Section: Southern OxidantsStudy Nashville/Middle Tennessee Ozone Study. J. Geoplhys. Res.1998, 103, 22209.
150. Meagher,J.F.; Cowling, E.B.; Fehsenfeld, F.C.; Parkhurst, WJ. OzoneFormation and Transport in Southeastern United States: Overview ofthe SOS Nashville/Middle Tennessee Ozone Study. J. Geophlys. Res.1998, 103, 22213.
151. Huibler, G.; Alvarez, R.; Daum, P.; Dennis, R.; Gillani, N.; Kleinman,L.; Luke, W.; Meagher, J.; Rider, D.; Trainer, M.; Valente, R. AnOverview of the Airborne Activities during the Southern OxidantsStudy (SOS) 1995 Nashville/Middle Tennessee Ozone Study. J. Geo-phlys. Res. 1998, 103, 22245.
152. Croes, B.E.; Fujita, E.M. Overview of the 1997 Southem CaliforniaOzone Study (SCO597-NARSTO). Atinos. Environ. 2003, 37(Suppl. 2),S3-S26.
153. Ryerson, T.B.; Trainer, M.; Angevine, W.M.; Brock, C.A.; Dissly, R.W.;Fehsenfeld, F.C.; Frost, GJ.; Goldan, P.D.; Holloway, J.S.; Hubler, G.;Jakoubek, R.O.; Kuster, W.C.; Neuman, J.A.; Nicks, D.K.. Jr.; Parrish,D.D.; Roberts, J.M.; Sueper, D.T.; Atlas, E.L.; Donnelly, S.G.; Flocke,F.; Fried, A.; Potter, W.T.; Schauffler, S.; Stroud, V.; Weinheimer, AJ.;Wert, B.P.; Wiedinmyer, C.; Alvarez, RJ.; Banta, R.M.; Darby, L.S.;Senff, CJ. Effect of Petrochemical Industrial Emissions of ReactiveAlkenes and NOx on Tropospheric Ozone Formation in Houston,Texas. J. Geoplhys. Res. 2003, 108(D8), ACH 8-1-ACH 8-24.
154. Mallet, M.; Roger, J.C.; Despiau, S.; Dubovik, O.; Putaud, J.P. Micro-physical and Optical Properties of Aerosol Particles in Urban Zoneduring ESCOMPTE. Atmos. Res. 2003, 69(1-2), 73-97.
155. Volz-Thomas, A.; Geiss, H.; Kalthoff, N. Precursor Experiment(SLOPE): Scientific Background and Main Results. J. Geophiys. Res.2000, 105, 1553-1562.
676 Joumal of the Air & Waste Management Association Volurne 54 June 2004

Molina and Molina
156. Volz-Thomas, A.; Geiss, H.; Hofzumahaus, A.; Becker, K.H. Introduc-tion to Special Section: Photochemistry Experiment in BERLIOZ. J.Geophys. Res. 2003, 108, 8252-8272.
157. Neftel, A.; Spirig. C.; Prevot, A.S.H.; Furger, M.; Stutz, J.; Vogel, B.;Hjorth, J. Sensitivity of Photooxidant Production in the Milan Basin:An Overview of Results from a EUROTRAC-2 Limitation of OxidantProduction Field Experiment. J. Geophys. Res. 2002, 107, 8188.
158. United Nations Environment Program. Northeast Asian dust and sandstorms growing in scale and intensity - lTNEP Newvs Release 2004/17;2004. Available at: http://www.unep.org/Documents.Multilingual/Default.Print.asp?DocumentlD =389&ArticlelD=4401&1=en.
159. Fang, X.; Li, L.; Xie, Y. Difference of Air Pollution during the DustStorm Process in Beijing. J. Beijing Normal University (Natural Science)2003, 39, 407-411.
160. Meng, Z.; Hu, M.; Guo, X.; Li, D.; Pan, X. Studies on Effects of Duststormon Human Health. Chin. J. Public Health 2003, 19, 471-472.
161. AQMD (South Coast Air Quality Management District). Response toJoseph Romm's op-ed article in Los Angeles Times o07 March 28, 2004;2004. Available at: http://www.aqmd.gov/newsl/2004/response-to-joseph romm.html.
162. AQMD. Historic Ozone Air Quality Trends, 2004. Available at: http://www.aqmd.gov/smog/o3trend.html.
162a.AQMD. Air Quality Standards Compliance Report December 2002 andSummary Statistics for 2002, Vol. 15, Issue 12, 2003. Available at:http://www.aqmd.gov/smog/AQSCR2002/aqO2web.pdf.
162b. California Air Resources Board. The 2003 Califomia Almanac of Emis-sions and Air Quality; 2003. Available at: http://www.arb.ca.gov/aqd/almanac/almanacO3/almanacO3.htm.
163. Garza, G.; Ruiz, C. La ciudad de Mexico en el sistema urbano nacio-nal. In La Ciudad de MAxico en el fin del Segundo Milenio; El Colegio deMexico: Mexico, 2000.
164. Garza, G. La Ciudad de Me.xico en el fin del Segundo Milenio; El Colegiode Mexico: Mexico, 2000.
165. Instituto Nacional de Estadistica, G.e. I. Resultados preliminares delcenso general de poblacidn y vivienda; Mexico, 2000.
166. Ward, P. Mexico City; John Wiley and Sons: New York, 1998.167. Lezama, J.L.; Favela, R.; Galindo, L.M.; Ibarraran, M.E.; Sanchez, S.;
Molina, L.T. Forces Driving Pollutant Emissions in the MCMA. In AirQuality in the Mexico Megacity: An Integrated Assessment; Molina, L.T.,Molina, Mj., Eds.; Kluwer Academic Publishers: The Netherlands,2002; pp 61-104.
168. Colorado Air Quality Control Commission. Report to the GeneralAssembly on Motor Vehiicle Emissions Adjustment and Repair; 1998.
169. Garza, G. Uncontrolled Air Pollution in Mexico City. Cities 1996,13(5), 315-328.
170. Bossert, J.E. An Investigation of Flow Regimes Affecting the MexicoCity Region. J. AppL Meteorol. 1997, 36, 119-140.
171. Fast, J.D.; Zhong, S. Meteorological Factors Associated with Inhomo-geneous Ozone Concentrations within the Mexico City Basin. J.Geophiys. Res. 1998, 103(D15), 18927-18946.
172. Doran, J.C., Abbott, J.L.; Archuleta, J.; Bian, X.; Chow, J.C.; Coulter,R.L.; de Wekker, S.FJ.; Edgerton, S.A.; Fernandez, A.; Fast, J.D.;Hubbe, J.M.; King, C.W.; Langley, D.; Leach, J.M.; Lee, J.T.; Martin,TJ.; Martinez, D.; Martinez, J.L.; Mercado, G.; Mora, V.; Mulhearn,M.; Pena, J.L.; Petty,' R.; Porch, W.M.; Russell, C.; Salas, R.; Shannon,
J.D.; Shaw, Wj.; Sosa, G.; Watson, J.G.; Templeman, B.; White, R.;Whiteman, C.D.; Wolfe, D. The IMADA-AVER Boundary Layer Ex-periment in the Mexico City Area. Bull. Am. Meteor. Soc. 1998,79(11), 2497-2508.
173. Whiteman, C.D.; Zhong, S.; Bian, X.; Fast, J.D.; Doran, J.C. BoundaryLayer Evolution and Regional-Scale Diurnal Circulations over theMexico Basin and Mexican Plateau. J. Geophys. Res. 2000, 105(D8),10081-10102.
174. Molina, MJ.; Molina, L.T.; West, J.; Sosa, G.; Sheinbaum-Pardo, C.;San-Martini, F.; Zavala, M.A.; McRae, G. Air Pollution Science in theMCMA: Understanding Source-Receptor Relationships throughEmissions Inventories, Measurements, and Modeling. In Air Qualityin tie Mexico Megacity: An Integrated Assessment; Molina, L.T., Molina,MJ., Eds.; Kluwer Academic Publishers: Dordrecht, The Netherlands,2002; pp 137-202.
175. Gakenheimer, R.; Molina, L.T.; Sussman, J.; Zegras, C.; Howitt, A.;Makler, J.; Lacy, R.; Slott, R.S.; Villegas, A.; Molina, Mj.; Sanchez, S.The MCMA Transportation System: Mobility and Air Pollution. In AirQuality in the Mexico Megacity: An Integrated Assessment; Molina, L.T.,Molina, MJ., Eds.; Kluwer Academic Publishers: Dordrecht, TheNetherlands, 2002; pp 213-284.
176. Japan International Cooperation Agency. Thie Sstudy on7 Air PollutionControl Plan in the Federal District, Final Report; Japan InternationalCooperation Agency in collaboration with Departamento del DistritoFederal: Mexico City, 1988.
177. Japan International Cooperation Agency. The Study on Air PollutionControl Plan of Stationary Sources in the Metropolitan Area of the City ofMexico, Final Report; Japan International Cooperation Agency incollaboration with Departamento del Distrito Federal: Mexico City,1991.
178. Departamento del Distrito Federal. Progratna Integral Contra la Con-taminaci6n Aatmosferica: Un Comproniso Cornin (PICCA); Departa-mento del Distrito Federal: Mexico City, 1990.
179. Fujita, E.M.; Croes, B.E.; Bennett, C.L.; Lawson, D.R.; Lurmann, F.W.;.Main, H.H. Comparison of Emission Inventory and Ambient Con-centration Ratios of CO, _NMOG, and NO, in California's SouthCoast Air Basin. JAWMA 1992, 42(3), 264-276.
180. Fujita, E.M.; Watson, J.G.; Chow, J.C.; Lu, Z. Validation of the Chem-ical Mass Balance Receptor Model Applied to Hydrocarbon SourceApportionment in the Southern California Air Quality Study.Enivron. Sd. Tec7lmiol. 1994, 28(9), 1633-1649.
181. Fujita, E.M.; Watson, J.G.; Chow,J.C.; Magliano, K.L. Receptor Modeland Emissions Inventory Source Apportionments of NonmethaneOrganic Gases in California's San Joaquin Valley and San FranciscoBay Area. Atnios. Environi. 1995, 29(21), 3019-3035.
182. Harley, R.A.; Russell, A.G.; McRae, Gj.; Cass, G.R.; Seinfeld, J.H.Photochemical Modeling of the Southern California Air QualityStudy. Enivron. Sci. Teclhniol. 1993, 27(2), 378-388.
183. Departamento del Distrito Federal, G.d. E.d. M. S.d. M. A. R. N.y. P.a.S.d. S. Programa Para Mejorar la Calidad del Aire en el Valle de Mexico,1995-2000 (PROAIRE); Mexico City, 1996.
184. Instituto Nacional de Ecologia. Segunldo Iinforme Sobre la Calidad delAire en Ciuidades Mexicanas; 1998.
185. Comisi6n Ambiental Metropolitana. Invetztario de Emisionies 1996 deIa Zona Metropolitana del Valle Mixico; Comisi6n Ambiental Metro-politana: Mexico City, 1999.
186. Comisi6n Ambiental Metropolitana. Inventarlo de Emisiones 1998 de laZona Metropolitana del Valle Mexico; Preliminary version (reported inAugust, 2001); Comisi6n Ambiental Metropolitana: Mexico City, 2001.
187. Comisi6n Ambiental Metropolitana. Inventario de Emisiones de laZona Metropolitana del Valle de Mexico; Comisi6n Ambiental Metro-politana: Mexico City, 2003.
188. Natural Resources Canada. Land and Fres7wvater Areas in Canada,2001; 2001. Available at: http://atlas.gc.ca/site/english/facts/surfareas.html.
189. Statistics Canada. Canada's Populationi, Preliminary Estimates; 2003.Available at: http://www.statcan.ca/Daily/English/030625/d030625e.htm.
190. Statistics Canada. Population Density, 2001 Census of Canada; 2003.Available at: http://geodepot.statcan.ca/Diss/Maps/ThematicMaps/population/National/pop_dens colour e.pdf.
191. City of Toronto. Strategic Directions: City of Toronto's EnvironmentalPlan; City of Toronto, 2000.
192. Phillips, D. T7he Climates of Canada; Environment Canada, 1990.193. Smith, J.; Lavender, B.; Auld, H.; Broadhurst, D.; Bullock, T. Adapting
to Climate Variability and Chlanige in Ontario; Environment Canada,1998.
194. Ontario Ministry of Environment. Air Quiality OntaHio; 2003. Avail-able at: http://www.airqualityontario.com.
195. Ontario Ministry of Environment. Air Quality in Ontario, 2001 Report;Toronto, 2001.
196. Chtcherbakov, A. Personal Communication; Ontario Ministry of En-vironment, 2003.
197. Lee, P.K.H.; Brook, J.R.; Dabek-Zlotorzynska, E.; Mabury, S.A. Identi-fication of the Major Sources Contributing to PM2,5 Observed inToronto. Environ. Sc. Teclinol. 2003, 37(21), 4831-4840.
198. Varshney, C.K.; Aggarwal, M. Ozone Pollution in the Urban Environ-ment of Delhi. Atmos. Environ. 1992, 26B, 291-294.
199. Singh, A.; Sarin, S.M.; Shanmugam, P.; Sharma, N.; Attri, A.K.; Jain,V.K. Ozone Distribution in the Urban Environment of Delhi duringWinter Months. Atmos. Environ. 1997, 31(20), 3421-3427.
200. Economic Survey of Delhi. Economic Survey of Delhti 2001-02; Plan-ning Department, Government of National Capital Territory ofDelhi, Delhi Secretariat: New Delhi, 2002.
201. Tully, M. Ram Clhanidler's Story; Penguine Books Ltd.: London, 1995.202. Gurjar, B.R.; Lelieveld, J. Air Quality and Emission Trends in a Mega-
city: The Case of Delhi. In Proceedings of tie 4ti7 Intemational Confer-ence on Urban Air Quiality: Measuirement, Modelling and Management,Chiares University, Sokhi, R. S., Brechler, J., Eds.; Prague Czech Repub-lic, 2003; pp 187-190.
203. Department of Environment. Towards Cleaner Air: A Case Stuldy ofDelhli; Department of Environment, Government of NCT of Delhiand Delhi Pollution Control Committee: New Delhi, 2003.
204. Varshney, C.K.; Padhy, P.K. Total Volatile Organic Compounds inthe Urban Environment of Delhi. JAWMA 1998, 48(5), 448-453.
205. Central Pollution Control Board. Air Quality in Delhii (1989-2000);Central Pollution Control Board, 2001.
206. The Energy and Resources Institute. Review ofPast and On-Going Workon Urban Air Quality in India; TERI Report No. 2001EE41; TERI: NewDelhi, 2001.
207. Central Pollution Control Board. Air Quiality of Delhli; 2004. Availableat: http://cpcb.delhi.nic.in/bulletin/bul.htm.
208. The Energy and Resources Institute. State of Environment Report forDelhzi 2001; TERI Report No. 2000EE65; TERI: New Delhi, 2001.
eJournal of the Air & Waste MVanagement Association 677VcJlurre 54 June 2004
Molina and Molina
209. Singb, M.P.; Goyal, P.; Basu, S.; Agarwal, P.; Nigam, S.; Kumar, M.;Panwar, T.S. Predicted and Measured Concentrations of Traffic Car-bon Monoxide over Delhi. Atmos. Environ. 1990, 24A(4), 801-810.
210. Singh, M.P.; Goyal, P.; Panwar, T.S.; Agarwal, P.; Nigam, S. Predictedan Observed Concentrations of S02, SPM and NOx over Delhi. At-mos. Environ. 1990, 24A(4), 783-788.
211. Central Pollution Control Board. Pollution Statistics; Central Pollu-tion Control Board: New Delhi, 1994.
212. Saxena, S.; Dayal, V. Total Exposure as a Basis for the EconomicValuation of Air Pollution in India. Energy Environ. Monitor 1997,13(2), 93-102.
213. Mitra, A.P. Introductory Comments: Methodology for ProducingInventory of GHGs and Other Pollutants. In Proceedings of Workshiopof IGES/APN Mega-city Project, January 23-25, 2002; Kitakyushu, Ja-pan, 2002.
214. Auto Fuel Policy Report. Report of the Expert Committee on Auto FutelPolicy; Ministry of Petroleum and Gas, Govt. of India: New Delhi, 2002.
215. Sharma, C.; Dasgupta, A.; Mitra, A.P. Future Scenarios of Inventoriesof GHGs and Urban Pollutants from Delhi and Calcutta. In Proceed-ings of svorkshzops of IGES. APN mega-city project, January 23-25, 2002;Kitakyushu, Japan, 2002.
216. Sharma, C.; Dasgupta, A.;'Mitra, A.P. Inventory of GHGs and OtherUrban Pollutants from Agriculture and Waste Sectors in Delhi andCalcutta. In Proceedings of Workshops of IGES. APN Mega-City Project,January 23-25, 2002; Kitakyushu, Japan, 2002.
217. Sharma, C.; Dasgupta, A.; Mitra, A.P. Inventory of GHGs and OtherUrban Pollutants from Transport Sector in Delhi and Calcutta. InProceedings of Workslhops of IGES. APN Mega-City Project, January 23-25, 2002; Kitakyushu, Japan, 2002.
218. Bose, R.K. Energy Demand and Environmental Implications in UrbanTransport-Case of Delhi. Atmos. Environ. 1996, 30(3), 403-412.
219. The Energy and Resources Institute. Environmental Aspects of EnergyUse.in Large Indian Metropolises; TERI Project Report No. 94EM53;TERI: New Delhi, 1997.
220. Kandlikar, M.; Ramachandran, G. Causes and Consequences of Par-ticulate Air Pollution in Urban India: A Synthesis of the Science.Annu. Rev. Energy Environ. 2000, 25, 629-684.
221. Central Pollution Control Board. Transport Fuel Quality for Year 2005;PROBES/78/2000-01; Central Pollution Control Board: New Delhi,2000.
222. Ministry of Environment and Forests. Status Report for Delhi 21. DelhiUrban Environment and Infrastnrctuire Improvement Project; Ministry ofEnvironment and Forests, Gov't. of India and Planning Department,Gov't. of National Capital Territory of'Delhi: New Delhi, 2001.
223. Beijing Environmental Protection Bureau. The Report on the State ofEnvironment in Beijing of 2001; 2002.
224. Shi, Z.; Shao, L.; Jones, T.P.; Whittaker, A.G.; Lu, S.; Berube, K.A.; He,T.; Richards, Rj. Characterization of Airborne Individual ParticlesCollected in an Urban Area, a Satellite City and a Clean Air Area inBeijing, 2001. Atmos. Environ. 2003, 37(29), 4097-4108.
225. He, K.; Yang, F.; Ma, Y.; Zhang, Q.; Yao, X.; Chan, C.K.; Cadle, S.;Chan, T.; Mulawa, P. The Characteristics of PM2 5 in Beijing, China.Atmos. Environ. 2001, 35(29), 4959-4970.
226. He, K.B.; Huo, H.; Zhang, Q. Urban Air Pollution in China: CurrentStatus Characteristics and Progress. Ann. Rev. Energy Environ. 2002,27, 397-431.
227. Shao, M.; Zhao, M.; Bai, Y.; Li, J.; Tang, X. The Research on NMHCEmissions from Anthropogenic Source in Beijing. Chiina ExperimentalSci. 1994, 14(1), 6-11.
228. Wang, Z.; Bai, Y.; Zhang, S. A Biogenic Volatile Organic CompoundsEmission Inventory for Beijing. Atinos. Environ. 2003,37,3771-3782.
229. Wang, Y.; Zhou, L. The Organic Compounds-The Precursor of Or-ganic Aerosol in Beijing. Climate and Environ. Res. 2000, 5(1), 13-19.
230. He, K; Yu, X.; Lu, Y.; Hao, J.; Fu, L. Integrated Analysis of Urban AirPollution Control. Urban Environ. & Urban Ecology 2003, 16(6), 267-269.
231. He, K.; Yu, X.; Lu, Y.; Hao, J.; Fu, L. Characterization of Urban AirPollution Sources. Urban Environ. & Urban Ecology 2003, 16(6), 269-271.
232. Lissi, E.; Rubio, M.A. Daily Air Pollution Profile in Santiago. Bull. Soc.Chiilena deq Uimica 1980, 25(3), 249.
233a. Prendez, M.; Ortiz, J.; Cortes, E.; Cassorla, V. Elemental Composi-tion of Airborne Particulate Matter from Santiago, Chile. JAPCA1984, 34, 54-56.
233b. Horvath, H.; Trier, A.; Catalan, L. The Relationship between Indoorand Outdoor Soot Concentration in an Urban Environment. f.Aerosol Sd. 1989, 20, 1273-1276.
234. Romero, H.; Ihl, M.; Rivera, A.; Zalazar, P.; Azocar, P. Rapid UrbanGrowth, Land-Use Changes and Air Pollution in Santiago, Chile.Atmos. Environ. 1999, 33(24-25), 4039-4047.
235. Rappengluck, B.; Oyola, P.; Olaeta, I.; Fabian, P. The Evolution ofPhotochemical Smog in the Metropolitan Area of Santiago de Chile.J. Appl. Meteorol. 2000, 39(3), 275-290.
236. Kavouras, I.G.; Koutrakis, P.; Tsapakis, M.; Lagoudakd, E.; Stephanou,E.G.; Von Baer, D.; Oyola, P. Source Apportionment of Urban Particu-late Aliphatic and Polynuclear Aromatic Hydrocarbons (PAHs) usingMultivariate Methods. Environ. Sd. Technol. 2001, 35(11), 2288-2294.
237. Chen, T.Y.; Simpson, Ij.; Blake, D.R.; Rowland, F.S. Impact of theLeakage of Liquefied Petroleum Gas (LPG) on Santiago Air Quality.Geophys. Res. Left. 2001, 28(11), 2193-2196.
238. Kavouras, I.G.; Koutrakis, P.; Cereceda-Balic, F.; Oyola, P. SourceApportionment of PM5 o and PM2 .5 in Five Chilean Cities usingFactor Analysis. JAWVMA 2001, 51(3), 451-464.
239. Tsapakis, M.; Lagoudaki, E.; Stephanou, E.G.; Kavouras, I.G.;Koutrakis, P.; Oyola, P.; Von Baer, D. The Composition and Sourcesof PM25, Organic Aerosol in Two Urban Areas of Chile. Atmos. Envi-ron. 2002, 36(23), 3851-3863.
240. Rutllant, J.; Garreaud, R. Meteorological Air Pollution Potential forSantiago, Chile: Towards an Objective Episode Forecasting; env monass 1995, 34(3), 223-244.
241. Perez, P.; Trier, A.; Reyes, J. Prediction of PM 2 5 ConcentrationsSeveral Hours in Advance using Neural Networks in Santiago, Chile.Atmos. Environ. 2000, 34(8), 1189-1196.
242. Silva, C.; Perez, P.; Trier, A. Statistical Modeling and Prediction ofAtmospheric Pollution by Particulate Material: Two NonparametricApproaches. Environmetrics 2001, 12(2), 147-159.
243. Perez, P.; Trier, A. Prediction of NO and NO2 Concentrations Near aStreet with Heavy Traffic in Santiago, Chile. Atnos. Environ. 2001,35(10), 1783-1789.
244. Jorquera, H.; Palma, W.; Tapia, J. An Intervention Analysis of Air QualityData at Santiago, Chile. Atmnos. Environ. 2000, 34(24), 4073-4084.
245. Jorquera, H. Air Quality at Santiago, Chile: A Box Modeling Approach1. Carbon Monoxide, Nitrogen Oxides and Sulfur Dioxide. Atmnos.Environ. 2002, 36(2), 315-330.
246. Jorquera, H. Air Quality at Santiago, Chile: A Box Modeling ApproachI. PM 2 .5 Coarse and PMIO Particulate Matter Fractions. Atnos. Envi-ron. 2002, 36(2), 331-344.
247a.Perez, P. Characterization and Prediction of S02 Concentrations inthe Atmosphere of Santiago, Chile. Rev. Mex. Fis. 2002, 48(3), 111-112.
247b. Silva, C.; Quiroz, A. Optimization of the Atmospheric Pollution Mon-itoring Network at Santiago de Chile. Atnos. Environ. 2003, 37(17),2337-2345.
248. Garreaud, R.D.; Rutlant, J.; Quintana, J.; Carrasco, J.; Minnis, P.CIMAR-5: A Snapshot of the Lower Troposphere over the SubtropicalSoutheast Pacific. Bull. Am. Meteor. Soc. 2002, 82(10), 2193-2208.
249. Garreaud, R.D.; Rutlant, J.; Fuenzalida, H. Coastal Lows along theSubtropical West Coast of South America: Mean Structure and Evo-lution. Mon. Weathier Rev. 2002, 130, 75-88.
250. Garreaud, R.D. Cold Air Incursions over Subtropical South America:Mean Structure and Dynamics. Mon. Weathler Rev. 2000, 128, 2544-2559.
251. Grosjean, D.; Miguel, A.H.; Tavares, T.M. Urban Air Pollution inBrazil: Acetaldehyde and Other Carbonyls. Atnos. Environ. Part B:Urban Atnosplhere 1990, 24B(1), 101-106.
252. Tanner, R.L.; Miguel, A.H.; de Andrade, J.B.; Gaffney, J.S.; Streit, G.E.Atmospheric Chemistry of Aldehydes: Enhanced Peroxyacetyl Ni-trate Formation from Ethanol-Fueled Vehicular Emissions. Enivron.Sci. Technol. 1988, 22(9), 1026-1034.
253. Sanchez-Ccoyllo, O.R.; de Fatima Andrade, M. The Influence of Me-teorological Conditions on the Behavior of Pollutants Concentra-tions in Sao Paulo, Brazil. Environ. Poll. 2002, 116(2), 257-263.
254. CETESB. RelatorHo de Qualidade do ar no Estado de SCio Paulo - 2002;CETESB: Companhia de tecnologia de saneamento ambiental de SioPaulo, 2002.
255. Castanho, A.D.A.; Artaxo, P. Wintertime and Summertime Sao PauloAerosol Source Apportionment Study. Atnos. Environ. 2001, 35(29),4889-4902.
256. Alonso, C.D.; Martins, M.H.R.B.; Romano, J.; Godinho, R. Sao PauloAerosol Characterization Study. JAWMA 1997, 47(12), 1297-1300.
257. Miranda, R.M.; Andrade, M.F.; Worobiec, A.; van Grieken, R. Char-acterization of Aerosol Particles in the Sao Paulo Metropolitan Area.Athnos. Environ. 2002, 36, 345-352.
258. Bogota Distrito Capital. Bogota en cifras; 2004. Available at: http://www.bogota.gov.co/bogota/decide.php?patron= 1.08.
259. Behrentz, E. Research Project Concept Note, Analysis of GreenhouseGas Emissions in Bogota City; prepared for Advance Institute onUrbanization, Emissions, and the Global Carbon Cycle, Universidadde Los Andes, Bogota, Columbia by Environmental Science andEngineering Program, School of Public Health, University of Califor-nia: Los Angeles, CA, 2003. Available at: http://www.bol.ucla.edu/-ebehrent/bogota.pdf.
260. Veeduria Distrital. Indice de Condiciones de Vida y Condiciones delAire en Bogota 2002. Boletin Vivir en Bogotd: Indicadores Sociales 2003,12. Available at: http://www.veeduriadistrital.gov.co/es/grupo/g30/ATT1073427713-1.pdf.
261. Hidalgo, D. The Backbone of the Mobility Strategy of Bogota: Trans-Milenio. Public Transport ontemational Magazine 2003, 5. Available at:http://www.uitp-pti.com/currentiss/.
262. Sturchio, N.; Sultan, M.; Sharkaway, M.E.; Maghraby, A.E.; Taher, A.Concentration and Isotopic Composition of Lead in Urban ParticulateAir, Cairo, Egypt; Argonne National Laboratory, Argonne, IL, and
678 Journal of the Air & Waste Management AssociationV Volumne 54 June 2004
Molina and Molina
Center for Environmental Hazard Mitigation, Cairo University,Cairo, Egypt, 1996.
263. Nasralla, M.M. Air Pollution in Greater Cairo. In Proceeding of thleItalian-Egyptian Stuidy-Days on the Environment, Cairo, Egypt, October9-20, 1994; 1994.
264. Rodes, C.E.; Nasralla, M.M.; Lawless, P.A. An Assessment and SourceApportionment of Airbome Particulate Matter in Cairo, Egypt; Activityreport No. 22; prepared for USAID Mission to Egypt under EHPactivity No. 133-RCm delivery order No. 7, 1996.
265. Chemonics International. Cairo Air Improvement Project, Draft Year IWork Plan; prepared for USAID/Egypt and Egyptian EnvironmentalAffairs Agency, 1997.
266. Abu-Allaban, M.; Gertler, A.W.; Lowenthal, D.H. A Preliminary Ap-portionment of the Sources of Ambient PMIo, PM 2.5 , and VOCs inCairo. Atmos. Environ. 2002, 36(35). 5549-5557.
267. Labib, M.W.; Khalik, M.H. Ambient PM and Lead Levels in the GreaterCairo Area forY 2000 and Y 2001. In Proceedings oftheAWMA Conferenceon Air Quality Measurement Methods, San Frandsco, CA, 2002.
268. Winsemius, P. Guest at Home, Reflections on Environmental Manage-ment; Samson, HD Tjeenk Willink Publishers, Alphen aan den Rijn,the Netherlands; 1986, pp. 1-227.
269. Watson, J.G.; Chow, J.C.; DuBois, D.W.; Green, M.C.; Frank, N.H.;Pitchford, M.L. Network Design Principles for Population-OrientedMonitoring of Suspended Particles; in Proceedings, Health Effects ofParticulate Matter in Ambient Air, Vostal, JJ., Ed.; Air and WasteManagement Association: Pittsburgh, PA, 1998; pp 461-472.
270. Chow, J.C. Critical Review: Measurement Methods to DetermineCompliance with Ambient Air Quality Standards for Suspended Par-ticles. /AWMA 1995, 45(5), 320-382.
271. Blanchard, C.L. Methods for Attributing Ambient Air Pollutants toEmission Sources. Annu. Rev. Energy Environ. 1999, 24, 329-365.
272. Watson, J.G.; Zhu, T.; Chow, J.C.; Engelbrecht, J.P.; Fujita, E.M.;Wilson, W.E. Receptor Modeling Application Framework for ParticleSource Apportionment. Chiemosphlere 2002, 49(9), 1093-1136.
273. Watson, J.G.; Chow, J.C.; Fujita, E.M. Review of Volatile OrganicCompound Source Apportionment by Chemical Mass Balance. At-mos. Environ. 2001, 35(9), 1567-1584. Available at: http://ftp.cgenv.com/pub/downloads/Watson.pdf.
274. IPURGAP. El-Workshop. In Integrated Program on Urban, Regional andGlobal Air Pollution Workshop on Mexico Emissions Inventory; Mexico,D.F., Mexico, 2003; Febniary 25-26, 2003. Available at: http://www.eaps.mit.edu/megacities/workshops/emissions/emission.html
275. NARSTO. Workshop on Innovative Methods for Emission-Inventory De-velopment and Evaluation, University of Texas, Austin, October 14-17,2003. Available at: http://www.cgen.com/Nartso/EmissionsWorkshop.html.
276. National Research Council. Modeling Mobile Source Emissions; Na-tional Academy Press: Washington, DC, 2000.
277. Schifter, l.; Diaz, L.; Duran,J.; Guzmnan, E.; Chavez, O.; Lopez-Salinas,E. Remote Sensing Study of Emissions from Motor Vehicles in theMetropolitan Area of Mexico City. Environ. Sci. Technol. 2003, 37(2),395-401.
278. Pokharel, S.S.; Bishop, G.A.; Stedman, D.H.; Slott, R.S. EmissionsReductions as a Result of Automobile Improvement. Environ. Sci.Technol. 2003, 37(22), 5097-5101.
279. Singer, B.C.; Harley, R.A. A Fuel-Based Inventory of Motor VehicleExhaust Emissions in the Los Angeles Area during Summer 1997.Atmos. Environ. 2000, 34(11), 1783-1795.
280. Slott, R.S. Finding High Emitters. In Proceedings of the 14th CRCOn-Road Workshop, Coordinating Researcht Council; Coordinating Re-search Council, Alpharetta, GA, 2004.
281. Moosmilller, H.; Mazzoleni, C.; Barber, P.W.; Kuhns, H.D.; Keislar,R.E.; Watson, J.G. On-Road Measurement of Automotive ParticleEmissions by Ultraviolet Lidar and Transmissometer: Instrument.Environ. Sd. Technol. 2003, 37(21), 4971-4978.
282. ARB. 2004. Available at: http://arb.ca.gov/msprog/obdprog/obdprog.htm.
283. NetworkCar. Press Release; 2003. Available at: http://www.networkcar.com/networkcar/pub/pressreleaseOl3.
284. U.S. Environmental Protection Agency. US EPA's Clean Air ExcellenceAward; 2003. Available at: http://www.epa.gov/air/caaac/2003awar.html.
285. Kristensson, A.; Johansson, C.; Westerholm, R.; Swietlicki, E.; Gidha-gen, L.; Wideqvist, U.; Vesely, V. Real-World Traffic Emission Factorsof Gases and Particles Measured in a Road Tunnel in Stockholm,Sweden. Atmos. Environ. 2004, 38(5), 657-673.
286. Pierson, W.R.; Gertler, A.W.; Bradow, R.L. Comparison of the SCAQSTunnel Study with Other On-Road Vehicle Emission Data. JAWMA1990, 40(11), 1495-1504.
287. Kirchstetter, T.W.; Singer, B.C.; Harley, R.A.; Kendall, G.R.; Traverse,M. Impact of California Reformulated Gasoline on Motor VehicleEmissions 1. Mass Emission Rates. Environ. Sci. Technol. 1999, 33(2),318-328.
288. Kittelson, D.B.; Watts, W.F.; Johnson, J.P. Nanoparticle Emissions onMinnesota Highways. Atbnos. Environ. 2004, 38(1), 9-19.
289. Vogt, R.; Scheer, V.; Casati, R.; Benter, T. On-Road Measurement ofParticle Emission in the Exhaust Plume of a Diesel Passenger Car.Environ. Sci. Teclnol. 2003, 37(18), 4070-4076.
289a.Jimenez, J.L., McManus, J.B., Shorter, J.H., Nelson, D.D., Zahniser,M.S., Koplow, M., McRae, Gj., Kolb, C.E. Cross Road and MobileTunable Infrared Laser Measurements of Nitrous Oxide Emissionsfrom Motor Vehicles, Chemosphere. Global Clhange Sd. 2000, 2,397-412.
290. Tiemey, G. EPA's Plans to Estimate the Criteria Air Pollutant Emissionsof Highway Vehicles and Off-Highway Equipment with MOVES. InNARSTO Workslhop on Innovative Methzods for Emission Inventory Develop-tnent and Evalulation; University of Texas, Austin, 2003; pp. 1-4.
291. European Commission. Automotive Industry; 2004. Available at:http://www.google.com/search?q=cache:lFVMSQNKh4gJ:europa.eu.int/comm/enterprise/automotive/mveg-meetings/meetings95/note_on_iuc.pdf+EPA±PEMS&hl=en&ie='UTF-8.
292. Eisinger, M.; Burrows, J.P. Tropospheric Sulfur Dioxide Observed bythe ERS-2 GOME Instrument. Geoplhys. Res. Lett. 1998, 25(22), 4177-4180.
293. Spichtinger, N.; Wenig, M.; James, P.; Wagner, T.; Platt, U.; Stohl, A.Satellite Detection of a Continental-Scale Plume of Nitrogen Oxidesfrom Boreal Forest Fires. Geophys. Res. Lett. 2001, 28(24), 4579-4582.
294. Beirle, S.; Platt, U.; Wenig, M.; Wagner, T. Weekly Cycle of NO2 byGOME Measurements: A Signature of Anthropogenic Sources. Atrno-splheic Clhemistry and Plhysics 2003, 3, 2225-2232.
295. Wenig, M.; Spichtinger, N.; Stohl, A.; Held, G.; Beirle, S.; Wagner, T.;Jahne, B.; Platt, U. International Transport of Nitrogen Oxide Pollu-tion Plumes. Atmos. Clhem. and Plhysics 2003, 3, 387-393.
296. Wagner, T.; Heland, J.; Zoger, M.; Platt, U. A Fast H2 0 Total ColumnDensity Product from GOME-Validation with In-Situ Aircraft Mea-surements. Atmos. Cliem. and Plhysics 2003, 3, 651-663.
297. Ladstatter-Weissenmayer, A.; Heland, J.; Kormann, R.; von Kuhl-mann, R.; Lawrence, M.G.; Meyer-Arnek, J.; Richter, A.; Wittrock, F.;Ziereis, H.; Burrows, J. P. Transport and Build-Up of TroposphericTrace Gases during the MINOS Campaign: Comparison ff GOME,In-Situ Aircraft Measurements and MATCH-MPIC-Data. Aftnos.Clhem. and Physics 2003, 3, 1887-1902.
298. Damoah, R.; Spichtinger, N.; Forster, C.; James, P.; Mattis, L; Wand-inger, U.; Beirle, S.; Wagner, T.; Stohl, A. Around the World in 17days-Hemispheric-Scale Transport of Forest Fire Smoke from Russiain May 2003. Atmos. Chlem. Phiysics Discussion 2004, 4, 1449-1471.
299. Eckhardt, S.; Stohl, A.; Beirle, S.; Spichtinger, N.; James, P.; Forster, C.;Junker, C.; Wagner, T.; Platt, U.; Jennings, S.G. The North AtlanticOscillation Controls Air Pollution Transport to the Arctic. Atmnos.Clhem. and Plysics 2003, 3, 1769-1778.
300. Stohl, A.; Huntrieser, H.; Richter, A.; Beirle, S.; Cooper, O.R.; Eck-hardt, S.; Forster, C.; James, P.; Spichtinger, N.: Wenig, M.; Wagner,T.; Burrows, J. P.; Platt, U. Rapid Intercontinental Air Pollution Trans-port Associated with a Meteorological Bomb. Atmos. Clhemn. and Plhys-ics 2003, 3, 969-985.
301. Borrell, P.; Burrows, J.P.; Richter, A.; Platt, U.; Wagner, T. New Direc-tions: New Developments in Satellite Capabilities for Probing theChemistry of the Troposphere. Atmos. Environ. 2003, 37, 2567-2570.
302. Vedal, S. Critical Review-Ambient Particles and Health: Lines thatDivide. JAWMA 1997, 47(5), 551-581.
303. Dye, T.S.; MacDonald, C.P.; Anderson, C.B. Air Quality Forecastingfor the SPARE the Air Program in Sacramento, California: Summaryof Four Years of Ozone Forecasting. In 11tht Joint Conference on tileApplications of Air Pollution Meteorology wit/l tie Air and Waste Man-agement Association; Long Beach, CA, 2000.
304. National Oceanic and Atmospheric Administration. Air Quality Fore-casting: A Review of Federal Programs and Research Needs; NOAA Aer-onomy Laboratory: Boulder, CO, 2001.
305. Stockwell, W.R.; Artz, R.S.; Meagher, J.F.; Petersen, R.A.; Schere, K.L.;Grell, G.A.; Peckham, S.E.; Stein, A.F.; Pierce, R.V.; O'Sullivan, J.M.;Whung, P.Y. The Scientific Basis of NOAA's Air Quality ForecastingProgram. EM 2002(Dec.), 20-27.
306. Zolghadri, A.; Monsion, M.; Henry, D.; Marchionini, C.; Petrique, 0.Development of an Operational Model-Based Warning System forTropospheric Ozone Concentrations in Bordeaux, France. Environ.Modelling & Soflvare 2004, 19, 369-382.
307. Russell, A.G.; Dennis, R. NARSTO Critical Review of PhotochemicalModels and Modeling. Atmos. Environl. 2000, 34(12-14), 2283-2324.
308. McRae, Gj.; Seinfeld, J.H. Development of a Second-GenerationMathematical Model for Urban Air Pollution II. Evaluation of ModelPerformance. Attnos. Environ. 1983, 17, 501-522.
309. West, Jj.; Zavala, M.A.; Molina, L.T.; Molina, MJ.; San Martini, F.;McRae, Gj.; Sosa-Iglesias, G.; Arriaga-Colina, J.L. Modeling OzonePhotochemistry and Evaluation of Hydrocarbon Emissions in theMexico City Metropolitan Area. I. Geoplhys. Res. 2004, submitted.
310. Carter, W.P.L. Documentation of tie SAPRC-99 Chemical Mechanism forVOC Reactivity Assessmnent; prepared for California Air ResourcesBoard by University of California, Riverside, 2000.
Journal of the Alr & Waste Management Association 679Volume, 54 June 2004
Molina and Mollna
311. Griffin, Rj.; Dabdub, D.; Seinfeld, J.H. Secondary Organic Aerosol 1.Atmospheric Chemical Mechanism for Production of MolecularConstituents. J. Geophys. Res. 2002, 107, 4332-4357.
312. Byun, D.W.; Ching, J.K.S. Science Algorthitns of the EPA MODELS-3Commrnunity Multiscale Air Quality (CMAQ) Modeling System; EPA/600/R-99/030; Office of Research and Development, U. S. EnvironmentalProtection Agency: Washington, DC, 1999.
313. Gery, M.W.; Whitten, G.Z.; Killus,J.P.; Dodge, M.C. A PhotochemicalKinetics Mechanism for Urban and Regional Scale Computer Mod-eling. 1. Geoplhys. Res. 1989, 94, 12925-12956.
314. Stockwell, W.R.; Middleton, P.; Chang, J.S.; Tang, X. The Second Gen-eration Regional Acid Deposition Model Chemical Mechanism for Re-gional Air Quality Modeling. J. Geophlys. Res. 1990, 95, 16343-16367.
315. ENVIRON International Corporation. User's Guide: Comprelhensive AirQuality Model witl Extenisiorns (CAMx) v4.00; 2003. Available at: http://www.camx.com.
316. Reynolds, S.D.; Roth, P.M.; Seinfeld, J.H. Mathematical Modeling ofPhotochemical Air Pollution: I-Formulation of the Model. Atmnos.Environ. 1973, 7,1033-1061.
317. Reynolds, S.D.; Liu, M.K.; Hecht, T.A.; Roth, P.M.; Seinfeld, J.H.Mathematical Modeling of Photochemical Air Pollution-III. Evalua-tion of the Model. Atmos. Environ. 1974, 8, 563-596.
318. Roth, P.M.; Roberts, P.W.; Liu, M.K.; Reynolds, S.D.; Seinfeld, J.H.Mathematical Modeling of Photochemical Air Pollution-II. A Modeland Inventory of Pollutant Emissions. Attnos. Environ. 1974, 8, 97-130
319. Grell, G.A.; Emeis, S.; Stockwell, W.R.; Schoenemeyer, T.; Forkel, R.;Michalakes, J.; Knoche, R.; Seidl, W. Application of a Multiscale,Coupled MMS/Chemistry Model to the Complex Terrain of theVOTALP Valley Campaign. Atnos. Environ. 2000, 34, 1435-1453.
320. Seaman, N.L.; Stauffer, D.R.; Lario-Gibbs, A.M. A Multiscale Four-Dimensional Data Assimilation System Applied in the San JoaquinValley during SARMAP. Part I: Modeling Design and Basic Perfor-mance Characteristics. Appl. Meteorol. 1995, 34(8), 1739-1761.
321. Nenes, A.; Pandis, S.N.; Pilinis, C. ISORROPIA: A New Thermody-namic Equilibrium Model for Multiphase Multicomponent InorganicAerosols. Aquatic Geochernistry 1998, 4, 123-152.
322. Kim, Y.P.; Seinfeld, J.H.; Saxena, P. Atmospheric Gas-Aerosol Equi-librium If. Analysis of Common Approximations and Activity Coef-ficient Calculation Methods. Aerosol Sci. TeclhnoL 1993, 19(2), 182-198.
323. Ackermann, Ij.; Hass, H.; Memmesheimer, M.; Ebel, A.; Binkowski,F.S.; Shankar, U. Modal Aerosol Dynamics Model for Europe: Develop-ment and First Applications. Atmos. Environ. 1998, 32(17), 2981-3000.
324. Koo, B.; Ansari, A.S.; Pandis, S.N. Integrated Approaches to Modelingthe Organic and Inorganic Atmospheric Aerosol Components. At-mos. Environ. 2003, 37(34), 4757-4768.
325. Schell, B.; Ackermann, Ij.; Hass, H.; Binkowski, F.S.; Ebel, A. Model-ing the Formation of Secondary Organic Aerosol within a Compre-hensive Air Quality Model System. J. Geophlys. Res. 2001, 106(D22),28275-28293.
326. Jenkin, M.E.; Saunders, S.M.; Wagner, V.; Pilling, Mj. Protocol forthe Development of the Master Chemical Mechanism, MCM v3 (PartB): Tropospheric Degradation of Aromatic Volatile Organic Com-pounds. Atmnos. Chlemn. and Physics 2003, 3, 181-193.
327. Saunders, S.M.;Jenkin, M.E.; Derwent, R.G.; Pilling, Mj. Protocol forthe Development of the Master Chemical Mechanism, MCM v3 (PartA): Tropospheric Degradation of Nonaromatic Volatile Organic Com-pounds. Atnos. Chern. and Physics 2003, 3, 161-180.
328. Volkamer, R.; Platt, U.; Wirtz, K. Primary and Secondary GlyoxalFormation from Aromatics: Experimental Evidence for the Bicycloal-kyl-Radical Pathway from Benzene, Toluene, and p-xylene. J. Phys.Chiem. 2001, 105, 7865-7874.
329. Volkamer, R.; Klotz, B.; Barnes, L.; Imamura, T.; Wirtz, K.; Washida,N.; Becker, K.H.; Platt, U. OH-Initiated Oxidation of Benzene I. Phe-nol Formation under Atmospheric Conditions. Phys. Chlem. ChzemicalPhiys. 2002, 4, 1598-1610.
330. Bethel, H.L.; Arey, J.; Atkinson, R. Products of the OH Radical-Initi-ated Reaction of 3-hexene-2,5-dione. Environ. Sci. Technol. 2001,35(22), 4477H4480.
331. Kiotz, B.; Volkamer, R.; Hurley, M.D.; Anderson, M.P.S.; Nielsen, Oj.;Barnes, L.; Imamura, T.; Wirtz, K.; Becker, K.H.; Platt, U.; Wallington,Tj.; Washida, N. OH-Initiated Oxidation of Benzene Part II.Influence of Elevated NOx Concentrations. Phiys. Chem. ChemicalPhiys. 2002, 4, 4399-4411.
332. Calvert, J.G.; Atkinson, R.; Becker, K.H.; Kamens, R.H.; Seinfeld, J.H.;Wallington, TJ.; Yarwood, G. The Mechianisms of Atmospheric Oxida-tion ofAromatic Hydrocarbons; Oxford University Press: Oxford, 2002.
333. Olariu, RI.; Klotz, B.; Barnes, I.; Becker, K.H.; Mocanu, R. FT-IR Study ofthe Ring-Retaining Products from the Reaction of OH Radicals withphenol, o-, m-, and p-cresol. Atmos. Environ. 2002, 36, 3685-3697.
334. Bloss, C.; Wagner, V.; Jenkin, M.E.; Volkamer, R.; Bloss, Wj.; Lee,J.D.; Heard, D.E.; Wirtz, K.; Martin-Reviejo, M.; Rea, G.; Wenger,J.C.;Pilling, Mj. Development of a Detailed Chemical Mechanism(Mcmv3.1) for the Atmospheric Oxidation of Aromatic Hydrocar-bons. Atmospleric Clhemistry and Plhysics Discussion 2004, submitted.
335. Bloss, C.; Wagner, V.; Bonzanini, A.; Jenkin, M.E.; Wirtz, K.; Martin-Reviejo, M.; Pilling, Mj. Evaluation of Detailed Aromatic Mecha-nisms (MCMv3 and MCMv3.1) Against Environmental ChamberData. Atnospheric Chemistby and Physics Discussion 2004, submitted.
336. Grell, G.A.; Dudhia, J.; Stauffer, D.R. A Description of the Fifth-Gener-ation Penzn StateINCAR Mesoscale Model (MM5); NCAR Tech. NoteNCAR/TN-398+STR; Natl. Cent. for Atmos. Res.: Boulder, CO, 1994.
337. Seaman, N.L. Meteorological Modeling for Air-Quality Assessments.Atbnos. Environ. 2000, 34(12-14), 2231-2259.
338. Scire, J.S.; Robe, F.R.; Fernau, M.E.; Yamartino, Rj. A User's Guide forthe CALMET Meteorological Model (Version 5); Earth Tech Inc.: Con-cord, MA, 2000. Available at: http://www.src.com.
339. Pielke, R.A.; Cotton, W.R.; Walko, R.L.; Tremback, CJ.; Lyons, W.A.;Grasso, L.D.; Nicholls, M.E.; Moran, M.D.; Wesley, D.A.; Lee, Tj.;Copeland, J.H. A Comprehensive Meteorological Modeling System-RAMS. Meteorol. Atbnos. P1zys. 1992, 49, 69-91.
340. Martilli, A.; Clappier, A.; Rotach, M.W. An Urban Surface ExchangeParameterisation for Mesoscale Models; bound lay met 2002, 104(2),261-304.
341. Michalakes,J.; Chen, S.; Dudhia, J.; Hart, L.; Klemp, J.; Middlecoff, J.;Skamarock, W. Development of a Next Generation Regional WeatherResearch and Forecast Model. In Developments in Teracotnputing: Pro-ceedings of t1ie Nintlh ECMWF Workshop on the Use of High PerformanceComputing iri Meteorology; 2001. Available at: http://ww.mmm.ucar.edu/mmS/mpp/ecmwfOl .htm.
342. Lloyd, A.C.; Cackette, T.A. 2001 Critical Review-Diesel Engines; En-vironmental Impact and Control. JAWMA 2001, 51(6), 809-847.
342a.National Research Council of the National Academies. Air QualityManagement in the United States, January 2004; The National Acad-emy Press: Washington, DC, 2004.
343. Fairley, P. Hybrids' Rising Sun: Gas-Electric Cars are Transformingthe Auto Industry. Toyota's Head Start has Detroit Scrambling toCatch Up. Technology Reviev 2004(April). Available at: http://www.technologyreview.com/articles/print_version/fairleyO4o4.asp.
344. Mostashari, A. Design of Robust Emission Reduction Strategies forRoad-Based Public Transportation in the Mexico City MetropolitanArea; Master Thesis MIT, 2003.
345. U.S. Department Of Energy. Hydrogen fuel; 2004. Available at: http://www.eere.energy.gov/hydrogenfuel/.
346. DeCicco, J.M. Fuel Cell Vehicles: Technology, Market, and Policy Issues;SAE Research Report RR-010; Society of Automotive Engineers, 2001.
347. Weiss, M.A.; Heywood, J.B.; Drake, E.M.; Schafer, A.; AuYeung, F.F.On the Road in 2020: A Life-Cycle Analysis of New Automnobile Tecdnol-ogies; MIT EL 00-003; Massachusetts Institute of Technology, EnergyLaboratory: Cambridge, MA, 2000. Available at: http://web.mit.edu/energylab/www/pubs/elOO-003.pdf.
348. South Coast Air Quality Management District. Annuial RECLAIM auditreport for the 2001 cornplianzce year; 2003. Available at: http://www.aqmd.gov/hb/030336a.html.
349. Chow, J.C. 2001 Critical Review Discussion-Diesel E-ngines: Environ-mental Impact and Control. JAWMA 2001, 51(9), 1258-1270.
350. International Council for Clean Transportation. Sulfmr Statement, June3, 2003; 2003. Available at: http://www.cleantransportcouncil.org/index.php.
351. United States Environmental Protection Agency. Deposition of AirPollutanzts to the Great Waters; EPA-453/R-00-005; Office of Air Qual-ity Planning and Standards: Research Triangle Park, NC, 2000.
352. Center for Science and Environment. Need for a Tech nological Leapfrogin Asia for Clean Air; 2004. Available at: http://www.cseindia.org/aboutus/press-releases/press-20040330.htm.
353. Nguyen, H.T.; Takenaka, N.; Bandow, H.; Maeda, Y.; de Oliva, S. T.;Botelho, M.M.F.; Tavares, T.M. Atmospheric Alcohols and AldehydesConcentrations Measured in Osaka, Japan and in Sao Paulo, Brazil.Atmnos. Environ. 2001, 35, 3075-3083.
354. Harrington, W.; Morgenstem, R.D. Economic Incentives Versus Com-mand and Control. What's the Best Approach for Solving Environmen-tal Problems? Resources 2004(Fall/Winter). Available at: http://www.rff.org/rff/Documents/RFFIResources 152 ecoincentives.pdf.
355. Ellerman, A.D.; Joskow, P.L.; Schmalensee, R.; Montero, J.P.; Bailey,E.M. Markets for Clean Air: Thze U. S. Acid Rain Program; CambridgeUniversity Press: Cambridge, UK, 2000.
356. Wiener, J. Global Trade in Greenhouse Gas Control: Market Meritsand Critics Concerns. Resources 1997(October). Available at: http://www.rff.org/rff/Documents/RFF-Resources-129-ghgtrade.pdt.
357. London Assembly Transport Committee. Congestion Charging: AFirst Review February 2004; Greater London Authority: London,2004. Available at: http://Ilondon.gov.uk/assembly/reports/trans-port/congestion-charging-febO4.pdf.
358. Texas Transportation Institute. Highway Congestion Worsens: Traf-fic Solutions and Impacts Examined. Texas Transportation Researcher2003, 39(4), 2-3.
359. Santos, G. Road Pricing on the Basis of Congestion Costs: ConsistentResults from Two Historic UK Towns; Transportation Research Board,2000. Available at: http://www.econ.cam.ac.uk/dae/people/santos/trb2000.pdf.
680 Journal of the Air & Waste Management Association Volume 54 June 2004
COPYRIGHT INFORMATION
TITLE: Megacities and Atmospheric PollutionSOURCE: J Air Waste Manage Assoc (1995) 54 no6 Je 2004
WN: 0415705991002
The magazine publisher is the copyright holder of this article and itis reproduced with permission. Further reproduction of this article inviolation of the copyright is prohibited. To contact the publisher:http://www.awma.org/
Copyright 1982-2004 The H.W. Wilson Company. All rights reserved.