
Meeting+india's+power+needs
34
Meeting India’s Future Power Needs Planning for Environmentally Sustainable Development Meeting India’s Future Power Needs Planning for Environmentally Sustainable Development The World Bank The World Bank
-
Upload
probodh-mallick -
Category
Economy & Finance
-
view
41 -
download
0
Transcript of Meeting+india's+power+needs

Meeting India’s FuturePower Needs
Planning for EnvironmentallySustainable Development
Meeting India’s FuturePower Needs
Planning for EnvironmentallySustainable Development
The World BankThe World Bank

MeetingIndia’s FuturePower Needs
Planning forEnvironmentallySustainableDevelopment
The World BankWashington, D.C.

Copyright © 1999The International Bank for Reconstructionand Development/THE WORLD BANK
1818 H Street, N.W.Washington, D.C. 20433 USA
All rights reservedManufactured in the United States of AmericaFirst Printing October 1999
This report has been prepared by the staff of the World Bank. The judgments expressed donot necessarily reflect the views of the Board of Executive Directors or of the governments theyrepresent.
The material in this publication is copyrighted. The World Bank encourages disseminationof its work and will normally give permission promptly.
Permission to photocopy items for internal or personaluse, for the internal or personal useof specific clients, or for educational classroom use, is granted by the World Bank, providedthat the appropriate fee is paid directly to Copyright Clearance Center, Inc., 222 RosewoodDrive, Danvers, MA 01923, U.S.A., telephone 978–750–8400, fax 978–75-–4470. Please contactthe Copyright Clearance Center before photocopying items.
For permission to reprint individual articles or chapters, please fax your request withcomplete information to the Republication Department, Copyright Clearance Center, fax 978–750–4470.
All other queries on rights and licenses should be addressed to the World Bank at theaddress above or faxed to 202–522–2422.
Cover photograph: NTCP power station at Ramagundam, courtesy of National ThermalPower Corporation, Ltd.
ISBN 0-8213-4309-21. World Bank. 2. Rural development—Finance. 3. Rural development projects—Finance. 4.Infrastructure (Economics)—Finance.I. Title. II. Series: Environmentally and socially sustainable development series. Rural develop-ment.HG3881.5.W57P68 1998362.1’532—dc21 96–32776
CIP

iii
Contents
1. A Time for Decisions ..............................................................................................1
2. Options for Reducing Environmental Impacts ....................................................... 5Reforming and Restructuring the Power Sector .................................................................. 5Rehabilitating Generating Plants and Transmission and Distribution Networks .................. 7Managing Demand .............................................................................................................. 8Using Renewable Energy Supplies ..................................................................................... 9Internalizing the Costs of Pollution ................................................................................... 13Reducing and Recycling Combustion By-Products .......................................................... 15Siting Plants to Reduce Environmental Damage ............................................................... 19Using Options in Combination ......................................................................................... 20
3. From Knowledge to Action ..................................................................................23Applying the Decisionmaking Process and “Toolkit” ........................................................ 23
References ................................................................................................................... 27
Boxes
1. The Year 2015—The “Business as Usual” Scenario .................................................22. Incentives and Subsidies .....................................................................................103. Constraints ............................................................................................................114. Applications for Coal Ash ....................................................................................175. Elements of the Participatory Planning Process .................................................... 256. A “Toolkit” for State-Level Energy Planning ...........................................................25
Figures
1. “All India” Emissions by Region in 2015 ................................................................. 3
Tables
1. Summary of Emissions under the Reform Scenario in Bihar, 2014/2015 ................ 72. Estimated Tenth-Year Savings from Technologies in Andhra Pradesh.................... 93. Estimated Electricity Saved through Demand-Side Management .........................94. Potential Contribution of Renewable Energy Technologies .................................105. Existing Air Quality Standards for the Ministry of Environment and Forestry ....... 146. Andhra Pradesh—Cumulative Pattern of Generation Mix ....................................217. Andhra Pradesh—Impact on Cost and the Environment .....................................21


1A Time for Decisions
Unquestionably, power plays a funda-mental role in the economic developmentprocess. All countries seek to ensure a sup-ply of electricity that is affordable, reliable,and secure in order to sustain modern waysof living. Producing electricity to meetmodern needs affects the environment ona local, regional, and global basis. As de-veloping countries, including India, de-mand increasing amounts of electricity tosustain their economies, long-term plan-ning is needed to balance this growingneed for power and environmental con-cerns. Practical strategies are needed tominimize the impact of growth on the en-vironment and, through the environment,on human health and well-being.
India’s large reserves of coal are amajor asset to the country, accounting for70 percent of India’s current productionof electricity. However, excessive use ofthis form of energy production—espe-cially without the use of strategies to miti-gate its effects—will cause the quality ofthe country’s air, land, and water re-sources to deteriorate. Specifically,
• Small particles from combustion even-tually reach the ground, threateninghuman health and property.
• Disposing of the ash that is producedas a byproduct of combustion requireslarge amounts of land; leaching ashcan contaminate ground water.
• Carbon dioxide released from fuel bycombustion contributes to globalwarming and climate change.
• Power stations may require large, andfrequently environmentally valuable,land areas.
• Large hydro and coal projects requireresettlement and rehabilitation, andaffect people.
• Acid gases that are produced whenfossil fuels are burned are eventuallyprecipitated as acid rain.
Avoiding environmental damagefrom the development of energy resourcesis among the key priorities of the SouthAsia environmental strategy for the en-ergy sector. Other priorities include thefollowing:
• Dealing with indoor air pollution fromthe use of traditional fuels, especiallyin rural households
• Protection from urban air pollution• Developing better environmental gov-
ernance• Mitigating the potential impacts of
global climate change• Making the Bank more responsive to
energy-environment impacts.
Studies to date have clearly demon-strated that continuation of current poli-cies and practices in the power sector isnot sustainable in financial terms. Pricestoday for electricity and fuels in India aredistorted; electricity is often sold to agri-cultural consumers at prices that are wellbelow the costs of production. This prac-tice leads to waste of electricity and also

2 A Time for Decisions
Box 1. The Year 2015—The “Business as Usual” Scenario
Without significant changes in power sector policy, by the year 2015
• India will be producing SO2, NOx, particulate emissions, and ash at three times thecurrent levels
• Ash disposal facilities around power plants will require 1 square meter of land perperson
• CO2 emissions will be 775 million metric tons per year, as compared with 1,000 mil-lion metric tons per year now produced by power generation in the entire EuropeanUnion.
impairs the finances of state electricityboards. The poor financial condition of theboards may make it difficult to invest innew plants and maintain existing plantsproperly, especially environmental controlequipment not essential to plant operation.
Case studies for Andhra Pradesh andBihar, states facing different energy chal-lenges with varying resources, show thatthe financial performance of the powersectors in both states will impose an in-supportable financial burden on their re-spective state governments. The rate ofreturn on capital in Andhra Pradesh willbecome increasingly negative, reaching –18 percent by 2015; in Bihar it will aver-age –14 percent from 1996 through 2015.The financial resources needed to main-tain and operate the power plants at thelevel needed to meet the projected de-mand are unlikely to be forthcoming.
Under current policies, emissions ofenvironmentally damaging combustionproducts may be expected to increaserapidly, doubling in Bihar and quadru-pling in Andhra Pradesh by the year 2015.Extrapolating the results to India as awhole reveals serious conditions (box 1and figure 1).
Emissions on the scale describedabove are bound to affect air quality andhave major human health impacts. Thedamages caused by particulate matter tothe respiratory system are a particularcause for concern. Consequences includesignificant increases in mortality, hospitaladmissions for respiratory infections, emer-gency room visits for bronchitis and otherchronic pulmonary diseases, the numberof days asthmatics experience shortness ofbreath, and the number of days residentsexperience restricted activity.
Although the power sector contributesto the problem, most of the pollution, es-pecially in the urban areas, stems fromother sources, notably residential andcommercial stoves, industrial boilers, in-efficiencies in the transport sector and theliquid fuel chain, the extensive use of tra-ditional fuels in city slums, and emissionsfrom nonenergy sources. Urban air pol-lution is, therefore, a cross-sectoral issuethat requires a citywide approach toachieve comprehensive air quality man-agement. Thus, a strategy to address ur-ban air pollution must integrate a rangeof activities at the municipal level, espe-cially at small sources of energy and

A Time for Decisions 3
Source: ESMAP (Joint UNDP/World Bank Energy Sector Management Assistance Programme), India:Enviromental Issues in the Power Sector, Report no. 205/98 (Washington, D.C.: Energy, Mining and Telecommu-nications Department, the World Bank, 1998).
2,000
1,800
1,600
1,400
0
200
400
600
800
1,000
1,200
CO2(milliontonnes)
SO2(k tonnes)
NOX
(k tonnes)Particulates(k tonnes)
Ash(milliontonnes)
Northern region
Southern region
Western region
East and northeast regions
Figure 1. “All India” Emissions by Region in 2015
power stations located in densely popu-lated areas and in the transport sector. Thisstrategy should also include a major fo-cus on the petroleum subsector.
Currently the power sector in Indiais on the verge of fundamental and sig-nificant reforms that have profoundimplications for environmental manage-ment. India is moving from a publiclyowned, vertically integrated, monopolis-tic power system with highly distortedprices for fuels and electricity to a moreliberal system with market prices, com-petition, a greater role for the private sec-tor, and commercial incentives. Thesechanges will affect every aspect of the en-ergy production system: the demand for
electricity, the financial viability for all theentities involved, the choice of fuel andtechnologies, pricing decisions, and therespective roles and relationships amongthe state, the power sector, regulators, andfuel suppliers. During this time of transi-tion, it is critical to determine how best totake advantage of the opportunities it pre-sents to protect the environment and avertthreats to public health.
To find a more appropriate balancebetween the need to support economicdevelopment and environmental con-cerns, stakeholders must begin immedi-ately to take environmental impacts intoaccount as long-term plans for power gen-eration are developed.

4 A Time for Decisions
Depending on the unique needs andsituation of the geographic area, differ-ent strategies for reducing negative en-vironmental consequences from powergeneration may be more or less effective.Decisionmakers can choose from a rangeof measures, using modeling tools to de-termine which combination of optionswill have the greatest positive impact.For example, the environmental impactsof power development may be reducedby using less electricity, preventing wasteproducts from reaching the environment,adopting cleaner technologies for coalproduction, or using alternative forms ofenergy production that cause less environ-mental damage. Sound pricing strategiesfor electricity and fuel, changes in thestructure of the power sector, and waysof looking at the cost of energy produc-tion that take environmental impacts intoaccount would also help preserve envi-ronmental quality.
While power system expansion plan-ning has previously been conducted at thenational level using state-provided dataon regional needs, the decisionmakingprocess in India is being decentralized.Some state electricity boards are being un-bundled into separate generation, transmis-sion, and distribution entities.Corporatization and, to an increasing de-gree, privatization are an integral part ofthis process. The unbundled institutionswill assume the responsibility for the criti-cal functions of planning anddecisionmaking. To meet the need for toolsand data to support state-leveldecisionmaking during this important tran-sition, the government of India, the WorldBank, and the U.K. Department for Inter-national Development have collaborated to
develop a decisionmaking framework.They tested a participatory planning pro-cess and analytical tools that can helpdecisionmakers in India both to improvethe planning and management of theirpower systems, taking into account themajor environmental impacts, and to assessthe economic and environmental tradeoffsassociated with different options for powergeneration. This report summarizes whathas been learned through this process intwo very different states, Andhra Pradeshand Bihar, and assesses the broader impli-cations of these findings for energy plan-ning in other states in India.
The case studies were supported by aset of special studies dealing with interfuelsubstitution; the welfare effects of increasesin electricity tariffs; the technical and eco-nomic potential for renewable energy tech-nologies; demand-side management; thepossibilities of adopting market-based in-struments in India; the options availableto mitigate the environmental impacts ofcoal-fired power stations and coal mining;and the management, disposal, and utili-zation of ash from thermal power plants.The special studies provided basic genericdata to supplement the detailed state-spe-cific information collected under the casestudies.

5
2Options for Reducing Environmental Impacts
This section is based on a review of avail-able data, including special studies andlessons learned from other countries. Aparticularly important source of data isprovided by case study material relatingto two contrasting Indian states, AndhraPradesh and Bihar. While no two statescan adequately represent the richnessand complexity of the Indian subconti-nent, these two states and their distinc-tive situations offered researchers anopportunity to explore a range of issuesand options. Bihar is relatively poor, andits state electricity board is in a precari-ous situation, financially and technically.Heavy industry accounts for about 40percent of the demand for power in Bihar,while agriculture accounts for a similarpercentage of the requirements ofAndhra Pradesh. Although both areashave depended primarily on coal as apower source, Andhra Pradesh has moreready access to other supply options thanBihar. The contrasts between them, ex-plored through different scenarios usingcomputer models, have yielded insightsand examples that will be cited through-out this section.
Options available to India as it seeksto reduce the environmental impacts ofpower generation include the followingstrategies:
• Reforming and restructuring thepower sector
• Rehabilitating generating plants andtransmission and distribution net-works
• Managing demand• Using renewable energy supplies• Internalizing the costs of pollution• Reducing and recycling combustion
by-products• Siting plants to reduce environmental
damage.
The following section explores therelative merits of these strategies and theobstacles to their use.
Reforming and Restructuringthe Power Sector
Though it is moving toward reform,India’s current government policiescontinue to maintain some fuel pricesat artificial levels, with inevitable andharmful consequences to the environ-ment. While most coal prices have beenderegulated, power station grades of do-mestic coal are still priced below the costof production. The true value of the bet-ter grades is underestimated. Cleaner im-ported fuels are priced too high bycomparison with domestic coal. Pricesfor the transport of goods by rail, includ-ing coal, are generally subsidized, furtherencouraging the use of the domesticproduct and its high ash content. As aresult,

6 Options for Reducing Environmental Impacts
• Indian coal is preferred as a fuel forpower generation over other fuelswith lower ash content.
• The relative prices of different gradesof coal give no incentive to the coalproducer to increase output of the bet-ter-quality coals.
• Distorted prices for transport affect thechoice between pit-head and load-cen-ter plants, shifting the location of en-vironmental impacts.
• Demand is maintained at artificiallyhigh levels.
As government reform progresses andprices for fuel rise to a level that reflectstheir true “economic” cost, stakeholdersin the energy system will have reason tomake different choices:
• When the tariff structure is changedto reflect the economic costs of produc-tion, higher prices for electricity in theresidential and agricultural sectorswill dampen demand.
• As electricity producers are motivatedby commercial incentives rather thandependence on government subsidies,they will have adequate cash flow torehabilitate transmission and distribu-tion systems and to modernize gener-ating plants, reducing electricity lossthrough inefficiency.
• Commercial incentives will encouragepower utilities to offer higher pricesfor better coal and spur coal suppliersto invest in coal beneficiation plants.
• Commercially motivated producerswill search for cost-effective ways toencourage ash utilization and dis-posal. They will improve metering,monitoring, billing, and collection
procedures, which will increase theamount of available cash.
• Power system reliability will increase;consequently, many consumers whonow install their own power sourceswill be able to rely on the grid system.
The fact that electricity once lost orsold to agriculture at a subsidized pricecan instead be sold to agriculture at higherprices or to industry at a profit will con-tribute strongly to improved financial per-formance for energy providers. Clearlythe change in tariff policy makes the dif-ference between a system doomed to fail-ure and one that has the capacity to meetfuture demand efficiently.
Improving the cash flow of utilitieshas significant environmental impacts.One major impact will be that providerscan build new plants, which will obvi-ously increase the volume of environmen-tal impacts. However, these plants will beintrinsically cleaner and more efficient,displacing old plants; available cash willalso enable producers to bring the plantsin line with standards. The latter effectswill tend to bring down specific emissionsof pollutants. The Bihar case study dem-onstrates that reform would have an over-all beneficial effect on pollution levels andat the same time produce more electricity(table 1). Results for the Andhra PradeshCase Study were comparable (ASCIConsultancy 1998).
While reforms will have a beneficialeffect on the environment, what othermajor effects could they have on publicwelfare? Data are limited, but there couldbe significant impacts on residential con-sumers and on agriculture. First, costsmay go up for households with access to

Options for Reducing Environmental Impacts 7
electricity, but the quality of their supplywill improve. Also, with proper metering,demand will adjust to efficient levels. Asreforms improve the cash flow of electric-ity companies, they should be able to of-fer power to new consumers.
Second, increased electricity prices toagricultural customers could result in amore efficient use of water. This, in turn,could lead to improved yields, sinceoverwatering dilutes the effectiveness offertilizers. Metering could also have anequalizing effect on access to energy. Cur-rently, small farmers often experience longwaits for pump connections, while morewealthy farmers are able to use diesel tomeet their energy needs. Recent studiessuggest that farmers are willing to paymore for reliable access to energy (basedon unpublished findings from ongoingstudies of power supply to agriculture forthe World Bank).
Rehabilitating GeneratingPlants and Transmission andDistribution Networks
Losses of energy as a result of weak-nesses in India’s transmission and dis-tribution system were reported by publicsector utilities to be as high as 21 per-
cent. This figure is generally recognizedby experts familiar with the power sectorin India as a serious underestimate. Moststate-level studies cite a much higher per-centage—perhaps even double the pub-lic utility figure. The losses in India aremuch greater than in East Asian countries.The best performers were Singapore (9.1percent) and the Republic of Korea (10.2percent).
Factors that contribute to the high rateof loss in India include the following:
• Lack of investment in rehabilitationof the transmission and distributionsystem
• Weak transmission and distributionlines
• Long transmission and distributionlines
• Low power factor operation• Too many transformation stages• Pilferage and theft.
Modeling suggests that the percent-age of power lost through transmissionand distribution could be reduced inmost states to as low as 10 percent by2010. If energy providers are motivatedto make improvements through price re-form, changes in maintenance, metering,
Table 1. Summary of Emissions under the Reform Scenario in Bihar, 2014/2015
Cumulative Total AshCO
2NO
xSO
xSPM (million
Scenario (million t) (kt, PV) (kt, PV) (kt, PV) t)
“Business as Usual” 142 804 929 62 36Reform 127 685 828 54 34
Note: CO2 = carbon dioxide, kt = metric kilotons, PV = present value, SOx = sulfur oxide, and t = metric tons.Source: SCADA 1998.

8 Options for Reducing Environmental Impacts
monitoring, and billing and collectionwould make more money available to re-habilitate the system—clearly a win-winprospect. System rehabilitation not onlywould result in across-the-board reduc-tions in environmentally damaging emis-sions, but would yield high rates ofreturn both in financial terms and in eco-nomic benefits to society.
Case studies found system improve-ments to be cost-effective both in AndhraPradesh and in Bihar, which has a smallersystem that is in worse condition. Both arecurrently experiencing energy losses of 30percent or more. By rehabilitating the ex-isting transmission and distribution sys-tem, both could significantly reduceoperating costs and achieve measurableenvironmental benefits for area residents.
In Andhra Pradesh, measured envi-ronmental impacts—”attributes”—wouldbe reduced by 3 percent and operatingcosts by 4 percent. In Bihar, attributeswould be reduced by 5 to 6 percent. Ex-penditures on operations would fall bymore than 6 percent.
Managing Demand
Energy use is currently less efficient andless cost-effective than the best avail-able technology would allow. Conse-quently, a more negative environmentalimpact is occurring than is actually nec-essary to meet load requirements. De-mand-side management refers to the useof policies to reduce energy consump-tion, with a resulting decrease in energyproduction and new plants. Modelingstudies show that demand-side manage-ment programs could reduce total sys-tem costs (in present value terms) andpower consumption by approximately 6
percent by 2015, resulting in anIndiawide reduction of measurable en-vironmental impacts (or attributes) ofabout 10 percent. Specifically, sulfur di-oxide (SO
2) and nitrogen oxide (NO
x)
would be reduced by 9 percent, total sus-pended particulate matter (SPM) and car-bon dioxide (CO
2) by 10 percent, and ash
by 11 percent.Many diverse technologies are avail-
able to reduce energy consumption. Thosethat are most likely to significantly reducedemand will vary by region, dependingon the residential and commercial mix ofenergy consumers and other factors. Table2 contains some examples of energy sav-ings that the Andhra Pradesh case studyshows would be achieved in the tenth yearof a demand-side management programin that state (ASCI Consultancy 1998).
Other governments have tried differ-ent policy strategies to encourage de-mand-side management. Examples thatmay also work well in India, althoughthey are not among the conclusions of thiswork, include the following:
• Promoting energy service companiesto fund and manage investments inenergy efficiency and to share savingswith users
• Placing levies on utilities to fund en-ergy conservation programs
• Requiring utilities to engage in de-mand reduction activities as a condi-tion of construction permits or tariffincreases.
Demand-side management programscan be implemented or funded by utilities,the state, the private sector, or other insti-tutions. Once price reforms are in place,however, utilities lose their financial

Options for Reducing Environmental Impacts 9
interest to reduce demand. Consequently,the role of the private sector in promotingchanges in consumer behavior may in-crease. For example, an independent en-ergy service company could promote suchprograms on a commercial basis, a strat-egy that has been used in the United Statesand in Western Europe (table 3).
Using Renewable EnergySupplies
Over the next fifteen years renewableenergy supplies could increase by morethan seven times, and their share in thecountry’s total power generation capac-ity could nearly triple. At roughly 1,378
megawatts, renewable energy technolo-gies currently account for about 1.5 per-cent of total power generation capacity(Ministry of Non-Conventional EnergySources 1999), of which wind power ac-counts for about 72 percent (992 mega-watts) and small hydro roughly 13percent. Biomass and solar energysources account for the rest. The Minis-try of Non-Conventional Energy Sourceshas estimated that 126 gigawatts ofpower generation capacity is availablefrom renewable energy sources in thelong term. Although the technical poten-tial for the use of renewable energysources in India is vast, the prospects forexpansion may be limited in the short
Table 2. Estimated Tenth-Year Savings from Technologies in Andhra Pradesh
Savings in Year 10 PercentageTechnology (gigawatt-hours) in total savings
High-efficiency pumps 3,453 10.01Fluorescent lamp standards 1,007 0.00Industrial cogeneration 806 1.34Metering pump sets 597 1.75Commercial fluorescent lighting 493 1.32More efficient rural lighting 475 1.53More efficient urban lighting 206 0.14High-efficiency refrigerators 167 0.29Others 911 2.45 Total 8,115 16.38
Source: ASCI Consultancy 1998.
Table 3. Estimated Electricity Saved through Demand-Side Management(percent)
Study 2001/2002 2006/2007 2011/2012 2014/2015
Andhra Pradesh 4.5 11.3 8.3 5.6Bihar 2.1 7.0 8.1 9.8CERI 7.4 7.7 8.2
CERI = Canadian Energy Research Institute and Tata Energy Research Institute.Source: Canadian Energy Research Institute and Tata Energy Research Institute 1995.

10 Options for Reducing Environmental Impacts
and medium terms because of a numberof constraints (see box 3). A special studyof renewable energy technologies (Envi-ronmental Resources Management 1997)has found that continuation of govern-ment policy can give a boost to the pen-etration of renewable energytechnologies to 11,440 megawatts,roughly 4 percent of total generation ca-pacity in 2011–12 (see table 4). Sensitiv-ity analysis on capital costs show thatcapacity addition of 8,560 megawatts(nearly 3 percent to the country’s total
generation capacity) is feasible throughrenewable energy technologies in 2011–12 even in the absence of any incentiveand subsidy scheme (see box 2). The spe-cial study, therefore, concludes that gov-ernment incentives will need to continuein the short and medium term to enablerenewable energy technologies to pro-vide an increasing share of the nation’spower supply. These incentives are out-lined in box 2. The renewable energytechnologies could become more attrac-tive economically if energy sector reform
Box 2. Incentives and Subsidies
A number of incentives are offered for renewable energy technology projects, which in-clude soft loans, reduced customs duties on imported material and equipment, 100 per-cent depreciation allowance, exemptions from excise and sales tax, remunerative pricewith escalation clause for power fed into the grid, facilities for wheeling and bankingpower, and large capital subsidies. For example, in Maharashtra, up to 30 percent capitalsubsidy is being offered to private developers of wind power projects. For biomass, acapital subsidy of up to 50 percent of the cost of projects (subject to a maximum of Rs. 2.5crores per megawatt) is being offered. In the northeastern region, the recently announceda government incentive package for the promotion of small hydro projects includes acapital subsidy of up to Rs. 3 crores per megawatt or 50 percent of the project cost. Re-garding SPV, the Ministry of Non-Conventional Energy Sources provides two thirds ofthe project cost (subject to a maximum of Rs. 2 crores per 100 kW) for the procurement ofSPV modules, structures, cables, power conditioning units and grid interfacing equip-ment, while the balance is required to be met by implementing agencies. The solar ther-mal power plant in Rajasthan would be supported by grants from the central governmentof up to Rs. 50 crores and from the Global Environment Facility of $49 million, includinga technical assistance component of $4 million.
Table 4. Potential Contribution of Renewable Energy Technologies(gigawatts)
Installed capacity in gigawatts (electrical) 2001/2002 2006/2007 2011/2012
With government financial incentives 4.5 (3.4%) 7.1 (3.5%) 11.0 (3.8%)Without government financial incentives 3.1 (2.3%) 4.9 (2.4%) 6.7 (2.3%)
Note: Percentages of the totals for India are in parentheses.Source: Environmental Resources Management 1997.

Options for Reducing Environmental Impacts 11
Box 3. Constraints
Although the cost of generation of small hydro at about Rs. 1.43 per kilowatt-hour is highlycompetitive with conventional technologies, some renewable energy technologies, such assolar photo voltaic (SPV) and solar thermal, are far less economically attractive than conven-tional technologies. For example, despite the rapid declines in SPV costs, the current esti-mated cost of SPV modules are around $4 to $5 Wp (peak watt). Even if the cost declines by 50percent to approximately $2.5 per Wp, the technology would remain uncompetitive com-pared with $1.05 to $1.35 Wp (Rs. 3.5–4.5 crores per megawatt) for other renewables and con-ventional technologies, notwithstanding the low variable costs associated with SPV technology.
Several other factors constrain the use of renewable energy technologies. They are classi-fied as technological, institutional, financial and economic, and infrastructural, as follows:
Technological
• Most renewable energy technologies have not achieved maturity within the country,and a large portion are imported.
• Renewable energy sources are site-specific, and the supply may not be continuous.• Technical information is not easily available either for the entrepreneur or the consumer.
Institutional
• A top-down centralized government approach is generally adopted for this poten-tially highly decentralized option.
• Little encouragement has been received from the state electricity boards.• There is a lack of awareness about the potential environmental benefits.• There is a lack of serious education and training for operation and upkeep.• Incentives are misused; they are related to investment rather than to performance of plants.
Financial and economic
• Diesel and electricity are subsidized for use by agriculture and residential consumers.• Funds allocated to renewable energy sector are minimal when compared with fossil
fuel and nuclear energy options.• In some cases, large initial investments are required.
Infrastructural
• The land requirement for renewable energies could be very high.• Poor grid availability proves to be a major deterrent.• There is a lack of proper maintenance and servicing facilities at the local level.
A number of options to address the constraints exist, some of which are already atvarious stages of implementation: the collection of information; dissemination and train-ing campaigns; the reorienting of the investment portfolios of power utilities to developdecentralized power options and encouragement for the utilities to ensure grid connec-tion to private developers; formulation of a policy for power purchase; promotion of thefinancing of economically viable renewable energy technologies by developing and intro-ducing innovative financing schemes, such as lines of credit, revolving funds, and hire-purchase plans, to the conventional loan schemes; and formulation of government policyand legal and regulatory frameworks that encourage private sector participation.
12 Options for Reducing Environmental Impacts
becomes more widespread and the sub-sidies associated with conventional en-ergy are reduced. Agriculture andresidential consumers of power areheavily subsidized by the state govern-ments. Net subsidies to power consum-ers—revenue requirements less thecontributions state electricity boards re-quire from state governments—amounted to roughly $3.7 billion in1995–96, about 1.4 percent of gross do-mestic product.
Water, wind, and biomass are the mosteconomically feasible renewable sourcesof energy for the near term in India. Solarenergy, however, has enormous potentialif it can be made more economically vi-able. Even in the near term, it may be aneconomically competitive option formany remote areas where the cost of gridconnection is very high.
• The high rate of photosynthesis fromavailable biomass in India, such ascrop residues, makes this a prospec-tive resource. Bagasse-based cogen-eration uses a combination of directcombustion and gasification of biom-ass to generate energy. At the time ofthis report, eighteen biomass projectshave been installed and another sev-enteen are under construction. Thereare technical challenges, however, inusing this resource effectively, as wellas logistical ones in ensuring an ad-equate and timely supply of fuel on ayear-round basis. The estimated po-tential for bagasse conversion in Indiais approximately 3,500 megawatts.
• The first wind farms in India were in-stalled in the coastal areas of TamilNadu, Gujarat, Maharashtra, andOrissa. The main potential is for use in
these and other states within South In-dia. Ninety-eight sites have been iden-tified with annual mean wind speedsof more than 18 kilometers per hour.Together they would provide 5,000megawatts of energy. Constraints in-clude operational problems in match-ing supply and demand, since windpower often varies seasonally.
• The potential for small hydro powerin India is also strong, with an esti-mated potential to contribute 10,000megawatts. The Ministry of Non-Con-ventional Energy Resources, whichhas examined 2,679 sites that havepotential capacities of up to 3 mega-watts each, estimates that small hydropower could represent 1 percent of thelikely installed Indiawide capacity forpower generation by the year 2015.
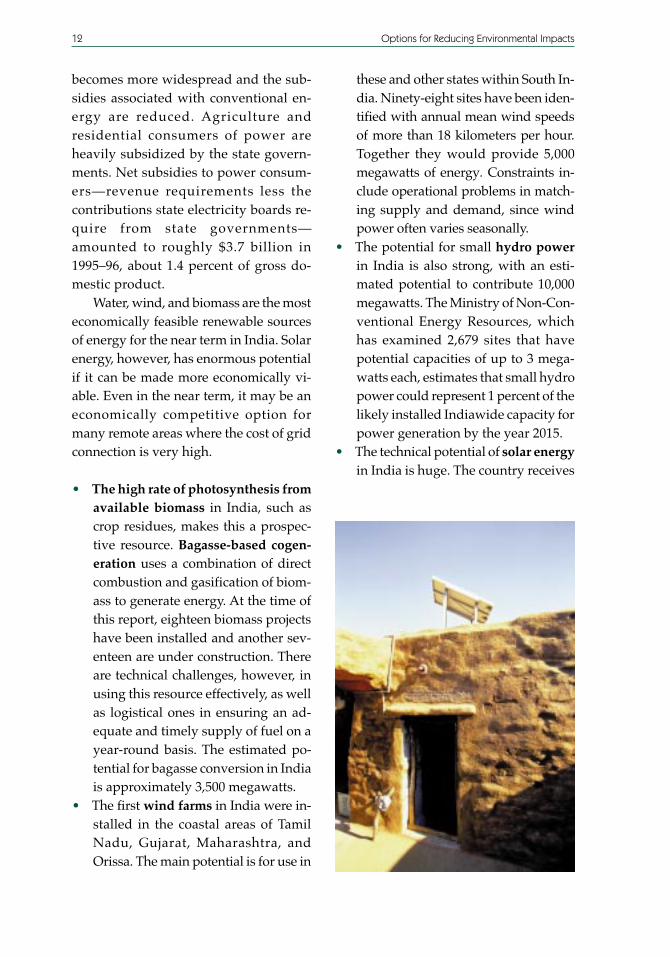
• The technical potential of solar energyin India is huge. The country receives

Options for Reducing Environmental Impacts 13
enough solar energy to generate morethan 500,000 terawatt-hours of elec-tricity, assuming 10 percent conver-sion efficiency. This is three orders ofmagnitude greater than the likely demandfor electricity in all of India by 2015.However, even though the cost ofphoto voltaic cells is falling and unitcosts of production are expected todecline, the cost of solar energy is stillhigher than that of other renewableenergies. As further technical progressis made, it will probably become a sig-nificant long-term energy source.Even in the near term, it may be aneconomically competitive option formany remote rural areas.
Internalizing the Costs ofPollution
The government is responsible for settingthe rules for how the costs of environmen-tal pollution are apportioned between so-ciety and the polluting agency. Theprinciple of “the polluter pays,” which hasgenerally been adopted in environmentalregulation, obliges the polluting agencyto bear the cost of reducing or maintain-ing its environmental waste at an ac-ceptable level. This is called“internalizing” the costs. If the rules ofenvironmental management set by thegovernment were both adequate and en-forced, all costs would be internalizedwithin the agency. The agency would bemotivated, by whatever means chosen bythe policymakers, to fully bear these costs,and would therefore make the changesneeded to reduce its emissions. This canbe accomplished by using technical stan-dards that require the polluter to reduce
its emissions to target levels or face sig-nificant consequences (the “commandand control” strategy), and market-basedinstruments that seek to change the na-ture of the incentives and disincentivesfaced by polluters to perform acts thatbenefit society.
Guidelines and standards are in-tended to be a means of forcing a busi-ness to change its operations in order toreach prescribed levels, increasing thecost to the business. In principle, the ad-verse environmental impacts of decisionsin the power sector could be reduced byimplementing more stringent standardsthan those currently applied in India. Forthis reason, the study attempted to esti-mate the incremental costs of implement-ing the World Bank’s new standards forair quality and emissions, which are morestringent for SO
2 and SPM than current
Indian standards. Analysts concluded thatthe incremental costs associated withmeeting World Bank standards need notbe substantial if plants are properly sited.
More significant benefits, however,will result from improved implementa-tion of existing standards than fromadoption of new and stricter standards(table 5). Participants in the NationalDecisionmakers Workshop held as partof this study stressed that better imple-mentation of monitoring and enforce-ment procedures will be of moreimmediate benefit to India.
Market-based instruments attemptto meet environmental objectives byworking through market mechanisms.The common element of all market-basedinstruments is that they work throughthe market, attempting to alter the behav-ior of economic decisionmakers, such asfirms and households, by changing the

14 Options for Reducing Environmental Impacts
incentives and disincentives they face.For example, if ash disposal permits wereallocated equally to all new power plants,regardless of their circumstances, somepermits might be sold by those that findit easiest to meet the targets, whichwould reduce the total cost of compliancefor all power plants. Other examples ofmarket-based instruments include pollu-tion or input taxes, product charges, anddifferential tax rates. Market-based in-struments are most easily applied in situ-ations where there are few “actors” andwhere impacts can be measured easily.They also work best when polluters mustface hard budget constraints.
A number of studies have demon-strated the cost-effectiveness of market-based instruments over traditional“command and control” regulatory strat-egies that require all polluters to meet thesame discharge standards. Market-basedinstruments acknowledge and use the keyfact that the costs of reducing pollutionare not the same across all firms. Simula-tions done in the United States show thatthese instruments can be between 1.5 and4 times as cheap as a “command and con-trol” regime across a range of pollutantsand locations. Realizing these potentialsavings, however, will require careful de-sign and implementation.
Several significant barriers exist tosuccessful use of market-based instru-ments in India:
• Misconceptions among stakeholdersabout market-based instruments
• A vested interest in the status quo onthe part of both regulatory agenciesand firms
• A lack of good governance, includingan ineffective institutional framework,a lack of local-level capability, and in-sufficient technical understanding ofissues at the state board level
• The challenge of changing the currentlegal system
• The “soft” budgets of the state-ownedenterprises that dominate the powersector
• The potential for malpractice in the useof funds raised through market-basedinstruments
• The potential for higher costs to theindustry in some instances.
Before market-based instruments cando their work, a suitable legislative andregulatory framework for administeringthem must be established. Further, it isessential to recognize that unless powerplants and companies have strong com-mercial incentives to make the desired
Table 5. Existing Air Quality Standards for the Ministry of Environment and Forestry
Air qualitystandard Residential and rural areas Industrial and mixed areas(mg/m3) SO2 NOx SPM SO2 NOx SPM
24-hour average 80 80 200 120 120 500Annual average 60 60 140 80 80 360

Options for Reducing Environmental Impacts 15
choices, market-based instruments willnot produce the desired effects.
Reducing and RecyclingCombustion By-Products
Two specific clean coal technologies wereconsidered in the case studies conductedin this project: Pressurized Fluidized BedCombustion in Bihar and Integrated-Gas-ification Combined Cycle in AndhraPradesh. The two technologies, consid-ered the most feasible in current circum-stance, do improve combustion efficiencyand reduce emissions to the environment.Case study data suggest that the use ofthese technologies would result in onlymarginal reductions in ash and CO
2, but
that they would have more substantialimpacts on total SPM and SO
2, reducing
them by as much as 17 percent in Bihar.Their use would also reduce NO
x emis-
sions by 8 to 10 percent. Both requirehigher capital and operating costs, how-ever, which exceed those of power plantsthat do not use these technologies by 10to 15 percent. Consequently, neither tech-nology would be implemented on the ba-sis of normal market incentives.
In 1996/97 alone, coal production gen-erated 62 million metric tons of ash. The
high ash content of Indian coal makesash disposal one of the most pressingenvironmental problems India faces asa result of its reliance on coal-poweredenergy. The steady increase in open-castmining, which now supplies the bulk ofIndian coal, has been a major factor in thefalling calorific value and rising ash con-tent of Indian coal. Storage of fly ash de-mands large land areas; once land is usedfor this purpose, it is expensive to reclaimthe land so that it can be used in otherways.1 Often, this financial investment inland recovery is not made and the land issimply lost.
The Andhra Pradesh and Bihar casestudies clearly highlight the environmen-tal hazards associated with current prac-tice. In Andhra Pradesh, only 5 percent ofthe ash stock piled outside thermal plantsis used by industries. The rest is dumpedin ash ponds or left in a pile outside theplants. In Barauni (Bihar), ash ponds arelocated on permeable sand, allowinggroundwater contamination. Ash hasspilled to local agricultural lands. Riversin Patratu are said to be full of ash; dur-ing dry seasons, there are significant emis-sions of fugitive dust.
Not only does the ash cause environ-mental damage, but it also increases the
1. During combustion in power plants, the pulverized coal particles are injected into thefurnace and ignited in suspension. The mineral matter in coal is transformed, leading to theformation of ash. The ash residues of combustion possess a wide range of both physical andchemical properties that depend on the coal utilized, the combustion regime under which theyare generated, and the method of collection. The ash that enters the flue gas stream is called flyash, and the ash that falls through to the furnace bottom is called bottom ash. Fly ash generallyconstitutes about 80 percent of the total ash produced. Coal ash is a complex material in termsof specific gravity, size, morphology, microstructure, and mineralogy. The ash matrix consistsof a mixture of aluminosilicates, silicates, iron oxides, and a certain amount of alkali-silicatesin both amorphous and crystalline form. The mineralogical constituents of coal ash are SiO2,Al2O3, Fe2O3, and CaO.

16 Options for Reducing Environmental Impacts
cost of transport to the power station siteand causes wear and tear on equipment.Plants that burn the high ash coal are in-trinsically more expensive and less effi-cient because they must handle largequantities of noncombustible and abrasivematter.
To date, limited use has been madeof coal washing, a process that removessome of the mineral matter that wouldresult in ash prior to burning. Becauseof the properties of Indian coal (it is diffi-cult to separate mineral matter from car-bon without also losing carbon), theeconomic tradeoffs for coal washingmake it a controversial option. Conse-quently, situational analysis is needed todetermine when transport is economi-cally feasible. The Andhra Pradesh CaseStudy concluded that washing coal withmarginally high ash content (30–38 per-cent) or with calorific values greater than4,000 kilocalories per kilogram may notbe advantageous. However, as long as thetotal cost remains competitive with thatof imported coal, coal washing is a viablealternative for coal with high ash contentand low calorific value that must be trans-ported over distances of more than 1,000kilometers. Cost recovery incentives are
essential, however, to make this option at-tractive (ASCI Consultancy 1998).
The major economic benefit resultingfrom the use of the washed coal is thelower capital cost experienced by plantsspecifically designed to burn this coal.However, the waste carbon must be dis-posed of, contributing to environmentaldamage. Much of the large volume ofsolid waste products is in the form of finecarbon particles suspended in water. Ashfrom improperly designed ash ponds canenter the aquatic ecosystem, contaminat-ing groundwater, as well as reservoirs,streams, and rivers. While well-designedand well-managed ash disposal systemswould result in minimal pollution, mostash ponds in use at India’s power plantsare not properly designed or operated anddo not comply with Central PollutionControl Board standards.
Some of this lost coal can be burnedin a fluidized bed process or used asbackfill in mines. An alternative ap-proach to the fly ash problem is to en-courage its use in a wide variety ofcommercial applications. To date, how-ever, India has been less successfulthan other countries in encouragingcommercial use of this waste material.

Options for Reducing Environmental Impacts 17
In 1996/97, only 2 percent of the 62 mil-lion metric tons of ash produced byburning coal in India was used commer-cially. By comparison, China produced55 million metric tons of ash and re-cycled 25 percent of it. This poor recordis not for any lack of possible applica-tions relevant to the country’s needs. Thegreatest emphasis has been placed on itsuse in construction materials, since In-dia has a chronic shortage of housing,and building materials are alwaysneeded. It is necessary to add bindingreagents to ash and clay, however, tomeet applicable standards. As a result,the production of bricks from fly ashappears to be economical only when pro-duction exceeds 25,000 bricks per dayand when the bricks are used within 50kilometers of the production site.
A variety of other applications are alsopromising. For example, it may be used as
filler, as a soil conditioner, or as a replace-ment for cement. Some buildings in Indiahave already been built with concrete thatcontains ash. A report prepared for theWorld Bank sees the greatest potential forenvironmental benefits in “low value-added” uses of fly ash (uses that do notrequire significant processing) (Water andEarth Science Associates 1996). Examplesinclude uses in industrial effluent treat-ment, road making, embankment construc-tion, and plantation raising (box 4).
There are, however, obstacles to theuse of these productive variations thatplanners must take into account. Theseinclude quality variations in the coal,transportation costs, technological limita-tions, impaired quality as a result of wetmethods of coal collection and disposal,and consumer resistance to products thatcontain coal ash. Potential users must alsoconsider the following:
Box 4. Applications for Coal Ash
Agriculture: As an absorbent, artificial aggregate, fertilizer, and soil conditioner.
Building materials: For aggregate, bricks, building blocks, ceramic products, paving ma-terials, roofing tiles, wallboards, and paneling.
Cement and concrete: In cement, cement extender, cement substitute, concrete, concretefiller, foamed concrete, and mortar.
Civil engineering: Aggregate, asphalt filler, backfill, embankment materials, foundationsand road construction, grout, and hydraulic barriers.
Industrial materials: Abrasives, absorbents, artificial sand and aggregate, ceramic mate-rials, decorative materials, filter media, gas cleaning, and industrial fillers.
Materials recovery: Recovery of alumina, iron and silicon, and trace elements.
Waste treatment: Grout and waste stabilization.
Source: Water and Earth Science Associates 1996.

18 Options for Reducing Environmental Impacts
• The price that industry must pay to thegenerators for the ash (if any), plus thecost of transport
• The cost of alternative materials• The impact of using coal ash on the
quality of the end product• The impact that using coal ash has on
the cost of the production process.
The National Thermal Power Corpo-ration, which runs thirteen coal-firedpower plants in India, has been success-ful in increasing the utilization of fly ashby developing policies to encourage en-trepreneurs to make use of the waste. In1991 it established an Ash Utilization Di-vision at the corporate level, with AshUtilization Cells at each power plant. Itssix-year program to promote the internaluse of ash in construction and to facilitatethe use of ash by private companies suc-ceeded in increasing ash utilization in itsplants from 2 to 3 percent in 1991 to 10percent in 1996/97. The corporation’s in-centives for entrepreneurial use includedsuch policies as the following:
• Dry fly ash is provided free of cost tousers in and around the power stationfor an initial period of five years.
• Surplus land is made available for adiscounted rent to companies that useash.
• The corporation invests equity in jointventure companies for ash utilization.
The National Thermal PowerCorporation’s experience suggests thatthe use of fly ash can be encouraged bychanges in plant policy. Most plants, how-ever, do not appear motivated to pursuethese policies. While in theory powerplants are required to meet standards for
ash disposal, in practice these standards areoften not met. The poor compliance impliesthat the actual cost of ash disposal in In-dian power plants is much lower than thecosts in well-designed and well-managedsystems. Many state electricity boards areapparently more likely to save moneythrough poor ash pond management thanby encouraging industry to use ash. Con-sequently, the economic potential for theuse of ash in India is far from realized. Thepreviously cited “Review of Coal Ash Uti-lization” (Water and Earth Science Associ-ates 1996) suggests that the currentproblems of ash disposal and manage-ment could in part be corrected throughstronger enforcement of present environ-mental standards.
Currently the government of Indiaprovides some fiscal incentives to en-courage the use of ash. Bricks and otherbuilding materials using 25 percent ormore fly ash as raw material are exemptfrom excise duty. Also, import machineryneeded to produce building materialsfrom ash is exempt from customs duty ifit is not available within the country. Thegovernment has also taken several admin-istrative actions:
• It has asked state governments to pre-pare action plans for using 50 percentof fly ash by the year 2000.
• It has asked State Pollution ControlBoards to be lenient with industriesthat use industrial wastes.
• It has required environmental clear-ances of thermal power plants, whichemphasizes the need to arrange fordry ash collection and use.
Two additional policy options couldbe used to increase the use of fly ash:
Options for Reducing Environmental Impacts 19
• Binding utilization levels. Bindingtargets imposed by the central govern-ment could be effective, provided thatthe targets are well designed and geo-graphically differentiated to reflect theeconomic potential for the use of ashin different areas.
• A tax on ash disposal. Such a tax wouldhave to be combined with power sec-tor reform and commercial and regu-latory incentives to have a significanteffect. If environmental standards areenforced more strictly, however, an ashdisposal tax will be unnecessary.
Siting Plants to ReduceEnvironmental Damage
Since the construction of many new coal-fired plants will be needed to meet forecastdemand, it is important to consider the en-vironmental impacts attributable to plantlocation. It is instructive to consider the rela-tive disadvantages and advantages of twotypes of power plant sites: at a load center(that is, in an area where a high populationof power users is concentrated), and at thepit-head (in a sparsely populated area).
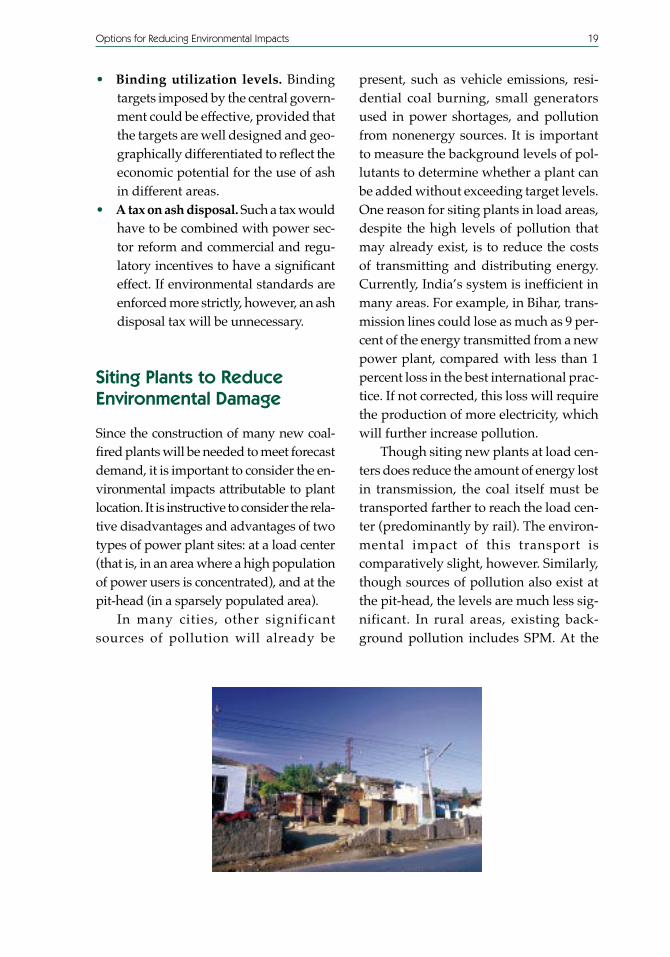
In many cities, other significantsources of pollution will already be
present, such as vehicle emissions, resi-dential coal burning, small generatorsused in power shortages, and pollutionfrom nonenergy sources. It is importantto measure the background levels of pol-lutants to determine whether a plant canbe added without exceeding target levels.One reason for siting plants in load areas,despite the high levels of pollution thatmay already exist, is to reduce the costsof transmitting and distributing energy.Currently, India’s system is inefficient inmany areas. For example, in Bihar, trans-mission lines could lose as much as 9 per-cent of the energy transmitted from a newpower plant, compared with less than 1percent loss in the best international prac-tice. If not corrected, this loss will requirethe production of more electricity, whichwill further increase pollution.
Though siting new plants at load cen-ters does reduce the amount of energy lostin transmission, the coal itself must betransported farther to reach the load cen-ter (predominantly by rail). The environ-mental impact of this transport iscomparatively slight, however. Similarly,though sources of pollution also exist atthe pit-head, the levels are much less sig-nificant. In rural areas, existing back-ground pollution includes SPM. At the

20 Options for Reducing Environmental Impacts
coal mine itself, SPM will arise from themine itself and as a result of vehicles trans-porting material from the mine. Thesebackground SPM levels could be reducedto acceptable limits through the use ofhigh-efficiency electrostatic precipitators.
When new plants are sited, the char-acteristics of the terrain must also be con-sidered. Air dispersion modeling in theBihar case study led to the conclusion thatconcentrations of SPM, NO
x, and SO
2 tend
to be higher on hilltops than flat terrain,though any area will have specific geo-graphic characteristics that increase or de-crease its ability to disperse pollutants.Planners will need to model the type andquantity of pollutants released in relationto areas where people are living in thegreatest numbers.
Using Options inCombination
When these options are used together,significant environmental benefits canbe achieved even though the individualimpact of each option may be modest.
In Andhra Pradesh, a combination ofoptions consisting of greater use of renew-able energy sources, demand-side man-agement, coal washing and clean coaltechnologies, and rehabilitation of thetransmission and distribution systemcould reduce coal-based power genera-tion by 18 percent by 2015. Total systemcosts (in present value terms) would fallby about 4.5 percent, with significant en-vironmental benefits: SO2 and NOx levelswould fall by 27 percent and 21 percent,respectively, while the decline in totalSPM, CO2, and ash would be on the orderof 16–18 percent (tables 6 and 7).
In Bihar, a mixture of demand-sidemanagement, greater use of renewable
energy sources, and rehabilitation of thetransmission and distribution systemwould reduce coal-based power genera-tion by 15 percent by 2015. Total systemcosts would fall by about 7.5 percent, withstriking environmental impacts. SO
2 lev-
els would decline by 7 percent, NOx by 4
percent, total SPM by 8 percent, and CO2
by 10 percent.Participants in the National
Decisionmakers Workshop and the Na-tional NGO Workshop stressed that op-tions will not be used or sustainablewithout some measure of reform. Fourcritical strands must be woven togetherto achieve success:
• Getting the price of electricity rightso as to send the correct signals toconsumers to encourage them to in-vest in energy-saving practices andtechnology
• Getting the price of fuels right to “cre-ate a more level playing field” for natu-ral gas and renewable energy sources
• Increasing the commercial motiva-tion of utilities to give them the in-centives to make choices that benefitthe environment, such as improvingash management and rehabilitatingtransmission and distribution systems
• Increasing the funds available toutilities to make improvements byraising tariffs.
Introduced as an integrated packagewithin the framework of sector reform,case studies and other evidence suggestthat an appropriate combination of op-tions can succeed together in significantlyreducing environmental damage frompower generation, with its associatednegative impacts on the quality of life andhealth of residents.

Options for Reducing Environmental Impacts 21
Table 6. Andhra Pradesh—Cumulative Pattern of Generation Mix(over the study period 1997–2015)
Scenario CoalHydrocarbons HydroOther Renewables
Gigawatt- Gigawatt- Gigawatt- Gigawatt-hour % hour % hour % hour %
IFS 965,474.0 70.0 232,923.0 16.9 181,182.0 13.1 — —Combinations 786,548.0 63.5 246,261.0 19.9 181,183.0 14.6 24,352.0 2.0Memo: reduction
in coal-basedgeneration 178,926.0 18.5
— Not available.Notes: 1. IFS refers to interfuel substitution. The scenario assumes that current tariff policies and demandtrends will continue and that traditional supply side planning and choices between fuels will be made on thebasis of economic cost. 2. Combinations: The scenario examines the combined effort of demand and supplyside measures. On the demand side, the scenario considers demand-side management (DSM) and transmis-sion and distribution (T&D) loss reduction (T&D losses assumed to decline from 20 percent under the refer-ence case to 10 percent), the impact of which is manifested in reductions in generation equivalents. Thesupply-side measures consider such options as clean coal, new technologies (pressurized fluidized-bed com-bustion in Andhra Pradesh), and a reasonable amount of renewables introduced.
Table 7. Andhra Pradesh—Impact on Cost and the EnvironmentEmissions
CO2 SOx NOx Total SPM AshTotal cost (million (metric (metric (million (million Land
Scenario (Rs. billions) metric tons) kilotons) kilotons) metric tons) metric tons) (ha)
IFS 742.2 1,235 2,552 2,576 252 251 2,008
Combination 708.4 1,011 1,851 2,027 212 207 1,656
Memo: %
reductions in
present value
of cost and
environmental
impact 4.6 18.1 27.5 21.3 15.9 17.5 17.5
Notes: 1. The present value (PV) of Total Cost = PV of (Investment in committed and new plans + Variable Costs + Invest-ments in T&D – Salvage Value). 2. Variable costs include fuel, variable operations and maintenance, and fixed operationsand maintenance costs. 3. The land required for ash disposal is 8 hectares per million metric tons of ash. 4. The discount rateis 12 percent for local pollutants, such as SOx, NOx, and total SPM. 5. No discounts are given for CO2 emissions, ash, and land.6. The PV of DSM is estimated from the IRP report (Meier 1996). Associated T&D costs are adjusted downward to reflectreduced investments corresponding to lower demand. 7. The PV of T&D rehabilitation cost is estimated independently atone third the generation cost.


23
Applying the DecisionmakingProcess and “Toolkit”
The study yielded two key products thatare immediately applicable in other situ-ations in which power system plannersuse data to guide their decisions andminimize the serious impact of powerproduction on the environment. The firstis a tested decisionmaking process tohelp planners develop sound plans forpower development.
The second key product is a “toolkit”consisting of a series of planning “mod-ules” that can be used flexibly and thatprovide a variety of choices to users indifferent states with a wide range of con-cerns. Although the software programsused in the project performed well, alter-native software programs, which expertsbelieve would work equally well, are alsoavailable. To help states choose the bestplanning tools for their situation, the lo-cal and international consultants whoworked on the activity produced a prac-tical description of the toolkit in theManual for Environmental Decisionmaking,recently published by the Energy SectorManagement Assistance Programme(ESMAP Report 213/99, June 1999).
In disseminating the process and as-sociated tools, planners and consultantswill benefit by applying the lessonslearned from the experience gained inthis study:
• Workshops are an important part of theconsultative process. They can be usedeffectively to raise planners’ awarenessof the environmental impact of powergeneration, achieve consensus amongparticipants on project activities, andshow planners how to identify the beststrategies to mitigate negative impactsin their planning areas.
• Workshops are effective vehicles forpublicizing findings. They provideopportunities to make relevant agen-cies in target states aware of thedecisionmaking process and the ana-lytical tools available to accompany it;to encourage them to adopt similarapproaches to achieve their corporateplanning, environmental, and regula-tory objectives; and to help them de-sign a program to enable them to usethe process and tools successfully.
• Sound corporate planning in powersystem expansion is essential to man-age adverse environmental impactseffectively.
• The planning process will work best ifreforming states are targeted. Withoutprogress toward power sector reform,the developmental impact of the pro-cess will be significantly hampered.
People involved in the planning pro-cess may include representatives fromstate agencies, state electricity boards,unbundled transmission and generation
3From Knowledge to Action

24 From Knowledge to Action
companies, independent power produc-ers, academic institutions, nongovern-mental organizations (NGOs), and centralpower agencies, as well as consultants(box 5). Their work is best structuredaround a set of questions that may be an-swered through the appropriate applica-tion of modeling tools. For example, toexplore the environmental impact of re-form, questions could include what theconsequences would be of choosing plantson the basis of economic costs and allow-ing environmental costs to be internal-ized? Or, to explore the feasibility oftechnical options, questions could includehow much it would cost to use new cleancoal technologies to wash coal, what thepotential would be for renewable energysupplies, and what level of environmen-tal benefits could be achieved by usingthese methods?
Once the questions are clear, it is es-sential to determine basic parameters,such as the study boundary (which con-sumers and power plants will be studied),the study period, and assumptions to beused for modeling. Scenarios can then bedeveloped to determine what results
would occur in specific sets of circum-stances of interest to planners—for ex-ample, given stated economic policies,energy sector policies, policy instruments,and power sector options.
Having defined the questions to beanswered, the project parameters, and thescenarios to be explored, specific tools canbe applied to carry out the necessary stud-ies. Special studies can also be carried outas needed to research issues outside thescope of the existing “toolkit.”
The toolkit consists of a series of linkedmodules (box 6). Computer modeling en-ables planners to determine what wouldoccur under each of the identified sce-narios. Key modules tested in this studymay be used to generate “outputs” in thegeneral areas of demand forecasting,power system planning, environmentalanalysis, and financial analysis.
As results are reached, those partici-pating in the planning process should notonly be informed of these results, but alsobe actively assisted in understandingtheir importance for decisionmaking andin using them appropriately in the plan-ning area.

From Knowledge to Action 25
Box 5. Elements of the Participatory Planning Process
• Disseminate a questionnaire to senior officials in the energy and environment sector,as well as to nongovernmental organizations, and to private investors to obtain theirviews on issues and priorities.
• Establish an advisory group to guide the report development process.• Conduct technical workshops for specialists to reach consensus on methodology for
projections and modeling.• Conduct seminars for nongovernmental organizations and decisionmakers to exchange
information and encourage involvement and interest in the planning process.• Disseminate results on an ongoing basis to state contacts, nongovernmental organiza-
tions, and other key officials through designated coordinators and periodic seminars.• Hold workshops for decisionmakers and nongovernmental organizations to dissemi-
nate findings, elicit feedback on results, and determine next steps.
Box 6. A “Toolkit” for State-Level Energy Planning
Tools tested in this project that are available to help other states in India to integrate envi-ronmental concerns in power planning and to assess the impact of future energy produc-tion strategies on the environment include four modeling activities:
• Demand forecasting: To examine historic demand and project future demand, takinginto account the impact of such variables as growth in income, price reform, demand-side management, and rehabilitation of transmission and distribution networks.
• Power system planning: To calculate the schedule of investments in power plants thatwill meet the forecast demand at the least cost. AS-PLAN software was used to projectsystem production costs and emissions of SO2, NOx, SPM, ash, and coal requirements,taking into consideration such parameters as reserve margins, reliability constraints,and loss of load probability.
• Environmental analysis: To indicate the impact of emissions from power plants onlocal air quality. An air dispersion model was used to estimate concentration of SO2,NOx, and SPM in the air.
• Financial analysis: To calculate the financial impact of alternative power develop-ment options. A simple spreadsheet model was constructed from AS-PLAN and othersources showing such key data as capital and operating costs, revenues, and debtservice requirements.


27
References
ASCI Consultancy. 1998. “Environmental Issues in the Power Sector: Andhra PradeshCase Study.” ASCI Consultancy, Centre for Infrastructure Management, Admin-istrative Staff College of India, Hyderabad.
Canadian Energy Research Institute and Tata Energy Research Institute. 1995. “Plan-ning for the Indian Power Sector: Environmental and Developmental Consider-ations.” Canadian Energy Research Institute and Tata Energy Research Institute,Ontario.
Environmental Resources Management. 1997. “Renewable Energy in India: A Spe-cial Study.” Environmental Resources Management, London. March.
ESMAP (Energy Sector Management Assistance Programme). 1999. India: Environ-mental Issues in the Power Sector. ESMAP report 213/99. Washington, D.C.
Meier, Peter. 1996. “Integrated Resource Plan for Andhra Pradesh.” U.S. Agency forInternational Development (USAID), Office of Energy, Environment, and Tech-nology, Washington, D.C., May.
Ministry of Non-Conventional Energy Sources. 1999. Annual Report, 1998–99. Min-istry of Non-Conventional Energy Sources, Government of India, New Delhi.
SCADA (Sone Command Area Development Agency). 1998. “Environmental Issuesin the Power Sector: A Case Study of Bihar.” SCADA, Bihar, India.
Water and Earth Science Associates. 1996. “Review of Coal Ash Utilization.” Waterand Earth Science Associates, Ontario.


The World Bank
1818 H Street, N. W.Washington, D.C. 20433, U.S.A.
Telephone: (202) 477-1234Facsimile: (202) 477-6391Telex: MCI 64145 WORLDBANK
MCI 248423 WORLDBANK
Internet: www.worldbank.orgE-mail: [email protected]