Meeting with Investors - May 2015
45
Company’s Presentation TIM BRASIL May, 2015
Transcript of Meeting with Investors - May 2015

Company’s Presentation
TIM BRASIL May, 2015

2
Visit our website and IR app:
www.tim.com.br/ir
AGENDA
Market Overview and TIM Positioning................ 4
Recent Results……………………………..………..………….8
Network & Quality Evolution……..………………..…..16
Fixed Business…………………………….……………....…...21
Business Outlook………….….….…………………….……..24
Regulatory Update……….….….…………………….………29
Appendix.................................................................33
TIM IR app
(English)
TIM RI app
(Portuguese)
3
Statutory Audit Committee:
• Report to Board of Directors
• Oversight Financial reporting
• Analyze anonymous complaints
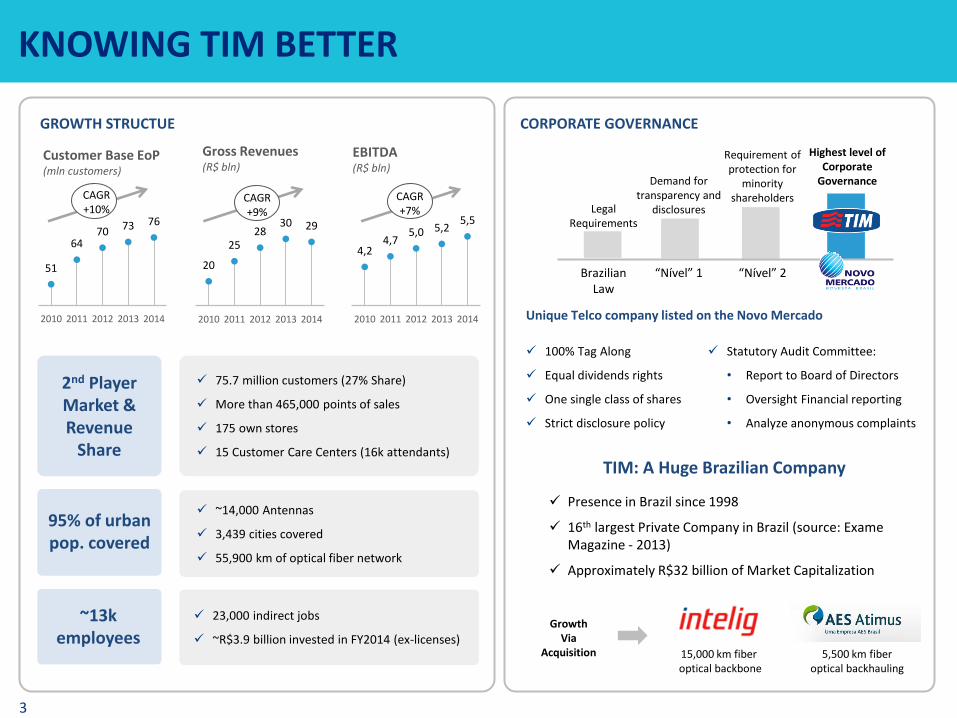
20
25 28
30 29
2010 2011 2012 2013 2014
51
64 70 73 76
2010 2011 2012 2013 2014
CAGR+10%
15,000 km fiber optical backbone
5,500 km fiber optical backhauling
Growth Via
Acquisition
TIM: A Huge Brazilian Company
75.7 million customers (27% Share)
More than 465,000 points of sales
175 own stores
15 Customer Care Centers (16k attendants)
~14,000 Antennas
3,439 cities covered
55,900 km of optical fiber network
23,000 indirect jobs
~R$3.9 billion invested in FY2014 (ex-licenses)
GROWTH STRUCTUE
Gross Revenues (R$ bln)
Customer Base EoP (mln customers)
EBITDA (R$ bln)
4,2 4,7
5,0 5,2 5,5
2010 2011 2012 2013 2014
CAGR+9%
CAGR+7%
Presence in Brazil since 1998
16th largest Private Company in Brazil (source: Exame Magazine - 2013)
Approximately R$32 billion of Market Capitalization
Brazilian Law
“Nível” 1 “Nível” 2
Legal Requirements
Demand for transparency and
disclosures
Highest level of Corporate
Governance
Requirement of protection for
minority shareholders
100% Tag Along
Equal dividends rights
One single class of shares
Strict disclosure policy
Unique Telco company listed on the Novo Mercado
CORPORATE GOVERNANCE
2nd Player Market & Revenue
Share
95% of urban pop. covered
~13k employees
KNOWING TIM BETTER

Market Overview and TIM Positioning
5
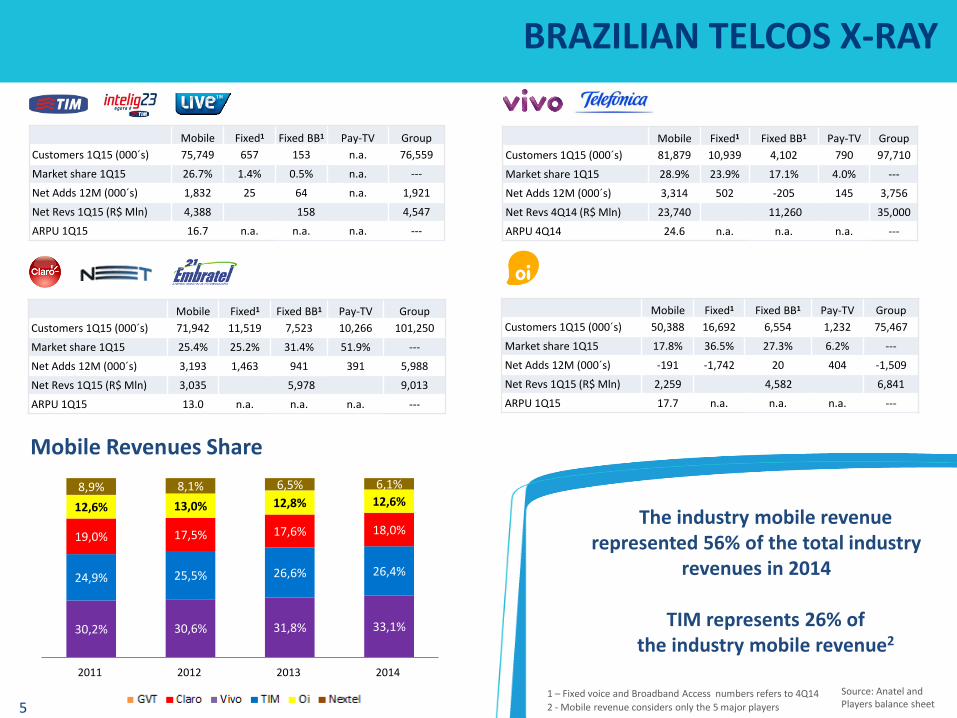
The industry mobile revenue represented 56% of the total industry
revenues in 2014
Source: Anatel and Players balance sheet
Mobile Fixed1 Fixed BB1 Pay-TV Group
Customers 1Q15 (000´s) 75,749 657 153 n.a. 76,559
Market share 1Q15 26.7% 1.4% 0.5% n.a. ---
Net Adds 12M (000´s) 1,832 25 64 n.a. 1,921
Net Revs 1Q15 (R$ Mln) 4,388 158 4,547
ARPU 1Q15 16.7 n.a. n.a. n.a. ---
Mobile Fixed1 Fixed BB1 Pay-TV Group
Customers 1Q15 (000´s) 81,879 10,939 4,102 790 97,710
Market share 1Q15 28.9% 23.9% 17.1% 4.0% ---
Net Adds 12M (000´s) 3,314 502 -205 145 3,756
Net Revs 4Q14 (R$ Mln) 23,740 11,260 35,000
ARPU 4Q14 24.6 n.a. n.a. n.a. ---
Mobile Fixed1 Fixed BB1 Pay-TV Group
Customers 1Q15 (000´s) 71,942 11,519 7,523 10,266 101,250
Market share 1Q15 25.4% 25.2% 31.4% 51.9% ---
Net Adds 12M (000´s) 3,193 1,463 941 391 5,988
Net Revs 1Q15 (R$ Mln) 3,035 5,978 9,013
ARPU 1Q15 13.0 n.a. n.a. n.a. ---
Mobile Fixed1 Fixed BB1 Pay-TV Group
Customers 1Q15 (000´s) 50,388 16,692 6,554 1,232 75,467
Market share 1Q15 17.8% 36.5% 27.3% 6.2% ---
Net Adds 12M (000´s) -191 -1,742 20 404 -1,509
Net Revs 1Q15 (R$ Mln) 2,259 4,582 6,841
ARPU 1Q15 17.7 n.a. n.a. n.a. ---
TIM represents 26% of the industry mobile revenue2
1 – Fixed voice and Broadband Access numbers refers to 4Q14
BRAZILIAN TELCOS X-RAY
2 - Mobile revenue considers only the 5 major players
Mobile Revenues Share
30,2% 30,6% 31,8% 33,1%
24,9% 25,5% 26,6% 26,4%
19,0% 17,5% 17,6% 18,0%
12,6% 13,0% 12,8% 12,6% 8,9% 8,1% 6,5% 6,1%
2011 2012 2013 2014
6
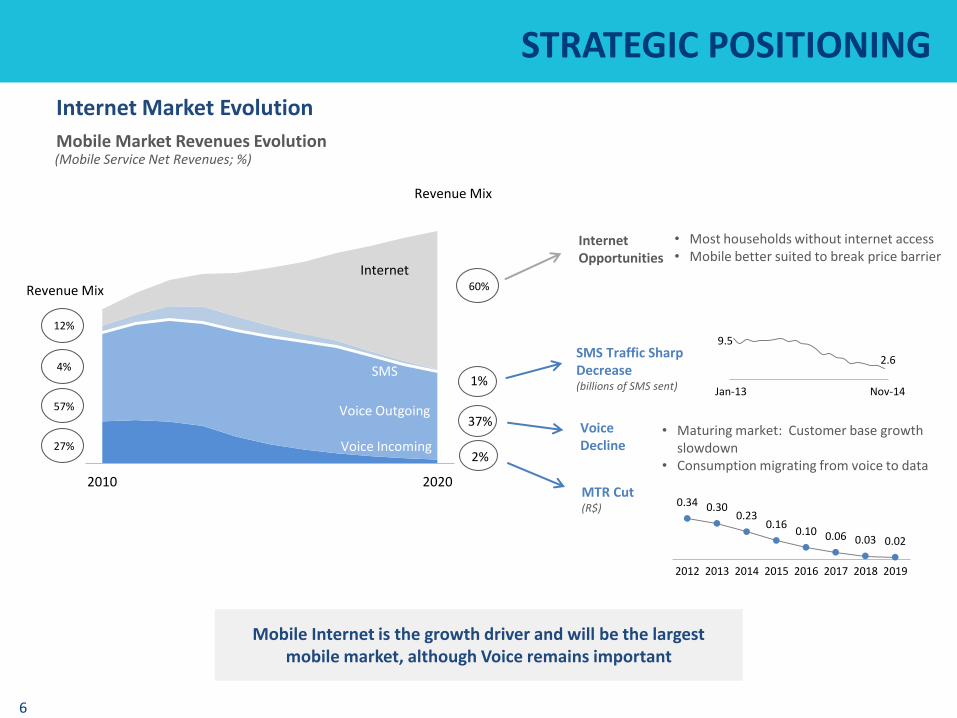
Revenue Mix
Revenue Mix
27%
Mobile Market Revenues Evolution (Mobile Service Net Revenues; %)
• Most households without internet access • Mobile better suited to break price barrier
9.5
2.6
Jan-13 Nov-14
0.34 0.30 0.23
0.16 0.10 0.06 0.03 0.02
2012 2013 2014 2015 2016 2017 2018 2019
57%
4%
12%
1%
37%
2%
MTR Cut (R$)
Voice Incoming
Voice Outgoing
SMS
Internet 60%
• Maturing market: Customer base growth slowdown
• Consumption migrating from voice to data 2010 2020
SMS Traffic Sharp Decrease (billions of SMS sent)
Mobile Internet is the growth driver and will be the largest mobile market, although Voice remains important
Voice Decline
Internet Opportunities
STRATEGIC POSITIONING
Internet Market Evolution

7
105%
90% 79%
72% 66% 63%
• Huge gap between Brazil and developed markets
• Lack of infrastructure: low quality and speed
• Affordability issues (high prices, combos)
• Smaller gap between Brazil and developed markets
• Additional drivers for growth: days of use, data consumption
• Affordable prices
90% 83%
73% 73%
55%
32%
Fixed (% households) Mobile (% population)
Content & Usage Offer
Pure Connectivity
Offer
Developed markets avg: 75%
Developed markets avg: 82%
Connectivity
Proximity & MPayment
Connected Home & In Cars
RichCom
OTT
Telco
COOL
TRUST
QoE* and Caring
Fra UK USA Jap Rus Bra Jap USA UK Ita Fra Bra
Δ: 43 p.p.
Δ: 19 p.p.
* Quality of Experience
DATA: CONNECTIVITY AND BEYOND
Getting People Connected: Broadband Penetration
Entering in the Content World
Apps Social Video Music
Gaming
Digital Identity & Security
A
B
C
D/E
Voice Centric World Data Centric World
Data Data Voice Voice
Focus on voice for B/C classes
Focus on data for B/C classes
Targeting the “Big Middle”
Source: OVUM / INEGI

1Q15 Results

9
+23% YoY
FIRST QUARTER HIGHLIGHTS
• Good performance in postpaid segment, in particular Control Plans
• Resuming market share growth and share of net adds based on quality and offer
EBITDA +1.7% YoY
EBITDA Margin 29.5%
-5.3% YoY
+46% YoY
• Fast growth in 4G adoption and market share
• Largest 4G network on state capitals according to Anatel 4.5x YoY
+6.4% YoY Postpaid performance
4G Performance
Data Revenues performance
Efficient Operation
Control Plan Users
• Accelerating growth on innovative services
• Total VAS revenues already account for 32% of mobile service revenues
• Strong focus on efficiency continues, with opex savings in multiple areas: leased lines, S&M and G&A in particular
• Resilient performance amid short term headwinds
• Margin on services grew to 35%
Web+Content (% YoY)
user base
Stra
tegi
c O
pe
rati
on
al
Fin
anci
al
user base
16% 33%
46%
1Q13 1Q14 1Q15
opex
1Q14 1Q15
10
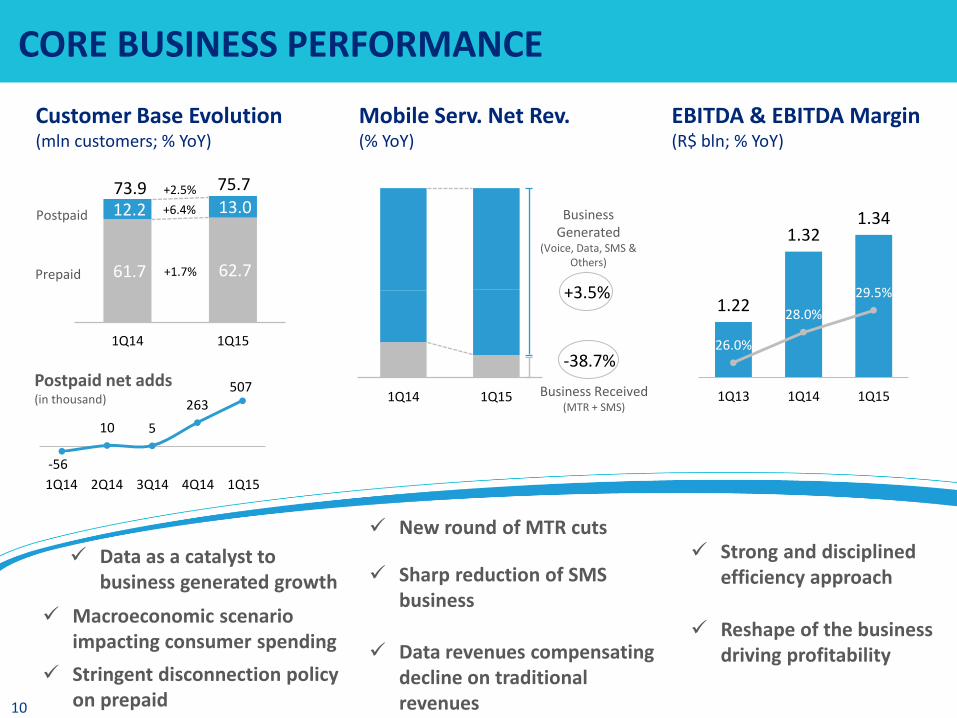
1Q14 1Q15
CORE BUSINESS PERFORMANCE
EBITDA & EBITDA Margin (R$ bln; % YoY)
Mobile Serv. Net Rev. (% YoY)
1.22
1.32 1.34
26.0%
28.0%
29.5%
1Q13 1Q14 1Q15
Data as a catalyst to business generated growth
Strong and disciplined efficiency approach
Business Generated
(Voice, Data, SMS & Others)
Business Received (MTR + SMS)
-38.7%
+3.5%
Customer Base Evolution (mln customers; % YoY)
New round of MTR cuts
Macroeconomic scenario impacting consumer spending
-56
10 5
263 507
1Q14 2Q14 3Q14 4Q14 1Q15
61.7 62.7
12.2 13.0
1Q14 1Q15
Postpaid
Prepaid
73.9 75.7
+6.4%
+1.7%
+2.5%
Postpaid net adds (in thousand)
Stringent disconnection policy on prepaid
Sharp reduction of SMS business
Data revenues compensating decline on traditional revenues
Reshape of the business driving profitability

11
1Q13 1Q14 1Q15
DATA GROWTH CONTINUES, FUELED BY 4G
VAS Gross Revenues Growth (R$ bln; % YoY)
Data ARPU (R$; % YoY)
Data Users (mln; % YoY)
% of gross revenues 21% 25% 32%
+20%
+22%
1Q14 1Q15
+29%
+27%
SMS
Data (Web & Content) +33%
+46%
-28% +1%
market share in 4G
millions 4G users vs. 1Q14
Source: Anatel & GfK Report
1.2
1.8
1.5
1Q14 1Q15
market share of smartphones sales
1Q14 1Q15
+14%
Data Traffic (Bytes of Use)
% of total base 37% 44%
*Feb
* *
* *

12
RELEVANT INNOVATION GENERATING RESULTS
Liberty Controle Gross Adds and Migration (# of postpaid customers)
1Q14 1Q15
Controle WhatsApp
Liberty Controle Voice
TIM Multibank
1.0
mln users
5.0
mln users
Other Innovative Services (# of active users)
Infinity Day (% of infinity day users in the prepaid base)
Mobile money in partnership with Mastercard
and Caixa Econômica
bank
4%
38%
Aug/14 1Q15
TIM Protect TIM Protect Backup
R$0.75 daily offer
Adding new sources of revenues
Mitigating community effect
Mitigating voice MOU reduction
+23% YoY
2%
14%
Feb/14 Feb/15
% of prepaid users on 30/100 MB plans
Increasing data adoption and ARPU
1Q14 1Q15 * * *Feb

13
1Q14 2Q14 3Q14 4Q14 1Q15
4.547
158 4,702 4,547 111 17 5 -289
REVENUES HIGHLIGHT: SOLID CORE BUSINESS
Net Revenues Profile (R$ mln; % YoY)
4,705
+0.1%
-3.3%
Reported Revenues
1Q14
Reported Revenues
1Q15
Ex-MTR Revenues
1Q15
Δ Fixed Services
Δ Business Received
(MTR+SMS)
Δ Business Generated
Δ Products Revenues
Ex-MTR cut
Δ % YoY +3.5% -38.7% +12.4% +0.8%
MTR incidence over Service Revenues
(as % of net service revenues)
1Q15
1Q10
~27%
~10%
Fixed Business Repositioned
Net Revenues (% YoY)
Business Generated (Serv. Rev. ex incoming) (R$ mln; % YoY)
1Q14 1Q15
Tho
usa
nd
s
3,213 3,324
+3.5%
+12.4%
-22.9%
1Q13
1Q15

14
1Q13 1Q14 1Q15
EFFICIENCY APPROACH ON COSTS CONTINUES
Opex Evolution (% YoY)
+5.9%
-2.9%
-5.3%
1Q13
1Q14 1Q15
29 30 31
1Q13 1Q14 1Q15
2013 2014 1Q15
-6.0%
-9.8% -10.1%
Leased Lines costs (% YoY)
SAC/Gross Adds (R$) Bad Debt as % of Gross Revenues
Stable SAC/ARPU
Strong cost efficiency despite solid growth on
data users and traffic
Efficiency in the transport network
Subscriber Acquisition Cost under control
G&A costs (R$ mln)
1.0% 1.1% 0.8%
1Q13 1Q14 1Q15
159 150
143
1Q13 1Q14 1Q15
-4.4% YoY
Lowest industry level
15
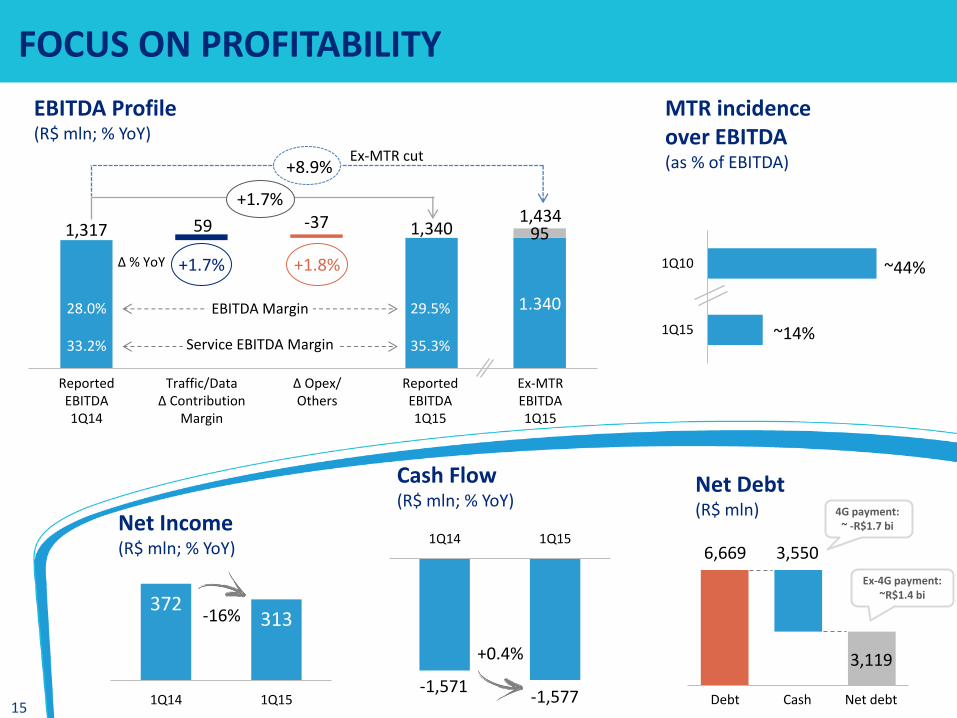
1.340
95 1,317 59 -37 1,340
FOCUS ON PROFITABILITY
Reported EBITDA 1Q14
Reported EBITDA 1Q15
Δ Opex/ Others
Traffic/Data Δ Contribution
Margin
Ex-MTR EBITDA 1Q15
1,434
+8.9%
+1.7%
EBITDA Margin
Service EBITDA Margin
29.5% 28.0%
35.3% 33.2%
Ex-MTR cut
+1.7% +1.8% Δ % YoY
1Q15
1Q10
~44%
~14%
MTR incidence over EBITDA (as % of EBITDA)
Net Debt (R$ mln)
Net Income (R$ mln; % YoY)
Cash Flow (R$ mln; % YoY)
372 313
1Q14 1Q15
Tho
usa
nd
s
-16%
1Q14 1Q15
-1,571 -1,577
Tho
usa
nd
s
6,669 3,550
3,119
Debt Cash Net debt
+0.4%
EBITDA Profile (R$ mln; % YoY)
4G payment: ~ -R$1.7 bi
Ex-4G payment: ~R$1.4 bi

Network and Quality Evolution

17
INFRASTRUCTURE: PROJECT TURBO ROLL-OUT
470
613
924
1Q13 1Q14 1Q15
Quarterly Capex Evolution (R$ mln; % YoY)
New Capex Plan 2015-17 (R$ bln; % YoY)
~11.0
>14.0
2014 Plan(3 yrs)
2015 Plan(3 yrs)
2G
3G/4G
+27%
+51%
Small Cells & Wi-fi (% YoY)
Number of 3G Sites (% YoY)
BackBone (000 Km; YoY)
Availability
Capacity
Coverage
Number of 4G Sites (% YoY)
1Q14 1Q15 1Q14 1Q15
+16% +88%
1Q14 1Q15
+79%
1Q14 1Q15
+7.1
18
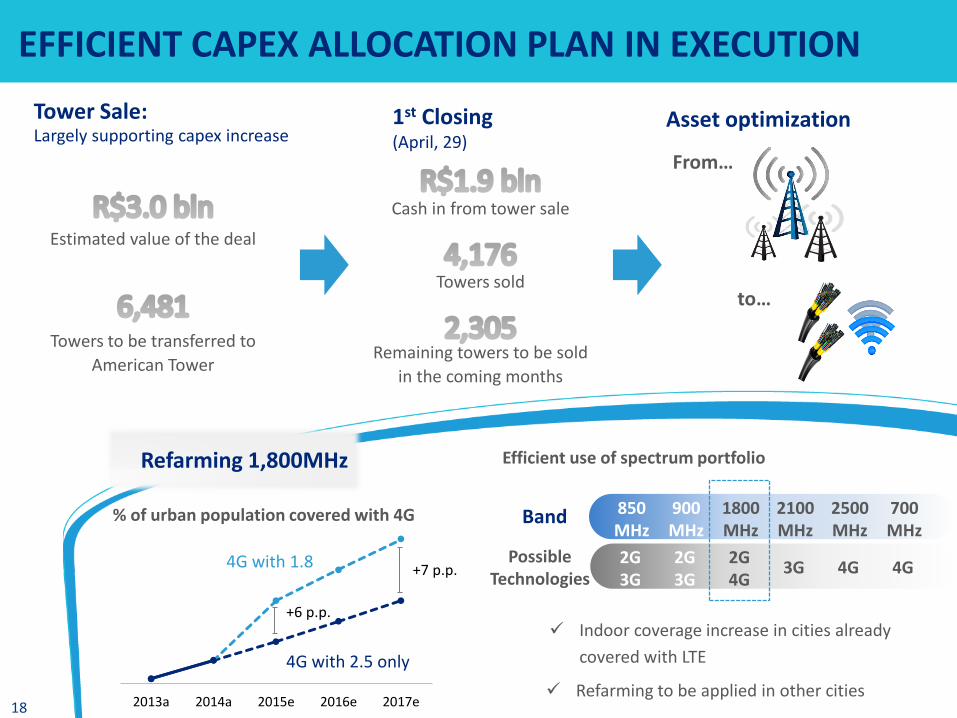
EFFICIENT CAPEX ALLOCATION PLAN IN EXECUTION
2013a 2014a 2015e 2016e 2017e
Indoor coverage increase in cities already
covered with LTE
% of urban population covered with 4G
4G with 1.8
4G with 2.5 only
+6 p.p.
+7 p.p.
Refarming to be applied in other cities
Tower Sale: Largely supporting capex increase
Possible Technologies
850 MHz
Band 900 MHz
1800 MHz
2100 MHz
2500 MHz
700 MHz
2G 3G
2G 3G
2G 4G
3G 4G 4G
Efficient use of spectrum portfolio
to… Towers sold
Asset optimization
Estimated value of the deal
Towers to be transferred to
American Tower
1st Closing (April, 29)
Cash in from tower sale
Remaining towers to be sold
in the coming months
From…
Refarming 1,800MHz

19
15 32 33
47
TIM P3 P1 P4
29% 28% 22%
16%
TIM P1 P3 P4
IMPROVING QUALITY PERCEPTION
Customer Satisfaction: (Provokers Research)
Ranking for Preference TIM Postpaid Rejection
17% 14%
Nov/12 Nov/14
Demands at Consumer’s Protection Agency (Procon) in 1Q15
(2) Total per economic group, in thousands. Source: SENACON/MJ
1Q14 2Q14 3Q14 4Q14 1Q15 1Q14 2Q14 3Q14 4Q14 1Q15
Speed Test: (Ookla)¹
Throughput (Kbps) Latency (ms)
Consumer Complaints²
(downlink in 2G/3G Network) (in 2G/3G Network)
Market Average
TIM
(1) The report was generated and created from TIM's analysis over the NetMetrics Reports provided by Speedtest.net
Public commitment for improvement of communication
and education on mobile internet

20
ANATEL QUALITY METRICS
TIM
Market Avg.
Voice Accessibility*
3G Data Accessibility*
99.4% 99.7%
97.7% 98.9%
Data Drop – 3G
Data Accessibility – 3G
#1 #1
* As of Feb/15. Market Average weighted by number of users for top 4 players (ex-TIM)
Source: Anatel
89% 93%
Feb-14 Feb-15
89% 100%
Feb-14 Feb-15
# of States within Target (%)
% of Metrics within Anatel’s Target
Player Jul/14 Feb/15 Change
P3
P1
P4
93.1%
86.1%
83.5%
78.1%
93.7%
90.1%
83.8%
86.1%
0.6%
4.0%
0.3%
8.0%
Anatel’s Quality Plan Results (End of Quality Plan 2012-2014)
"5.196. (...) há clara percepção de melhora nos resultados ao longo do tempo. 5.197. É de se ressaltar, também, a redução de reclamações de rede alcançada pela operadora no período e a disponibilidade do corpo técnico da operadora para as discussões de qualidade com a Agência. Observa-se que a operadora, que teve um aumento expressivo de usuários em decorrência da sua agressividade comercial, dá sinais claros de investimento em qualidade, com a realização de investimentos em patamar muito superior ao previsto inicialmente, com a melhoria contínua nos resultados e na redução de reclamações".
“clear signs of quality investment... Continuous improvements in the results and in the reduction of complaints”
Anatel’s Opinion on TIM (End of Quality Plan 2012-2014)
Improvement case: São Paulo
Fixed Business
22
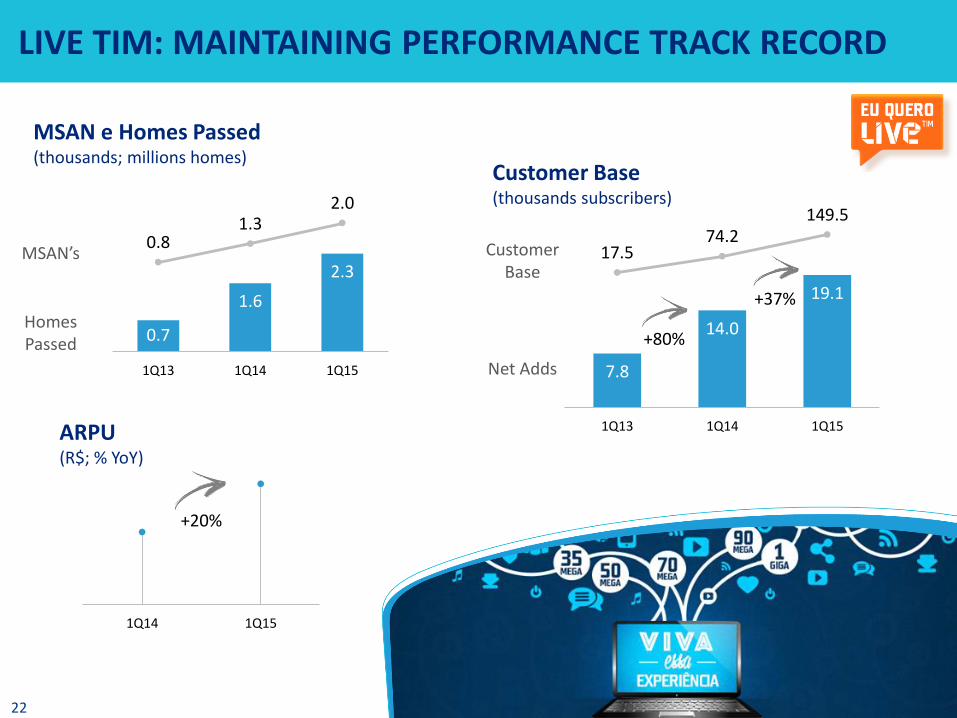
LIVE TIM: MAINTAINING PERFORMANCE TRACK RECORD
Customer Base (thousands subscribers)
MSAN’s
Homes Passed
Net Adds
Customer Base
MSAN e Homes Passed (thousands; millions homes)
7.8
14.0
19.1
17.5 74.2
149.5
1Q13 1Q14 1Q15ARPU (R$; % YoY)
1Q14 1Q15
+20%
+80%
+37%
0.7
1.6
2.3
0.8 1.3
2.0
1Q13 1Q14 1Q15

23
CORPORATE SEGMENT: MORE FOCUS, IMPROVING RESULTS
1Q14 1Q15 1Q14 1Q15
1Q14 1Q15 1Q14 1Q15
1Q14 1Q15
1Q14 1Q15
Activations (R$; % YoY)
Gross Adds (% YoY)
Margin of Projects Sold (R$; % YoY)
Churn (% YoY)
+144%
+106%
-2%
+16%
+26%
+13%
Smartphones Lines (% YoY)
Data only (% YoY)
Fixed Solutions
1Q14 1Q15
+124%
Sales (R$; % YoY)
Mobile Solutions

Business Outlook

25
1Q15 CONCLUSIONS
+ Growing EBITDA and EBITDA margin
+ Growing outgoing revenues
+ Accelerating on data
- Macro / inflation / consumer spending
- MTR reduction
- SMS / voice trends
Q1 with headwinds but positive performance
+ Data ARPU growth
+ Outgoing revenues growth
+ EBITDA margin increase
Solid progress on infrastructure plan
Demonstrating innovative DNA in data
+ Project turbo roll-out
+ Quality metrics
+ 4G take up / growth
+ WhatsApp availability in all plans bringing differentiation
+ Recovering performance in postpaid
+ Increasing data plans on prepaid
+ Data revenues growth
+ Data users growth
+ % of base as data users
All key strategic metrics checked
1 2 3

26
2014a 2017e
2013a 2014a 2015e 2016e 2017e
3G Data Traffic
LTE Data Traffic
73.4
75.7
2013a 2014a 2015e 2016e 2017e
2014a 2017e 2014a 2017e
2014a 2015e 2016e 2017e
2014a 2017e
COST EFFICIENCY
0.34
0.02
2012 2014 2016 2018 2014a 2017e
Operational Efficiency
Fixed Business Progress
Network & Interconnection
Savings
Business Growth
Mobile Customer Base (mln customers)
Data Traffic Expectation (in petabytes)
EBITDA Evolution (R$; without intercompany)
EBITDA - Capex (R$; without intercompany)
SAC (Subscriber Acquisition Cost; R$)
Bad Debt (R$)
Leased Lines Cost (R$)
MTR Path (R$)
SMS Market Revenues (R$)

27
48% 40% 37% 35%
52% 60% 63% 65%
2014a 2015e 2016e 2017e
Innovative
Traditional
(R$; %)
24%
12%
31%
18%
2010 2011 2012 2013 2014 2015e 2016e 2017e
Net Services Revenues Exposure
EBITDA Exposure
MTR Cut (% YoY)
2013a 2014a 2017e
Innovative: Data Content Other
Traditional: Voice Incoming SMS
+48%
-11%
% YoY
Near mid-single
-44%
~5 bln
~9 bln
BUSINESS PERFORMANCE
-35% -33% -25% -11% -15%
MTR Impact Analysis
Mobile Net Revenues Analysis (R$; % YoY)
Innovative and Traditional Investments (R$; % YoY)
28
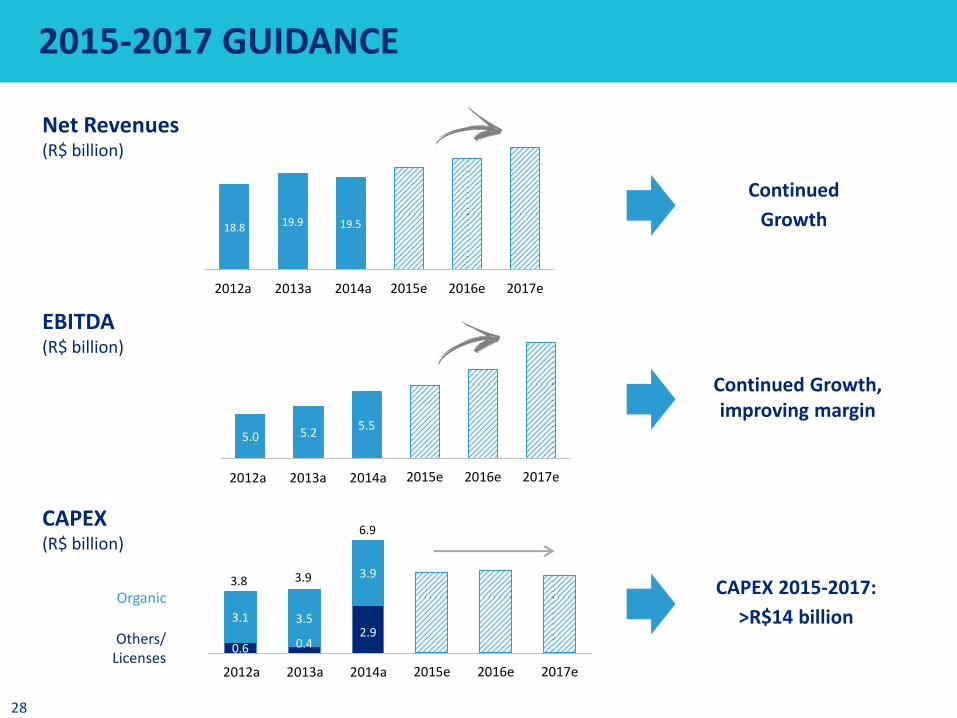
18.8 19.9 19.5
2012A 2013A 2014A 2015e 2016e 2017e
5.0 5.2 5.5
2012A 2013A 2014A 2015e 2016e 2017e
0.6 0.4 2.9
3.1 3.5
3.9
2012A 2013A 2014A 2015e 2016e 2017e
Organic
Others/ Licenses
3.8 3.9
6.9
Continued
Growth
Continued Growth, improving margin
CAPEX 2015-2017:
>R$14 billion
2012a 2013a 2014a
2012a 2013a 2014a
2012a 2013a 2014a
2015-2017 GUIDANCE
Net Revenues (R$ billion)
EBITDA (R$ billion)
CAPEX (R$ billion)
Regulatory Update
30
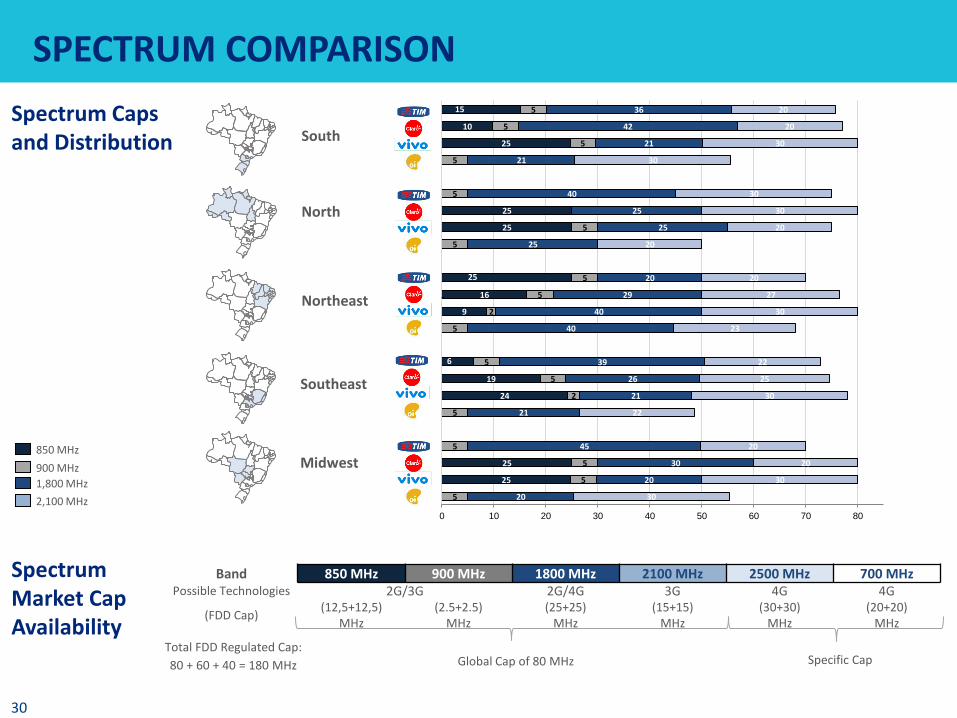
SPECTRUM COMPARISON
25
25
24
19
9
16
25
25
25
10
5
5
5
5
5
2
5
5
5
2
5
5
5
5
5
5
5
5
5
20
20
30
45
21
21
26
39
40
40
29
20
25
25
25
40
21
21
42
36
30
30
20
20
22
30
25
22
23
30
27
20
20
20
30
30
30
30
20
20
0 10 20 30 40 50 60 70 80
Northeast
South
North
Southeast
Midwest 1,800 MHz
900 MHz
850 MHz
2,100 MHz
Band 850 MHz 900 MHz 1800 MHz 2100 MHz 2500 MHz 700 MHz Possible Technologies 2G/3G 2G/4G 3G 4G 4G
(FDD Cap) (12,5+12,5)
MHz (2.5+2.5)
MHz (25+25)
MHz (15+15)
MHz (30+30)
MHz (20+20)
MHz
Total FDD Regulated Cap:
80 + 60 + 40 = 180 MHz Global Cap of 80 MHz Specific Cap
6
25
15 Spectrum Caps and Distribution
Spectrum Market Cap Availability

31
1st Round (10+10) MHz cap
Block 4 (10+10) MHz
Block 5 (10+10) MHz
Block 6 (10+10) MHz
Block 2 (10+10) MHz
Block 3 (10+10) MHz
Block 1 (10+10) MHz Total
R$ mln Regional National
Minimum Price 1,893 30 5 1,928 1,928 1,928 7,712
Winning Bid Unsold 30 Unsold 1,947 1,928 1,947 5,852
Premium - 0.02% - 0.99% 0.00% 1.00% 38
Final Public Price (Anatel) - 26 - 1,739 1,720 1,739 5,224
EAD 887.59 13.86 2.48 903.93 903.93 903.93 3,616
EAD w/ unsold blocks obligations
- 18.9 - 1,119 1,119 1,119 3,616
LTE AUCTION DETAILS
Auction totaled R$5.85 billion, 24% lower then the R$7.7 billion expected for minimum prices for all blocks
EAD Contribution of R$890.1 million related to unsold blocks will be distributed proportionately among the participants and will be discounted of the Public Price
0.52
0.78 0.83 1.07 1.13 1.18 1.22 1.28 1.29 1.29 1.48
2.58
DEN NZL Spain Brazil GER PORT EUA Taiwan Italy France AUS Canada
Average = 1.22
Oi and Sercomtel did not participate in the auction
UPLINK Central Band
TV Channels Guard Band Private Limited Service
4 2 3 1
Central Band 5
6
30% in April 2015
30% in January 2016
30% in January 2017
10% in January 2018
R$1,199 million
~R$360 million
~R$360 million
~R$360 million
~R$120 million
Total Amount:
* Values will be adjusted by the IGP-DI index.
700MHz Auction Results
Spectrum acquisition at fair price (Price in USD/MHz/Pop. adjusted for GDP)
Clean-up Cost Road Map*
32
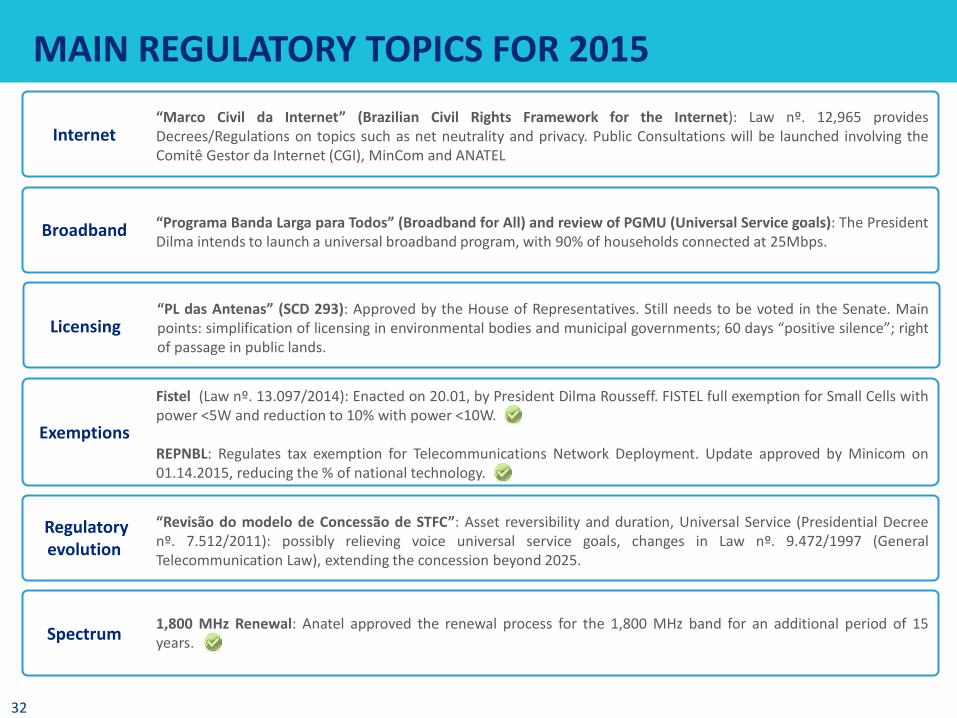
MAIN REGULATORY TOPICS FOR 2015
Internet “Marco Civil da Internet” (Brazilian Civil Rights Framework for the Internet): Law nº. 12,965 provides Decrees/Regulations on topics such as net neutrality and privacy. Public Consultations will be launched involving the Comitê Gestor da Internet (CGI), MinCom and ANATEL
Broadband “Programa Banda Larga para Todos” (Broadband for All) and review of PGMU (Universal Service goals): The President Dilma intends to launch a universal broadband program, with 90% of households connected at 25Mbps.
Licensing “PL das Antenas” (SCD 293): Approved by the House of Representatives. Still needs to be voted in the Senate. Main points: simplification of licensing in environmental bodies and municipal governments; 60 days “positive silence”; right of passage in public lands.
Exemptions
Fistel (Law nº. 13.097/2014): Enacted on 20.01, by President Dilma Rousseff. FISTEL full exemption for Small Cells with power <5W and reduction to 10% with power <10W. REPNBL: Regulates tax exemption for Telecommunications Network Deployment. Update approved by Minicom on 01.14.2015, reducing the % of national technology.
Regulatory evolution
“Revisão do modelo de Concessão de STFC”: Asset reversibility and duration, Universal Service (Presidential Decree nº. 7.512/2011): possibly relieving voice universal service goals, changes in Law nº. 9.472/1997 (General Telecommunication Law), extending the concession beyond 2025.
Spectrum 1,800 MHz Renewal: Anatel approved the renewal process for the 1,800 MHz band for an additional period of 15 years.

Appendix

34
MOBILE BASE ANALYSIS
21,4%
23,4%
24,9% 25,9%
42,0% 41,3% 38,6%
34,3% 33,1%
25,8%
23,5% 25,0%
3,4%
8,9% 12,2% 13,4%
0,0 %
5,0 %
10, 0%
15, 0%
20, 0%
25, 0%
30, 0%
35, 0%
40, 0%
4Q11 4Q12 4Q13 4Q14
30,9% 32,3%
17,0% 19,7%
41,1% 38,9%
11,0% 8,0% 0,0 %
5,0 %
10, 0%
15, 0%
20, 0%
25, 0%
30, 0%
35, 0%
40, 0%
45, 0%
4Q13 4Q14
Source: Anatel (most recent data available)
33,2% 32,3%
34,2%
24,7% 22,3% 24,9%
38,8%
25,9% 28,7% 23,5%
12,4%
29,0%
15,8% 19,3%
11,0% 7,6%
3,6%
12,9%
0,0 %
5,0 %
10, 0%
15, 0%
20, 0%
25, 0%
30, 0%
35, 0%
40, 0%
2011 2012 2013 2014
83% 65%
78% 82% 76%
17% 35%
22% 18% 24%
TIM Vivo Oi Claro Industry
Pre Post
3G 4G
Mobile Base Net Adds Share Mobile Customer Base In 2014
Market Share per Technology
26,8% 27,0% 27,0% 26,7%
24,6% 25,1% 25,1% 25,4%
29,8% 28,8% 28,7% 28,9%
18,5% 18,7% 18,5% 17,8%
17, 0%
19, 0%
21, 0%
23, 0%
25, 0%
27, 0%
29, 0%
1Q12 1Q13 1Q14 1Q15
35
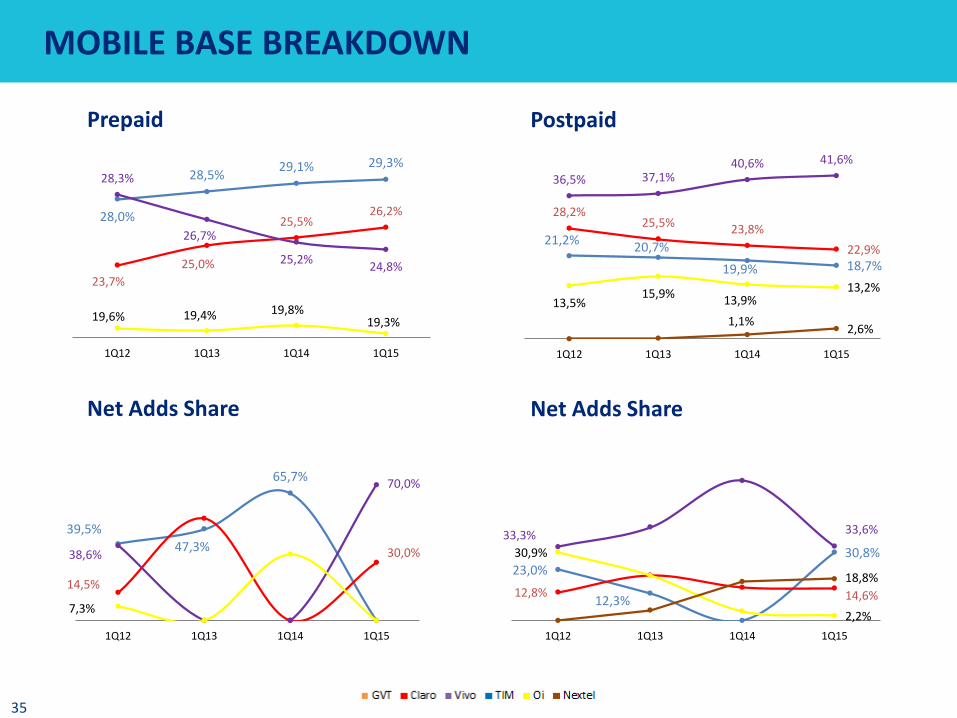
MOBILE BASE BREAKDOWN
Prepaid Postpaid
Net Adds Share Net Adds Share
28,0%
28,5% 29,1% 29,3%
23,7%
25,0%
25,5% 26,2%
28,3%
26,7%
25,2% 24,8%
19,6% 19,4% 19,8% 19,3%
19, 0%
21, 0%
23, 0%
25, 0%
27, 0%
29, 0%
1Q12 1Q13 1Q14 1Q15
21,2% 20,7%
19,9% 18,7%
28,2% 25,5% 23,8%
22,9%
36,5% 37,1% 40,6% 41,6%
13,5% 15,9%
13,9% 13,2%
1,1% 2,6%
0,0 %
5,0 %
10, 0%
15, 0%
20, 0%
25, 0%
30, 0%
35, 0%
40, 0%
1Q12 1Q13 1Q14 1Q15
39,5%
47,3%
65,7%
14,5%
30,0% 38,6%
70,0%
7,3% 0,0 %
10, 0%
20, 0%
30, 0%
40, 0%
50, 0%
60, 0%
70, 0%
80, 0%
1Q12 1Q13 1Q14 1Q15
23,0%
12,3%
30,8%
12,8% 14,6%
33,3% 33,6%
30,9%
2,2%
18,8%
0,0 %
10, 0%
20, 0%
30, 0%
40, 0%
50, 0%
60, 0%
70, 0%
1Q12 1Q13 1Q14 1Q15

36
1Q14 2Q14 3Q14 4Q14 1Q15
• Increase of SMS and internet
offer from R$0.50 to
R$0.60/day each
• Increase on the monthly charge
of TIM Liberty plans
• Increase on the monthly charge
of Liberty Controle plans
• Infinity Turbo 7 launch
• SMS + Data for R$12/month
available to Liberty Controle
plans
• Infinity Day launch
• Increase of Web+SMS package
to from R$0.75 to R$0.99/day
• Increase on SMS and data
services to R$0.75/day each
• Increase of R$1 on Liberty
Torpedo
• Internet sharing plans with
up to 4 devices
• Controle Whatsapp launch
• Price up in the prepaid plan:
from R$0.25 to R$0.30 per
unlimited on-net and LD calls
(using 41) in several regions
• Internet access blocked when
the limit hired is reached
(nationally).
• Vivo Tudo: weekly charge of
R$6.90 for voice, SMS and data
• Increase of R$2 on monthly
charge of Controle plans
• Increase of monthly
package ‘Vivo Sempre
Internet’ from R$9.90 to
R$11.90
• Increase on ‘Vivo Sempre’
tariff from R$0.05 to R$0.06
• Obligation to contract data
package on postpaid plans
• 4G available on ‘Vivo Tudo’
and prepaid packages
• New ‘SmartVivo pós’ plans
• Internet access blocked when
the limit hired is reached (in
prepaid and Controle plans
nationally and in ‘Vivo Tudo’
plan in most regions).
• Unlimited prepaid: increase of
on-net calls tariff to R$0.25
from R$0.21
• Increase of SMS and internet
offers to R$0.60/day each
• Unlimited Controle plan: on net
calls increased from R$0.21 to
R$0.25
• Free on net local calls M-M
in the main code areas
• SMS + Data package per
R$0.99/day
• Promo 6 launch: recharge of
R$6 with voice, SMS and data
benefits
• New offer to SP with voice,
SMS and internet benefits for
R$0.99/day
• Increase on M-F off-net
calls to R$0.70/call
• Increase of SMS and Web
services to R$0.75/day
each
• Unlimited prepaid: increase
of on-net calls tariff to R$0.30
from R$0.25
• Internet access blocked when
the limit hired is reached (in
prepaid plans nationally)
• Increase of internet and SMS
offers to R$0.60/day each
• Increase on daily tariff of
internet to R$0.60/day
• New package with SMS+
Data + Wi-Fi for R$0.75/day
• Obligation to contract data
package on postpaid plans
• Increase of M-M and M-F
on-net calls to R$0.25/day,
local M-F off-net to
R$0.70/day and SMS +
Web + Wi-Fi to R$0.99/day
• Increase bonus, internet limit
and download speed on
prepaid plans
• Standarized offnet M-M tariff
at R$1.75/minute nationally
OFFERS: RECENT MAIN CHANGES

37
59 36 26
74 96
95
45 56 72
9 9 10
2006 2010 2014
188 196
203
167 mln 119 mln
BRAZIL’S SPECIFICS
A
D/E
+1
+11
+22
-23
+16
-1
-10
MEN WOMEN Age
2020: 213 mln 2010: 196 mln
0 to 4 5 to 9
10 to 14 15 to 19 20 to 24 25 to 29 30 to 34 35 to 39 40 to 44 45 to 49 50 to 54 55 to 59 60 to 64 65 to 69 70 to 74 75 to 79 80 to 84 85 to 89
>90
10 10 5 5 0 Million
+13 mln
2%
15%
83%
More than 10(>R$7,888)
2 to 10 ( R$1,576 -R$7,888)
Up to 2 (<R$1,576)
Minimum wage in 2015: R$788
Source: Census 2010 (IBGE) and IPC Target 2014
Source: IBGE
Income Profile
Population by Social Class (million people)
B
C
Minimum Wage in Brazil (minimum wage; % of the pop.)
Age Pyramid (million people)
Brazil Facts
8.5% of Brazilian above 15 years are illiterate
30 mln people still live in the rural areas
5.8% of the cities accounts for 75% of GDP
Brazil is in the 7th position in terms of GDP

38
• Consensus expects a deterioration in overall macroeconomic scenario on the short term
• Market consensus shows a GDP recovery only in 2016
• Market expects government to push inflation above the upper limit of the inflation band
• With inflation and FX Rate going up, SELIC is expected to keep at current levels and starts to drop only by 2016
Source: IBGE for actual figures and Central Bank Focus Report of February 6th, 2015 for estimated figures
6.20 6.30
8.00
5.80
4.50
2013a 2014a 2015e 2016e
10.00
11.75
13.25
11.50
2013a 2014a 2015a 2016e
2.36
2.66
3.25 3.30
2013a 2014 2015e 2016e
2.8
0.2
-1.0
1.2
-0.5
2013a 2014a 2015e 2016e
Government’s Target
Government projection Market Consensus
GDP Forecast (% YoY growth)
Inflation Forecast (IPCA: 12 months)
Interest Rate Forecast (% Selic Target p.y. – year end)
FX Rate Forecast (R$/U$ - end of period)
MACRO SCENARIO OUTLOOK
39
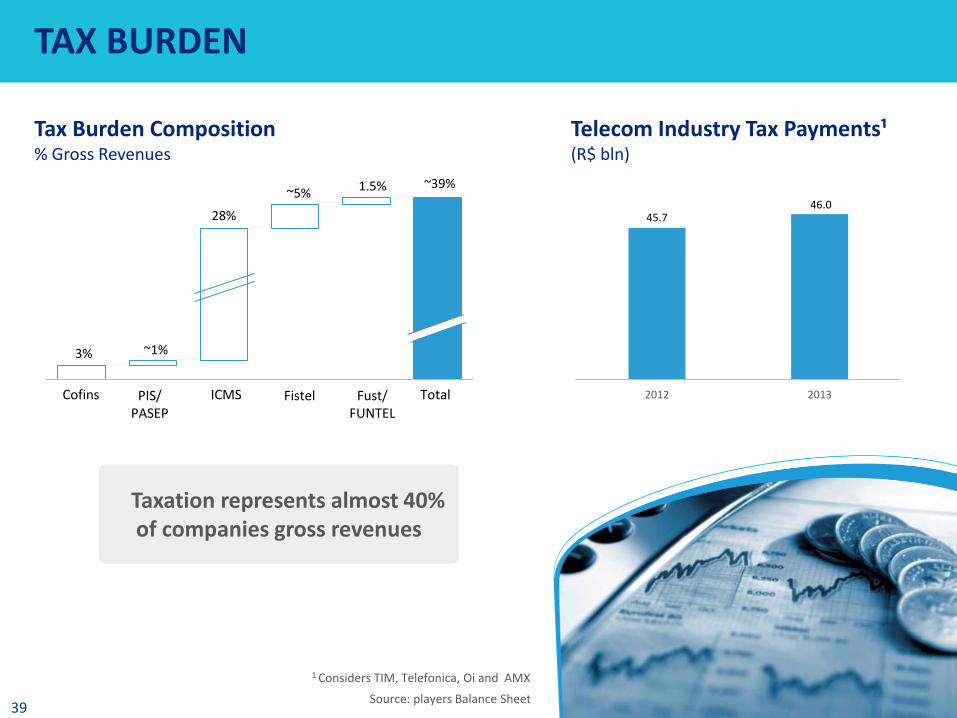
Cofins PIS/ PASEP ICMS Fistel Fust/
FUNTEL
TotalTotal Fust/ FUNTEL
PIS/ PASEP
ICMS Cofins Fistel
3% ~1%
28%
~5% 1.5% ~39%
Taxation represents almost 40% of companies gross revenues
Source: players Balance Sheet
1 Considers TIM, Telefonica, Oi and AMX
45.7 46.0
2012 2013
TAX BURDEN
Tax Burden Composition % Gross Revenues
Telecom Industry Tax Payments¹ (R$ bln)
40
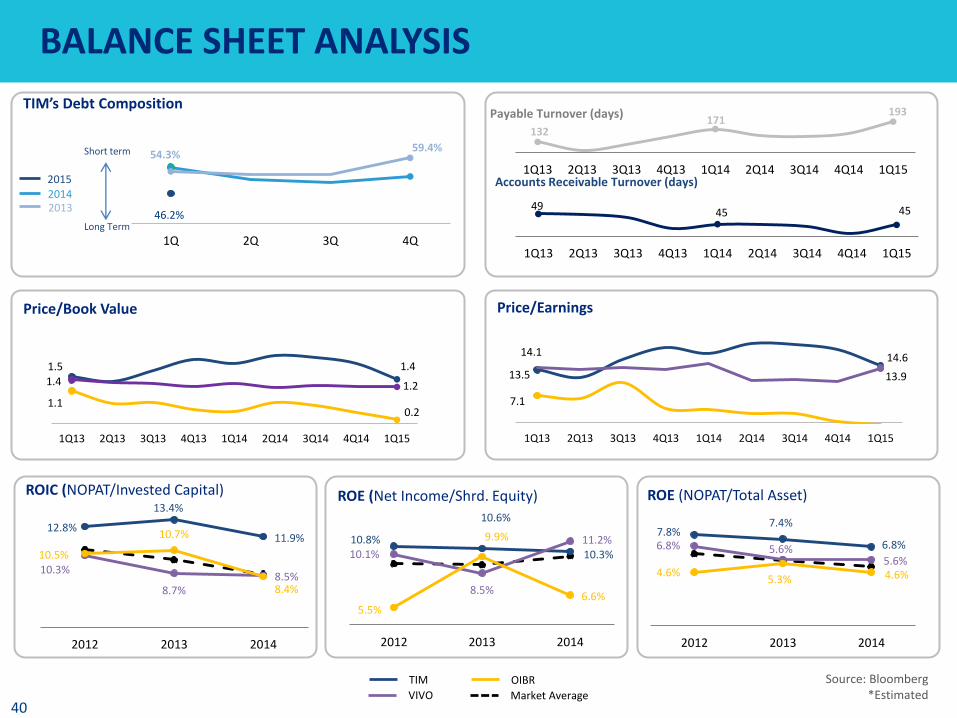
Short term
TIM’s Debt Composition
Price/Book Value
Source: Bloomberg *Estimated
54.3% 59.4%
46.2%
1Q 2Q 3Q 4Q
2015 2014 2013
Long Term
Price/Earnings
Accounts Receivable Turnover (days)
Payable Turnover (days)
12.8%
13.4%
11.9%
10.3%
8.7% 8.5%
10.5%
10.7%
8.4%
2012 2013 2014
10.8%
10.6%
10.3% 10.1%
8.5%
11.2%
5.5%
9.9%
6.6%
2012 2013 2014
7.8% 7.4%
6.8% 6.8% 5.6% 5.6%
4.6% 5.3% 4.6%
2012 2013 2014
TIM
VIVO
OIBR
Market Average
ROE (Net Income/Shrd. Equity) ROE (NOPAT/Total Asset) ROIC (NOPAT/Invested Capital)
49 45 45
1Q13 2Q13 3Q13 4Q13 1Q14 2Q14 3Q14 4Q14 1Q15
1.5 1.4
1.4 1.2
1.1 0.2
1Q13 2Q13 3Q13 4Q13 1Q14 2Q14 3Q14 4Q14 1Q15
13.5
14.6
7.1
14.1
13.9
1Q13 2Q13 3Q13 4Q13 1Q14 2Q14 3Q14 4Q14 1Q15
132 171
193
1Q13 2Q13 3Q13 4Q13 1Q14 2Q14 3Q14 4Q14 1Q15
BALANCE SHEET ANALYSIS

41
QUARTERLY HISTORICAL DATA (R$ THOUSAND)

42
ANNUAL HISTORICAL DATA (R$ THOUSAND)

43
HISTORICAL DATA: OPERATIONAL
Description 2012 2013 2014 2015 (YTD)
Brazilian Wireless Subscriber Base (000`s) 261,808 271,100 280,732 283,400
Estimated Total Penetration 132.8% 134.36% 138.0% 139.0%
Municipalities Served (GSM) 3,383 3,404 3,433 3,439
Market Share 26.88% 27.09% 26.97% 26.73%
Total Lines (000's) 70,376 73,431 75,721 75,749
Pre-paid Lines (000's) 59,658 61,146 63,212 62,735
Post-paid Lines (000's) 10,718 12,285 12,508 13,015
Gross Additions (000's) 38,408 39,627 39,097 9,350
Net Additions (000's) 6,293 3,055 2,289 29
Churn 47.5% 50.9% 49.6% -12.3%
Total ARPU 19.1 18.6 17.7 16.7
Total MOU 136 148 136 120
SAC 29 28 27 31
Handsets Sold (000's) 10,227 12,511 11,951 1,968
CAPEX (R$ Mln) 3,765 3,871 6,854 924
Organic Capex¹ 3,400 3,871 3,932 924
Employees 11,650 12,167 12,860 12,785
¹ Excludes license acquisiton

44
Stock Performance (base 100)*
*Last price as of 03/31/2015 Source: Bloomberg
HISTORICAL DATA 44
STRUCTURE AND STOCK PERFORMANCE
Shareholders Structure
Treasury Shares: 795,888 (0.03%) Total Shares: 2,421,032,479
45
Investor Relations Team
Avenida das Américas, 3434 - Bloco 01
6° andar – Barra da Tijuca
22640-102 Rio de Janeiro, RJ
E-mail: [email protected]
Rogério Tostes
E-mail: [email protected]
Phone: +55 21 4109-3742
Vicente Ferreira
E-mail: [email protected]
Phone: +55 21 4109-3360
Leonardo Wanderley
E-mail: [email protected]
Phone: +55 21 4109-4017
Rodrigo Godoy
E-mail: [email protected]
Phone: +55 21 4109-3446
Luiza Chaves
E-mail: [email protected]
Phone: +55 21 4109-3751
Visit our Website
www.tim.com.br/ir
Statements in this presentation, as well as oral
statements made by the management of TIM
Participações S.A. (the “Company”, or “TIM”), that are
not historical fact constitute “forward looking
statements” that involve factors that could cause the
actual results of the Company to differ materially from
historical results or from any results expressed or
implied by such forward looking statements. The
Company cautions users of this presentation not to
place undue reliance on forward looking statements,
which may be based on assumptions and anticipated
events that do not materialize.
SAFE HARBOR AND IR CONTACTS
Safe Harbor Statements