
MEETING OF THE - Tennessee State Government - …...Consideration of Committee Recommendation to...
172
MEETING OF THE TENNESSEE HIGHER EDUCATION COMMISSION Fall Quarterly Meeting 18 th Floor, Parkway Towers November 14, 2013
Transcript of MEETING OF THE - Tennessee State Government - …...Consideration of Committee Recommendation to...

MEETING OF
THE
TENNESSEE HIGHER EDUCATION COMMISSION
Fall Quarterly Meeting 18th Floor, Parkway Towers
November 14, 2013
AGENDA
TENNESSEE HIGHER EDUCATION COMMISSION
Fall Quarterly Meeting
Commission Boardroom, Parkway Towers
November 14, 2013, 1:00 p.m. CST
Adoption of Agenda
Approval of Minutes, July 25, 2013 Meeting
I. Action Items
Approval of New Academic Degree Program
A. Tennessee State University, Professional Science Masters with a concentration in Applied Geospatial Sciences
B. Postsecondary Education Authorization
1. Authorization of New Institutions
2. Approval of New Programs
C. 2014-15 Operating State Appropriation Recommendations
D. 2014-15 Student Fee Recommendations
E. 2014-15 Capital Projects Recommendations
F. 2014 Improving Teacher Quality Grant Awards
Chairman’s Report
Executive Director’s Report
System’s Reports
Tennessee Board of Regents
University of Tennessee
II. Information Items
A. Title VI Implementation Plan Update and Compliance Report
B. 2013 Articulation & Transfer Report C. Office of P-16 Initiatives Status Report
D. Core to College Status Report
E. First to the Top Update
F. Schedule of 2014 Commission Meetings

Page 1 of 10
MINUTES TENNESSEE HIGHER EDUCATION COMMISSION
July 25, 2013, 1:00 p.m. CDT The meeting was called to order by Vice Chairman Evan Cope at 1:00 p.m. Commission Members present:
Mr. Charles Bone Mr. Cato Johnson Mr. Evan Cope Mr. Jon Kinsey Ms. Sharon Hayes Ms. Pam Koban Mr. Adam Jarvis via conference call State Treasurer David Lillard
Election of 2013-14 Officers Mr. Cope noted that the Commission was currently without a chairman. Before proceeding with the meeting, Mr. Cope recognized Treasurer David Lillard to present the nomination recommendations for the 2013-14 officers. Treasurer Lillard made a motion to approve the following recommended slate of officers: Mr. Cato Johnson, Chair; Mr. Jon Kinsey, vice chair; Mr. Evan Cope, vice chair; and Mayor AC Wharton, secretary and that Mr. Kinsey also serve as member of the audit committee. Mr. Charles Bone seconded the motion; the motion was duly adopted by the following roll-call vote:
Member Aye No Abstain Mr. Charles Bone X Mr. Evan Cope X Ms. Sharon Hayes X Mr. Adam Jarvis X Mr. Cato Johnson X Mr. Jon Kinsey X Ms. Pam Koban X Treasurer David Lillard X
Mr. Johnson thanked the Commission for the appointment and the confidence to lead the commission in the capacity of chairman. He also extended his gratitude to former chairman, Mr. Robert White, for his excellent leadership as chair. Chairman’s Report Mr. Johnson commented on the productive work session earlier in the day and noted the excellent presentations and good discussion on the items presented. Mr. Johnson then introduced the two new members of the Commission: Ms. Pam Koban, representing the 5th Congressional district and Mr. Robert Fisher, new student member from the UT system.

Page 2 of 10
Adoption of Agenda Mr. Johnson then welcomed all and thanked them for their attendance. He called for a motion to approve the agenda. Mr. Evan Cope made a motion to approve the agenda as presented. Ms. Sharon Hayes seconded the motion; the motion was duly adopted by the following roll call vote:
Member Aye No Abstain Mr. Charles Bone X Mr. Evan Cope X Ms. Sharon Hayes X Mr. Adam Jarvis X Mr. Cato Johnson X Mr. Jon Kinsey X Ms. Pam Koban X Treasurer David Lillard X
Action Items Approval of Academic Degree Programs Middle Tennessee State University, Mechatronics Engineering, Bachelor of Science Ms. Betty Dandridge Johnson, Associate Executive Director for Academic Affairs, presented the recommendation for the new academic program. She stated that the proposed Bachelor’s program in Mechatronics Engineering at Middle Tennessee State University was developed in response to requests from Nissan, Yates Services and Bridgestone/Firestone, stating an increasing need for employees who have the training to design complex manufacturing systems that incorporate mechanical, electrical, computer, and materials engineering that result in computer-controlled systems and products with embedded electronics and sensors. Ms. Dandridge Johnson noted that the proposed program will provide entry points for students as freshmen or as transfers into the junior year from community college and a transfer pathway has been established for those students who have completed an associate degree in Mechatronics at Motlow State Community College. Mr. Johnson called for a motion to approve the proposed Mechatronics Engineering program. Treasurer David Lillard made a motion to approve. Mr. Bone seconded the motion; the motion was duly adopted by the following roll call vote:
Member Aye No Abstain Mr. Charles Bone X Mr. Evan Cope X Ms. Sharon Hayes X Mr. Adam Jarvis X Mr. Cato Johnson X Mr. Jon Kinsey X Ms. Pam Koban X

Page 3 of 10
Treasurer David Lillard X East Tennessee State University, Appalachian Studies, Master of Arts Ms. Betty Dandridge Johnson presented the recommendation for the new academic program. She stated that the Master of Arts in Appalachian Studies will formalize East Tennessee State University’s 30-year commitment to Appalachian Studies. She also stated that the proposed program is an outgrowth of research and programming initiated in the Center of Excellence in Appalachian Studies and Services, which will be a strong partner for this academic program. Ms. Dandridge Johnson noted that the proposed interdisciplinary program is designed to have an impact on all aspects of the Appalachian region and its communities including heritage, economics and public health. Mr. Johnson called for a motion to approve the proposed program. Ms. Hayes made a motion to approve. Mr. Bone seconded the motion; the motion was duly adopted by the following roll call vote:
Member Aye No Abstain Mr. Charles Bone X Mr. Evan Cope X Ms. Sharon Hayes X Mr. Adam Jarvis X Mr. Cato Johnson X Mr. Jon Kinsey X Ms. Pam Koban X Treasurer David Lillard X
University of Tennessee at Knoxville, Creative Writing, Masters of Fine Arts Ms. Betty Dandridge Johnson presented the recommendation for the new academic program. She stated that the University of Tennessee Knoxville has developed a curriculum proposal for the Master of Fine Arts (MFA) in Creative Writing and noted the MFA degree will advance the university’s institutional imperatives toward discovery, innovation and creative activities. Ms. Dandridge Johnson also noted the proposed program will transition from offering a Masters of Arts (MA) in English (creative writing concentration) and the enhancement of the MA in creative writing to an MFA will further the institutional goal of positioning UTK as a Top 25 public research university. Ms. Hayes made a motion to approve. Mr. Bone seconded the motion; the motion was duly adopted by the following roll call vote:
Member Aye No Abstain Mr. Charles Bone X Mr. Evan Cope X Ms. Sharon Hayes X Mr. Adam Jarvis X Mr. Cato Johnson X Mr. Jon Kinsey X Ms. Pam Koban X Treasurer David Lillard X

Page 4 of 10
Approval of Minutes, April 25, 2013, Meeting Mr. Johnson called for a motion to approve the minutes of the April 25, 2013, Commission meeting. Mr. Charles Bone made a motion to approve the minutes as presented. Mr. Cope seconded the motion; the motion was duly adopted by the following roll call vote:
Member Aye No Abstain Mr. Charles Bone X Mr. Evan Cope X Ms. Sharon Hayes X Mr. Adam Jarvis X Mr. Cato Johnson X Mr. Jon Kinsey X Ms. Pam Koban X Treasurer David Lillard X
Temporary Authorization of New Institutions, and Approval of New Programs Under the Postsecondary Authorization Act Dr. Bellard-Chase then presented the recommendations of staff and the Postsecondary Education Authorization Advisory Committee to grant temporary authorization to proposed new institutions and new programs. A listing of the institutions and programs is included as Attachment A to the official copy of the minutes. A motion was made by Mr. Kinsey to adopt the recommendations, as presented. Ms. Hayes seconded the motion; the motion was duly adopted by the following roll call vote:
Member Aye No Abstain Mr. Charles Bone X Mr. Evan Cope X Ms. Sharon Hayes X Mr. Adam Jarvis X Mr. Cato Johnson X Mr. Jon Kinsey X Ms. Pam Koban X Treasurer David Lillard X
Consideration of Committee Recommendation to Withdraw Proposed Rule Revisions Ms. Julie Woodruff, Director of DPSA and Lead Attorney, was recognized. She stated that over 18 months ago, the Tennessee Higher Education Commission (THEC), through the Division of Postsecondary School Authorization (DPSA), began a rulemaking proceeding, since then, the filing of a petition for public hearing as well as a legislative session that resulted in changes to the exemption statute, suggestions from regulated institutions on items not addressed in the proposed revisions, and a lawsuit filed in Georgia by Berry College. Ms. Woodruff then noted that as a result of past events and in an

Page 5 of 10
effort to avoid repeated rulemaking proceedings, on July 11, 2013, upon the recommendation of DPSA, the Committee on Postsecondary Education voted to recommend to the Commission that it withdraw the proposed rules and begin a new rulemaking using the rulemaking hearing process described in the Uniform Administrative Procedures Act. Treasurer Lillard made a motion to adopt the recommendations as presented. Mr. Bone seconded the motion; the motion was duly adopted by the following roll call vote:
Member Aye No Abstain Mr. Charles Bone X Mr. Evan Cope X Ms. Sharon Hayes X Mr. Adam Jarvis X Mr. Cato Johnson X Mr. Jon Kinsey X Ms. Pam Koban X Treasurer David Lillard X
2013-14 Operating Budgets Dr. Russ Deaton, Associate Executive Director of Fiscal Policy & Administration was recognized. Dr. Deaton commented that FY 2013-14 proposed operating budgets for higher education are balanced and campuses have again directed the majority of their resources to the teaching functions. He also noted that expenditures for auxiliary enterprises have not exceeded revenues plus unallocated auxiliary fund balances. Dr. Deaton also stated that all higher education budget entities have submitted the required financial data to the Commission and are in compliance with all the budget guidelines and legislative directives. Ms. Hayes made a motion to adopt the FY 2013-14 operating budget recommendations and the Commission authorizes the Executive Director to make any necessary technical corrections as necessary and transmit to the department of Finance and Administration for their approval. Mr. Cope seconded the motion; the motion was duly adopted by the following roll call vote:
Member Aye No Abstain Mr. Charles Bone X Mr. Evan Cope X Ms. Sharon Hayes X Mr. Adam Jarvis X Mr. Cato Johnson X Mr. Jon Kinsey X Ms. Pam Koban X Treasurer David Lillard X
Austin Peay State University Master Plan Dr. Russ Deaton, Associate Executive Director of Fiscal Policy & Administration, was recognized to present the APSU master plan. He stated that a detailed presentation was provided to the Commission by Carl Manka, Senior Director,

Page 6 of 10
Facilities Development, Research and Planning at the Tennessee Board of Regents at the worksession earlier in the day. He noted that the master plan provides a guide for expanding and renovating space at the main campus to support anticipated enrollment growth and addresses the long term needs of the campus with respect to academic facilities, parking, circulation, and visual improvements. Additionally Dr. Deaton indicated that the THEC Space Planning Guidelines were utilized to identify and project needs for campus space. Mr. Cope made a motion to adopt the APSU Master Plan. Ms. Hayes seconded the motion; motion was duly adopted by the following roll call vote:
Member Aye No Abstain Mr. Charles Bone X Mr. Evan Cope X Ms. Sharon Hayes X Mr. Adam Jarvis X Mr. Cato Johnson X Mr. Jon Kinsey X Ms. Pam Koban X Treasurer David Lillard X
Emergency and Proposed Rules – Meningitis Immunization Requirements Mr. Scott Sloan, General Counsel and Associate Executive Director for Legal & Regulatory Affairs, was recognized. Mr. Sloan reviewed Public Chapter 114, known as the “Jacob Nunley Act,” which requires immunization against meningococcal disease for incoming students residing in on-campus student housing at state institutions. He also stated that the Uniform Administrative Procedures Act, Tenn. Code Ann. Section 4-5-208(a)(1), allows for the filing of “emergency rules” in instances where “an immediate danger to the public health, safety or welfare” exists. Mr. Sloan noted it is counsel’s opinion that the risk of meningitis among students in on-campus housing meets the threshold requirements and provides sufficient justification for the emergency filing and the Commission approval will appropriately amend THEC’s administrative rules to effectuate the implementation of Public Chapter 114. A motion was made by Mr. Kinsey to adopt the emergency and proposed rules for meningitis immunization recommendations and the Commission authorizes the Executive Director to make any necessary technical corrections to those rules, including changes required by the Tennessee Attorney General. Mr. Adam Jarvis seconded the motion; the motion was duly adopted by the following roll call vote:
Member Aye No Abstain Mr. Charles Bone X Mr. Evan Cope X Ms. Sharon Hayes X Mr. Adam Jarvis X Mr. Cato Johnson X Mr. Jon Kinsey X

Page 7 of 10
Ms. Pam Koban X Treasurer David Lillard X
Proposed Rules – Fee Discount for the Children of Retired Public School Teachers Mr. Scott Sloan, General Counsel and Associate Executive Director for Legal & Regulatory Affairs, was recognized. Mr. Sloan reviewed Public Chapter 345, which extends the 25 percent tuition discount available at state institutions to the children of retired public school teachers. He stated that eligibility for the discount requires that the parent retired with 30 years of full-time creditable service in Tennessee public schools, or received disability retirement after a minimum of 25 service years. Mr. Sloan noted that Public Chapter 473 renamed the state’s technology centers to “Tennessee Colleges of Applied Technology,” and this revision updates references to these institutions in the administrative rule and Commission approval will appropriately amend THEC’s administrative rules to effectuate the implementation of Public Chapter 345. A motion was made by Mr. Bone to adopt the proposed rule recommendations for the fee discount program and the Commission authorizes the Executive Director to make any necessary technical corrections to those rules, including changes required by the Tennessee Attorney General. Mr. Kinsey seconded the motion; the motion was duly adopted the motion was duly adopted by the following roll call vote:
Member Aye No Abstain Mr. Charles Bone X Mr. Evan Cope X Ms. Sharon Hayes X Mr. Adam Jarvis X Mr. Cato Johnson X Mr. Jon Kinsey X Ms. Pam Koban X Treasurer David Lillard X
Executive Director’s Report Dr. Rhoda began his report by congratulating the officers on their appointments. He then welcomed Ms. Pam Koban to the Commission and noted that, being in his second year of his term, Mr. Adam Jarvis is now the voting student member. He also announced the appointment of Mr. Robert Fisher, student member from the UT system. Dr. Rhoda also welcomed Dr. Daryl Carter, the 2013 Maxine Smith Fellow. He then commented on the Governor’s Drive to 55 Initiative, stating that this program continues the work of the Complete College Tennessee Act (CCTA) and has brought forth several other programs in the areas of college completion and greater educational attainment, and financial aid initiatives for need-based programs.

Page 8 of 10
Dr. Rhoda then commented on the launch of Western Governor’s University (WGU) and announced the first chancellor of the university is Dr. Kim Estep, who previously served as chief academic officer at Nashville State Community College. He also commented on the recent Gates Foundation Strategy Lab, hosted by THEC, where other state’s higher education professionals gathered to learn finance policy on the outcomes-based formula from states proficient in the area. Dr. Rhoda discussed the litigation, which was dismissed, with Berry College and commented on waiving institutional regulations on out of state advertising, noting it was contingent on the Attorney General decision, but was in the public interest to do so. In closing, Dr. Rhoda briefed the Commission on the new staff member, Mary Laphen, graduate assistant in the P-16 division. He then noted that Thomas Sanford has accepted a faculty position at St. Cloud University in Minnesota. Systems’ Reports Tennessee Board of Regents Mr. John Morgan, Chancellor of the Tennessee Board of Regents, was recognized to present his report. He began his report by announcing that Dr. Tristan Denley has accepted the position of Vice Chancellor for Academic Affairs, effective August 19, replacing Dr. Paula Short. He commended Dr. Kay Clark for his interim leadership in that capacity. Chancellor Morgan then discussed MOOCs (Massive Online Open Courses) and the contract entered into with Coursera for a pilot project using the Coursera platform to see how the technology may be used to expand the ability to be successful with students. He then noted a similar pilot, scheduled for the spring, is in progress with edX. Chancellor Morgan also discussed the marketing campaign for community colleges, to be launched on July 29, to attract enrollment, noting this was the first attempt at marketing for community colleges. He also stated that Tennessee Technology Centers have a name change and are now classified as Tennessee Colleges of Applied Technology. Chancellor Morgan announced Dr. Brad Martin has accepted the position of interim president of the University of Memphis and will provide an opportunity to view things differently and move the institution forward to create a new road map. In closing, he noted that former Governor Bredesen has accepted an invitation to chair the National Commission on College and University Board Governance, an effort that the Association of Governing Boards has instituted. University of Tennessee Dr. Joe DiPietro, President, the University of Tennessee, was recognized to present his report. Dr. DiPietro began his report by noting that UT has also entered into a contract with Coursera for a pilot project using the Coursera platform of online learning. He noted that there are several pilot courses underway, an undergraduate program at UT Martin, and two hybrid courses that show a comparison of learning concepts.

Page 9 of 10
Dr. DiPietro then commented on spring Commencements, noting 6200 graduates from UT and an increase of 20 percent in Ph.Ds produced over last year. He then noted that the Veterinary Medicine program is fully accredited and the grand opening is September 21. Dr. DiPietro also commented that the Parsons Center at UT Martin broke ground on July 22 and the nursing program to be housed in that facility will produce 30 graduates, and he discussed the UTK College of Engineering expansion. In closing, he announced that Dr. Steve Angle is the new chancellor at UTC and Dr. Tonjanita Johnson is the new Vice President for Communications and Marketing at UT. Information Items
Diversity in Teaching Grant Awards, 2013-2015 Mr. Herbert Brown, Academic Affairs Analyst, was recognized. Mr. Brown briefly reviewed background on the Diversity in Teaching grant program and noted that with the settlement of the Geier desegregation lawsuit, and in light of current federal laws, the Minority Teacher Education program has evolved into the Diversity in Teaching program. He stated that THEC remains committed to the overarching goals of the program as previously administered. Mr. Brown noted that three institutions were funded for this program totaling $380,000 and will be funded for the period August 1, 2013 to July 31, 2015. 2012-13 Tennessee Higher Education Fact Book Dr. Kimberly Martin, Policy, Planning, and Research Analyst was recognized. Dr. Martin provided an overview of the 2012-13 Tennessee Higher Education Fact Book. She stated the fact book comprises four sections: Student Participation, Student Success, Academic & Fiscal Trends, and the outcomes-based public higher education Funding Formula. Dr. Martin also stated the Fact Book is one of THEC’s statutory responsibilities, and it is updated annually. Dr. Martin highlighted the distribution of fall 2012 enrollments across all sectors of Tennessee higher education and noted a recent downturn in first-time freshmen and total enrollment within certain public sectors, concomitant to the downturn in Tennessee’s public high school graduates. She also noted that freshman-to-sophomore retention rates edged downward across all public sectors in the most recent year for which data were available, however, the report shows steady, incremental growth in six-year graduation rates across all public sectors. First to the Top Update Ms. Kathryn Meyer, Higher Education Program Analyst, was recognized to provide an update on the current status of the STEM teacher professional development project within the Race to the Top grant. Ms. Meyer stated this project focuses on providing professional development for current teachers in alignment with the state’s policies to address science and technology gaps in the workforce through improving educational achievement. She noted that as part of the effort to expand STEM educational opportunities, THEC released two rounds of funding focusing on professional development for K-12 STEM

Page 10 of 10
teachers to promote innovative practices in K-12 STEM subjects. Ms. Meyer also noted that a total of $5.2 million has been directed towards STEM Professional Development programs from THEC’s Race to the Top funds. Office of P-16 Initiatives Update Mr. Troy Grant, Director, College Access Initiatives, was recognized to provide a status report on the GEAR UP program. Mr. Grant briefly reviewed the GEAR UP annual report and highlighted year one implementation goals and progress, noting the kickoff meeting for the collaborative project directors and site coordinators held in December. He briefed the Commission on statistics from year one, such as students served, family and student activities, and services to educators. In closing, he noted the upcoming due date for year two work plans was May 10, and commented on the 2013 Youth Summit being held June 10 and 11 at Trevecca University and college application week, planned for September 30 to October 4. Fall Commission Meeting Dr. Rhoda advised the Commission the next meeting will be held on Thursday, November 14, 2013, in the THEC board room. There being no further business, the meeting was adjourned at 2:30 p.m. Approved: _____________________________ Cato Johnson Chair

DATE: November 14, 2013 SUBJECT: New Academic Program, Tennessee State University, Professional
Science Masters (concentration in Applied Geospatial Sciences) ACTION RECOMMENDED: Approval BACKGROUND INFORMATION: The proposed Professional Science Masters (PSM) program with a concentration in Applied Geospatial Sciences (AGS) will combine scientific and technical knowledge in AGS with business workplace skills highly valued by employers. Tennessee State University’s groundwork for the proposed program was first established in 2005 by creating a graduate certificate program in Applied Geospatial Information Systems. The geospatial sciences, specifically geospatial information systems (GIS) and global positioning systems (GPS), and remote sensing are being applied to almost all areas of study and application in both the public and private sectors. The PSM is a unique professional degree grounded in natural science, technology, engineering, mathematics and computational sciences and is designed to prepare students for direct entry into a variety of career options in industry, business or government. It is a distinctive advanced degree for those intending to pursue a career in the practice of science. Since 2006, the Council of Graduate Schools endorsed the PSM program model and currently 127 institutions have developed these interdisciplinary graduate programs that are characterized by science and mathematics with skills-based courses in management and leadership with an internship component. The proposed PSM program with a concentration in Applied Geospatial Sciences meets all those criteria and will seek PSM recognition. PROPOSED IMPLEMENTATION DATE: Spring 2014
1.1.20A MISSION: The proposed program supports Tennessee State University’s mission to provide programming in the agricultural sciences and STEM disciplines. The PSM program will also contribute to the University’s mission by producing graduates who will have advanced training in the cutting edge interfaces of science and management. The PSM program is in alignment with the goals outlined in the THEC 2010-15 Public Agenda for Higher Education, specifically the focus on strengthening Tennessee’s Knowledge Economy and closing the gaps in the supply of graduates in high demand fields that require post-secondary credentials, particularly in the STEM fields. 1.1.20B CURRICULUM: The degree program will require completion of 36 semester credit hours, including a 15-hour major field core and 21 hours in the concentration. The curriculum is designed based on the model prescribed by the Council of Graduate Schools in order to be recognized as a “Professional Science Master’s” program. Curriculum requirements mandate that the majority of course content be derived from STEM disciplines and the inclusion
Agenda Item: I. A. T E N N E S S E E
H I G H E R
E D U C A T I O N
C O M M I S S I O N

2
of a capstone project supervised collaboratively by faculty and employers. Courses will be delivered exclusively online with the exception of the capstone project. 1.1.20C ACADEMIC STANDARDS: Program admission requires a bachelor’s degree; a 2.75 overall undergraduate GPA; satisfactory scores on the Graduate Record Examination (GRE); two letters of recommendations; and a personal statement stating the applicant’s career goals and academic preparation. Students must meet progression and graduation standards as published annually in the TSU catalog. Projected Program Enrollment and Productivity Students will have the option to attend the program on either a part-time or full-time basis.
Year Full-Time Enrollment
Part-Time Enrollment
Total Headcount Graduates
2014 6 3 9 -- 2015 13 6 19 3 2016 17 10 27 9 2017 19 11 30 10 2018 21 12 33 12
1.1.20D FACULTY: The PSM program will use an interdisciplinary approach by incorporating existing faculty from three Colleges: Agriculture, Human and Natural Sciences; Public Service and Urban Affairs; and Business. All faculty involved have their terminal degree in their respective fields. 1.1.20E LIBRARY RESOURCES: Library resources are adequate for program implementation. 1.1.20F ADMINISTRATION/ORGANIZATION: This program will be offered through the Department of Agricultural and Environmental Sciences located within the College of Agriculture, Human and Natural Sciences. A departmental faculty member will serve as the program director for the proposed Professional Science Master’s program. 1.1.20G SUPPORT RESOURCES: Students will have access to a wide range of support resources, including advising and mentoring support from the program director and other faculty members. 1.1.20H FACILITIES AND EQUIPMENT: Facilities and instructional equipment are adequate to support the program. Additionally, TSU has developed a delivery system for distance education that provides sufficient technical resources and support for faculty and students. 1.1.20I NEED AND DEMAND: The proposed PSM program with a concentration in Applied Geospatial Sciences (AGS) responds to the demands for continued training,

3
professional development and credentialing opportunities within the AGS field. With a successful Graduate Certificate Program in this field, students are asking for a Master’s degree program to build upon this existing degree credential. The labor market also validates the demand for this proposed PSM program. The U.S. Department of Labor Employment and Training Administration anticipates that an additional 150,000 positions requiring geospatial skills will be created by 2020. Furthermore, according to the recently published Future U.S. Workforce for Geospatial Intelligence it was indicated that employers are looking for individuals with a mix of both scientific and practical skills. The PSM program model will incorporate the discipline with applied skills in communication and management. 1.1.20J NO UNNECESSARY DUPLICATION: Currently, there are no Professional Science Master’s programs in Tennessee with a concentration in Applied Geospatial Sciences (AGS). This proposed program aligns with the institution’s mission and other program offerings such as the undergraduate program in Agricultural Sciences (AGS concentration) and the graduate certificate program in Applied Geospatial Information Systems. TSU’s proposed PSM program will provide unique opportunities to prospective students using online course delivery and a required on-ground internship. 1.1.2OK COOPERATING INSTITUTIONS: N/A 1.120L DIVERSITY AND ACCESS: Tennessee State University is committed to an inclusive and diverse campus that values the uniqueness of its student body and employees. Diversity is an objective in recruiting, mentoring, and graduating students. 1.1.20M ASSESSMENT/EVALUATION AND ACCREDITATION: There are no accrediting agencies for this specific program; however, the program is structured based on the PSM guidelines established by the Council of Graduates Schools (CGS). As of January 2012, CGS has selected the Keck Graduate Institute to administer the PSM affiliation process. The College of Agriculture, Human and Natural Sciences plans to seek recognition of the PSM program through the Keck Graduate Institute. A Professional Science Master’s recognition provides assurance that the program conforms to nationally accepted criteria. Program effectiveness will be gauged by annual data collection of enrollment, degree completion, and alumni and employer surveys. Additionally, the program faculty committee will review program and student learning outcomes and determine if any revisions to the program is warranted. Program revisions will be shared with the Advisory Board for feedback. 1.1.200 EXTERNAL JUDGMENT: External review of the proposed program was conducted during an institution site visit on April 29-30, 2013. Dr. Lindi Quackenbush, Associate Professor of Environmental Resources Engineering at State University of New York served as the external reviewer. She stated that the proposed program had several strengths that included supportive university administration, qualified faculty to deliver both the core and concentration areas; strong information technology network; strong on-line support services for students; and prior experience

4
with offering the graduate certificate program in Applied Geospatial Information Systems. Dr. Quackenbush stated that “there is value in creating the proposed Professional Science Master’s degree in Applied Geospatial Sciences at Tennessee State University. This field is expected to continue to expand and the requirement for professionals with technical expertise in the geospatial field combined with business training addresses a clear marketplace need.” 1.1.20P COST/BENEFIT: The proposed PSM program will be funded through campus reallocations and additional tuition revenues generated by the program. 1.1.30 POST APPROVAL MONITORING: An annual performance review of the proposed program will be conducted for the first five years following program approval. The review will be based on benchmarks established in the approved proposal. At the end of this period, the campus, governing board, and Commission staff will perform a summative evaluation. The benchmarks include, but are not limited to, enrollment and graduation, program cost; progress toward accreditation and other metrics set by the institution and agreed upon by governing board and Commission staff. If benchmarks are not met during the monitoring period, the Commission may recommend that the governing board terminate the program. If additional time is needed and requested by the governing board, the Commission may choose to extend the monitoring period.

1
Agenda Item: I.B.1. DATE: November 14, 2013 SUBJECT: Temporary Authorization of New Institutions under the
Postsecondary Authorization Act ACTION RECOMMENDED: Temporary Authorization BACKGROUND INFORMATION: The Commission, under the Postsecondary Authorization Act, has the “power and duty” to act upon applications for authorization to operate an educational institution in the state. For the institutions listed below, applications have been reviewed, site visits have been performed, and staff has determined that all necessary documentation and bonds have been secured. The Committee on Postsecondary Educational Institutions met on October 24, 2013 and endorsed staff recommendations for Temporary Authorization of these institutions. A. America Training Institute Memphis, TN 60 North Third, Memphis, Tennessee 38103 Corporate Structure: C-Corporation Accreditation: None Title IV Funding: No America Training Institute is seeking approval for three new programs. The programs will be offered in a residential format. Instruction will be provided by the faculty from their authorized site in Memphis, Tennessee. 1. Program: Certified Nurse Assistant Credential Awarded: Certificate of Completion Length of Program: 105 Contact Hours 1 Month License/Certification Required for Employment: Certified Nurse Aide Licensing Board/Agency: Department of Health/Division of Healthcare Facilities 2. Program: Heating, Ventilation, Air
Conditioning/Refrigeration Credential Awarded: Certificate of Completion Length of Program: 1080 Contact Hours 9 Months 3. Program: Ministry Training Credential Awarded: Certificate of Completion Length of Program: 120 Contact Hours 7 Months
T E N N E S S E E
H I G H E R
E D U C A T I O N
C O M M I S S I O N

2
B. Concorde Career College - Southaven Campus Southaven, MS 7900 Airways, Suite 103, Southaven, Mississippi
38671
Corporate Structure: C-Corporation Accreditation: Council on Occupational Education (COE) Title IV Funding: Yes Concorde Career College - Southaven Campus is seeking approval for six new programs. The programs will be offered in a residential format. The institution is recruitment only; instruction will be provided by the faculty from their authorized site in Southaven, Mississippi. 1. Program: Dental Assisting Credential Awarded: Associate of Applied Science Length of Program: 64 Semester Credit Hours 18 Months License/Certification Required for Employment: Certified/Registered Dental Assistant Licensing Board/Agency: Board of Dentistry 2. Program: Medical Assistant Credential Awarded: Associate of Applied Science Length of Program: 62 Semester Credit Hours 17 Months 3. Program: Medical Office Professional Credential Awarded: Associate of Applied Science Length of Program: 62 Semester Credit Hours 18 Months 4. Program: Dental Assisting Credential Awarded: Diploma Length of Program: 31 Semester Credit Hours 8 Months License/Certification Required for Employment: Certified/Registered Dental Assistant Licensing Board/Agency: Board of Dentistry 5. Program: Medical Assistant Credential Awarded: Diploma Length of Program: 29 Semester Credit Hours 8 Months 6. Program: Medical Office Professional Credential Awarded: Diploma

3
Length of Program: 29 Semester Credit Hours 8 Months C. Embry-Riddle Aeronautical University - Worldwide
Online Campus Daytona Beach, FL
600 South Clyde Morris Blvd., Daytona Beach, Florida 32114
Corporate Structure: Not-for-Profit Corporation Accreditation: Southern Association of Colleges and Schools Commission
on Colleges (SACSCOC) Title IV Funding: Yes The institution will provide on-line instruction for the authorized Memphis location. D. Franklin Institute of Wellness Franklin, TN 1881 General George Patton Dr., Suite 104, Franklin,
Tennessee 37067
Corporate Structure: Limited Liability Company (LLC) Accreditation: None Title IV Funding: No Franklin Institute of Wellness is seeking approval for one new program. The program will be offered in a distance learning format; all classes are available on-line. 1. Program: Aromatherapy Credential Awarded: Certified Aromatherapist Length of Program: 330 Contact Hours 9 Months Full-Time 18 Months Part-Time E. Liberty Tax Service Murfreesboro, TN 1407A NW Broad Street, Murfreesboro, Tennessee 37129 Corporate Structure: C-Corporation Accreditation: None Title IV Funding: No Liberty Tax Service is seeking approval for two new programs. The programs will be offered in a residential format. Instruction will be provided by the faculty from their authorized site in Murfreesboro, Tennessee. 1. Program: Basic Income Tax Credential Awarded: Certificate of Completion Length of Program: 60 Contact Hours 2.5 Months 2. Program: Rapid Class

4
Credential Awarded: Certificate of Completion Length of Program: 30 Contact Hours 1 Week F. Spartan College of Aeronautics and Technology Tulsa, OK 8820 East Pine Street, Tulsa, Oklahoma 74115 Corporate Structure: Limited Liability Company (LLC) Accreditation: Accrediting Commission of Career Schools and Colleges
(ACCSC) Title IV Funding: Yes Change of Ownership: Spartan College of Aeronautics and Technology was purchased by Spartan Education, LLC on December 31, 2012. The institution is a Limited Liability Company and has been authorized by THEC since January 1, 1977. The institution will offer seven programs that are already approved by THEC. The programs will be offered in a residential format. The institution is recruitment only; instruction will be provided by faculty from their authorized site in Tulsa, Oklahoma. 1. Program: Aviation Maintenance Technology (Revised) Credential Awarded: Associate of Applied Science Length of Program: 122 Semester Credit Hours 23 Months 2. Program: Aviation-Professional Pilot (Revised) Credential Awarded: Associate of Applied Science Length of Program: 91 Semester Credit Hours 30 Months 3. Program: Avionics Maintenance Technology (Revised) Credential Awarded: Associate of Applied Science Length of Program: 100 Semester Credit Hours 18 Months 4. Program: Quality Control (Revised) Credential Awarded: Associate of Applied Science Length of Program: 117 Semester Credit Hours 21 Months 5. Program: Aviation Maintenance Technology (Revised) Credential Awarded: Diploma Length of Program: 96 Semester Credit Hours 18 Months 6. Program: Avionics Maintenance Technology (Revised) Credential Awarded: Diploma Length of Program: 80 Semester Credit Hours 15 Months

6
7. Program: Nondestructive Testing (Revised) Credential Awarded: Diploma Length of Program: 66 Semester Credit Hours 12 Months Spartan College of Aeronautics and Technology is seeking approval for two new programs. The programs will be offered in a residential format. The institution is recruitment only; instruction will be provided by faculty from their authorized site in Tulsa, Oklahoma. 8. Program: Aviation Flight Credential Awarded: Associate of Applied Science Length of Program: 87 Semester Credit Hours 17 Months 9. Program: Aviation Flight Credential Awarded: Diploma Length of Program: 62 Semester Credit Hours 12 Months G. The Jubilee School Nashville, TN 141 Belle Forest Circle, Nashville, Tennessee 37221 Corporate Structure: Not-for-Profit Corporation Accreditation: Association for Biblical Higher Education, Commission on
Accreditation (ABHE) Title IV Funding: No The Jubilee School is seeking approval for three new programs. The programs will be offered in a residential format. Instruction will be provided by the faculty from their authorized site in Nashville, Tennessee. 1. Program: Worship Leader Credential Awarded: Graduate Certificate Length of Program: 24 Quarter Credit Hours 12 Months 2. Program: Breathecast Internship Credential Awarded: Certificate Length of Program: 120 Contact Hours 2.5 Months 3. Program: Music Theory Credential Awarded: Certificate Length of Program: 24 Quarter Credit Hours 12 Months

1
Agenda Item: I.B.2. DATE: November 14, 2013 SUBJECT: Approval of New Programs under the Postsecondary Authorization
Act ACTION RECOMMENDED: Approval BACKGROUND INFORMATION: The Commission, under the Postsecondary Authorization Act, has the “power and duty” to act upon applications for authorization of educational programs in the state. Applications have been reviewed and staff has determined that all necessary documentation for the institutions submitting new program applications is in accordance with the Act and postsecondary rules. The Committee on Postsecondary Educational Institutions, which is a review and advisory committee to the Commission, met on October 24, 2013 and affirmed staff recommendations for approval. A. Academy of Make-Up Arts, LLC Nashville, TN 1321 Murfreesboro Road, Suite 731, Nashville,
Tennessee 37217
Corporate Structure: Limited Liability Company (LLC) Authorization Date: November 10, 2011 Accreditation: None Title IV Funding: No Highest Credential Offered: Certificate Academy of Make-Up Arts, LLC is seeking approval for one new program. The program will be offered in a residential format. Instruction will be provided by the faculty from their authorized site in Nashville, Tennessee. 1. Program: Fashion Makeup Program Credential Awarded: Certificate Length of Program: 192 Contact Hours 6 Weeks B. Anthem Career College Memphis, TN 5865 Shelby Oaks Circle, Suite 100, Memphis, Tennessee
38134
Corporate Structure: C-Corporation Authorization Date: July 17, 2003 Accreditation: Accrediting Council for Independent Colleges
and Schools (ACICS) Title IV Funding: Yes Highest Credential Offered: Associate Degree Anthem Career College - Memphis is seeking approval for sixteen new programs.
T E N N E S S E E
H I G H E R
E D U C A T I O N
C O M M I S S I O N

2
The programs will be offered in a blended format. Instruction will be provided by the faculty from their authorized site in Memphis, Tennessee, as well as on-line. 1. Program: Business Administration Credential Awarded: Associate of Applied Science Length of Program: 324 Quarter Credit Hours 21 Months 2. Program: Business Administration/Accounting Credential Awarded: Associate of Applied Science Length of Program: 90 Quarter Credit Hours 21 Months 3. Program: Business Administration/Criminal Justice
Administration Credential Awarded: Associate of Applied Science Length of Program: 90 Quarter Credit Hours 21 Months 4. Program: Business Administration/Healthcare Management Credential Awarded: Associate of Applied Science Length of Program: 90 Quarter Credit Hours 21 Months 5. Program: Business Administration/Human Resource
Management Credential Awarded: Associate of Applied Science Length of Program: 90 Quarter Credit Hours 21 Months 6. Program: Business Administration/Paralegal Credential Awarded: Associate of Applied Science Length of Program: 90 Quarter Credit Hours 21 Months 7. Program: Health Services Administration Credential Awarded: Associate of Applied Science Length of Program: 90 Quarter Credit Hours 21 Months 8. Program: Information Technology Credential Awarded: Associate of Applied Science Length of Program: 90 Quarter Credit Hours 22 Months 9. Program: Information Technology/Computer Science Credential Awarded: Associate of Applied Science Length of Program: 90 Quarter Credit Hours 22 Months

3
10. Program: Information Technology/Computer Security and
Network Engineer Credential Awarded: Associate of Applied Science Length of Program: 90 Quarter Credit Hours 22 Months 11. Program: Information Technology/Healthcare Information
Technology Management Credential Awarded: Associate of Applied Science Length of Program: 90 Quarter Credit Hours 22 Months 12. Program: Information Technology/Healthcare Management Credential Awarded: Associate of Applied Science Length of Program: 90 Quarter Credit Hours 21 Months 13. Program: Information Technology/IT Management Credential Awarded: Associate of Applied Science Length of Program: 90 Quarter Credit Hours 22 Months 14. Program: Computer Network Technician Credential Awarded: Diploma Length of Program: 46 Quarter Credit Hours 11 Months 15. Program: Medical Assistant Technician Credential Awarded: Diploma Length of Program: 43 Quarter Credit Hours 10.25 Months 16. Program: Medical Front Office and Billing Credential Awarded: Diploma Length of Program: 43 Quarter Credit Hours 10.2 Months C. Anthem Career College Nashville, TN 560 Royal Pkwy, Nashville, Tennessee 37214 Corporate Structure: C-Corporation Authorization Date: November 20, 1998 Accreditation: Accrediting Council for Independent Colleges and
Schools (ACICS) Title IV Funding: Yes Highest Credential Offered: Associate Degree

4
Anthem Career College - Nashville is seeking approval for sixteen new programs. The programs will be offered in a blended format. Instruction will be provided by the faculty from their authorized site in Nashville, Tennessee, as well as on-line.
1. Program: Business Administration Credential Awarded: Associate of Applied Science Length of Program: 90 Quarter Credit Hours 21 Months 2. Program: Business Administration/Accounting Credential Awarded: Associate of Applied Science Length of Program: 90 Quarter Credit Hours 21 Months 3. Program: Business Administration/Criminal Justice
Administration Credential Awarded: Associate of Applied Science Length of Program: 90 Quarter Credit Hours 21 Months 4. Program: Business Administration/Healthcare Management Credential Awarded: Associate of Applied Science Length of Program: 90 Quarter Credit Hours 21 Months 5. Program: Business Administration/Human Resource
Management Credential Awarded: Associate of Applied Science Length of Program: 90 Quarter Credit Hours 21 Months 6. Program: Business Administration/Paralegal Credential Awarded: Associate of Applied Science Length of Program: 90 Quarter Credit Hours 21 Months 7. Program: Health Services Administration Credential Awarded: Associate of Applied Science Length of Program: 90 Quarter Credit Hours 21 Months 8. Program: Information Technology Credential Awarded: Associate of Applied Science Length of Program: 90 Quarter Credit Hours 22 Months

5
9. Program: Information Technology/Computer Science Credential Awarded: Associate of Applied Science Length of Program: 90 Quarter Credit Hours 22 Months 10. Program: Information Technology/Computer Security and
Network Engineer Credential Awarded: Associate of Applied Science Length of Program: 90 Quarter Credit Hours 22 Months 11. Program: Information Technology/Healthcare Information
Technology Management Credential Awarded: Associate of Applied Science Length of Program: 90 Quarter Credit Hours 22 Months 12. Program: Information Technology/Healthcare Management Credential Awarded: Associate of Applied Science Length of Program: 90 Quarter Credit Hours 21 Months 13. Program: Information Technology/IT Management Credential Awarded: Associate of Applied Science Length of Program: 90 Quarter Credit Hours 22 Months 14. Program: Computer Network Technician Credential Awarded: Diploma Length of Program: 46 Quarter Credit Hours 11 Months 15. Program: Medical Assistant Technician Credential Awarded: Diploma Length of Program: 43 Quarter Credit Hours 10.25 Months 16. Program: Medical Front Office and Billing Credential Awarded: Diploma Length of Program: 43 Quarter Credit Hours 10.2 Months

6
D. Argosy University Nashville, TN 100 Centerview Drive, Suite 225, Nashville, Tennessee
37214
Corporate Structure: C-Corporation Authorization Date: January 28, 1999 Accreditation: Western Association of Schools and Colleges (WASC) Title IV Funding: Yes Highest Credential Offered: Doctorate Degree Argosy University is seeking approval to revise one previously approved program and to offer eight new programs. The programs will be offered in a blended format. Instruction will be provided by the faculty from their authorized site in Nashville, Tennessee, as well as on-line. 1. Program: Accounting Credential Awarded: Doctor of Business Administration Length of Program: 60 Semester Credit Hours 36 Months Full-Time 72 Months Part-Time 2. Program: Customized Professional Credential Awarded: Doctor of Business Administration Length of Program: 60 Semester Credit Hours 36 Months Full-Time 72 Months Part-Time 3. Program: International Business Credential Awarded: Doctor of Business Administration Length of Program: 60 Semester Credit Hours 36 Months Full-Time 72 Months Part-Time 4. Program: Management (Revised) Credential Awarded: Doctor of Business Administration Length of Program: 60 Semester Credit Hours 36 Months Full-Time 72 Months Part-Time 5. Program: Marketing Credential Awarded: Doctor of Business Administration Length of Program: 60 Semester Credit Hours 36 Months Full-Time 72 Months Part-Time 6. Program: Forensic Psychology/Assessment & Treatment Credential Awarded: Master of Arts Length of Program: 36 Semester Credit Hours 14 Months

7
7. Program: Forensic Psychology/General Credential Awarded: Master of Arts Length of Program: 36 Semester Credit Hours 14 Months 8. Program: Forensic Psychology/Homeland Security Credential Awarded: Master of Arts Length of Program: 36 Semester Credit Hours 14 Months 9. Program: Forensic Psychology/Law Enforcement Credential Awarded: Master of Arts Length of Program: 36 Semester Credit Hours 14 Months E. Argosy University Phoenix, AZ 2233 West Dunlap Avenue Suite 150, Phoenix, Arizona
85021
Corporate Structure: C-Corporation Authorization Date: April 26, 2007 Accreditation: Western Association of Schools and Colleges (WASC) Title IV Funding: Yes Highest Credential Offered: Doctorate Degree Argosy University is seeking approval for ten new programs. The programs will be offered in a distance learning format. This institution is recruitment only and all classes are available on-line. 1. Program: Accounting Credential Awarded: Doctor of Business Administration Length of Program: 60 Semester Credit Hours 36 Months Full-Time 72 Months Part-Time 2. Program: Customized Professional Credential Awarded: Doctor of Business Administration Length of Program: 60 Semester Credit Hours 36 Months Full-Time 72 Months Part-Time 3. Program: International Business Credential Awarded: Doctor of Business Administration Length of Program: 60 Semester Credit Hours 36 Months Full-Time 72 Months Part-Time

8
4. Program: Management Credential Awarded: Doctor of Business Administration Length of Program: 60 Semester Credit Hours 36 Months Full-Time 72 Months Part-Time 5. Program: Marketing Credential Awarded: Doctor of Business Administration Length of Program: 60 Semester Credit Hours 36 Months Full-Time 72 Months Part-Time 6. Program: Forensic Psychology/Assessment & Treatment Credential Awarded: Master of Arts Length of Program: 36 Semester Credit Hours 14 Months 7. Program: Forensic Psychology/General Credential Awarded: Master of Arts Length of Program: 36 Semester Credit Hours 14 Months 8. Program: Forensic Psychology/Homeland Security Credential Awarded: Master of Arts Length of Program: 36 Semester Credit Hours 14 Months 9. Program: Forensic Psychology/Law Enforcement Credential Awarded: Master of Arts Length of Program: 36 Semester Credit Hours 14 Months 10. Program: Adult Education and Training Credential Awarded: Master of Arts in Education Length of Program: 36 Semester Credit Hours 24 Months F. Cambridge College Memphis, TN 8000 Centerview Parkway Suite 400, Memphis, Tennessee
38018
Corporate Structure: Not-for-Profit Corporation Authorization Date: July 26, 2007 Accreditation: New England Association of Schools and Colleges,
Commission on Institutions of Higher Education (NEASC)
Title IV Funding: Yes

9
Highest Credential Offered: Master Degree Cambridge College is seeking approval to revise five previously approved programs and to offer one new program. The programs will be offered in a residential format. Instruction will be provided by the faculty from their authorized site in Memphis, Tennessee. 1. Program: Management Studies/Health Care Credential Awarded: Bachelor of Arts Length of Program: 120 Credit Hours 48 Months Full-Time 72 Months Part-Time 2. Program: Multidisciplinary Studies/Early Education and
Care (Revised) Credential Awarded: Bachelor of Arts Length of Program: 120 Semester Credit Hours 48 Months Full-Time 72 Months Part-Time 3. Program: Multidisciplinary Studies/General Studies
(Revised) Credential Awarded: Bachelor of Arts Length of Program: 120 Semester Credit Hours 48 Months Full-Time 72 Months Part-Time 4. Program: Human Services/Addiction Studies (Revised) Credential Awarded: Bachelor of Science Length of Program: 120 Semester Credit Hours 48 Months Full-Time 72 Months Part-Time 5. Program: Human Services/Family Studies (Revised) Credential Awarded: Bachelor of Science Length of Program: 120 Semester Credit Hours 48 Months Full-Time 72 Months Part-Time 6. Program: Management Studies/General Management
(Revised) Credential Awarded: Bachelor of Science Length of Program: 120 Semester Credit Hours 48 Months Full-Time 72 Months Part-Time

10
G. Concorde Career College Memphis, TN 5100 Poplar Avenue Suite 132, Memphis, Tennessee 38137 Corporate Structure: C-Corporation Authorization Date: January 1, 1985 Accreditation: Council on Occupational Education (COE) Title IV Funding: Yes Highest Credential Offered: Associate Degree Concorde Career College is seeking approval for one new program. The program will be offered in a residential format. Instruction will be provided by the faculty from their authorized site in Memphis, Tennessee. 1. Program: Medical Laboratory Technician (MLT) Credential Awarded: Associate of Applied Science Length of Program: 84.5 Semester Credit Hours 20 Months License/Certification Required for Employment: Medical Laboratory Technician Licensing Board/Agency: Tennessee Medical Laboratory Board The National Accrediting Agency for Clinical Laboratory Sciences (NAACLS) requires a developing program to submit a letter requesting the initial application which was completed on February 15, 2012. The initial application and fee was submitted September 2012 and approved by NAACLS on November 19, 2012. After the first cohort starts, the accreditation process consists of a self-study with a two day site visit during the first half of the program. The NAACLS board of directors will meet prior to graduation of the first cohort to grant full accreditation of the program. If approval is not granted, the students will be taught out at another institution with a Medical Laboratory Technician Program or Concorde Career College will refund any monies paid by the students. H. National College of Business & Technology Memphis, TN 2576 Thousand Oaks Cove, Memphis, Tennessee 38115 Corporate Structure: S-Corporation Authorization Date: November 17, 2005 Accreditation: Accrediting Council for Independent Colleges and
Schools (ACICS) Title IV Funding: Yes Highest Credential Offered: Associate Degree National College of Business & Technology is seeking approval for one new program. The program will be offered in a residential format. Instruction will be provided by the faculty from their authorized site in Memphis, Tennessee.

11
1. Program: Tourism and Hospitality Management Credential Awarded: Associate of Applied Science Length of Program: 96 Quarter Credit Hours 20 Months Full-Time 44 Months Part-Time I. National College of Business & Technology Nashville, TN 1638 Bell Rd, Nashville, Tennessee 37211 Corporate Structure: S-Corporation Authorization Date: July 16, 1991 Accreditation: Accrediting Council for Independent Colleges and
Schools (ACICS) Title IV Funding: Yes Highest Credential Offered: Bachelor Degree National College of Business & Technology is seeking approval for one new program. The program will be offered in a residential format. Instruction will be provided by faculty from their authorized site in Nashville, Tennessee. 1. Program: Tourism and Hospitality Management Credential Awarded: Associate of Applied Science Length of Program: 96 Quarter Credit Hours 20 Months Full-Time 44 Months Part-Time J. Nossi College of Art Nashville, TN 590 Cheron Road, Nashville, Tennessee 37115 Corporate Structure: S-Corporation Authorization Date: January 1, 1982 Accreditation: Accrediting Commission of Career Schools and
Colleges (ACCSC) Title IV Funding: Yes Highest Credential Offered: Bachelor Degree Nossi College of Art is seeking approval for one new program. The program will be offered in a residential format. Instruction will be provided by the faculty from their authorized site in Nashville, Tennessee. 1. Program: Videography Credential Awarded: Bachelor of Graphic Arts Length of Program: 135 Semester Credit Hours 44 Months

12
K. Remington College Memphis, TN 2710 Nonconnah Blvd., Memphis, Tennessee 38132 Corporate Structure: Not-for-Profit Corporation Authorization Date: January 1, 1987 Accreditation: Accrediting Commission of Career Schools and
Colleges (ACCSC) Title IV Funding: Yes Highest Credential Offered: Bachelor Degree Remington College is seeking approval for two new programs. The programs will be offered in a residential format. Instruction will be provided by the faculty from their authorized site in Memphis, Tennessee. 1. Program: Medical Assisting Credential Awarded: Diploma Length of Program: 64.5 Quarter Credit Hours 12 Months 2. Program: Pharmacy Technician Credential Awarded: Diploma Length of Program: 64.5 Quarter Credit Hours 13 Months L. Remington College Nashville, TN 441 Donelson Pike Suite 150, Nashville, Tennessee 37214 Corporate Structure: Not-for-Profit Corporation Authorization Date: July 17, 2003 Accreditation: Accrediting Commission of Career Schools and
Colleges (ACCSC) Title IV Funding: Yes Highest Credential Offered: Bachelor Degree Remington College is seeking approval for one new program. The program will be offered in a residential format. Instruction will be provided by the faculty from their authorized site in Nashville, Tennessee. 1. Program: Medical Assisting Credential Awarded: Diploma Length of Program: 64.5 Quarter Credit Hours 12 Months

13
M. South College Knoxville, TN 3904 Lonas Drive, Knoxville, Tennessee 37909 Corporate Structure: S-Corporation Authorization Date: July 27, 2006 Accreditation: Southern Association of Colleges and Schools
Commission on Colleges (SACSCOC) Title IV Funding: Yes Highest Credential Offered: Master Degree South College is seeking approval for two new programs. The Business Administration Program will be offered in a distance learning format; all classes will be available online. The Business Administration/Professional Brewing Science Program will be offered in a blended format. Instruction will be provided by the faculty from their authorized site in Knoxville, Tennessee, as well as on-line. 1. Program: Business Administration Credential Awarded: Master of Business Administration Length of Program: 48 Quarter Credit Hours 12 Months Full-Time 18 Months Part-Time 2. Program: Business Administration/Professional Brewing
Science Credential Awarded: Associate of Science Length of Program: 120 Quarter Credit Hours 24 Months Full-Time 30 Months Part-Time N. South College Knoxville, TN 400 Goody's Lane, Knoxville, Tennessee 37922 Corporate Structure: S-Corporation Authorization Date: January 1, 1980 Accreditation: Southern Association of Colleges and Schools
Commission on Colleges (SACSCOC) Title IV Funding: Yes Highest Credential Offered: Doctorate Degree South College is seeking approval for one new program. The program will be offered in a distance learning format; all classes will be available on-line. 1. Program: Health Science/Health Education Credential Awarded: Doctor of Health Science Length of Program: 90 Quarter Credit Hours 36 Months Full-Time 48 Months Part-Time

14
O. Strayer University - Knoxville Campus Knoxville, TN 10118 Parkside Drive, Suite 200, Knoxville, Tennessee
37922
Corporate Structure: C-Corporation Authorization Date: November 16, 2006 Accreditation: Middle States Association of Colleges and Schools,
Commission on Higher Education (MSACHE) Title IV Funding: Yes Highest Credential Offered: Master Degree Strayer University - Knoxville Campus is seeking approval for one new program. The program will be offered in a blended format. Instruction will be provided by the faculty from their authorized site in Knoxville, Tennessee, as well as on-line. 1. Program: Information Assurance Credential Awarded: Master of Science Length of Program: 54 Quarter Credit Hours 18 Months Full-Time 36 Months Part-Time P. Strayer University - Nashville Campus Nashville, TN 1809 Dabbs Avenue, Nashville, Tennessee 37210 Corporate Structure: C-Corporation Authorization Date: November 14, 2002 Accreditation: Middle States Association of Colleges and Schools,
Commission on Higher Education (MSACHE) Title IV Funding: Yes Highest Credential Offered: Master Degree Strayer University - Nashville Campus is seeking approval for one new program. The program will be offered in a blended format. Instruction will be provided by the faculty from their authorized site in Nashville, Tennessee, as well as on-line. 1. Program: Information Assurance Credential Awarded: Master of Science Length of Program: 54 Quarter Credit Hours 18 Months Full-Time 36 Months Part-Time

15
Q. Strayer University - Online Salt Lake City, UT 5225 Wiley Post Way, Salt Lake City, Utah 84116 Corporate Structure: C-Corporation Authorization Date: November 14, 2002 Accreditation: Middle States Association of Colleges and Schools,
Commission on Higher Education (MSACHE) Title IV Funding: Yes Highest Credential Offered: Master Degree Strayer University is seeking approval for one new program. The program will be offered in a distance learning format. This institution is recruitment only and all classes are available on-line. 1. Program: Information Assurance Credential Awarded: Master of Science Length of Program: 54 Quarter Credit Hours 18 Months Full-Time 36 Months Part-Time R. Strayer University - Shelby Memphis, TN 7275 Appling Farms Parkway, Memphis, Tennessee 38133 Corporate Structure: C-Corporation Authorization Date: January 29, 2004 Accreditation: Middle States Association of Colleges and Schools,
Commission on Higher Education (MSACHE) Title IV Funding: Yes Highest Credential Offered: Master Degree Strayer University - Shelby is seeking approval for one new program. The program will be offered in a blended format. Instruction will be provided by the faculty from their authorized site in Memphis, Tennessee, as well as on-line. 1. Program: Information Assurance Credential Awarded: Master of Science Length of Program: 54 Quarter Credit Hours 18 Months Full-Time 36 Months Part-Time

16
S. Strayer University - Thousand Oaks Campus Memphis, TN 2620 Thousand Oaks Suite 1100, Memphis, Tennessee
38118
Corporate Structure: C-Corporation Authorization Date: November 14, 2002 Accreditation: Middle States Association of Colleges and Schools,
Commission on Higher Education (MSACHE) Title IV Funding: Yes Highest Credential Offered: Master Degree Strayer University - Thousand Oaks Campus is seeking approval for one new program. The program will be offered in a blended format. Instruction will be provided by the faculty from their authorized site in Memphis, Tennessee, as well as on-line. 1. Program: Information Assurance Credential Awarded: Master of Science Length of Program: 54 Quarter Credit Hours 18 Months Full-Time 36 Months Part-Time T. The Art Institute of Tennessee Nashville, TN 100 Centerview Drive, Suite 250, Nashville, Tennessee
37214
Corporate Structure: C-Corporation Authorization Date: July 27, 2006 Accreditation: Southern Association of Colleges and Schools
Commission on Colleges (SACSCOC) Title IV Funding: Yes Highest Credential Offered: Bachelor Degree The Art Institute of Tennessee is seeking approval for one new program. The program will be offered in a residential format. Instruction will be provided by the faculty from their authorized site in Nashville, Tennessee. 1. Program: Visual Effects & Motion Graphics Credential Awarded: Bachelor of Fine Arts Length of Program: 180 Quarter Credit Hours 33 Months Full-Time 49.5 Months Part-Time

17
U. University of Phoenix Chattanooga, TN 1208 Pointe Centre Drive, Chattanooga, Tennessee 37421 Corporate Structure: C-Corporation Authorization Date: July 27, 2006 Accreditation: The Higher Learning Commission (HLC) Title IV Funding: Yes Highest Credential Offered: Master Degree University of Phoenix is seeking approval for sixteen new programs. The programs will be offered in a residential format. Instruction will be provided by the faculty from their authorized site in Chattanooga, Tennessee. 1. Program: Business Administration/Finance Credential Awarded: Master of Business Administration Length of Program: 48 Semester Credit Hours 24 Months 2. Program: Health Administration/Sustainability
Management Credential Awarded: Master of Health Administration Length of Program: 43 Semester Credit Hours 22 Months 3. Program: Mediation Credential Awarded: Graduate Certificate Length of Program: 12 Semester Credit Hours 6 Months 4. Program: Information Technology/Mobile Development Credential Awarded: Bachelor of Science Length of Program: 120 Semester Credit Hours 50 Months 5. Program: Information Technology/Desktop Support Credential Awarded: Associate of Arts Length of Program: 60 Semester Credit Hours 25 Months 6. Program: Information Technology/General Credential Awarded: Associate of Arts Length of Program: 60 Semester Credit Hours 25 Months 7. Program: Information Technology/Health Care Credential Awarded: Associate of Arts Length of Program: 60 Semester Credit Hours 25 Months

19
8. Program: Information Technology/Network Support Credential Awarded: Associate of Arts Length of Program: 60 Semester Credit Hours 25 Months 9. Program: Information Technology/Web Development Credential Awarded: Associate of Arts Length of Program: 60 Semester Credit Hours 25 Months 10. Program: Addictions Credential Awarded: Certificate Length of Program: 24 Semester Credit Hours 10 Months 11. Program: Family and Child Services Credential Awarded: Certificate Length of Program: 24 Semester Credit Hours 10 Months 12. Program: Gerontology Credential Awarded: Certificate Length of Program: 24 Semester Credit Hours 10 Months 13. Program: Human Services Management Credential Awarded: Certificate Length of Program: 24 Semester Credit Hours 10 Months 14. Program: Emergency Management Credential Awarded: Emergency Management Certificate Length of Program: 18 Semester Credit Hours 8 Months 15. Program: Health Management Credential Awarded: Health Management Certificate Length of Program: 18 Semester Credit Hours 8 Months 16. Program: Long Term Care Credential Awarded: Long Term Care Certificate Length of Program: 18 Semester Credit Hours 8 Months

20
V. University of Phoenix Cordova, TN 65 Germantown Court, Suite 100, Cordova, Tennessee
38018
Corporate Structure: C-Corporation Authorization Date: July 17, 2003 Accreditation: The Higher Learning Commission (HLC) Title IV Funding: Yes Highest Credential Offered: Master Degree University of Phoenix is seeking approval for sixteen new programs. The programs will be offered in a residential format. Instruction will be provided by the faculty from their authorized site in Cordova, Tennessee. 1. Program: Business Administration/Finance Credential Awarded: Master of Business Administration Length of Program: 48 Semester Credit Hours 24 Months 2. Program: Health Administration/Sustainability
Management Credential Awarded: Master of Health Administration Length of Program: 43 Semester Credit Hours 22 Months 3. Program: Mediation Credential Awarded: Graduate Certificate Length of Program: 12 Semester Credit Hours 6 Months 4. Program: Information Technology/Mobile Development Credential Awarded: Bachelor of Science Length of Program: 120 Semester Credit Hours 50 Months 5. Program: Information Technology/Desktop Support Credential Awarded: Associate of Arts Length of Program: 60 Semester Credit Hours 25 Months 6. Program: Information Technology/General Credential Awarded: Associate of Arts Length of Program: 60 Semester Credit Hours 25 Months 7. Program: Information Technology/Health Care Credential Awarded: Associate of Arts Length of Program: 60 Semester Credit Hours

21
25 Months 8. Program: Information Technology/Network Support Credential Awarded: Associate of Arts Length of Program: 60 Semester Credit Hours 25 Months 9. Program: Information Technology/Web Development Credential Awarded: Associate of Arts Length of Program: 60 Semester Credit Hours 25 Months 10. Program: Addictions Credential Awarded: Certificate Length of Program: 24 Semester Credit Hours 10 Months 11. Program: Family and Child Services Credential Awarded: Certificate Length of Program: 24 Semester Credit Hours 10 Months 12. Program: Gerontology Credential Awarded: Certificate Length of Program: 24 Semester Credit Hours 10 Months 13. Program: Human Services Management Credential Awarded: Certificate Length of Program: 24 Semester Credit Hours 10 Months 14. Program: Emergency Management Credential Awarded: Emergency Management Certificate Length of Program: 18 Semester Credit Hours 8 Months 15. Program: Health Management Credential Awarded: Health Management Certificate Length of Program: 18 Semester Credit Hours 8 Months 16. Program: Long Term Care Credential Awarded: Long Term Care Certificate Length of Program: 18 Semester Credit Hours 8 Months

22
W. University of Phoenix Nashville, TN 616 Marriott Drive, Suite 150, Nashville, Tennessee
37214
Corporate Structure: C-Corporation Authorization Date: January 31, 2002 Accreditation: The Higher Learning Commission (HLC) Title IV Funding: Yes Highest Credential Offered: Doctorate Degree University of Phoenix is seeking approval for sixteen new programs. The programs will be offered in a residential format. Instruction will be provided by the faculty from their authorized site in Nashville, Tennessee. 1. Program: Business Administration/Finance Credential Awarded: Master of Business Administration Length of Program: 48 Semester Credit Hours 24 Months 2. Program: Health Administration/Sustainability
Management Credential Awarded: Master of Health Administration Length of Program: 43 Semester Credit Hours 22 Months 3. Program: Mediation Credential Awarded: Graduate Certificate Length of Program: 12 Semester Credit Hours 6 Months 4. Program: Information Technology/Mobile Development Credential Awarded: Bachelor of Science Length of Program: 120 Semester Credit Hours 50 Months 5. Program: Information Technology/Desktop Support Credential Awarded: Associate of Arts Length of Program: 60 Semester Credit Hours 25 Months 6. Program: Information Technology/General Credential Awarded: Associate of Arts Length of Program: 60 Semester Credit Hours 25 Months 7. Program: Information Technology/Health Care Credential Awarded: Associate of Arts Length of Program: 60 Semester Credit Hours

23
25 Months 8. Program: Information Technology/Network Support Credential Awarded: Associate of Arts Length of Program: 60 Semester Credit Hours 25 Months 9. Program: Information Technology/Web Development Credential Awarded: Associate of Arts Length of Program: 60 Semester Credit Hours 25 Months 10. Program: Addictions Credential Awarded: Certificate Length of Program: 24 Semester Credit Hours 10 Months 11. Program: Family and Child Services Credential Awarded: Certificate Length of Program: 24 Semester Credit Hours 10 Months 12. Program: Gerontology Credential Awarded: Certificate Length of Program: 24 Semester Credit Hours 10 Months 13. Program: Human Services Management Credential Awarded: Certificate Length of Program: 24 Semester Credit Hours 10 Months 14. Program: Emergency Management Credential Awarded: Emergency Management Certificate Length of Program: 18 Semester Credit Hours 8 Months 15. Program: Health Management Credential Awarded: Health Management Certificate Length of Program: 18 Semester Credit Hours 8 Months 16. Program: Long Term Care Credential Awarded: Long Term Care Certificate Length of Program: 18 Semester Credit Hours 8 Months

24
X. University of Phoenix Phoenix, AZ 3157 East Elwood Street, Phoenix, Arizona 85072 Corporate Structure: C-Corporation Authorization Date: November 15, 2001 Accreditation: The Higher Learning Commission (HLC) Title IV Funding: Yes Highest Credential Offered: Doctorate Degree University of Phoenix is seeking approval for twenty-seven new programs. The programs will be offered in a distance learning format. This institution is recruitment only and all classes are available on-line. 1. Program: Business Administration/Finance Credential Awarded: Master of Business Administration Length of Program: 48 Semester Credit Hours 24 Months 2. Program: Health Administration/Sustainability
Management Credential Awarded: Master of Health Administration Length of Program: 43 Semester Credit Hours 22 Months 3. Program: Mediation Credential Awarded: Graduate Certificate Length of Program: 12 Semester Credit Hours 6 Months 4. Program: Business Credential Awarded: Bachelor of Science Length of Program: 120 Semester Credit Hours 50 Months 5. Program: Information Technology/Mobile Development Credential Awarded: Bachelor of Science Length of Program: 120 Semester Credit Hours 50 Months 6. Program: Health Care Administration/Electronic Health
Records Credential Awarded: Associate of Arts Length of Program: 60 Semester Credit Hours 25 Months 7. Program: Health Care Administration/Health and Wellness
Administration Credential Awarded: Associate of Arts Length of Program: 60 Semester Credit Hours 25 Months

25
8. Program: Information Technology/Desktop Support Credential Awarded: Associate of Arts Length of Program: 60 Semester Credit Hours 25 Months 9. Program: Information Technology/General Credential Awarded: Associate of Arts Length of Program: 60 Semester Credit Hours 25 Months 10. Program: Information Technology/Health Care Credential Awarded: Associate of Arts Length of Program: 60 Semester Credit Hours 25 Months 11. Program: Information Technology/Network Support Credential Awarded: Associate of Arts Length of Program: 60 Semester Credit Hours 25 Months 12. Program: Information Technology/Web Administration Credential Awarded: Associate of Arts Length of Program: 60 Semester Credit Hours 25 Months 13. Program: Bookkeeping Credential Awarded: Bookkeeping Certificate Length of Program: 18 Semester Credit Hours 8 Months 14. Program: Addictions Credential Awarded: Certificate Length of Program: 24 Semester Credit Hours 10 Months 15. Program: Business Administration Credential Awarded: Certificate Length of Program: 18 Semester Credit Hours 8 Months 16. Program: Family and Child Services Credential Awarded: Certificate Length of Program: 24 Semester Credit Hours 10 Months 17. Program: Gerontology Credential Awarded: Certificate Length of Program: 24 Semester Credit Hours 10 Months

26
18. Program: Human Services Management Credential Awarded: Certificate Length of Program: 24 Semester Credit Hours 10 Months 19. Program: Marketing Credential Awarded: Certificate Length of Program: 18 Semester Credit Hours 8 Months 20. Program: Operations Management Credential Awarded: Certificate Length of Program: 18 Semester Credit Hours 8 Months 21. Program: Small Business Management and
Entrepreneurship Credential Awarded: Certificate Length of Program: 18 Semester Credit Hours 8 Months 22. Program: Supply Chain Management Credential Awarded: Certificate Length of Program: 18 Semester Credit Hours 8 Months 23. Program: Electronic Health Records Credential Awarded: Electronic Health Records Certificate Length of Program: 18 Semester Credit Hours 8 Months 24. Program: Emergency Management Credential Awarded: Emergency Management Certificate Length of Program: 18 Semester Credit Hours 8 Months 25. Program: Health and Wellness Administration Credential Awarded: Health and Wellness Administration Certificate Length of Program: 18 Semester Credit Hours 8 Months 26. Program: Health Management Credential Awarded: Health Management Certificate Length of Program: 18 Semester Credit Hours 8 Months 27. Program: Long Term Care Credential Awarded: Long Term Care Certificate

27
Length of Program: 18 Semester Credit Hours 8 Months Y. Wyoming Technical Institute Laramie, WY 4373 North 3rd. Street, Laramie, Wyoming 82072 Corporate Structure: C-Corporation Authorization Date: November 14, 2002 Accreditation: Accrediting Commission of Career Schools and
Colleges (ACCSC) Title IV Funding: Yes Highest Credential Offered: Associate Degree Wyoming Technical Institute is seeking approval for three new programs. The programs will be offered in a residential format. The institution is recruitment only; instruction will be provided by the faculty from their authorized site in Laramie, Wyoming. 1. Program: Automotive Technology with Off-Road Power Credential Awarded: Diploma Length of Program: 60 Semester Credit Hours 9 Months 2. Program: Collision/Refinishing Technology with Off-Road
Power Credential Awarded: Diploma Length of Program: 65 Semester Credit Hours 9 Months 3. Program: Diesel Technology with Off-Road Power Credential Awarded: Diploma Length of Program: 60 Semester Credit Hours 9 Months

Agenda Item: I.C.
DATE: November 14, 2013 SUBJECT: 2014-15 Operating State Appropriation Recommendations ACTION RECOMMENDED: Approval BACKGROUND INFORMATION Based on the outcomes-based funding formula, the following recommendations for operating state appropriations are presented in the attachments for consideration. With the full phase-out of the Hold Harmless provision in 2013-14, fiscal year 2014-15 marks the second year in which all state appropriations distributed through the outcomes-based formula are allocated based strictly on performance. Funds are allocated on a pro-rata basis and all campuses are recommended to receive the same percentage of their formula calculation. Also of note is a reminder that since 2012-13, THEC is to make state appropriations recommendations in lump sum fashion for the community college sector as a whole, per a provision of the Complete College Tennessee Act (CCTA). The CCTA transferred responsibility for determining individual community college allocations to the Tennessee Board of Regents (TBR). Outcomes-based formula calculations for the individual community colleges are presented for informational purposes only. RECOMMENDATION SUMMARY Institutions showed continued improvement in many of the outcomes in 2012-13, the most recent year of data that is utilized for the 2014-15 budget cycle. In part, this increase in productivity is a function of the enrollment surge that occurred in the aftermath of the recent economic downturn. Higher enrollments, though not a factor themselves in state appropriations, continue to translate into productivity increases as students subsequently trigger outcomes, such as degree completion. An increase of $29.6 million in state appropriations would be required to fund the growth in the outcomes formula. This growth is largely due to the aggregate increase in outcomes — including the institutional mission weights — across all universities and community colleges. This distribution, along with an equivalent increase in funding for non-formula units and program initiatives totaling $11.6 million, is included
T E N N E S S E E
H I G H E R
E D U C A T I O N
C O M M I S S I O N
in the THEC staff recommendation for 2014-15 operating funds, as detailed in Attachment II. The staff recommendations include other components of note. First is an improvement to the state’s need-based grant, the Tennessee Student Assistance Award (TSAA). In 2013-14, the program will fund approximately 35,000 students with $64.5 million across public, private and proprietary institutions in Tennessee. In September, the TSAC Board recommended that funding increase in 2014-15 by $31.7 million, which would fund 20 percent of the estimated 130,000 students that are eligible for the award, based on financial need, but currently do not receive the grant due to limited funds being exhausted. THEC staff concur with this recommendation and believe that this improvement, coupled with the student fee recommendations presented in Item I.D., represent continued advancement in college affordability for Tennesseans. Second, the Public Agenda for Tennessee Higher Education — also known as the master plan — identifies workforce and economic development as a primary goal. Critical to that effort is the infrastructure necessary to train and educate students, providing the backbone of the Tennessee business and industry workforce. Community Colleges and the Tennessee Colleges of Applied Technology (TCATs) are at the forefront of workforce training and development, where up-to-date equipment is a crucial need. In 2013-14, TBR received $16.5 million in non-recurring funds to update and replace equipment vital to the mission of these campuses. Based upon the recommendation of TBR, THEC staff recommend an additional $16.5 million in non-recurring funds in 2014-15 to complete this equipment replenishment initiative. This funding will continue to help address over 60 existing workforce programs at community colleges by updating equipment and expanding programs into additional areas, while also providing seed money for up to 20 new workforce programs across Tennessee that address current and emerging employer workforce training needs. This funding also allows the TCATs to address 26 specific high demand programs that are offered across the state, providing upgrades or replacement equipment in order to meet specific industry needs of employers. Finally, THEC staff is recommending $5 million in non-recurring funds to continue the work of the Online Innovation Initiative, which in 2013-14 received $3 million to fund several initiatives across higher education. Among other projects, this seed money funded course delivery pilots at four institutions across the UT and TBR systems via Coursera and edX, two of the leading education companies in online education technology, delivery and analytics. Funding was also utilized for the expansion of an innovative remedial education program called SAILS (Seamless Alignment and Integrated Learning Support), developed by Chattanooga State Community College, to other community colleges serving approximately 8,000 students
2

across Tennessee. These and other initiatives funded by the Online Innovation Initiative help identify and scale up policy innovation and activity that is crucial to the educational attainment and workforce development goals of the Public Agenda, as well as Governor Haslam’s Drive to 55 initiative which seeks to have 55 percent of adult Tennesseans with a postsecondary credential by 2025. The grand total recurring and non-recurring recommendation for all higher education operating appropriations for 2014-14 is $1.3 billion. This grand total includes $29.6 million to fund outcome growth, $11.6 million for other institutional operating costs across “non-formula units”, $31.7 million for TSAA funding, $16.5 million to complete the equipment replenishment program and $5 million for the continuation of the Online Innovation Initiative. These recurring and non-recurring recommendations total $94.4 million or an increase of 7.7 percent. The improvement in recurring funds only is $72.9 million or 6 percent. Finally, the Department of Finance & Administration has requested that state agencies prepare the 2014-15 budget with a five percent reduction in state appropriations. Financial aid funding provided by the Tennessee Student Assistance Corporation, primarily through the need-based grant award, is exempted from these reduction scenarios. For higher education this would result in a reduction in state appropriations of $57.3 million. This distribution is detailed in Attachment III.
3

Academic Formula Units 2007-08 2008-09 2009-10 2010-11 2011-12 2012-13 * 2013-14 **TBR UniversitiesAustin Peay $36,196,500 $32,935,800 $27,228,700 $25,570,600 $26,107,600 $28,537,600 $32,995,000East Tennessee 63,070,900 57,792,100 48,353,800 45,582,600 44,000,700 45,772,200 48,685,000 Middle Tennessee 100,775,700 91,965,400 76,102,500 71,318,700 73,423,800 77,193,600 81,024,600 Tennessee State 42,553,700 38,448,300 30,371,100 28,554,800 29,335,100 30,810,900 32,610,800 Tennessee Tech 49,204,400 45,198,900 38,341,600 35,853,000 35,086,300 37,288,600 39,559,500 University of Memphis 123,224,900 113,093,400 97,397,500 91,785,400 85,464,300 87,346,700 89,106,400
Subtotal $415,026,100 $379,433,900 $317,795,200 $298,665,100 $293,417,800 $306,949,600 $323,981,300Community CollegesChattanooga $24,993,200 $23,667,300 $21,297,300 $20,086,100 $19,970,200 $21,902,500 $26,624,800Cleveland 10,830,700 10,271,300 9,408,300 9,062,000 8,421,200 8,672,000 8,997,100 Columbia 14,015,400 13,246,700 12,025,200 11,439,800 11,121,800 11,294,400 12,339,500 Dyersburg 7,581,500 7,190,000 6,506,300 6,168,000 6,484,500 6,867,800 7,238,900 Jackson 13,096,600 12,393,900 11,104,800 10,479,000 10,518,500 10,821,400 11,510,200 Motlow 10,910,000 10,302,500 9,159,600 8,591,400 9,662,900 10,310,000 11,017,200 Nashville 16,285,700 15,375,500 13,429,500 12,677,800 13,794,900 14,516,500 15,983,500 Northeast 13,156,400 12,442,600 11,051,400 10,605,000 11,924,900 12,920,300 13,648,200 Pellissippi 21,961,000 20,741,200 18,242,100 17,199,100 18,692,600 20,819,800 22,913,400 Roane 19,061,900 18,044,100 16,437,400 15,684,300 14,750,900 15,244,700 16,619,800 Southwest 40,042,000 37,845,200 34,396,200 32,436,900 28,648,100 27,953,000 25,739,300 Volunteer 19,159,800 18,134,900 16,269,400 15,389,800 15,281,400 15,614,700 16,075,400 Walters 19,355,100 18,347,900 16,578,900 16,032,000 15,745,100 17,043,300 19,866,900
Subtotal $230,449,300 $218,003,100 $195,906,400 $185,851,200 $185,017,000 $193,980,400 $208,574,200UT UniversitiesUT Chattanooga $46,033,200 $42,102,800 $35,886,300 $33,463,400 $33,294,400 $34,601,800 $36,128,500UT Knoxville 195,397,500 178,669,100 152,036,100 143,699,500 144,150,000 153,343,900 174,335,300 UT Martin 33,231,400 30,386,700 25,683,900 24,047,300 23,636,300 24,609,100 25,243,000
Subtotal $274,662,100 $251,158,600 $213,606,300 $201,210,200 $201,080,700 $212,554,800 $235,706,800
Total Colleges and Universities $920,137,500 $848,595,600 $727,307,900 $685,726,500 $679,515,500 $713,484,800 $768,262,300
Technology Centers $53,607,000 $50,825,800 $47,842,700 $46,263,500 $52,260,300 $53,848,800 $57,400,500
Total Academic Formula Units $973,744,500 $899,421,400 $775,150,600 $731,990,000 $731,775,800 $767,333,600 $825,662,800
*Community College detail was determined by the Tennessee Board of Regents. Beginning in 2012-13, funds were allocated to the Community Colleges as a system.
ATTACHMENT IState Appropriations History
**Community College detail provided by TBR and represents actual allocations.
Note: All years of appropriations are recurring funds only.
4

Specialized Units 2007-08 2008-09 2009-10 2010-11 2011-12 2012-13 2013-14Medical EducationETSU College of Medicine $29,028,900 $27,619,200 $26,297,600 $25,377,900 $25,859,200 $27,321,000 $28,893,900ETSU Family Practice 5,677,800 5,408,600 5,333,500 5,150,800 5,322,000 5,731,700 6,117,800 UT College of Medicine 49,340,900 46,573,700 44,057,000 42,524,700 42,820,200 44,883,300 47,065,400 UT Family Practice 10,161,400 9,654,000 9,487,500 9,187,200 9,313,200 9,870,100 10,458,800 UT Memphis 71,168,300 68,934,900 64,637,400 62,105,000 63,089,600 66,869,800 71,363,200 UT College of Vet Medicine 16,631,600 15,799,600 14,718,500 14,160,600 14,416,600 15,385,200 16,453,000
Subtotal $182,008,900 $173,990,000 $164,531,500 $158,506,200 $160,820,800 $170,061,100 $180,352,100
Research and Public ServiceUT Agriculture Experiment Station $25,094,000 $23,841,500 $23,377,800 $22,812,000 $23,111,900 $24,342,600 $25,438,800UT Agriculture Extension Service 30,095,000 28,694,300 28,143,100 27,416,300 27,825,100 29,431,800 30,836,900 TSU McMinnville Center 531,200 503,100 521,500 527,900 527,300 543,300 560,400 TSU Institute of Ag. and Environmental Research 2,173,000 2,055,700 2,109,800 2,156,200 2,145,000 2,208,900 2,280,500 TSU Cooperative Education 1,927,000 1,823,000 2,371,700 2,918,300 2,918,200 3,010,500 3,110,400 TSU McIntire-Stennis Forestry Research - - 185,400 171,900 170,600 174,100 179,400 UT Space Institute 8,282,000 7,821,000 7,465,900 7,212,500 7,276,600 7,603,400 7,896,700 UT Institute for Public Service 4,980,000 4,806,500 4,705,100 4,312,800 4,341,200 4,541,300 5,232,400 UT County Technical Assistance Service 1,605,300 1,519,600 1,491,700 1,482,500 1,521,800 1,646,200 1,753,200 UT Municipal Technical Advisory Service 2,743,100 2,601,900 2,556,500 2,499,300 2,554,300 2,732,200 2,886,200
Subtotal $77,430,600 $73,666,600 $72,928,500 $71,509,700 $72,392,000 $76,234,300 $80,174,900
Other Specialized UnitsUT University-Wide Administration $4,564,500 $4,399,600 $4,353,700 $4,143,800 $4,209,000 $4,440,900 $4,589,300TN Board of Regents Administration 4,871,700 4,517,100 4,429,300 4,407,400 4,563,400 4,881,800 5,104,200 TN Student Assistance Corporation 49,836,900 48,712,900 48,589,500 48,567,100 48,579,200 55,205,400 61,586,800
Tennessee Student Assistance Awards 47,108,500 46,162,500 46,162,500 46,162,500 46,162,500 52,762,500 57,762,500 Tennessee Students Assistance Corporation 1,537,400 1,359,400 1,236,000 1,213,600 1,225,700 1,251,900 1,353,500
Loan/Scholarships Program 1,191,000 1,191,000 1,191,000 1,191,000 1,191,000 1,191,000 1,220,800 Endowment Scholarships - - - - - - 1,250,000
TN Higher Education Commission 2,381,500 2,207,300 2,186,500 2,160,300 2,224,500 2,292,100 2,479,200 TN Foreign Language Institute 372,200 369,000 349,100 338,100 352,800 378,600 410,300 Contract Education 2,542,700 2,490,700 2,289,700 2,217,000 2,198,200 2,178,400 2,232,900
Subtotal $64,569,500 $62,696,600 $62,197,800 $61,833,700 $62,127,100 $69,377,200 $76,402,700
Program InitiativesCampus Centers of Excellence $19,635,500 $18,774,500 $17,717,700 $17,238,700 $17,328,000 $17,538,300 $18,193,700Campus Centers of Emphasis 1,429,600 1,344,900 1,269,200 1,240,700 1,247,600 1,265,900 1,313,300 Academic Scholars Program 401,800 401,800 401,800 401,800 401,800 401,800 411,800 UT Access and Diversity Initiative 6,448,900 6,181,900 5,833,900 5,648,700 5,600,600 5,550,100 5,688,900 TBR Access and Diversity Initiative 11,391,100 10,543,000 10,313,200 9,977,400 9,892,900 9,803,700 10,048,800 THEC Grants 2,715,900 2,581,800 2,436,500 2,359,200 2,339,200 2,318,100 2,403,300 Research Initiatives - UT 6,500,000 6,231,000 5,880,300 5,693,700 5,645,200 5,594,300 5,734,200
Subtotal $48,522,800 $46,058,900 $43,852,600 $42,560,200 $42,455,300 $42,472,200 $43,794,000
Total Operating $1,346,276,300 $1,255,833,500 $1,118,661,000 $1,066,399,800 $1,069,571,000 $1,125,478,400 $1,206,386,500Note: All years of appropriations are recurring funds only.
ATTACHMENT IState Appropriations History
5

A B C D E = C + D F = E + A G = E / A H = F / B
2013-14 2014-15 Formula Outcomes Formula Share of New 2014-15 2014-15 Percent Percent
Academic Formula Units Appropriation1 Recommendation Adjustments Funding Changes Appropriation Change FundedTBR UniversitiesAustin Peay $32,995,000 $56,186,000 $1,041,100 $1,224,900 $2,266,000 $35,261,000 6.9% 62.8%East Tennessee 48,685,000 78,623,000 (1,057,200) 1,714,100 656,900 49,341,900 1.3% 62.8%Middle Tennessee 81,024,600 135,820,500 1,252,000 2,961,100 4,213,100 85,237,700 5.2% 62.8%Tennessee State 32,610,800 52,609,300 (741,400) 1,147,000 405,600 33,016,400 1.2% 62.8%Tennessee Tech 39,559,500 62,960,900 (1,419,400) 1,372,600 (46,800) 39,512,700 -0.1% 62.8%University of Memphis 89,106,400 146,528,000 (343,500) 3,194,500 2,851,000 91,957,400 3.2% 62.8%
Subtotal $323,981,300 $532,727,700 ($1,268,400) $11,614,200 $10,345,800 $334,327,100 3.2% 62.8%
Community Colleges2
Chattanooga $26,624,800 $42,730,000 ($740,100) $931,600 $191,500 $26,816,300 0.7% 62.8%Cleveland 8,997,100 14,530,000 (195,200) 316,800 121,600 9,118,700 1.4% 62.8%Columbia 12,339,500 20,290,700 (47,900) 442,400 394,500 12,734,000 3.2% 62.8%Dyersburg 7,238,900 12,024,000 44,900 262,100 307,000 7,545,900 4.2% 62.8%Jackson 11,510,200 18,229,000 (467,500) 397,400 (70,100) 11,440,100 -0.6% 62.8%Motlow 11,017,200 17,508,000 (411,300) 381,700 (29,600) 10,987,600 -0.3% 62.8%Nashville 15,983,500 26,060,000 (197,000) 568,100 371,100 16,354,600 2.3% 62.8%Northeast 13,648,200 21,726,000 (487,100) 473,700 (13,400) 13,634,800 -0.1% 62.8%Pellissippi 22,913,400 38,498,000 407,700 839,300 1,247,000 24,160,400 5.4% 62.8%Roane 16,619,800 28,591,000 699,900 623,300 1,323,200 17,943,000 8.0% 62.8%Southwest 25,739,300 40,541,000 (1,180,600) 883,900 (296,700) 25,442,600 -1.2% 62.8%Volunteer 16,075,400 26,644,000 64,900 580,900 645,800 16,721,200 4.0% 62.8%Walters 19,866,900 33,438,000 389,000 729,000 1,118,000 20,984,900 5.6% 62.8%
Community College Subtotal $208,574,200 $340,809,700 ($2,120,300) $7,430,200 $5,309,900 $213,884,100 2.5% 62.8%
UT UniversitiesUT Chattanooga $36,128,500 $61,485,000 $1,117,500 $1,340,500 $2,458,000 $38,586,500 6.8% 62.8%UT Knoxville3 171,335,300 289,041,000 3,758,400 6,301,500 10,059,900 181,395,200 5.9% 62.8%UT Martin3 25,043,000 42,686,000 815,100 930,600 1,745,700 26,788,700 7.0% 62.8%
Subtotal $232,506,800 $393,212,000 $5,691,000 $8,572,600 $14,263,600 $246,770,400 6.1% 62.8%
Total Colleges and Universities $765,062,300 $1,266,749,400 $2,302,300 $27,617,000 $29,919,300 $794,981,600 3.9% 62.8%
TN Colleges of Applied Technology $57,400,500 $90,955,000 ($2,302,300) $1,983,000 ($319,300) $57,081,200 -0.6% 62.8%
Total Academic Formula Units $822,462,800 $1,357,704,400 $0 $29,600,000 $29,600,000 $852,062,800 3.6% 62.8%
1 - Recurring
3 - Does not include recurring funds appropriated to UT Martin for the Parsons Center ($200K) or to UT Knoxville for the engineering college ($3M). These appropriations are included as Program Initiatives.
ATTACHMENT II2014-15 State Appropriations Distribution Recommendation
Breakdown of 2014-15 Changes
2 - THEC's Community College recommendation is only for the sector as a whole. Institutional detail displayed here is for informational purposes only.
6

A B C = B - A D = C / A
2013-14 2014-15 Total Percent
Specialized Units Appropriation1 Appropriation1 Change ChangeMedical Education
ETSU College of Medicine $28,893,900 $29,933,800 $1,039,900 3.6%ETSU Family Practice 6,117,800 6,338,000 220,200 3.6%UT College of Medicine 47,065,400 48,759,300 1,693,900 3.6%UT Family Practice 10,458,800 10,835,200 376,400 3.6%UT Memphis 71,363,200 73,931,500 2,568,300 3.6%UT College of Vet Medicine 16,453,000 17,045,100 592,100 3.6%
Subtotal $180,352,100 $186,842,900 $6,490,800 3.6%
Research and Public ServiceUT Agriculture Experiment Station $25,438,800 $26,354,300 $915,500 3.6%UT Agriculture Extension Service 30,836,900 31,946,700 1,109,800 3.6%TSU McMinnville Center 560,400 580,600 20,200 3.6%TSU Institute of Ag. and Environmental Research 2,280,500 2,362,600 82,100 3.6%TSU Cooperative Education 3,110,400 3,222,300 111,900 3.6%TSU McIntire-Stennis Forestry Research 179,400 185,900 6,500 3.6%UT Space Institute 7,896,700 8,180,900 284,200 3.6%UT Institute for Public Service 5,232,400 5,420,700 188,300 3.6%UT County Technical Assistance Service 1,753,200 1,816,300 63,100 3.6%UT Municipal Technical Advisory Service 2,886,200 2,990,100 103,900 3.6%
Subtotal $80,174,900 $83,060,400 $2,885,500 3.6%
Other Specialized UnitsUT University-Wide Administration $4,589,300 $4,754,500 $165,200 3.6%TN Board of Regents Administration 5,104,200 5,287,900 183,700 3.6%TN Student Assistance Corporation 61,586,800 93,379,400 31,792,600 51.6%
Tennessee Student Assistance Awards 57,762,500 89,462,500 31,700,000 54.9% Tennessee Students Assistance Corporation 1,353,500 1,402,200 48,700 3.6%
Loan/Scholarships Program 1,220,800 1,264,700 43,900 3.6%Endowment Scholarships 1,250,000 1,250,000 - 0.0%
TN Higher Education Commission 2,479,200 2,568,400 89,200 3.6%TN Foreign Language Institute 410,300 425,100 14,800 3.6%Contract Education 2,232,900 2,313,300 80,400 3.6%
Subtotal $76,402,700 $108,728,600 $32,325,900 42.3%
Program InitiativesCampus Centers of Excellence $18,193,700 $18,848,500 $654,800 3.6%Campus Centers of Emphasis 1,313,300 1,360,600 47,300 3.6%Academic Scholars Program 411,800 426,600 14,800 3.6%UT Access and Diversity Initiative 5,688,900 5,893,600 204,700 3.6%TBR Access and Diversity Initiative 10,048,800 10,410,500 361,700 3.6%THEC Grants 2,403,300 2,489,800 86,500 3.6%Research Initiatives - UT 5,734,200 5,940,600 206,400 3.6%UT Martin Parsons Center 2 200,000 200,000 - NAUT Knoxville College of Engineering 2 3,000,000 3,000,000 - NAEquipment Replenishment Program 3 16,500,000 16,500,000 - NAOnline Innovation Initiative4 3,000,000 5,000,000 2,000,000 NAGovernor's Initiative on Higher Education Access & Quality4 750,000 - (750,000) NA
Subtotal $46,994,000 $48,570,200 $1,576,200 3.4%
Total Recurring $1,206,386,500 $1,279,264,900 $72,878,400 6.0%
Total with Non-Recurring Request $1,226,636,500 $1,300,764,900 $74,128,400 6.0%
2 - Recurring funds appropriated to UT Martin ($200K) and UT Knoxville ($3M).
ATTACHMENT II2014-15 State Appropriations Distribution Recommendation
4 - Non-recurring funds.
1 - Recurring funds unless otherwise footnoted.
3 - Non-recurring funds used for TCAT and Community College equipment replenishment program in 2013-14. An equivalent amount is being requested in 2014-15 as a second half of this replenishment program.
7

A B C D E = C + D F = E + A G = E / A H = F / B
2013-14 2014-15 Formula Outcomes Formula 5% Reduction to 2014-15 2014-15 Percent PercentAcademic Formula Units Appropriation1 Recommendation Adjustments Higher Education Change Appropriation Change FundedTBR UniversitiesAustin Peay $32,995,000 $56,186,000 $1,041,100 ($1,973,000) ($931,900) $32,063,100 -2.8% 57.1%East Tennessee 48,685,000 78,623,000 (1,057,200) (2,760,800) (3,818,000) 44,867,000 -7.8% 57.1%Middle Tennessee 81,024,600 135,820,500 1,252,000 (4,769,300) (3,517,300) 77,507,300 -4.3% 57.1%Tennessee State 32,610,800 52,609,300 (741,400) (1,847,400) (2,588,800) 30,022,000 -7.9% 57.1%Tennessee Tech 39,559,500 62,960,900 (1,419,400) (2,210,900) (3,630,300) 35,929,200 -9.2% 57.1%University of Memphis 89,106,400 146,528,000 (343,500) (5,145,300) (5,488,800) 83,617,600 -6.2% 57.1%
Subtotal $323,981,300 $532,727,700 ($1,268,400) ($18,706,700) ($19,975,100) $304,006,200 -6.2% 57.1%
Community Colleges2
Chattanooga $26,624,800 $42,730,000 ($740,100) ($1,500,500) ($2,240,600) $24,384,200 -8.4% 57.1%Cleveland 8,997,100 14,530,000 (195,200) (510,200) (705,400) 8,291,700 -7.8% 57.1%Columbia 12,339,500 20,290,700 (47,900) (712,500) (760,400) 11,579,100 -6.2% 57.1%Dyersburg 7,238,900 12,024,000 44,900 (422,200) (377,300) 6,861,600 -5.2% 57.1%Jackson 11,510,200 18,229,000 (467,500) (640,000) (1,107,500) 10,402,700 -9.6% 57.1%Motlow 11,017,200 17,508,000 (411,300) (614,800) (1,026,100) 9,991,100 -9.3% 57.1%Nashville 15,983,500 26,060,000 (197,000) (915,100) (1,112,100) 14,871,400 -7.0% 57.1%Northeast 13,648,200 21,726,000 (487,100) (762,900) (1,250,000) 12,398,200 -9.2% 57.1%Pellissippi 22,913,400 38,498,000 407,700 (1,351,900) (944,200) 21,969,200 -4.1% 57.1%Roane 16,619,800 28,591,000 699,900 (1,004,000) (304,100) 16,315,700 -1.8% 57.1%Southwest 25,739,300 40,541,000 (1,180,600) (1,423,600) (2,604,200) 23,135,100 -10.1% 57.1%Volunteer 16,075,400 26,644,000 64,900 (935,600) (870,700) 15,204,700 -5.4% 57.1%Walters 19,866,900 33,438,000 389,000 (1,174,200) (785,200) 19,081,700 -4.0% 57.1%
Community College Subtotal $208,574,200 $340,809,700 ($2,120,300) ($11,967,500) ($14,087,800) $194,486,400 -6.8% 57.1%
UT UniversitiesUT Chattanooga $36,128,500 $61,485,000 $1,117,500 ($2,159,000) ($1,041,500) $35,087,000 -2.9% 57.1%UT Knoxville3 171,335,300 289,041,000 3,758,400 (10,149,700) (6,391,300) 164,944,000 -3.7% 57.1%UT Martin3 25,043,000 42,686,000 815,100 (1,498,900) (683,800) 24,359,200 -2.7% 57.1%
Subtotal $232,506,800 $393,212,000 $5,691,000 ($13,807,600) ($8,116,600) $224,390,200 -3.5% 57.1%
Total Colleges and Universities $765,062,300 $1,266,749,400 $2,302,300 ($44,481,800) ($42,179,500) $722,882,800 -5.5% 57.1%
TN Colleges of Applied Technology $57,400,500 $90,955,000 ($2,302,300) ($3,193,900) ($5,496,200) $51,904,300 -9.6% 57.1%
Total Academic Formula Units $822,462,800 $1,357,704,400 $0 ($47,675,700) ($47,675,700) $774,787,100 -5.8% 57.1%
1 - Recurring
3 - Does not include recurring funds appropriated to UT Martin for the Parsons Center ($200K) or to UT Knoxville for the engineering college ($3M). These appropriations are included as Program Initiatives.
ATTACHMENT III2014-15 State Appropriations Distribution With a 5% Reduction
Breakdown of 2014-15 Changes
2 - THEC's Community College recommendation is only for the sector as a whole. Institutional detail displayed here is for informational purposes only.
8

A B C = B - A D = C / A
2013-14 2014-15 PercentSpecialized Units Appropriation1 Appropriation1 Difference ChangeMedical EducationETSU College of Medicine $28,893,900 $28,007,900 ($886,000) -3.1%ETSU Family Practice 6,117,800 5,975,000 (142,800) -2.3%UT College of Medicine 47,065,400 45,377,500 (1,687,900) -3.6%UT Family Practice 10,458,800 10,214,700 (244,100) -2.3%UT Memphis 71,363,200 68,650,900 (2,712,300) -3.8%UT College of Vet Medicine 16,453,000 15,810,200 (642,800) -3.9%
Subtotal $180,352,100 $174,036,200 ($6,315,900) -3.5%
Research and Public ServiceUT Agriculture Experiment Station $25,438,800 $24,845,000 ($593,800) -2.3%UT Agriculture Extension Service 30,836,900 30,117,100 (719,800) -2.3%TSU McMinnville Center 560,400 547,300 (13,100) -2.3%TSU Institute of Ag. and Environmental Research 2,280,500 2,227,300 (53,200) -2.3%TSU Cooperative Education 3,110,400 3,037,800 (72,600) -2.3%TSU McIntire-Stennis Forestry Research 179,400 175,200 (4,200) -2.3%UT Space Institute 7,896,700 7,678,500 (218,200) -2.8%UT Institute for Public Service 5,232,400 5,110,300 (122,100) -2.3%UT County Technical Assistance Service 1,753,200 1,712,300 (40,900) -2.3%UT Municipal Technical Advisory Service 2,886,200 2,818,800 (67,400) -2.3%
Subtotal $80,174,900 $78,269,600 ($1,905,300) -2.4%
Other Specialized UnitsUT University-Wide Administration $4,589,300 $4,482,200 ($107,100) -2.3%TN Board of Regents Administration 5,104,200 4,985,100 (119,100) -2.3%TN Student Assistance Corporation 61,586,800 61,555,200 (31,600) -0.1%
Tennessee Student Assistance Awards 57,762,500 57,762,500 - 0.0%Tennessee Students Assistance Corporation 1,353,500 1,321,900 (31,600) -2.3%
Loan/Scholarships Program 1,220,800 1,220,800 - 0.0%Endowment Scholarships 1,250,000 1,250,000 - 0.0%
TN Higher Education Commission 2,479,200 2,421,300 (57,900) -2.3%TN Foreign Language Institute 410,300 400,700 (9,600) -2.3%Contract Education 2,232,900 2,180,800 (52,100) -2.3%
Subtotal $76,402,700 $76,025,300 ($377,400) -0.5%
Program InitiativesCampus Centers of Excellence $18,193,700 $17,769,000 ($424,700) -2.3%Campus Centers of Emphasis 1,313,300 1,282,600 (30,700) -2.3%Academic Scholars Program 411,800 411,800 - 0.0%UT Access and Diversity Initiative 5,688,900 5,556,100 (132,800) -2.3%TBR Access and Diversity Initiative 10,048,800 9,814,200 (234,600) -2.3%THEC Grants 2,403,300 2,347,200 (56,100) -2.3%Research Initiatives - UT 5,734,200 5,600,400 (133,800) -2.3%UT Martin Parsons Center 2 200,000 200,000 - NAUT Knoxville College of Engineering 2 3,000,000 3,000,000 - NA
Subtotal $46,994,000 $45,981,300 ($1,012,700) -2.2%
Total $1,206,386,500 $1,149,099,500 ($57,287,000) -4.7%1 - Recurring2 - Recurring funds appropriated to UT Martin ($200K) and UT Knoxville ($3M).NOTE: TSAA Awards, Loan/Scholarship Program, Academic Scholars Program and Endowment Scholarships are exempt from 2014-15 reductions per F&A budget instructions.
ATTACHMENT III2014-15 State Appropriations Distribution With a 5% Reduction
9

Outcomes 2013-14 2014-15Students Accumulating 12 hrs 30,595 25,270 (5,325) -17.4%Students Accumulating 24 hrs 22,545 19,787 (2,758) -12.2%Students Accumulating 36 hrs 17,734 16,493 (1,241) -7.0%
Dual Enrollment 11,957 12,894 937 7.8%Associates 8,312 8,887 575 6.9%
Certificates 1-2 Year 676 732 56 8.3%Certificates <1 Year 1,220 1,853 633 51.8%
Job Placements 3,757 3,921 163 4.3%Remedial & Developmental Success 23,560 26,323 2,763 11.7%
Student Transfers 5,767 6,099 331 5.7%Workforce Training (Contact Hours) 729,085 795,505 66,420 9.1%
Awards per 100 FTE 14.25 15.41 1.16 8.1%Adults Accumulating 12 hrs 9,260 7,348 (1,912) -20.7%Adults Accumulating 24 hrs 8,084 7,104 (980) -12.1%Adults Accumulating 36 hrs 7,198 6,723 (475) -6.6%
Adult Associates 4,657 5,042 385 8.3%Adult 1-2 Year Certificates 443 493 50 11.2%
Adult <1yr Certificates 801 1,115 314 39.1%Low-income Accumulating 12 hrs 19,283 15,566 (3,717) -19.3%Low-income Accumulating 24 hrs 14,578 12,993 (1,585) -10.9%Low-income Accumulating 36 hrs 11,501 11,057 (444) -3.9%
Low-income Associates 5,148 5,809 661 12.8%Low-income 1-2 Year Certificates 354 411 56 15.9%
Low-income <1yr Certificates 636 1,061 424 66.7%
Outcomes 2013-14 2014-15Students Accumulating 24 hrs 19,148 18,043 (1,106) -5.8%Students Accumulating 48 hrs 18,307 17,913 (394) -2.2%Students Accumulating 72 hrs 19,367 19,215 (153) -0.8%
Bachelors and Associates 19,365 20,329 964 5.0%Masters / Ed Specialists 5,892 5,955 62 1.1%
Doctoral / Law Degree 1,015 1,051 36 3.5%Research and Service 320,173,511$ 314,411,554$ (5,761,957)$ -1.8%
Student Transfers 3,240 3,509 269 8.3%Degrees per 100 FTE 18.05 18.83 0.78 4.3%
Six-Year Graduation Rate 50.92 51.24 0.32 0.6%Adults Accumulating 24 hrs 1,269 1,088 (181) -14.2%Adults Accumulating 48 hrs 1,777 1,684 (93) -5.3%Adults Accumulating 72 hrs 2,901 2,846 (54) -1.9%
Adults Bachelors and Associates 6,707 7,126 419 6.2%Low-income Accumulating 24 hrs 8,894 8,360 (534) -6.0%Low-income Accumulating 48 hrs 8,460 8,550 90 1.1%Low-income Accumulating 72 hrs 9,056 9,413 357 3.9%
Low-income Bachelors and Associates 8,901 9,919 1,018 11.4%
ChangeCommunity Colleges
ATTACHMENT IVChanges in Formula Outcomes
UniversitiesChange
10

State Appropriation Maintenance Out-of-State Total Total Formula Difference PercentAcademic Formula Units Recommendation1 Fees2 Tuition2 Revenue Revenue Need (Short) Funded
Austin Peay 35,261,000$ 58,746,700$ 3,516,900$ 97,524,600$ 103,685,000$ (6,160,400)$ 94.1%East Tennessee 49,341,900 88,429,000 13,037,800 150,808,700 152,953,000 (2,144,300) 98.6%Middle Tennessee 85,237,700 150,744,000 14,007,700 249,989,400 251,465,500 (1,476,100) 99.4%Tennessee State 33,016,400 51,969,500 17,303,200 102,289,100 105,052,300 (2,763,200) 97.4%Tennessee Tech 39,512,700 64,129,100 11,788,000 115,429,800 118,101,900 (2,672,100) 97.7%University of Memphis 91,957,400 152,450,000 11,439,600 255,847,000 279,474,000 (23,627,000) 91.5%
Subtotal TBR Universities 334,327,100$ 566,468,300$ 71,093,200$ 971,888,600$ 1,010,731,700$ (38,843,100)$ 96.2%
Chattanooga 26,816,300$ 31,096,000$ 842,400$ 58,754,700$ 65,212,000$ (6,457,300)$ 90.1%Cleveland 9,118,700 10,652,200 300,100 20,071,000 21,864,000 (1,793,000) 91.8%Columbia 12,734,000 13,364,000 372,700 26,470,700 30,501,700 (4,031,000) 86.8%Dyersburg 7,545,900 8,896,500 100,900 16,543,300 18,083,000 (1,539,700) 91.5%Jackson 11,440,100 13,259,100 69,800 24,769,000 27,431,000 (2,662,000) 90.3%Motlow 10,987,600 12,236,500 216,100 23,440,200 26,361,000 (2,920,800) 88.9%Nashville 16,354,600 25,009,900 741,500 42,106,000 39,262,000 2,844,000 107.2%Northeast 13,634,800 18,042,500 36,800 31,714,100 32,598,000 (883,900) 97.3%Pellissippi 24,160,400 30,612,400 1,222,000 55,994,800 58,073,000 (2,078,200) 96.4%Roane 17,943,000 17,610,600 392,500 35,946,100 43,069,000 (7,122,900) 83.5%Southwest 25,442,600 34,491,000 1,826,200 61,759,800 61,028,000 731,800 101.2%Volunteer 16,721,200 22,984,000 616,200 40,321,400 40,145,000 176,400 100.4%Walters 20,984,900 19,800,800 452,800 41,238,500 50,358,000 (9,119,500) 81.9%
Subtotal Community Colleges 213,884,100$ 258,055,500$ 7,190,000$ 479,129,600$ 513,985,700$ (34,856,100)$ 93.2%
UT Chattanooga 38,586,500$ 68,931,200$ 6,638,300$ 114,156,000$ 114,818,000$ (662,000)$ 99.4%UT Knoxville 181,395,200 240,536,100 36,481,700 458,413,000 544,461,000 (86,048,000) 84.2%UT Martin 26,788,700 48,814,700 4,718,800 80,322,200 79,634,000 688,200 100.9%
Subtotal UT Universities 246,770,400$ 358,282,000$ 47,838,800$ 652,891,200$ 738,913,000$ (86,021,800)$ 88.4%
TN Colleges of Applied Technology 57,081,200$ 26,539,800$ -$ 83,621,000$ $113,417,000 (29,796,000)$ 73.7%
Total Academic Formula Units 852,062,800$ 1,209,345,600$ 126,122,000$ 2,187,530,400$ 2,377,047,400$ (189,517,000)$ 92.0%
ATTACHMENT V2014-15 Total Formula Revenue Analysis
2 - Assumes 4% tuition increases and 0% enrollment increases at Universities, Community Colleges and the TN Colleges of Applied Technology in 2014-15.1 - Recurring; accounts for recommended $29.6M in additional funding for formula units.
11

Agenda Item: I.D.
DATE: November 14, 2013 SUBJECT: 2014-15 Student Fee Recommendations ACTION RECOMMENDED: Approval BACKGROUND INFORMATION The Complete College Tennessee Act requires THEC to make student fee and state appropriation recommendations concurrently. Numerous factors impact the tuition recommendation including affordability and financial aid, the income profile of students attending Tennessee public institutions, and institutional revenues and cost inflation. These recommendations are particularly informed by an analysis of the income profile and financial aid packages of Tennessee students. One of the clearest measures of ability to pay is the income data of students and families as measured by the Federal government’s Free Application for Federal Student Aid — or FAFSA — which calculates a family’s Expected Family Contribution (EFC). This measure is a proxy for a student’s ability to pay for college and is the basis for awarding need-based financial aid such as the Federal Pell grant and the Tennessee Student Assistance Award (TSAA). A macro level analysis that accompanied THEC staff recommendations for student fees at this time last year highlighted the fact that 62 percent of university and community college students had an EFC low enough to qualify for the Pell grant and, by definition, the TSAA in 2011. In 2007 that figure was 52 percent indicating that Tennessee students’ and families’ ability to pay had deteriorated during the Great Recession of 2008. More intensive analysis on student level financial aid data, which has been part of THEC’s grant from the Lumina Foundation focusing on potential reforms to student financial aid, revealed that roughly half of university students borrow money for college. And while Tennessee’s average debt levels are among the lowest in the nation for students who receive a degree, there is extensive borrowing among the many students who do not graduate. Borrowing also occurs even at the upper reaches of the income scale, indicating that students and families are borrowing perhaps because they have access to Federal loan money, even though it is not evident that an acute financial need exists.
T E N N E S S E E
H I G H E R
E D U C A T I O N
C O M M I S S I O N

RECOMMENDATION SUMMARY The THEC staff recommendations are maintenance fee increases of two to four percent at universities, community colleges and colleges of applied technology. Scenarios for tuition increases in 2014-15 of two, three or four percent at the universities, community colleges and colleges of applied technology are presented and summarized in Attachment I. These recommendation ranges are a companion piece to the recommended state appropriations increase of $29.6 million. It is also recommended that UT and TBR further implement differential tuition rates, which might consider program, cost, student level, institution or other factors.
2

UniversitiesCCsTCATs
Maintenance Fee
Mandatory Fees 2.0% 3.0% 4.0%
APSU $5,874 $1,284 $7,275 $7,334 $7,393ETSU 6,198 1,345 7,667 7,729 7,791 MTSU 6,222 1,618 7,964 8,027 8,089 TSU 5,844 930 6,891 6,949 7,008 TTU 6,096 1,287 7,505 7,566 7,627 UM 7,410 1,256 8,814 8,888 8,962 UTC 6,065 1,490 7,677 7,737 7,798 UTK1 8,648 1,414 10,235 10,321 10,408 UTM 6,336 1,178 7,641 7,704 7,767 CC Avg 3,504 283 3,857 3,892 3,927 TCATs 2,946 230 3,235 3,264 3,294
2 - Percent increase applied to maintenance fee only.
2% to 4% Maintenance Fee Increase
ATTACHMENT I2014-15 Tuition and Mandatory Fees Recommendation
THEC Recommendation Summary2% to 4% Maintenance Fee Increase
2% to 4% Maintenance Fee Increase
2014-15 Projected Tuition and Fee Levels2013-14 2014-15 Tuition Scenarios2
1 - The 2013-14 maintenance fee rate for new students at UT Knoxville (Freshmen and entering transfer students) is a flat rate for 15 semester credit hours, regardless of the number of credit hours taken by the student. This policy was approved in 2012 by the UT Board for introduction in Fall 2013. UTK's maintenance fee is a weighted average across the undergraduate population.
3

Model Assumptions Universities CCs TCATsFixed Costs 3.0% 3.0% 3.0%Enrollment 0.0% 0.0% 0.0%
State Appropriations 4.4% 2.5% -0.6%Average Tuition Rate Increase 2.8% 3.6% 11.9%
Model Assumptions Universities CCs TCATsFixed Costs 3.0% 3.0% 3.0%Enrollment 0.0% 0.0% 0.0%
State Appropriations 0.8% -1.0% -4.0%Average Tuition Rate Increase 5.1% 6.7% 20.2%
Model Assumptions Universities CCs TCATsFixed Costs 3.0% 3.0% 3.0%Enrollment 0.0% 0.0% 0.0%
State Appropriations -5.0% -6.8% -9.6%Average Tuition Rate Increase 9.0% 11.8% 33.8%
Average Increase Needed With Overall Flat Appropriations
Average Increase Needed With a $47.7M (5.8%) Reduction in Appropriations
ATTACHMENT II2014-15 Tuition Model Analysis Scenarios
The following scenarios utilize the THEC Tuition Model to estimate the tuition increase required to maintain the 2013-14 estimated total revenue per FTE. The scenarios assume zero percent enrollment growth and a three percent increase in cost inflation. This analysis is presented for information and is meant to provide guidance on the tuition recommendation analysis.
Average Increase Needed With a $29.6M (3.6%) Increase in State Appropriations
4

2008-09 2012-13 2013-141 Year
Change5 Year
ChangeAPSU $5,526 $6,918 $7,158 3.5% 29.5%ETSU 5,201 6,997 7,543 7.8% 45.0%MTSU 5,700 7,492 7,840 4.6% 37.5%TSU 5,102 6,702 6,774 1.1% 32.8%TTU 5,244 6,948 7,383 6.3% 40.8%UM 6,128 8,234 8,666 5.2% 41.4%UTC 5,310 7,212 7,555 4.8% 42.3%UTK1 6,250 9,092 10,062 10.7% 61.0%UTM 5,255 7,056 7,514 6.5% 43.0%CC Avg 2,773 3,684 3,787 2.8% 36.6%TCATs 2,285 3,146 3,176 1.0% 39.0%
2008-09 2012-13 2013-141 Year
Change5 Year
ChangeAPSU $1,224 $1,224 $1,284 4.9% 4.9%ETSU 899 1,075 1,345 25.1% 49.6%MTSU 1,398 1,594 1,618 1.5% 15.7%TSU 800 930 930 0.0% 16.3%TTU 942 1,200 1,287 7.3% 36.6%UM 1,150 1,256 1,256 0.0% 9.2%UTC 1,100 1,490 1,490 0.0% 35.5%UTK 822 1,290 1,414 9.6% 72.0%UTM 855 1,078 1,178 9.3% 37.8%CC Avg 267 282 283 0.4% 6.0%TCATs 200 200 230 15.0% 15.0%
Maintenance and Mandatory Fees History
Mandatory Fees Only History
ATTACHMENT IIITuition and Mandatory Fees History
1 - The 2013-14 maintenance fee rate for new students at UT Knoxville (Freshmen and entering transfer students) is a flat rate for 15 semester credit hours, regardless of the number of credit hours taken by the student. This policy was approved in 2012 by the UT Board for introduction in Fall 2013. UTK's maintenance fee is a weighted average across the undergraduate population.
5

Agenda Item: I.E.
DATE: November 14, 2013 SUBJECT: 2014-15 Capital Project Recommendations ACTION RECOMMENDED: Approval BACKGROUND INFORMATION Capital projects are broadly categorized according to the scope of the project and funding source. State appropriations fund capital outlay projects, which consist of new construction or significant renovation of existing facilities, as well as capital maintenance projects which repair and replace systems and structures on existing facilities, such as new roofs or HVAC systems. The third type of capital project, referred to as a disclosed project, is distinguished by its funding source, which does not include state funding. These are typically projects related to various auxiliary functions on a campus, such as dorms, parking or athletics. Since the project must be funded without direct state appropriations, the institution signals its intent to initiate the project and present it for approval at the State Building Commission. This declaration of intent is disclosed to the Governor and the General Assembly, even though no state funding is requested. Each of these three types of projects has a historically different funding pattern. Funding levels for capital outlay projects tend to be irregular. Whereas from 2004-05 to 2007-08 the legislature approved a total of $680.7 million of capital outlay projects, in 2008-09 and 2009-10 no capital projects were approved for state funding. A special capital allocation of $120 million was made in 2010-11 followed by an allocation of $11 million in 2011-12. Capital outlay funding rebounded in 2012-13 and 2013-14, with $426 million in total funding over those two fiscal years. Unlike capital outlay projects, maintenance projects have been consistently funded in recent years. Since 2004-05, capital maintenance funding has averaged $49 million per year, including a record high amount of $77 million in 2004-05.
T E N N E S S E E
H I G H E R
E D U C A T I O N
C O M M I S S I O N

RECOMMENDATION SUMMARY Capital Outlay The capital outlay recommendation for 2014-15 totals $213.1 million. As shown in Attachment I, this includes two projects for the University of Tennessee totaling $103.5 million, or 49 percent of the total, and five projects for the Tennessee Board of Regents totaling $109.6 million, or 51 percent of the total. All capital outlay projects include an institutional matching component applicable to the first $75 million of a project. THEC intends that UT and TBR have flexibility to craft the specific parameters of the matching component, though matching funds should largely consist of private gifts, grants and institutional funds. In 2013-14, higher education institutions received $155.9 million to fund the top four projects from THEC’s 2013-14 capital outlay recommendations. The legislature funded an additional $60.8 million for four projects not recommended by THEC, totaling $216.7 million for capital outlay projects in 2013-14. Capital Maintenance The 2014-15 recommendation for capital maintenance for the Tennessee Board of Regents and the University of Tennessee systems is $114.8 million. As shown in Attachment IV, this includes 11 projects for the University of Tennessee totaling $45.7 million — or 40 percent of the total and 60 projects for the Tennessee Board of Regents totaling $69.1 million — or 60 percent of the total. In 2013-14, higher education institutions received $56.7 million to fund 36 capital maintenance projects. Disclosure of Revenue-Funded Projects Projects of this nature are funded through institutional funds, Tennessee State School Bond Authority, auxiliary funds, or sources other than state appropriations. For 2014-15, 34 revenue-funded projects totaling $264.3 million for both the Tennessee Board of Regents and the University of Tennessee systems are being disclosed. As shown in Attachment V, the listing includes 17 projects totaling $233.6 million for the University of Tennessee, and 17 projects totaling $30.7 million for the Tennessee Board of Regents.
2

THEC Total Total Previous Years 2014-15 State FundsPriority Project Cost Match Match Funds1 Match Funds2 Match Funds Request
1 UT UTK Science Laboratory Facility (Cumberland & 13th St.) $96,000,000 25% $18,750,000 $3,000,000 $15,750,000 $77,250,0002 TBR Volunteer Humanities Building 30,200,000 10% 3,020,000 1,500,000 1,520,000 27,180,0003 TBR Columbia Williamson County Center Relocation 38,500,000 10% 3,850,000 1,800,000 2,050,000 34,650,0004 TBR TCATs TCAT Improvements 17,940,000 5% 897,000 800,000 97,000 17,043,0005 UT UTC Academic Classroom Building Renovation (Lupton/Fine Arts) 35,000,000 25% 8,750,000 0 8,750,000 26,250,0006 TBR APSU Fine Arts Improvements 20,630,000 25% 5,158,000 1,000,000 4,158,000 15,472,0007 TBR Jackson Health Sciences Building 17,000,000 10% 1,700,000 1,000,000 700,000 15,300,000
$124,270,000 5%-25% $14,625,000 $6,100,000 $8,525,000 $109,645,000$131,000,000 25% $27,500,000 $3,000,000 $24,500,000 $103,500,000
Total Total Institutional Remaining State FundsProject Cost Match Match Funds1 Planning Funds3 Match Funds Request
UT UTC Academic Classroom Building Renovation (Lupton/Fine Arts) $35,000,000 25% $8,750,000 $2,000,000 $6,750,000 $0UT UTK Engineering Services Facility 98,000,000 25% 18,750,000 3,000,000 15,750,000 0
$0 25% $0 $0 $0$133,000,000 25% $27,500,000 $5,000,000 $0
State FundsTotal Projects Request
$69,050,000 60 $69,050,000$45,700,000 11 $45,700,000
Total State FundsTotal Match Funds1 Projects Request
$255,270,000 $42,125,000 7 $213,145,000$133,000,000 $27,500,000 2 $0$114,750,000 $0 71 $114,750,000
$503,020,000 $69,625,000 80 $327,895,000
2 - Institutional funding expended in 2012-13 and/or 2013-14 for project planning.3 - Funds disclosed in 2014-15 that will be used to meet the requirements of the match.
Capital MaintenanceTBR Total
ATTACHMENT ITHEC 2014-15 Capital Projects Recommendation Summary
UT Total
Capital Outlay
TBR TotalUT Total
Capital Outlay Full Planning
TBR TotalUT Total
1 - Match is required only on the first $75 million of capital outlay projects; may include match funds expended in previous years.
TotalTotal Capital OutlayTotal Capital Outlay Full PlanningTotal Capital MaintenanceTotal Capital Investment
3

A B C = A * B D E F = A - C
THEC System 2014-15 Match Total Previous Years 2014-15 State Appropriation
Priority Priority Institution Project Name Project Cost Percentage Match Funds1 Match Funds2 Match Funds Request
1 1 UTK Science Laboratory Facility (Cumberland & 13th St.) 96,000,000$ 25% 18,750,000$ 3,000,000$ 15,750,000$ 77,250,000$
2 1 Volunteer Humanities Building 30,200,000$ 10% 3,020,000$ 1,500,000$ 1,520,000$ 27,180,000$
3 2 Columbia Williamson County Center Relocation 38,500,000$ 10% 3,850,000$ 1,800,000$ 2,050,000$ 34,650,000$
4 3 TCATs TCAT Improvements3 17,940,000$ 5% 897,000$ 800,000$ 97,000$ 17,043,000$
5 2 UTC Academic Classroom Building Renovation (Lupton/Fine Arts)4 35,000,000$ 25% 8,750,000$ -$ 8,750,000$ 26,250,000$
6 4 APSU Fine Arts Improvements 20,630,000$ 25% 5,158,000$ 1,000,000$ 4,158,000$ 15,472,000$
7 5 Jackson Health Sciences Building 17,000,000$ 10% 1,700,000$ 1,000,000$ 700,000$ 15,300,000$
2014-15 TBR Total 124,270,000$ 5%-25% 14,625,000$ 6,100,000$ 8,525,000$ 109,645,000$ 2014-15 UT Total 131,000,000$ 5%-25% 27,500,000$ 3,000,000$ 24,500,000$ 103,500,000$
2014-15 THEC Capital Outlay Projects Recommendation 255,270,000$ 5%-25% 42,125,000$ 9,100,000$ 33,025,000$ 213,145,000$
1 - Match is required only on the first $75 million of each capital outlay project; consists of previous years' match funds and 2014-15 match funds.2 - Institutional funding expended in 2012-13 and/or 2013-14 for project planning.3 - Project includes improvements on TCAT campuses in Chattanooga, Jackson, Paris and Shelbyville.4 - Planning funds for this project are being disclosed for 2014-15. If state funding is not appropriated in 2014-15 for this project, UTC will use $2M in institutional funds to begin planning the project for a future year.
ATTACHMENT II2014-15 THEC Capital Outlay Projects Recommendation
D + E = C
4

THECPriority
SystemPriority
System Institution Project Name Total Project Cost
State Request Project Description
1 1 UT UTK Science Laboratory Facility (Cumberland & 13th St.)
$ 96,000,000 $ 77,250,000 This project will provide a new, approximately 222,000 Gross Square Foot, multidisciplinary science laboratory facility at Cumberland Avenue and 13th Street. This facility will house research and teaching laboratories, associated support services, faculty and departmental offices, and a vivarium. In Fiscal Year 2012-13, $3 million was approved for Planning of this project.
2 1 TBR Volunteer Humanities Building $ 30,200,000 $ 27,180,000 Provide a new 76,425 square foot Humanities Building with classrooms, studios, laboratories and faculty and administrative office space, in support of the College's university-parallel, general education, developmental studies, and career programs. Expand related supporting facilities in the Maintenance Building by about 12,000 square feet and in the Information Technologies section of the "W" building by about 2,000 square feet.
3 2 TBR Columbia Williamson County Center Relocation
$ 38,500,000 $ 34,650,000 This project will construct a facility to meet the objective of providing educational programs to serve an estimated headcount of 2,600 and FTE of 2,000. Enrollment exceeds capacity at the current facility and design of this space is inadequate for current use. Any renovation costs to rectify these issues would exceed replacement costs. Suitable land for this project was acquired in 2011-12 as a line-item appropriation.
4 3 TBR TCATs TCAT Improvements $ 17,940,000 $ 17,043,000 This project includes improvements on TCAT campuses in Chattanooga, Jackson, Paris and Shelbyville. In Chattanooga, it will provide for a 3,240 square foot greenhouse, 1,200 square foot wintering house, and a 2,773 square foot head house. In Jackson, it will provide more training spaces in the lab areas for commercial equipment needed for training. In Paris, it will add classroom and lab space for the Industrial Maintenance, Industrial Electronics, Surgical Technology, Business Systems Technology and Bookstore. In Shelbyville, it will add administrative offices, Computer Operations classrooms, 2 computer labs, Allied Health classroom and an Allied Health laboratory.
5 2 UT UTC Academic Classroom Building Renovation (Lupton/Fine Arts)
$ 35,000,000 $ 26,250,000 This project will provide expanded floor space for the Departments of Art, Theater, Music, general classrooms and liberal arts department offices through the renovation of the existing Lupton Library and the Fine Arts Center. The 116,000 square foot existing library renovation project includes replacement of all mechanical, electrical and plumbing systems. Building finishes, fire alarm and lighting to be replaced. Life Safety code upgrades are included as necessary. The building will include a combination of general classrooms, Arts & Science offices and other academic spaces. This project would also renovate the existing Fine Arts Center which contains 72,300 square feet of space. The building's structural, ceiling, lighting, HVAC and telecommunications systems will be upgraded as well. The two large theaters and adjacent costume shop will be brought up to current ADA code requirements. Also, included is building-out of existing two-story spaces in the art, theater and music wings.
6 4 TBR APSU Fine Arts Improvements $ 20,630,000 $ 15,472,000 This project will renovate and expand the Trahern Building to provide a creative and improved functional environment for the Art and Theatre Departments. It will also provide for the total replacement of the HVAC system to provide for cooling and humidity control in the ground level shops and laboratories. Site work and building configuration will include a visually screened sculpture courtyard, landscaping and loading docks.
7 5 TBR Jackson Health Sciences Building $ 17,000,000 $ 15,300,000 This project will provide space for existing Allied Health programs on campus that require room for expansion. It will also provide for new facilities for new programs. By relocating Allied Health programs to this new 44,000 gross square footage building, existing space on campus will be freed up for other instructional use. Building was identified in the 2013 Master Plan as the top future capital outlay project for the campus.
ATTACHMENT IIITHEC 2014-15 Capital Outlay Projects Descriptions
5

Tennessee Board of Regents Total Tennessee Board of Regents (continued) TotalTCATs TCAT Roof Replacements (Statewide) $1,700,000 Pellissippi Window Replacements (Several Buildings) $300,000
UM Building Code and Safety Updates A (Several Buildings) 3,000,000 Cleveland Testing and Advising Center Updates 350,000Northeast Student Services Roof and Exterior Repairs 270,000 TCATs TCAT Restroom Repairs (Statewide) 600,000
Jackson McWherter Roof and Envelope Repairs 720,000 Cleveland Nursing Department Lab Modernization 350,000MTSU Chiller and Tower Replacement (Absorption Chiller Facility) 1,320,000 ETSU Memorial Center Code Updates 2,500,000ETSU Elevator Updates (Several Buildings) 1,500,000 ETSU Accessibility and Code Corrections 2,000,000
Chattanooga Cooling Tower Replacement (Central Energy/Chiller Plant) 550,000 UM Various Roof Replacements Phase II 2,100,000Volunteer Mattox Building HVAC Updates 400,000 MTSU Peck Hall HVAC Update 1,200,000
TSU Campuswide Elevator Replacements Phase I 2,250,000 TSU Campuswide Elevator Replacements Phase II 2,250,000Cleveland Elevator Modernizations (Several Buildings) 600,000 MTSU Jones Hall Plumbing Updates 1,300,000
APSU Claxton Building HVAC Corrections 1,630,000 ETSU College of Medicine Clinical Education Building HVAC Replacement 1,400,000Roane Several Buildings HVAC Corrections 610,000 MTSU Campus Stormwater Plan 720,000
Southwest Union Campus Mechanical Systems Updates 1,100,000 Walters Greeneville Campus Mechanical Corrections 760,000TCATs TCAT Chiller Replacements (Statewide) 850,000 APSU Music Mass Communications HVAC Replacement Phase II 1,500,000
Motlow Central Power Plant Chiller Replace 920,000 TSU Tunnel Utility Piping Updates 2,500,000Dyersburg Glover and Eller Buildings Mechanical Updates Phase I - B 660,000 Chattanooga Electrical Updates (Several Buildings) 800,000Columbia Warf Building HVAC Updates 1,480,000 TCATs TCAT Maintenance Repairs and Corrections (Statewide) 1,670,000Walters Site Corrections (New Traffic Patterns around Several Buildings) 740,000 2014-15 TBR Total $69,050,000
TTU Several Buildings Upgrades A 1,710,000Pellissippi Division Street Codes and Repairs 500,000 University of Tennessee Total
ETSU Roof Replacements (Several Buildings) 1,500,000 UTM Upgrade Steam Lines $4,100,000TTU Roof Replacements (Volpe Library and Clement Hall) 700,000 UTC Utility Distribution System Expansion 5,300,000
MTSU Electrical Updates (Several Buildings) 1,300,000 UTK Chiller System Improvements (Several Chiller Facilities) 5,000,000ETSU Valleybrook Building System Replacement 1,300,000 UTIA ETREC-Little River Animal and Environmental Research Unit Waste Handling Improvements 1,400,000TTU Roaden University Center Electricity Updates A 800,000 UTHSC Link Building HVAC Improvements 3,000,000TSU Building Updates (Several Buildings) 1,000,000 UTC Building Exterior Repairs (Several Buildings) 2,500,000UM Envelope Repairs A Phase I (Several Buildings) 2,000,000 UTIA Research and Education Center Greenhouse Improvements 1,300,000
Pellissippi Paving Repairs (Hardin Valley and Strawberry Plains campuses) 500,000 UTK Science Engineering System Improvements 9,000,000Chattanooga Parking Lot Updates (Omniplex and Center for Media Technology) 850,000 UTM Clement Building System Improvements 7,000,000
TCATs TCAT Parking and Paving Repairs (Statewide) 1,160,000 UTC Elevator Improvements (Several Buildings) 2,600,000UM Various Roof Replacements Phase I 2,000,000 UTK/UTSI UTSI Building Improvements (Several Buildings) 4,500,000
Roane Technology Building Roof Replacement 200,000 2014-15 UT Total $45,700,000ETSU College of Medicine Sprinkler Updates (Several Buildings) 750,000MTSU HVAC and Control Updates (Bell Street Building and Central Plant) 920,000MTSU Domestic Water-Sewer Systems Updates (Campuswide) 610,000
Volunteer HVAC Updates (Several Buildings) 500,000APSU Music Mass Communications HVAC Replace Phase I 1,000,000
Walters Chiller and Cooling Tower Replacement 750,000Southwest Mechanical Systems Modernization (HVAC Updates for Several Buildings) 1,100,000
MTSU Exterior Repairs (Several Buildings) 1,320,000UM Envelope Repairs A Phase II (Several Buildings) 2,000,000TTU Several Buildings Waterproof & Exterior Repairs 1,770,000
Northeast Faculty Building Glass Replacement 210,000
ATTACHMENT IVTHEC 2014-15 Capital Maintenance Projects Recommendation
TotalTBR 60 $69,050,000
Projects
Total 71 $114,750,000
UT 11 $45,700,000
6

TENNESSEE BOARD OF REGENTSNew
Institution Project Funding Source Project Cost Sq.Ft. TSSBA Gifts Grants Auxiliary Operating
APSU Foy Center Expansion Plant Funds Auxiliary $ 8,700,000 23,000 $ - $ - $ - $ 8,700,000 $ -
ETSUAthletic Weight Room Renovations
Gifts $ 300,000 0 $ - $ 300,000 $ - $ - $ -
ETSU Outdoor Track and Field Facility Plant Funds Auxiliary - Athletics & Gifts
$ 4,200,000 0 $ - $ 4,185,000 $ - $ 15,000 $ -
TSU Hale Stadium Upgrades Plant Funds Non-Auxiliary $ 500,000 0 $ - $ - $ - $ - $ 500,000
TSU Incubation Center Construction Plant Funds Non-Auxiliary & Gifts
$ 2,500,000 40,000 $ - $ 500,000 $ - $ - $ 2,000,000
TSUMcMinnville Nursery Crop Research Station Expansion
Federal Grant $ 5,500,000 10,000 $ - $ - $ 5,500,000 $ - $ -
UM Public Health Upgrades Plant Funds Non-Auxiliary $ 1,350,000 0 $ - $ - $ - $ - $ 1,350,000
Cleveland Field Lighting Updates Plant Funds Non-Auxiliary $ 350,000 0 $ - $ - $ - $ - $ 350,000
Northeast Campus Security Enhancements Plant Funds Non-Auxiliary $ 250,000 0 $ - $ - $ - $ - $ 250,000
PellissippiStudent Recreation Center Upgrades
Plant Funds - Auxiliary - Student Fees
$ 300,000 700 $ - $ - $ - $ 300,000 $ -
PellissippiMagnolia Courtyard Improvements
Plant Funds Non-Auxiliary & Plant Funds-Auxiliary-Student Fees
$ 250,000 0 $ - $ - $ - $ 10,000 $ 240,000
Pellissippi Magnolia Print Shop Relocation Plant Funds Non-Auxiliary $ 150,000 0 $ - $ - $ - $ - $ 150,000
PellissippiHardin Valley Courtyard Improvements
Plant Funds Non-Auxiliary & Plant Funds-Auxiliary-Student Fees
$ 1,950,000 0 $ - $ - $ - $ 50,000 $ 1,900,000
VolunteerPaving Repairs and Front Entrance Upgrades
Plant Funds Non-Auxiliary $ 3,000,000 0 $ - $ - $ - $ - $ 3,000,000
Volunteer Duffer Plaza Site Improvements Plant Funds Non-Auxiliary $ 700,000 0 $ - $ - $ - $ - $ 700,000
Walters Maples Marshall Improvements Gifts $ 420,000 0 $ - $ 420,000 $ - $ - $ -
Walters Public Safety Center Corrections Plant Funds Non-Auxiliary $ 270,000 0 $ - $ - $ - $ - $ 270,000
17 Projects 30,690,000$ 73,700 -$ 5,405,000$ 5,500,000$ 9,075,000$ 10,710,000$
ATTACHMENT VTHEC Disclosure of Revenue-Funded Capital Projects 2014-15
TOTAL TBR DISCLOSED PROJECTS
7

UNIVERSITY OF TENNESSEENew
Institution Project Funding Source Project Cost Sq.Ft. TSSBA Gifts Grants Auxiliary Operating
UTC Disability Resource Center Plant Funds - Non-Auxiliary $ 800,000 5,300 $ - $ - $ - $ - $ 800,000
UTCFootball Training Facility - Phase II (Planning)
Plant Funds-Auxiliary-Athletics
$ 1,000,000 60,300 $ - $ - $ - $ 1,000,000 $ -
UTHSCPharmacy Building - Completion of Basement
Plant Funds - Non-Auxiliary $ 3,000,000 4,300 $ - $ - $ - $ - $ 3,000,000
UTIABiosystems Engineering Learning & Innovation Hub
Plant Funds - Non-Auxiliary $ 350,000 1,800 $ - $ - $ - $ - $ 350,000
UTKParking Garages/Parking Lots Repairs (2014-2015)
Plant Funds - Auxiliary - Parking
$ 1,000,000 0 $ - $ - $ - $ 1,000,000 $ -
UTKDining Services Improvements (2014-2015)
Plant Funds - Auxiliary - Food Service
$ 750,000 0 $ - $ - $ - $ 750,000 $ -
UTKEnvironmental Initiatives (2014-2015)
Plant Funds - Non-Auxiliary $ 1,500,000 0 $ - $ - $ - $ - $ 1,500,000
UTKCampus Beautification Projects (2014-2015)
Plant Funds - Non-Auxiliary $ 4,000,000 0 $ - $ - $ - $ - $ 4,000,000
UTKClassroom Upgrades (2014-2015)
Plant Funds - Non-Auxiliary $ 5,000,000 0 $ - $ - $ - $ - $ 5,000,000
UTKUniversity Avenue Buildings Improvements
Plant Funds - Non-Auxiliary $ 2,100,000 44,800 $ - $ - $ - $ - $ 2,100,000
Projects disclosed for TSSBA funding NewInstitution Project Funding Source Project Cost Sq.Ft. TSSBA Gifts Grants Auxiliary Operating
UTC Lighting Upgrades TSSBA $ 2,700,000 0 $ 2,700,000 $ - $ - $ - $ -
UTC Retrofit State Buildings Plant Funds - Non-Auxiliary & TSSBA
$ 4,000,000 258,300 $ 2,350,000 $ - $ - $ - $ 1,650,000
UTK Arena Renovations and RepairsPlant Funds - Non-Auxiliary & TSSBA
$ 15,000,000 405,953 $ 13,000,000 $ - $ - $ - $ 2,000,000
UTK Replacement Residence HallPlant Funds-Auxiliary-Housing & TSSBA
$ 127,000,000 400,000 $ 120,000,000 $ - $ - $ 7,000,000 $ -
UTK New Student Housing Plant Funds-Auxiliary-Housing/Dining & TSSBA
$ 65,400,000 250,000 $ 58,400,000 $ - $ - $ 7,000,000 $ -
Capital Outlay Match Funds NewInstitution Project Funding Source Project Cost Sq.Ft. TSSBA Gifts Grants Auxiliary Operating
UTCAcademic Classroom Building Renovation (Lupton/Fine Arts) (Planning)
Gifts $ 2,000,000 198,049 $ - $ 2,000,000 $ - $ - $ -
UTKEngineering Services Facility (Planning)
Plant Funds - Non-Auxiliary & Gifts
$ 3,000,000 21,900 $ - $ - $ - $ - $ 3,000,000
17 Projects 238,600,000$ 1,650,702 196,450,000$ 2,000,000$ -$ 16,750,000$ 23,400,000$
34 Projects 269,290,000$ 1,724,402 196,450,000$ 7,405,000$ 5,500,000$ 25,825,000$ 34,110,000$
TOTAL UT DISCLOSED PROJECTS
TOTAL TBR & UT DISCLOSED PROJECTS
ATTACHMENT VTHEC Disclosure of Revenue-Funded Capital Projects 2014-15
8

A B C D = (A * B) - C E = A - C - DTotal Target Planning Match Funds State Funds
TBR Capital Outlay Out Years Project Cost Match Funds1 Less Planning2 RequestETSU Fine Arts Classroom Building3 $39,200,000 25% $1,500,000 $8,300,000 $29,400,000TSU Library Addition and Renovation 16,580,000 25% $1,000,000 3,145,000 12,435,000TTU New Chemistry Building and Infrastructure 81,750,000 25% $4,000,000 14,750,000 63,000,000ETSU Lamb Hall Renovation 21,050,000 25% TBD from Match 5,262,500 15,787,500UM Biochemistry and Biology Facility 33,800,000 25% $1,200,000 7,037,500 26,762,500
MTSU Academic Classroom Building 28,500,000 25% TBD from Match 7,125,000 21,375,000Statewide Community Colleges Additions and Renovations 28,730,000 10% TBD from Match 2,873,000 25,857,000Statewide TCATs Additions and Renovations 12,700,000 5% TBD from Match 635,000 12,065,000Statewide Un-prioritized Projects 150,000,000 150,000,000Statewide Un-prioritized Projects 150,000,000 150,000,000TBR Total $523,110,000 5% - 25% TBD from Match $40,828,000 $477,282,000
Target Full Planning Match Funds State FundsUT Capital Outlay Out Years Total Match Funds1 Less Planning2 Request
UTIA Energy and Environmental Science Building3 $72,750,000 10% $2,000,000 $5,275,000 $65,475,000UTK Engineering Services Facility3 98,000,000 25% TBD from Match 18,750,000 79,250,000UTM Classroom and Laboratory Renovation and Addition 55,000,000 25% TBD from Match 13,750,000 41,250,000UTK Academic and Instructional Support Facility (Melrose) 84,000,000 25% $3,000,000 15,750,000 65,250,000UTIA Interdisciplinary Residential and Education Greenhouses 4,000,000 10% TBD from Match 400,000 3,600,000UTK Life Sciences and Laboratory Facility (Walters) 110,000,000 25% $3,000,000 15,750,000 91,250,000UTC Life Sciences Laboratory Building 59,500,000 25% $3,000,000 11,875,000 44,625,000UTM Fine Arts Renovation and Addition Phase II 14,600,000 25% $500,000 3,150,000 10,950,000UTC Health Sciences Laboratory Facility 55,300,000 25% TBD from Match 13,825,000 41,475,000UTK Classroom and Laboratory Facility (Harris) 40,000,000 25% TBD from Match 10,000,000 30,000,000
UTHSC Medicine/Administration Building 60,000,000 10% TBD from Match 6,000,000 54,000,000UTK Nursing Building Renovation and Addition 45,800,000 25% TBD from Match 11,450,000 34,350,000UTIA West Tennessee 4-H Center Replacement Project 36,000,000 10% TBD from Match 3,600,000 32,400,000
UTHSC Dentistry Faculty Practice/Research Building 18,000,000 10% TBD from Match 1,800,000 16,200,000UTC Communications Classroom Building 24,000,000 25% TBD from Match 6,000,000 18,000,000
UT Total $776,950,000 TBD from Match $137,375,000 $628,075,000
Target Full Planning Match Funds State FundsCapital Maintenance Out Years Total Match Funds1 Less Planning2 RequestTBR Total $127,790,000 NA $0 $0 $127,790,000UT Total $291,750,000 NA $0 $0 $291,750,000
Target Full Planning Match Funds State FundsTotal Out Years Total Match Funds1 Less Planning2 RequestTotal Capital Outlay Out Years 2015-16 through 2018-19 $1,300,060,000 5%-25% TBD from Match $178,203,000 $1,105,357,000Total Capital Maintenance Out Years 2015-16 through 2018-19 $419,540,000 $0 $0 $419,540,000Total Capital Investment 2015-16 through 2018-19 $1,719,600,000 TBD from Match $178,203,000 $1,524,897,000
2 - Match is required only on the first $75 million of each capital outlay project.3 - These projects were recommended by their respective systems for 2014-15.
1 - Full planning funds come from the institutional match. Some planning funds have not yet been broken out from total match funds. All UT projects with full planning funds identified expended those funds in 2012-13. The TSU Library Addition and Renovation and TTU New Chemistry Building expended planning funds in 2013-14. The UM Biochemistry and Biology Facility expended planning funds in the 2011-12 funding cycle, after the matching policy was implemented in spring 2012.
Institution Funds
ATTACHMENT VITHEC Five-Year Plan for Capital Projects - Out Years Summary
2015-16 through 2018-19
9

Tennessee Board of Regents Total Tennessee Board of Regents (continued) Total2015-16 UM Electrical Updates $4,500,000 2017-18 TSU Campus Plumbing Updates $2,000,0002015-16 Jackson Elevator Modernization 730,000 2017-18 TCAT Hartsville Campus HVAC Updates 580,0002015-16 Cleveland Electrical Infrastructure Modernization 500,000 2017-18 TTU Health and Physical Education Building Mechanical Replacement A 3,100,0002015-16 ETSU College of Medicine Building 178 Mechanical Updates 2,000,000 2017-18 TCAT Hartsville Electrical Updates 840,0002015-16 UM Envelope Repairs B 4,000,000 2017-18 TCAT Athens Welding Ventilation/Exhaust Installation 130,0002015-16 MTSU Campus Sidewalk Repairs 500,000 2017-18 TCAT McKenzie Plumbing Repairs 140,0002015-16 TTU Several Buildings Upgrades B 1,440,000 2017-18 TCAT Whiteville Boiler and HVAC Replacement 150,0002015-16 Motlow Simon Hall Flooring Updates 380,000 2017-18 TCAT Athens Chiller Replacement 160,0002015-16 Walters Expo Center Access Corrections 750,000 2017-18 TCAT Memphis Aviation HVAC Updates 170,0002015-16 Roane Oak Ridge Campus Roof Replacement 1,140,000 2017-18 TCAT Pulaski Administration/Classroom HVAC Update 200,0002016-17 Cleveland Several Buildings Roof Replacement 450,000 2017-18 APSU Dunn Center HVAC Updates 3,080,0002016-17 TTU Campus Steam Line Replacement 3,220,000 2017-18 Walters Humanities Corrections 1,000,0002016-17 Columbia Powerhouse System Repairs 260,000 2017-18 TSU Underground Utility Updates 2,500,0002016-17 Dyersburg Glover and Eller Buildings Mechanical Updates Phase II 320,000 2017-18 TTU Roaden University Center Electricity Updates C 3,160,0002016-17 APSU Campus Fire Alarm Modernization Phase I 1,200,000 2017-18 TCAT Elizabethton Herman Robinson Campus HVAC Repairs 550,0002016-17 ETSU Campuswide Water Line Repairs 2,200,000 2017-18 TSU Electrical Distribution Updates 2,500,0002016-17 UM Academic Facilities HVAC Replacement 5,500,000 2017-18 TTU Derryberry Hall Systems Replacement B 3,160,0002016-17 Jackson Administration Building HVAC System Update 390,000 2017-18 TSU Campus Center Updates 2,500,0002016-17 Motlow Underground Utility Lines Replacement 1,060,000 2017-18 TTU Health and Physical Education Building Mechanical Replacement B 3,100,0002016-17 Volunteer Paving Updates 860,000 2018-19 TSU Instructional Technology Infrastructure Updates 2,500,0002016-17 Southwest Macon Academic Building Envelope Corrections 1,100,000 2018-19 TTU Roaden University Center Electricity Updates D 2,440,0002016-17 TSU Entrance Colonnade Repairs 2,500,000 2018-19 Motlow Marcum Building HVAC Modernization 90,0002016-17 TCAT Dickson Americans with Disabilities Act Accessibility Corrections 160,000 2018-19 Motlow Central Power Plant Boiler Modernization 1,020,0002016-17 TCAT Hartsville Tri-County Extension Campus Accessibility and Codes Corrections 250,000 2018-19 Motlow Center Power Plant Motor Replacements 200,0002016-17 UM Building Code and Safety Updates B 4,000,000 2018-19 Motlow McMinnville Campus Geothermal Modernization 730,0002016-17 UM Various Buildings Asbestos Abatement 1,000,000 2018-19 Motlow Fayetteville Campus Geothermal Modernization 610,0002016-17 Roane O'Brien Building Roof Replacement 360,000 2018-19 TCAT Memphis Pavement Updates 40,0002016-17 Walters Sevier County Campus Roof Replacement 750,000 2018-19 TCAT Athens Bay Door Replacements 80,0002016-17 TCAT Morristown Hawkins County Campus Roof Replacement 260,000 2018-19 TCAT Whiteville Pavement and Sidewalk Repairs 470,0002016-17 TCAT Covington Exterior and Interior Moisture Remediation 300,000 2018-19 TSU Campus Window Replacements 1,500,0002016-17 APSU Library Roof Replacement 1,800,000 2018-19 TCAT Athens Storage Building Updates 110,0002016-17 TCAT Hartsville Underground Utility Line Replacements 330,000 2018-19 TCAT Dickson Campus Entrance Relocation 950,0002016-17 TCAT Chattanooga Shop HVAC Updates 1,250,000 2018-19 TCAT Ripley Campus Parking Lot Updates 80,0002016-17 APSU Campus Fire Alarm Modernization Phase II 1,100,000 2018-19 TCAT Covington Paving Updates 90,0002016-17 TTU Roaden University Center Electricity Updates B 3,160,000 2018-19 Walters Claiborne County Exterior Updates 700,0002016-17 ETSU Mechanical Repair and Replacement 2,200,000 2018-19 Roane Campuswide Paving 460,0002016-17 Dyersburg Gym Mechanical Updates 330,000 2018-19 TCAT Hartsville Campus Exterior and Interior Repairs 960,0002016-17 Cleveland Underground Utility Lines Modernization 250,000 2018-19 TSU Access Control and Locking Updates 3,000,0002016-17 TCAT Covington Electrical Updates 220,000 2018-19 TCAT Ripley Door and Hardware Replacement 190,0002017-18 Walters Campuswide Mechanical Updates 750,000 2018-19 TCAT Elizabethton Herman Robinson Campus Updates 250,0002017-18 TSU Several Buildings HVAC Updates 1,750,000 2018-19 Motlow Exterior Building Repairs 1,220,0002017-18 Roane Dunbar Building Elevator Replacement 440,000 2018-19 Motlow Parking and Roadway Repairs 1,010,0002017-18 ETSU Electrical Repair and Replacement 2,500,000 2018-19 TSU McMinnville Campus Roof and Envelope Repairs 2,500,0002017-18 UM Several Buildings HVAC System Updates 4,550,000 2018-19 TTU Several Buildings Waterproof and Exterior Repairs 2,700,0002017-18 TCAT Athens Campus Boiler Replacement 50,000 2018-19 TCAT Ripley Campus Flooring Updates 170,0002017-18 Dyersburg Gibson County Center HVAC Updates 260,000 2018-19 TCAT Chattanooga Auto Body Shop Interior Corrections 350,0002017-18 ETSU Several Buildings Systems Repair 1,000,000 2018-19 UM Wilder Tower Updates 4,900,0002017-18 APSU Browning Building Mechanical Updates 1,700,000 2018-19 Motlow Several Buildings Interior Repairs 570,0002017-18 TTU Derryberry Hall Systems Replacement A 3,160,000 97 Projects $127,790,000
ATTACHMENT VIITHEC Five-Year Plan for Capital Maintenance Projects - Out Years 2015-16 through 2018-19
TBR Out Years Total
10

Total University of Tennessee (continued) Total
2015-16 UTK Electrical Distribution Improvements $3,500,000 2017-18 UTIA Research and Education Centers Shop and Equipment Storage Improvements $1,500,0002015-16 UTIA Research and Education Centers Roof Replacement 1,200,000 2017-18 UTK Utility and Energy Conservation 10,000,0002015-16 UTC Roof Replacements 3,300,000 2017-18 UTM Upgrade Electrical System Campuswide 2,500,0002015-16 UTIA College of Veterinary Medicine Building Improvements 4,900,000 2017-18 UTK Window Replacements 10,000,0002015-16 UTK Dabney/Buehler System Upgrade 9,000,000 2017-18 UTIA Research and Education Centers Utility Improvements 350,0002015-16 UTM Sociology Building HVAC Upgrade 2,900,000 2017-18 UTK Sidewalk Repairs 5,000,0002015-16 UTK HVAC Controls System Consolidation 9,000,000 2018-19 UTM Energy Management System 2,500,0002015-16 UTC Brock Hall Improvements 3,900,000 2018-19 UTK Sanitary and Storm Improvements 10,000,0002015-16 UTIA Ridley 4-H Improvements 3,800,000 2018-19 UTIA Research and Education Centers Headquarters Improvements 1,500,0002015-16 UTK Andy Holt Tower - Systems Upgrades/Controls and Equipment 6,100,000 2018-19 UTM Elam Center Roof Replacement 1,300,0002015-16 UTC Electrical Distribution 3,000,000 2018-19 UTK Water Distribution System Upgrades 10,000,0002015-16 UTHSC Elevator Improvements 4,150,000 2018-19 UTK Lighting Upgrades 5,000,0002016-17 UTM Library System Improvements 4,000,000 2018-19 UTK Flooring Replacements 5,000,0002016-17 UTK Electricity Distribution System Improvements 14,000,000 2018-19 UTK Asbestos Removal 8,000,0002016-17 UTIA Research and Education Centers Paving and Fence Improvements 2,300,000 2018-19 UTK Roof Repairs and Replacement 6,000,0002016-17 UTC Cadek Hall Improvements 1,800,000 2018-19 UTK Masonry and Structural Repair 6,000,0002016-17 UTM Hall Moody Improvements 8,000,000 2018-19 UTK Dunford Hall System Upgrades 6,000,0002016-17 UTHSC Restroom Improvements 2,000,000 2018-19 UTK McClung Museum - System Upgrades 6,000,0002016-17 UTIA Reinstate Handling and Facilities Improvements 1,400,000 2018-19 UTK Conference Center Building System Upgrade 12,000,0002016-17 UTC Guerry Center Improvements 2,000,000 2018-19 UTK Health and Physical Education Building (HPER) System Upgrades 8,000,0002016-17 UTK Communications and Student System Improvements 12,000,000 2018-19 UTK Nielsen Physics - System Upgrade 6,000,0002016-17 UTK High Pressure Chiller Replacement 3,000,000 60 Projects $291,750,000 2016-17 UTIA Blount Farm Improvements 2,300,0002016-17 UTC Maclellan Gym Improvements 2,000,000 Projects Total2016-17 UTIA Research and Education Centers Livestock Facilities Improvements 1,200,000 97 TBR Total Capital Maintenance Projects Out Years $127,790,0002016-17 UTC Pfeiffer Hall Improvements 2,000,000 60 UT Total Capital Maintenance Projects Out Years $291,750,0002016-17 UTK Steam Distribution System Improvements 6,000,000 157 Total Capital Maintenance Projects Out Years $419,540,0002016-17 UTM McCombs Building - HVAC Upgrades 3,500,0002016-17 UTC Patten and Danforth Chapel Improvements 2,250,0002017-18 UTIA Research and Education Centers Livestock Waste Handling Improvement 1,000,0002017-18 UTM Elam Center HVAC Upgrades 5,100,0002017-18 UTC McKenzie Arena Improvements 6,800,0002017-18 UTIA Research and Education Centers Feed Storage and Systems Improvements 1,000,0002017-18 UTK Elevator Upgrades 6,000,0002017-18 UTM West Tennessee Agriculture Pavilion/Stalling Facility - Improvements 3,000,0002017-18 UTIA Research and Education Centers and 4-H Center Residence Improvements 2,500,0002017-18 UTK Fire Safety Upgrades 15,000,0002017-18 UTM Agriculture Teaching Facilities Upgrades 2,300,0002017-18 UTC Hunter Hall Improvements 1,900,000
UT Out Years Total
ATTACHMENT VIITHEC Five-Year Plan for Capital Maintenance Projects - Out Years 2015-16 through 2018-19
University of Tennessee
11

Total Project Total State Funds Total Project Total State FundsCost Projects Match Funds 1 Request Cost Projects Match Funds 1 Request
Capital CapitalMaintenance Maintenance
TBR $69,050,000 60 $0 $69,050,000 TBR $15,940,000 10 $0 $15,940,000UT $45,700,000 11 $0 $45,700,000 UT $54,750,000 12 $0 $54,750,000
Total $114,750,000 71 $0 $114,750,000 Total $70,690,000 22 $0 $70,690,000
Capital Outlay Capital OutlayTBR $124,270,000 5 $14,625,000 $109,645,000 TBR $192,380,000 5 $46,195,000 $104,835,000UT $131,000,000 2 $27,500,000 $103,500,000 UT $423,750,000 6 $77,675,000 $346,075,000
Total $255,270,000 7 $42,125,000 $213,145,000 Total $616,130,000 11 $123,870,000 $450,910,000
Full Planning Full PlanningTBR $0 - $0 $0 TBR TBD from Match TBD $0UT $133,000,000 2 $27,500,000 $0 UT TBD from Match TBD $0
Total $133,000,000 2 $27,500,000 $0 Total $0 TBD $0
Total Capital Total CapitalInvestment $503,020,000 80 $69,625,000 $327,895,000 Investment $686,820,000 33 $123,870,000 $521,600,000
Total Project Total State Funds Total Project Total State FundsCapital Cost Projects Match Funds 1 Request Capital Cost Projects Match Funds 1 Request
Maintenance MaintenanceTBR $36,780,000 29 $0 $36,780,000 TBR $45,180,000 29 $0 $45,180,000UT $69,750,000 17 $0 $69,750,000 UT $73,950,000 16 $0 $73,950,000
Total $106,530,000 46 $0 $106,530,000 Total $119,130,000 45 $0 $119,130,000
Capital Outlay Capital OutlayTBR $69,930,000 3 $10,633,000 $59,297,000 TBR $150,000,000 10 TBD $150,000,000UT $129,400,000 3 $32,350,000 $97,050,000 UT $145,800,000 3 $27,450,000 $118,350,000
Total $199,330,000 6 $42,983,000 $156,347,000 Total $295,800,000 13 $27,450,000 $268,350,000
Full Planning Full PlanningTBR TBD from Match TBD $0 TBR TBD from Match TBD $0UT TBD from Match TBD $0 UT TBD from Match TBD $0
Total $0 $0 $0 Total $0 $0 $0
Total Capital Total CapitalInvestment $305,860,000 52 $42,983,000 $262,877,000 Investment $414,930,000 58 $27,450,000 $387,480,000
Total Project Total State Funds Total Project Total State FundsCapital Cost Projects Match Funds 1 Request Capital Cost Projects Match Funds 1 Request
Maintenance MaintenanceTBR $29,890,000 29 $0 $29,890,000 TBR $196,840,000 157 $0 $196,840,000UT $93,300,000 15 $0 $93,300,000 UT $337,450,000 71 $0 $337,450,000
Total $123,190,000 44 $0 $123,190,000 Total $534,290,000 228 $0 $534,290,000
Capital Outlay Capital OutlayTBR $150,000,000 10 TBD $150,000,000 TBR $686,580,000 33 $71,453,000 $615,127,000UT $78,000,000 3 $11,400,000 $66,600,000 UT $907,950,000 17 $176,375,000 $731,575,000
Total $228,000,000 13 $11,400,000 $216,600,000 Total $1,594,530,000 50 $247,828,000 $1,346,702,000
Full Planning Full PlanningTBR TBD from Match TBD $0 TBR $0 - $0 $0UT TBD from Match TBD $0 UT $133,000,000 2 $27,500,000 $0
Total $0 $0 $0 Total $133,000,000 2 $27,500,000 $0
Total Capital Total CapitalInvestment $351,190,000 57 $11,400,000 $339,790,000 Investment $2,261,820,000 280 $275,328,000 $1,880,992,000
1- Match is required only on the first $75 million of capital outlay projects.
ATTACHMENT VIII
2014-15 through 2018-19THEC Five-Year Capital Plan
2017-18
2018-19 Five-Year Total
2014-15 (See Detailed Summary in Attachment I) 2015-16
2016-17
12

Agenda Item: I. F. DATE: November 14, 2013 SUBJECT: 2014 Improving Teacher Quality Grant Awards ACTION RECOMMENDED: Approval BACKGROUND INFORMATION: Operating as Title II of the No Child Left Behind Act, the Improving Teacher Quality Grant Program is a federally funded program which provides grants to public and private higher education institutions and non-profit organizations. Administered in Tennessee by the Tennessee Higher Education Commission, these grants are designed to conduct professional development for in-service K-12 teachers. In accordance with the state’s adoption of the Common Core State Standards in Reading: Literature and Informational Text, THEC and the Tennessee Department of Education jointly developed the Request for Proposals which focused on providing high quality professional development in grades 6-12. Institutions prepared proposals to demonstrate their ability to provide a summer workshop, along with sustained activities throughout the school year, to grade 6-12 teachers. Proposals were allowed a maximum funding level of $75,000. Projects will be funded for the period January 1, 2014 to December 31, 2014. An advisory committee consisting of both K-12 and higher education experts was constituted to review grant proposals and make funding recommendations to the Commission. This year’s Advisory Committee is listed on Attachment A. Attachment B presents the 12 projects recommended by the Advisory Committee. The grant review process is described on Attachment C to this agenda item. All grant proposals are available for review at the Commission office.
T E N N E S S E E
H I G H E R
E D U C A T I O N
C O M M I S S I O N

2
Attachment A 2014 Improving Teacher Quality
Advisory Committee
Emily Carter
Statewide Collaborative on Reforming Education
Melissa Canney Tennessee Department of Education
Scott Eddins
Tennessee State Board of Education
India Lane University of Tennessee
Tiffany McDole
Tennessee Department of Education
Patrick Meldrim Tennessee Independent Colleges and Universities Association
Kathryn Meyer
Tennessee Higher Education Commission
David Sevier Tennessee State Board of Education
Vanita Sherrill-Lyell Citizen Representative
DeAnna Stacey
Tennessee Board of Regents
Melissa Stugart Tennessee Higher Education Commission
Tarol Wells
Memphis City Schools
Brad Windley Citizen Representative

3
Attachment B 2014 Improving Teacher Quality
Proposal Review Process On August 1, 2013, a memo from Dr. Rhoda and the Request for Proposals (RFP) for the Improving Teacher Quality Grants was distributed to college and university chancellors, presidents, deans, and faculty. A contact at each teacher preparation institution was sent the RFP. The RFP included the background of ITQ grants, federal requirements, funding priorities as determined by THEC, a description of eligible partners (including a list of high-need school districts), competition guidelines, grant timeline, evaluation rubric, and all appropriate forms to be completed for proposals. A Notice of Intent to Submit was due via email by September 9, 2013 and completed grant proposals were due to THEC on October 7, 2013 by 4:30 p.m. CST. THEC staff distributed the grant proposals to the Advisory Committee for review prior to the committee meeting on November 5, 2013. The committee was divided into teams to individually evaluate proposals. The teams met separately in small groups to discuss their assigned grants and score the grants according to the evaluation rubric. Proposals with the top scores were compiled into a master list. The entire committee could pose questions about the grant proposal, make recommendations or amendments, and discuss the level of funding the proposal should receive. The committee then funded the proposals based on the scored average, with necessary geographical requirements taken into account.

Agenda Item: II.A. DATE: November 14, 2013 SUBJECT: Title VI Implementation Plan Update and Compliance Report ACTION RECOMMENDED: Information BACKGROUND INFORMATION: Tennessee Code Annotated §§ 4-21-203 and 4-21-901 requires each state agency that receives federal funds was required to file a Title VI implementation plan with the Tennessee Human Rights Commission. The purpose of the plan is to show how the state agency, and the entities to which its federal funds flow, is assuring compliance of Title VI of the Civil Rights Act of 1964, which prohibits discrimination on the basis of a person’s race, color, or national origin. Staff will provide an overview of the Commission’s Title VI Plan Update and Compliance report and its key provisions that was filed with the Tennessee Human Rights Commission on September 30, 2013.
T E N N E S S E E
H I G H E R
E D U C A T I O N
C O M M I S S I O N

TENNESSEE HIGHER EDUCATION COMMISSION
TITLE VI REPORT
SEPTEMBER 30, 2013


TTTEEENNNNNNEEESSSSSSEEEEEE HHHIIIGGGHHHEEERRR EEEDDDUUUCCCAAATTTIIIOOONNN
CCCOOOMMMMMMIIISSSSSSIIIOOONNN
FISCAL YEAR 2013-2014
TITLE VI COMPLIANCE REPORT AND IMPLEMENTATION PLAN UPDATE
“Simple justice requires that public funds, to which all taxpayers of all
races contribute, not be spent in any fashion which encourages,
entrenches, subsidizes, or results in racial discrimination.” President John F. Kennedy, in his message calling
for the enactment of Title VI in 1963.

TABLE OF CONTENTS
OVERVIEW OF THE AGENCY 1
FEDERAL PROGRAMS 3
ORGANIZATION OF THE CIVIL RIGHTS OFFICE/CIVIL RIGHTS
COORDINATOR 7
DATA COLLECTION AND ANALYSIS 8
DEFINITIONS 10
DISCRIMINATORY PRACTICES 12
LIMITED ENGLISH PROFICIENCY (LEP) 13
COMPLAINT PROCEDURES 15
COMPLIANCE REVIEW 18
COMPLIANCE/NONCOMPLIANCE REPORTING 22
TITLE VI TRAINING PLAN 23
PUBLIC NOTICE AND OUTREACH 24
EVALUATION PROCEDURES OF TITLE VI IMPLEMENTATION 27
RESPONSIBLE OFFICIALS 29

Fiscal Year 2013-2014 Title VI Compliance Report 1
OVERVIEW OF THE TENNESSEE HIGHER EDUCATION
COMMISSION’S TITLE VI ENFORCEMENT PROGRAM
OVERVIEW OF THE TENNESSEE HIGHER EDUCATION COMMISSION
The Tennessee Higher Education Commission was created in 1967 for the purpose of achieving
cooperation and unity in higher education. The coordination function grew out of a nationwide
trend by governors and legislators to promote planned growth, equitable funding, and
accountability among the state’s colleges and universities.
Since that time the Commission has created funding formulae, funding initiatives based on
performance, legislative benchmarks, master plans, and criteria for new academic programs. The
Commission believes strongly in working in a collaborative effort with the two public governing
boards and the independent sector to communicate clearly and frequently with diverse
constituency groups. The Commission’s duties include:
recommending a budget for a statewide system, which is a two billion dollar enterprise;
engaging in master planning with a central focus on increasing educational attainment,
sharpening institutional missions, and expanding the use of technology; and
answering questions regarding accountability measures on a daily basis.
The Commission is committed to the principles of equity, excellence, accessibility, and
accountability, and strives to coordinate all of Tennessee higher education according to those
principles. An organizational chart, as well as a more detailed listing of the Commission’s duties
and responsibilities, is included as an appendix to this report (Appendix I).
The Commission is composed of thirteen voting members and two non-voting members
(Appendix II). Specifically, there are nine voting lay members appointed by the Governor for
six-year terms, each representing a congressional district of the state. The other voting members
include the three constitutional officers, (Comptroller of the Treasury, Secretary of State, and
State Treasurer) and one of the two student members. The two student members, one from each
of the two systems, Tennessee Board of Regents and the University of Tennessee, are appointed
by the Governor and serve staggered two-year terms. The student serving in the second year of
his/her term is vested with voting authority. Finally, the Executive Director of the State Board of
Education serves as a non-voting, ex-officio member.
The Tennessee Higher Education Commission members and staff take seriously the
responsibility of ensuring compliance with Title VI as well as other programs to prevent
discrimination of any type. The Commission continuously strives to identify initiatives to help
meet this responsibility.

Fiscal Year 2013-2014 Title VI Compliance Report 2
Period Covered by the Title VI Implementation Plan Update and Compliance Report
This implementation plan update for compliance with Title VI of the Civil Rights Act of 1964
covers the period July 1, 2012 – June 30, 2013. The programs and activities outlined in the report
are included within the scope of the implementation plan update. The plan update was
developed by the Commission’s Title VI Coordinator in cooperation with resource staff and
representatives from each of the Commission’s program areas. This plan has been approved by
the Executive Director of the Commission.
Policy Statement Regarding Title VI Compliance
As a recipient of federal education funds, the Commission affirms its intention to comply with
Title VI of the Civil Rights Act of 1964. Title VI states:
No person in the United States shall, on the ground of race, color, or national
origin, be excluded from participation in, be denied benefits of, or be subject to
discrimination under any program or activity receiving federal financial
assistance.
The Tennessee Higher Education Commission prohibits discrimination in any manner related to
institutions, non-profit organizations or program participants receiving services or benefits under
federal or state programs. This information is disseminated to employees through items posted
in each break room and copy/supply room, and also through Title VI training opportunities.
Additionally, the information is included in all RFP documents issued by this office. Successful
project directors must attend a project directors meeting where Title VI compliance is reinforced.
The Tennessee Higher Education Commission reaffirms its policies and commitment to afford
all individuals the same opportunity to participate in federally financially assisted programs in
compliance with Title VI of the Civil Rights Act of 1964.
Fiscal Year 2013-2014 Title VI Compliance Report 3
FEDERAL PROGRAMS AND ACTIVITIES
The Tennessee Higher Education Commission administers the following federal programs in
Tennessee:
College Access Challenge Grant (CACG)
In August 2012, the U.S. Department of Education awarded Tennessee a College Access
Challenge Grant (CACG) totaling $2,814,699. The purpose of the College Access Challenge
Grant Program is to foster partnerships among federal, state, and local governments and
philanthropic organizations through matching grants aimed at increasing the number of low-
income students who are prepared to enter and succeed in postsecondary education.
Building on the successes of the 2010 and 2011 CACG programs, Tennessee’s 2012 CACG
grant was designed to expand and enhance implementation of Tennessee’s college access web
portal, CollegeforTN.org, through professional development. Secondly, it was also designed to
continue implementation and expansion of the statewide College Mentor Corps program.
In the last academic year, the CollegeforTN.org website was visited by a total of 94,516 visitors
resulting in nearly three million page views. During the same period, over 40,000 students
created accounts on the portal. In total, 373,896 students and 2,494 educators have created
CollegeforTN.org accounts.
In 2010, THEC created the “College Mentor Corps” through subgrants to six nonprofit
organizations enabling the creation or expansion of comprehensive mentoring services to high
school and community college students. In the last academic year, the six “College Mentor
Corps” partner organizations served 5,592 students spread across 71 high-need, low-performing
high schools and nine Tennessee community colleges.
GEAR UP Tennessee
In spring 2012, the United States Department of Education awarded a Gaining Early Awareness
and Readiness for Undergraduate Programs (GEAR UP) grant to the Commission in the amount
of $29,590,281. GEAR UP, a seven-year discretionary grant program, aims to increase the
number of low-income, first generation students enrolling and succeeding in college.
Tennessee’s GEAR UP program, operating under the name GEAR UP TN, provides direct
services to a cohort of students, the Class of 2018. Direct services began when the students were
in seventh grade and will continue through the cohort’s first year of postsecondary education.
The GEAR UP TN cohort will include an average of 7,500 students each year. GEAR UP TN
also provides services to students in the senior class of participating high schools each grant year.
The GEAR UP TN is designed to:
1) Increase the academic performance and preparation for postsecondary education for
GEAR UP TN students;

Fiscal Year 2013-2014 Title VI Compliance Report 4
2) Increase the rates of high school graduation and enrollment in postsecondary education
for GEAR UP TN students; and
3) Increase GEAR UP TN students’ and their families’ knowledge of postsecondary
education options, preparation, and financing.
During the reporting period, Tennessee’s GEAR UP program provided college access and
success services to 10,816 students attending one of the 87 GEAR UP TN middle or high
schools. In total, GEAR UP TN is providing services to 15 communities located in the following
counties: Anderson, Bradley, Campbell, Claiborne, Davidson, Grainger, Hardeman, Haywood,
Henderson, Johnson, McNairy, Robertson, Shelby, Union and Wayne.
As a part of the GEAR UP application, Tennessee was required to provide a letter of assurance
of nondiscrimination. (Appendix III).
Improving Teacher Quality Grant Program
The Improving Teacher Quality Grant Program is a federally funded program that provides
grants to the state’s public and private higher education institutions and non-profit organizations
for the purpose of providing research-based professional development and continuing education
for K-12 teachers, paraprofessionals and principals. Institutions use grant funds from the U.S.
Department of Education to assemble project teams who work across disciplines and have access
to the most recent research in relevant content areas, curriculum reform and pedagogical
strategies. The program, beginning in FY 2011-2012, was limited to Mathematics and English
projects which coincide with the Tennessee State Board of Education’s emphasis on Common
Core standards.
There were nine projects funded for FY 2012-2013 totaling $730,508. It is anticipated that a like
amount will be available for the current fiscal year, although that will be dependent on federal
funding.
Race to the Top (RTTT)
In 2010, Tennessee was one of two states selected for funding in the first round of the federal
Race to the Top competition, receiving $501 Million from the U.S. Department of Education.
Tennessee’s innovative education reform agenda centered around improving teachers and school
leaders, making better use of data systems, increasing the rigor of state standards and
assessments, turning around low-performing schools, and creating a focus on Science,
Technology, Engineering, and Math (STEM) education. A strength of Tennessee’s application
was the close collaborative relationship between K-12 and higher education. Tennessee is one of
the few states in the nation where the K-12 department of education and the higher education
agency work in tandem to programmatically and fiscally administer the grant.
The Tennessee Higher Education Commission serves on the overall First to the Top leadership
team which includes the Department of Education, legislative representatives, State Board of
Education, business and industry representatives, and the Governor’s office. THEC also

Fiscal Year 2013-2014 Title VI Compliance Report 5
administers eight of the individual projects within the First to the Top program which includes a
budget of approximately $23 million.
The projects focus on the following key areas:
Improving Teacher Training Programs through the integration of standards based
curriculum, alignment with K-12 standards and assessments, and improving pre-service
teachers’ knowledge of state data systems and their use in the classroom;
Increasing Tennessee’s competitiveness in STEM fields by expanding the UTeach
program and using the expertise in higher education institutions to provide high-quality
professional development to K-12 educators;
Providing accountability in teacher preparation with a focus on strengthening
programs through the improvement of Tennessee’s groundbreaking Report Card on the
Effectiveness of Teacher Training Programs and the creation of the School Leader Study.
Expanding P-20 data systems so that student information can be tracked through all
grades, post-secondary education, and careers; the State Longitudinal Data System which
will provide valuable research related to student outcomes that predict workforce success.
Additionally, THEC is expanding the current College Access Network to assist students
in successful application and admission to colleges and universities.
Veterans Education Division
The Veterans Education Division of the Commission is the State Approving Agency (SAA)
funded by the U.S. Department of Veterans Affairs to approve and monitor all educational
institutions receiving federal funds for education of veterans based on federal guidelines.
Pursuant to U.S.C. Title 38, the SAA is a separate agency responsible by contract to the U.S.
Department of Veterans Affairs.
Veterans Affairs regulations require that all participants (schools, business, etc.) acknowledge
and adhere to the policies referred to under the Title VI enforcement form, which affirms that
they will not discriminate based on race, color or national origin (Appendix IV). A school will
not be approved for veterans training unless this form has been signed. An institution currently
approved for veterans training that fails to comply with Title VI procedure will be dropped from
the veterans program. During the FY 2012-2013, 297 institutions and 42 apprenticeship on-the-
job training programs were approved to provide veterans training in Tennessee.
Each institution approved for the training of veterans must have an EEO statement and
guidelines in place at all times. Commission staff reviews these guidelines and makes sure they
are in place. Staff also reviews and investigates claims of discrimination made by students.
The total budget for Veterans Affairs for FY 2012-2013 was $345,054 and a like amount is
anticipated for the current fiscal year.
It should be noted, however, that the Commission is not involved in the distribution of GI Bill
funds. The U.S. Department of Veterans Affairs notifies veterans of their eligibility and pays
benefits directly from the federal office.

Fiscal Year 2013-2014 Title VI Compliance Report 6
Total Funding FY 2012-2013: $5,001,262 (Actual)
Total Funding FY 2013-2014: $7,222,700 (Anticipated)

Fiscal Year 2013-2014 Title VI Compliance Report 7
ORGANIZATION OF CIVIL RIGHTS OFFICE/CIVIL RIGHTS COORDINATOR
The ultimate responsibility for enforcing and complying with the provisions of Title VI and this
report is vested in the Executive Director of the Tennessee Higher Education Commission. The
Executive Director oversees all policy and hiring for the agency.
The individual responsible for developing, reporting and enforcing Title VI guidelines is Scott
Sloan, Associate Executive Director for Legal and Regulatory Affairs. Mr. Sloan reports directly
to the Executive Director, and can be contacted at (615) 741-7571 or via e-mail at
As the Title VI coordinator, Mr. Sloan is charged with developing the Commission’s Title VI
implementation plan and provides overall direction and leadership for the Commission’s Title VI
compliance activities, including professional development.
There have been no Title VI complaints filed with the Commission in FY 2012-2013. If any
complaints were filed, Mr. Sloan would investigate and respond to such complaints and consult
with appropriate staff.

Fiscal Year 2013-2014 Title VI Compliance Report 8
DATA COLLECTION AND ANALYSIS
Commission Staff
Staff members are responsible for the day-to-day activities of the Commission. The staff is made
up of a diverse racial mix. Specifically, of the 67 employees, 17 are African-American, 46 are
white, three are Asian and there is one who would be classified as “other”. There are 3 vacant
positions. This can be further broken down by EEO category:
EEO 1: 3 African-Americans; 16 Caucasians; 1 Asian; 1 Other; 1 Vacancy.
EEO 2: 13 African-Americans; 29 Caucasians; 2 Asians; 2 Unknown; 2 Vacancies.
EEO 6: 1 African-American; 1 Caucasian.
(Appendix V)
The 67 filled positions are broken down as follows:
17 African-Americans (25 percent);
46 Caucasians (69 percent);
3 Asian (4 percent);
1 Other (1 percent).
An organizational chart of the Commission staff is also included as part of Appendix I. The
Commission addresses Title VI compliance as an agenda item at each of its Fall meetings. To
supplement that activity, the Commission has implemented a policy that compliments and is
consistent with its commitment in this area.
Data Analysis for Federally Funded Programs:
College Access Challenge Grant (CACG)
CACG served 5,592 high school and community college students in FY 2012-2013. An analysis
of racial diversity in the CACG program is included in Appendix VI.
GEAR UP Tennessee
GEAR UP TN served 10,818 students during FY 2012-2013. An analysis of racial diversity in
the GEAR UP program is included in Appendix VI.
Improving Teacher Quality Grants
Annually, the Commission issues a Request for Proposals (RFP) to Tennessee public and private
higher education institutions and not-for-profit entities that have an approved teacher preparation
program, inviting them to compete for these federal funds. The FY 2012-2013 RFP was mailed

Fiscal Year 2013-2014 Title VI Compliance Report 9
to the presidents and chancellors, other college and university administrators, previously funded
project directors, and others who requested a copy. This includes faculty and administrators at
historically Black colleges and universities who were contacted about the program and
encouraged to submit proposals. The RFP includes a requirement that each successful project
must include a plan to recruit minorities for the project. An analysis of racial diversity in the
ITQ Grant Program is included in Appendix VI. The total of all participants was 218, of which
38, or 17 percent, were minority participants.
A predetermined rubric is used to evaluate the various RFPs (Attachment VII).
Each successful ITQ project director must report information regarding their respective projects.
Included in the RFP is a list of data that must be compiled to show evidence of Title VI
compliance (Appendix VII). This data is compiled and utilized to identify trends of potential
discriminatory practices and in evaluating project proposals in subsequent years.
Race to the Top (RTTT)
For data concerning the extent to which members of minority groups are represented in
Tennessee’s Race to the Top programming, see Appendix VI.
Fiscal Year 2013-2014 Title VI Compliance Report 10
DEFINITIONS
Assurance - A written statement or contractual agreement signed by the agency head in which a
recipient agrees to administer federally assisted programs with civil rights laws and regulations.
Beneficiaries - Those persons to whom assistance, services, or benefits are ultimately provided.
The beneficiaries assisted by the Commission include public and private postsecondary
institution students and teachers.
Compliance - The fulfillment of the requirement of Title VI, other applicable laws, implementing
regulations, and instructions to the extent that no distinctions are made in the delivery of any
service or benefit on the basis of race, color or national origin
Complaint - A verbal or written allegation of discrimination which indicates that any federally
assisted program is operated in such a manner that it results in disparity of treatment to persons
or groups or persons because of race, color or national origin.
Conciliatory Agreement - A voluntary agreement between a federal agency, the state, and a
subrecipient, which provides for corrective action by a recipient to eliminate discrimination in
any program receiving federal assistance.
Contractor - A person or entity that agrees to perform services at a specified price.
Civil Rights Compliance Reviews - Regular systematic inspections of agency programs
conducted to determine regulatory compliance with civil rights laws and regulation. Compliance
reviews determine compliance and noncompliance in the delivery of benefits and services in
federally assisted programs. They identify problems such as denial of full benefits, barriers to
participation, difference in treatment, lack of selection to advisory boards and planning
committees, lack of information, and denial of the right to file a civil rights complaint.
Compliance reviews may be conducted on-site or through desk audits.
Discrimination - To make any distinction between one person or group of persons and others,
either intentionally, by neglect, or by the effect of actions or lack of actions based on race, color,
or national origin.
Federal Assistance - Any funding, property, or aid provided for the purpose of assisting a
beneficiary.
High-need LEA - an LEA:
(A) (i) that serves not fewer than 10,000 children from families with incomes below
the poverty line; or
(ii) for which not less than 20 percent of the children served by the agency are
from families with incomes below the poverty line; and
(B) (i) for which there is a high percentage of teachers not teaching in the academic
subjects or grade levels that the teachers were trained to teach; or

Fiscal Year 2013-2014 Title VI Compliance Report 11
(ii) for which there is a high percentage of teachers with emergency, provisional,
or temporary certification or licensing.
Minority - A person or group of persons who differs from others in some characteristic(s) and is
often subjected to differential treatment on the basis of race, color, or national origin.
Noncompliance - Failure or refusal to comply with Title VI of the Civil Rights Acts of 1964,
other applicable civil rights laws, and implementing departmental regulations.
Primary Recipient - Any recipient authorized or required to extend Federal financial assistance to
another recipient for the purpose of carrying out a program.
Public Notification - Process of publicizing information on the availability of programs, services
and benefits to minorities and statements of nondiscrimination. This is attained through use of
newspapers, newsletters, periodicals, radio and television, community organizations, and
grassroots and special needs directories, brochures, and pamphlets.
Racially Hostile Environment - Harassing conduct (for example, physical, verbal, graphic, or
written) that is sufficiently severe, pervasive, or persistent so as to interfere with or limit the
ability of an individual to participate in or benefit from the services, activities or privileges
provided by a recipient of federal funds.
Recipient - Any state (including political subdivisions or instrumentalities of a state), public or
private agency, institution, organization, other entity, or individual, to whom federal financial
assistance is extended, directly or through another recipient. This definition includes any
successor, assign, or transferee thereof, but does not include any ultimate beneficiary under any
such program.
Request for Proposals – The document that solicits competitive grant proposals from higher
education and non-profit institutions.

Fiscal Year 2013-2014 Title VI Compliance Report 12
DISCRIMINATORY PRACTICES
There are many forms of illegal discrimination based on race, color, or national origin that can
limit the opportunity of minorities to gain equal access to services and programs. Among other
things, in operating a federally assisted program, a sub-recipient cannot, on the basis of race,
color, or national origin, either directly or through contractual means:
Be refused an award for a grant administered by the Commission;
Deny any qualified applicant participation in a program funded with a grant;
Provide an individual instruction or participation at a level of service or benefit in a manner
different from others under the same program;
Subject a participant to segregation in any manner related to the receipt of services or
benefits under the program;
Subject a project participant to separate treatment in any manner related to receiving services
or benefits under the program;
Restrict an individual in any way in the receipt of any advantage or privilege enjoyed by
others under the program;
Require different standards or conditions as prerequisites for accepting an individual into a
program;
Use criteria or methods of administration which (a) have the effect of subjecting individuals
to discrimination or (b) operate to defeat or substantially impair the accomplishment of the
objectives of the program;
Permit discriminatory activity in a facility built in whole or in part with federal funds;
Fail to provide service or information in a language other than English when a significant
number of potential or actual beneficiaries have limited English speaking ability;
Fail to advise the population eligible to be served or benefited by the program of the
existence of the program;
Locate a facility in any way which would limit or impede access to a federally funded service
or benefit; or
Deny a person the opportunity to participate as a member of a planning or advisory body that
is an integral part of the program.

Fiscal Year 2013-2014 Title VI Compliance Report 13
LIMITED ENGLISH PROFICIENCY (LEP)
Notwithstanding the limited likelihood that participants in programs administered by the
Commission will be in need of LEP services, the Commission is committed to ensure that all
eligible participants have complete access to the programs it administers. Therefore, the
following procedures have been put in place should the need arise.
During FY 2012-2013 there were no requests, nor was there any observed need, to provide LEP
services.
GEAR UP Tennessee
The GEAR UP TN program provides direct services to students through subgrants to local
education agencies (LEA). Services provided to students are tailored to students’ individual
needs. Should a GEAR UP TN student require specific services to address his or her LEP needs,
the Commission works with the LEA to ensure such needs are met.
College Access Challenge Grants (CACG)
As is the case with the GEAR UP program, CACG provides direct services that are
individualized to students' needs. In the event, therefore, a CACG student requires services to
address his or her LEP needs, the Commission works with the subgrantee and the LEA in which
the student is enrolled to ensure such needs are met.
Improving Teacher Quality Grants
Improving Teacher Quality Grants are awarded to higher education or non-profit entities that
provide teacher training to the state’s K-12 teachers, who must be proficient in English to be in
their position.
Regardless, it is recognized that there could be some limited instances where the individuals that
would benefit from the ultimate flow of funds may include those in need of LEP
accommodations. Therefore, THEC will work with contractors/subrecipients/vendors to ensure
meaningful access and an equal opportunity for those with limited English proficiency. All
interpreters, translators and other aids needed to comply with this policy shall be provided
without cost to the person being served.
Language assistance will be provided through an arrangement with the Tennessee Foreign
Language Institute. Appropriate staff will be provided notice of this policy and procedure, and
staff that may have direct contact with LEP individuals will be trained in effective
communication techniques, including the effective use of an interpreter. The Commission will
conduct a regular review of the language access needs of our service population, as well as
update and monitor the implementation of this policy and these procedures, as necessary.

Fiscal Year 2013-2014 Title VI Compliance Report 14
PROCEDURES
1. Identifying LEP Persons and Their Language
The Commission will promptly identify the language and communication needs of the LEP
person. If necessary, staff will use language identification cards (or “I speak cards”) or posters to
determine the language. In addition, when records are kept of past interactions with individuals
or their family members, the language used to communicate with the LEP person will be
included as part of the record.
2. Obtaining a Qualified Interpreter
The Tennessee Foreign Language Institute has agreed to provide qualified interpreter services.
The TFLI is a state agency that provides interpretation services in over 200 languages, either in
person or over a 24/7 telephonic language service (877-346-1674). Additionally, the TFLI can
provide written translation for forms, websites and other business documents.
Some LEP persons may prefer or request to use a family member or friend as an interpreter.
However, family members or friends of the LEP person will not be used as interpreters unless
specifically requested by that individual. Furthermore, the LEP person must first understand that
an offer of an interpreter at no charge to the person has been made by the department or agency.
Such an offer and the response will be documented in the person’s file. If the LEP person
chooses to use a family member or friend as an interpreter, issues of competency of
interpretation, confidentiality, privacy, and conflict of interest will be considered. If the family
member or friend is not competent or appropriate for any of these reasons, competent interpreter
services will be provided to the LEP person. Children will not be used to interpret, in order to
ensure confidentiality of information and accurate communication.
3. Providing Written Translations
As indicated above, when translation of vital documents is needed, the Commission shall submit
the documents to the TFLI for translation. Original documents being submitted for translation
will be in final, approved form.
4. Monitoring Language Needs and Implementation
On an ongoing basis, the Commission will assess changes in demographics, types of services or
other needs that may require reevaluation of this policy and its procedures. In addition, the
Commission will regularly assess the efficacy of these procedures, including but not limited to:
mechanisms for securing interpreter services,
equipment used for the delivery of language assistance,
complaints filed by LEP persons, and
feedback from the public and community organizations.

Fiscal Year 2013-2014 Title VI Compliance Report 15
COMPLAINT PROCEDURES
Title VI Complaints
There were no Title VI-related complaints or lawsuits filed against THEC during FY 2012-2013.
The Tennessee Higher Education Commission has adopted complaint procedures which require
that all form letters used to communicate the status of a complaint investigation be included in
Appendix VIII. In addition, the Commission utilizes standard forms developed by the Tennessee
Human Rights Commission related to the investigation itself (e.g. Investigation Commencement
Form, Title VI Investigative Plan, Case Summary Report.)
Timeline for Filing
Any person alleging discrimination based on race, color, or national origin has a right to file a
complaint within 180 days of the alleged discrimination.
Receipt of Complaints
To request a preliminary review by the Commission, which determines whether it will
investigate an allegation of noncompliance with Title VI, the complainant must complete the
Discrimination Complaint Form contained in Appendix VIII (or provide the information
requested on the Complaint Form). Additionally, he or she must complete the Consent Form for
Use of Personal Information. The complainant must sign all forms.
Essential Elements of a Complaint
The complainant must provide the following information:
Name, address, and telephone number of the person making the complaint;
The location and name of the entity delivering the service;
The nature of the incident that led the complainant to feel discrimination was a factor;
Whether the discrimination was based on race, color, or national origin;
Names, addresses, and phone numbers of people who may have witnessed the event or
may have knowledge of the event; and
The date(s) of the alleged discriminatory acts.
Complaint Receipt and Reporting Process
The procedures listed below will be followed in processing Civil Rights complaints.
Within fifteen days of receiving the complaint, Commission will send a letter to the
complainant acknowledging receipt of the complaint. The Commission will advise the
complainant that the Commission will conduct a preliminary review of the complaint and
that he/she will be advised of the results of the preliminary review.
The Commission’s Title VI Coordinator will conduct a preliminary review of the
complaint, and will determine whether a potential violation of Title VI has occurred. The
Title VI Coordinator will also determine whether the Commission has jurisdiction to

Fiscal Year 2013-2014 Title VI Compliance Report 16
investigate the complaint, and whether the Commission is the best entity to conduct the
investigation. In the course of the investigation, the Title VI coordinator will work with
the program administrator for the particular program involved in the complaint. If it is
determined that the Commission is not the best entity to conduct the investigation, the
Commission may refer the complaint to the U.S. Department of Education Office for
Civil Rights, the Tennessee Department of Labor and Workforce Development or U.S.
Department of Veterans Affairs, or another appropriate entity.
While the Commission does not have statutory responsibility for the operation of the two
governing boards, the Executive Director will refer any complaint involving an institution
of the University of Tennessee System or the Tennessee Board of Regents to the
respective governing boards for review and resolution. In either case, the complainant
will be apprised of the action taken.
Within thirty days of the Commission’s receipt of the complaint, the Commission will
notify the complainant as to the results of the preliminary review of the complaint and
whether or not the Commission will conduct an investigation.
If the decision of the Commission is to conduct a complaint investigation, the
Commission will send a letter of notice to the entity to be investigated.
If the Commission accepts a complaint for investigation, the Commission will strive to
complete the investigation within 180 days of the receipt of the complaint. The
investigation will include interviews with persons who may have direct knowledge of the
alleged discriminatory act(s), a review of pertinent documents and records, and any other
legal investigative techniques deemed necessary to allow the Commission to reach a
conclusion as to whether discrimination occurred.
If appropriate, the Commission will coordinate with other agencies on interdepartmental
matters.
If the investigation substantiates the allegations of the complainant or if other instances of
noncompliance with Title VI of the Civil Rights Act of 1964 are found, the Commission
will send a draft copy of the investigative report to the entity that has been the subject of
the investigation. The Commission will request the entity to submit a written response to
any findings or recommendations in the draft report.
If the entity that is the subject of the complaint submits a written response which states
that action will be taken to resolve the complaint, the Commission will issue a final
investigative report that will include the response of the entity. The Commission
investigator will schedule a follow-up review for an appropriate time period to determine
whether the complaint has been resolved.
If the entity does not agree to resolve a substantiated complaint, the investigator will
issue a final report with an opinion statement that the entity has not committed to
resolving the complaint. The Commission’s Title VI coordinator, in consultation with the

Fiscal Year 2013-2014 Title VI Compliance Report 17
Executive Director of the Commission, will make a determination as what further action
the Commission will take to resolve the complaint.
If the alleged discriminatory act(s) directly affected the complainant, a letter, containing a
description of the allegations investigated, the scope of the investigation, the facts
learned, and a closing statement summarizing the basis on which the determination was
made, will be sent to the complainant. The complainant will be advised of his/her right to
file a complaint with other applicable governmental entities, including the Tennessee
Human Rights Commission, if dissatisfied with the resolution of the complaint by the
Commission.

Fiscal Year 2013-2014 Title VI Compliance Report 18
COMPLIANCE REVIEW
A. Subrecipients, Contractors, Vendors
The Commission and any subrecipients/contractors shall make available any Title VI
compliance report to be reviewed by the Tennessee Human Rights Commission upon
request.
A list of the Commission’s subrecipients, contractors and/or vendors is found in Appendix IX.
The Commission had a total of four contractors for federally funded programs and activities
in FY 2012-2013. These contracts totaled $11,181,826.1 Two of the four Contractors are
MWBE for a fifty percent (50%) ratio of the total contracts and thirty-three percent (33%) of
the total dollar amount.
For entities that enter into grants and contracts with the Commission, the grant contract
document includes the following provision prohibiting discrimination (Paragraph D.8. of
Appendix X):
Nondiscrimination. The Grantee hereby agrees, warrants, and assures that no person
shall be excluded from participation in, be denied benefits of, or be otherwise subjected
to discrimination in the performance of this Grant Contract or in the employment
practices of the Grantee on the grounds of handicap or disability, age, race, color,
religion, sex, national origin, or any other classification protected by Federal, Tennessee
State constitutional, or statutory law. The Grantee shall, upon request, show proof of
such nondiscrimination and shall post in conspicuous places, available to all employees
and applicants, notices of nondiscrimination. (Emphasis added.)
Signing of a grant contract with the above language is a precondition to receiving funds. If
the entity does not sign, funds will not be released.
Recipients of the Improving Teacher Quality Grants and the institutions approved to offer
veterans’ benefits to their student must sign a statement of assurance regarding compliance
with Title VI. The Commission relies on the contractual nondiscrimination language
outlined above for compliance by all other contractors/subrecipients.
There are currently no pending applications for financial assistance from any federal or state
department or agency.
B. Pre-Award and Post-Award Procedures
1 Maximum contract liability for the multi-year contract total.

Fiscal Year 2013-2014 Title VI Compliance Report 19
College Access Challenge Grant
The Commission staff performs a site visit on each project that receives a grant under the
College Access Challenge Grant.
GEAR UP Tennessee
The Commission staff makes numerous site visits each year to all the GEAR UP recipients.
Improving Teacher Quality Grant Program
Pre-Award Review
The Director for Academic Affairs includes mandatory Title VI requirements in the RFP. Also,
the staff instituted an updated evaluation feature that will provide information on whether
previously funded institutions were found to have successfully satisfied Title VI compliance
reviews or have pending Title VI complaints. Projects that have been found in non-compliance
will not be considered for funding.
The Commission assembles a selection committee to recommend which proposals should be
funded. Awards are based on the merit of the proposals, which are evaluated using prior
established criteria identified to enhance K-12 teachers’ instructional abilities and principals’
leadership skills. The selection committee includes representatives from the state’s public and
private higher education institutions, Board of Education and Department of Education. The FY
2012-2013 committee included three African-Americans out of a total of 12 reviewers.
(Appendix VII).
Post Award Title VI Compliance
Procedures for conducting compliance reviews of funded grant projects under the Improving
Teacher Quality Grant program include the following steps:
Site visits to all grant programs;
Site visits to second year grant programs, if (a) specifically requested by the Project Director
or Principal Investigator or sponsoring agency and/or (b) a Title VI complaint was filed
against the grant program during year one;
Site visit will be made to all grant programs in their third year to the extent that they can be
scheduled around visits to first year programs;
Other site visits on an as needed basis with specific interest in any ITQ project in an odd year
funding;
Mandatory project directors meeting to include Title VI presentation;
Completion of Title VI Compliance Checklist;
Survey of Project Director(s), which among other things identifies the number of minorities
the project served and the number of external consultants that were employed by the project
(Appendix V).
Review whether the grantee implemented the project’s plan for recruiting minority
participants;
Technical assistance with any Title VI complaints or issues; and
Mandatory final report submitted to program director 45 days after the grant ends.

Fiscal Year 2013-2014 Title VI Compliance Report 20
Site visits were made to ALL ITQ projects for FY 2012-2013.
Project Directors will submit in the final report on any Title VI complaint received during the
funded grant period. In addition, the grant Project Director will submit in the final report an
explanation of the results of the proposed minority recruitment plan. Unsatisfactory compliance
review findings, failure to submit final reports, and pending discriminatory complaints can result
in the withholding of the projects’ final disbursement of grant funds.
Two examples of how discrimination might occur:
Failure to notify all eligible institutions of the availability of funds; and
Applicants receiving awards notify only certain teachers or schools in the targeted
geographical areas of the fact that professional development activities will be conducted,
knowing or having reason to believe that no minorities are among of that group.
Veterans Education
Supervisory visits were conducted by the SAA during FY 2012-2013 at each of the institutions
participating in the Veterans Education program. These visits include records audits and
facilities monitoring. Title VI compliance reviews are also completed by the U.S. Department of
Veterans Affairs. The Assistant Executive Director of Veterans Education for the Tennessee
Higher Education Commission is responsible for investigating complaints of discrimination filed
by veterans and acts as a liaison between the institution and the U.S. Department of Veterans
Affairs.
C. Public Notice and Outreach
The Commission monitors all subrecipients and/or contractors concerning the dissemination of
information about the following to the public:
Nondiscrimination policy;
Programs and services;
Complaint procedures; and
Minority participation on planning boards and advisory bodies.
D. Procedures for Noncompliance
The Commission has adopted the following policies and procedures which will be followed
when, through complaint investigations or compliance reviews, it is determined that a Title VI
violation has occurred. Efforts will be made to the fullest extent practicable to obtain voluntary
compliance before a case if referred to the U.S. Department of Education Office for Civil Rights
for possible refusal, suspension, or termination of federal financial assistance.

Fiscal Year 2013-2014 Title VI Compliance Report 21
Procedures for Achieving Voluntary Compliance
In cases where a complaint investigation or compliance review results in a finding of
noncompliance, the Commission will notify the subrecipient of federal/state funds of the
apparent noncompliance.
The notice will clearly identify the conditions of noncompliance and offer a reasonable
time to willingly comply.
The Commission will record the date the recipient received notice, and will note and
record the last day afforded the recipient for voluntary compliance before initiating an
administrative process to terminate assistance.
A subrecipient of federal funds may request a meeting for the purpose of discussing the
problem areas or requirement for compliance. The principal investigator will be involved
in the discussion process.
The Executive Director of the Commission, or designee, will approve the recipient’s
voluntary compliance plans, methods, procedures, and proposed actions if such approval
will result in compliance with the Act. The plan will be put in writing. Failure of
voluntary efforts will result in the implementation of an administrative process, which
could result in termination or suspension of assistance.
Termination or Suspension of Assistance
If the Commission cannot obtain compliance through voluntary means, the Commission will
notify the U.S. Department of Education Office for Civil Rights (USDE/OCR) and will request
the assistance of the USDE/OCR to obtain compliance, which may involve termination or
suspension of assistance.
If termination of assistance is considered due to noncompliance with Title VI, the alleged
problems are delineated to the award recipient. Opportunity is provided for informal resolution.
If these efforts fail, formal sanctions up to and including termination can be pursued.

Fiscal Year 2013-2014 Title VI Compliance Report 22
COMPLIANCE/NONCOMPLIANCE REPORTING
Currently, the Commission submits its Title VI report only to the Tennessee Human Rights
Commission (THRC). Compliance reports will be maintained by the Commission and
forwarded to the other state and federal agencies as may be requested or directed. Additionally,
the Commission is not aware of any CFR regulations requiring any reporting obligations.
The Commission will maintain the following records:
Administrative records such as copies of assurances, public notification plans, press releases,
and training materials;
Data collection and participation records, documentation of analytical review procedures, and
results of follow-up;
Monitoring records, including working papers, reports, and corrective action plans; and
All Title VI correspondence and reports received from and submitted to the federal
government.
The Commission has not received any Title VI or discrimination-related audits or findings from
federal or state monitoring agencies.

Fiscal Year 2013-2014 Title VI Compliance Report 23
TITLE VI TRAINING PLAN
Mr. Sloan is designated the Title VI coordinator and will execute all of the duties and
responsibilities of the position, including participation in meetings of the Tennessee Title VI
Compliance Commission and Governor’s Office of Diversity Business Opportunities.
Mr. Sloan and Marcie Mills, who serves as paralegal for both the Commission and the Tennessee
Student Assistance Corporation, attended Title VI compliance meetings on July 23 and 24, 2013,
respectively.
Title VI training for the Commission staff was accomplished through an on-line tutorial module
through Edison. The module provided an overview of Title VI to include its history, key
elements and principles regarding application of the law to the work of the Commission. The
training included a post-test in which the staff responded to questions related to the on-line
tutorial. An employee roster showing completion of the training can be found in Appendix XI.
Commission staff members were advised that access to the mandatory training module was
available on July 1, 2013, for each staff member to take as time permitted, but no later than July
12, 2013. Through Edison, it was verified that 100 percent of the Commission staff completed
the module. The training incorporated a history of civil rights in the United States, and outlined
the purpose and applicability of Title VI (Appendix XI). It is anticipated that the FY 2013-2014
training will take place next spring or summer.
In addition to the training received by Title VI coordinator, the Commission provides a
mandatory workshop for grant project directors, which was attended by all Improving Teacher
Quality Grant project directors on February 6, 2013. Training for FY 2013-2014 recipients will
take place in February 2014.
Additionally, the Commission’s Title VI Implementation Plan is an agenda item each year at the
November meeting of the Commission. At that time, information similar to what was covered in
the on-line tutorial for staff is reviewed with the Commission, as well as highlights of the most
recent Title VI plan. Specifically, this review was included at the November 15, 2012, meeting
of the Commission and will be included at the November 14, 2013, meeting.

Fiscal Year 2013-2014 Title VI Compliance Report 24
PUBLIC NOTICE AND OUTREACH
As mentioned above, the Commission monitors all subrecipients and/or contractors concerning
the dissemination of information on multiple topics:
Nondiscrimination policy;
Programs and services;
Complaint procedures; and
Minority participation on planning boards and advisory bodies.
Specifically, the Commission uses the following measures with respect to the Improving Teacher
Quality Grant Program, the GEAR UP Program, and the College Access Challenge
Grant(CACG) Program:
Nondiscrimination policy: Throughout the 2012-2013 project period, monitoring was
conducted by THEC staff to ensure compliance with all aspects of the contractual terms.
Per Section D.8. of the contract, grantees were required to furnish to applicants and
employees notices of non-discrimination.
Programs and services: Information regarding programs and services was disseminated
primarily in the form of communications with prospective workshop participants. Per the
terms of the Request for Proposals, the ITQ grantees were required to develop a
recruiting plan for minority participants. However, no such plan is required of GEAR UP
as these services are provided to all students enrolled in specific grades in the respective
county school systems serving as GEAR UP counties.
Complaint procedures: The public is informed via the Request for Proposal and/or other
communications that Title VI requires federally assisted programs to be free of
discrimination. These documents also provide contact information for the THEC Title VI
Coordinator in the event that a citizen claims to have been subjected to discrimination. In
addition, grantees are contractually required, under Section D.10., to annotate on all
public notices that the grant was funded under an agreement with the Tennessee Higher
Education Commission.
Minority participation on planning boards and advisory committees: THEC maintains
records of minority participation on the ITQ Advisory Committee, the Teacher Diversity
Grant Advisory Committee, and the Committee on Postsecondary Educational
Institutions, all of which are available for public review.
The Tennessee Higher Education Commission holds public meetings at various times and
locations throughout the year. The work of the Commission, its staff and committees are public
record. All meetings are open to the public and publicized in accordance with the Tennessee
Open Meetings Act. These public hearings concern such issues as funding of higher education,
capital outlay and maintenance, and academic planning.
As previously noted, the Commission provides its Title VI Implementation Plan upon request to
any agency, department or individual that may request it. Additionally, the plan in found on the
Commission’s website <http://www.tn.gov/thec/Divisions/LRA/TitleVI/TitleVI.html>.

Fiscal Year 2013-2014 Title VI Compliance Report 25
The Title VI guidelines are reinforced by mandatory attendance at the annual project directors’
workshop which is designed to educate grant recipients regarding federal and state guidelines
including the proper procedures for reporting Title VI complaints. In FY 2012-2013, all
Improving Teacher Quality Grant project directors attended this workshop.
Posters/flyers are displayed in high traffic areas of the Commission offices which articulate the
Commission’s commitment to compliance of Title VI and contact information for filing a
complaint.
As a general rule, staff vacancies are filled after the positions are advertised in publications that
will ensure a representative pool of applicants. In addition, efforts are made to network with
African-American professionals and educators to assist in identifying potential applicants for the
various positions.
Minority Media Utilization
The Commission engaged only in very limited media pitching during FY 2012-2013. However,
when a public outreach campaign is necessary, a minority-owned marketing firm is used to
facilitate those efforts. In future media relations and public outreach campaigns, the
Commission will specifically request that the firm reach out to minority media outlets as a part of
the communications process.
Minority Representation on Planning Boards or Advisory Bodies
The Governor appoints all members of the Tennessee Higher Education Commission except the
four ex-officio members (Appendix II). Pursuant to T.C.A. § 49-7-204(a)(6), “at least one (1) of
the appointive members shall be a member of the principal racial minority in the state.” Three
of the 15 Commission members (20 percent) are African-American: Mr. Cato Johnson; Mr. A C
Wharton, Mayor of Shelby County; and Mr. Robert Fisher. Mr. Johnson serves as chairman of
the Commission.
The General Assembly created the Committee on Postsecondary Educational Institutions to
assist the Commission staff with the oversight of the proprietary and many not-for-profit
postsecondary institutions in the state. Pursuant to T.C.A. §49-7-207, the committee is composed
of the Executive Director of the Tennessee Higher Education Commission, the Executive
Director of the Tennessee Student Assistance Corporation and eleven persons appointed by the
Commission. Dr. Rhoda currently serves as the Executive Director of both the Tennessee Higher
Education Commission and the Tennessee Student Assistance Corporation, but for voting
purposes is considered as one vote. Of the 12 persons serving as committee members, four are
from a racial or ethnic minority group.
There is not a set number of Improving Teacher Quality Grant Program Selection Committee
members; however, five of the members are determined by position. These positions include:
Math Consultant for the State Department of Education;

Fiscal Year 2013-2014 Title VI Compliance Report 26
Science Consultant for the State Department of Education;
Improving Teacher Quality Grant Coordinator for the State Department of Education;
Coordinator of Special Projects for the State Department of Education; and
Director for Academic Affairs (THEC).
The selection committee responsible for the current grant awards included three African-
Americans out of a total of 12 committee members (Appendix XII).
The Teacher Diversity Grant Advisory Committee determines which entities will receive the
grants under this program. The committee that reviewed and recommended awards for FY 2012-
2013 included three African-Americans out of a total of seven committee members (Appendix
XII).
Below is an analysis of minority participation on advisory bodies for which the Commission has
the authority and/or responsibility for appointing or recommending members. One of the
Commission’s goals and objectives is to ensure that minorities are adequately represented on
advisory bodies.
Advisory Body
Total
Members
No. of
Minority
Members
Percent of
Total
Committee on Postsecondary Educational
Institutions
12 4 33%
Improving Teacher Quality Grant
Program Selection Committee
12 3 25%
Teacher Diversity Grant Advisory
Committee
7 3 43%
Total 31 10 32%
Minority Input
As mentioned above, the Commission uses an MWBE firm for coordination of its marketing
activities. As a part of the firm’s market research responsibilities, it solicits input from
populations representing a cross-section of Tennesseans. Those populations necessarily include
minority representation.
Process for Obtaining Grants/Bidding on Contracts
As mentioned above, the Request for Proposals (RFP) is the method of informing potential grant
recipients of available federal and state funding. They are disseminated to public and private
higher education institutions as well as non-profit organizations, if applicable. The Commission
makes special efforts to provide notice to African-Americans and other racial and ethnic
minorities of all program activities. This information is also provided to institutions whose
primary focus is to reach racial and ethnic minorities.

Fiscal Year 2013-2014 Title VI Compliance Report 27
EVALUATION PROCEDURES OF TITLE VI IMPLEMENTATION
Goals and Objectives – Implementation Plan Deficiencies
THEC’s primary goal in Title VI enforcement is to ensure that information on all THEC
programs is disseminated to all Tennesseans regardless of race, color or national origin.
THEC’s secondary goal is the appropriate recipient representation regardless of race, color, or
national origin.
THEC’s Title VI Coordinator is responsible for recommending policy changes in Title VI
enforcement to the Executive Director. For the purpose of monitoring compliance activities,
THEC’s Program Administrators, Title VI Coordinator, and the Executive Director will meet at
least once a year to review the prior year’s activities. This yearly meeting will focus primarily on
complaints filed during the year. Any significant problems of general compliance will also be
addressed. If Title VI deficiencies are noted, prompt and corrective action will be taken.
Further mechanisms to ensure compliance will be considered also. Notices to inform THEC
employees, clients and prospective clients of their obligations and rights under Title VI and of
the availability of services will be posted at the agency and shown on documents that clients
receive.
THEC’s Title VI Coordinator is responsible for displaying the Title VI information in the
agency.
THEC’s Title VI Coordinator shall attend training offered by the THRC.
THEC employees shall receive information regarding the obligations and rights involved in the
Title VI program. The information will apprise staff of their responsibility to render a high
quality of service to all clients regardless of their race, color or national origin.
THEC will review its publications, literature, website, and other media to address Limited
English Proficiency as it relates to discrimination and implement procedures to address
deficiencies.
THEC will require a statement of compliance with Title VI of the Civil Rights Act of 1964 from
every contracting agency before entering into a contract or other agreement which involves the
purpose of services or other benefits on behalf of persons served by the programs of THEC.
Any state or contracting agency believed by THEC to be in violation of the provisions of Title
VI shall be given a written notice. Failure to eliminate further discrimination within 30 days of
receipt of the notice will be considered as a violation of the terms of the contract and a basis for
contract suspension, termination or rejection. The enforcement procedure by THEC for
termination of the contracting agency from participation as a recipient of federal financial
assistance will be in accordance with the enforcement procedure contained in 45 C.F.R. 80.9,
80.10 and 80.11.

Fiscal Year 2013-2014 Title VI Compliance Report 28
The Title VI Coordinator monitors and recommends to the Executive Director appropriate
changes in applicant selection criteria that may be discriminatory to racial groups. As
appropriate, the Executive Director will forward recommendations to the Commission members.
The Title VI Coordinator will investigate all complaints in a timely manner and submit
recommendations to the Executive Director. The Executive Director will be responsible for
appropriate rectification of all complaints.
Timeline
THEC’s Title VI Coordinator shall set a date in October for its annual meeting with the Program
Administrators and the Executive Director to discuss implementation goals and deficiencies.
THEC’s Title VI Coordinator shall contact the THRC in October to discuss training objectives.
THEC’s Title VI Coordinator shall immediately review Statements of Assurance and Statements
of Compliance deficiencies observed in this report and will ensure that any deficiencies are
corrected.


Agenda Item: II.B. DATE: November 14, 2013 SUBJECT: 2013 Articulation and Transfer Annual Report ACTION RECOMMENDED: Information BACKGROUND INFORMATION: Staff will present the annual report on articulation and transfer, submitted to the General Assembly in October 2013 pursuant to T.C.A. §49-7-202(f). The 2013 Articulation and Transfer Report examines Tennessee student transfer activity and student migration from Tennessee Colleges of Applied Technology during the 2012-13 academic year. Analyses conducted for the report show that (a) student transfer activity in Tennessee is robust, multidirectional, and consistent over time; (b) most transfers take place within Tennessee, and many students who transfer from out-of-state institutions are returning Tennessee residents; (c) transfer students have low degree efficiency in terms of earned credit hours; (d) the majority of students listed as migrating from Tennessee Colleges of Applied Technology (TCATs) are actually returning or readmitted students; and (e) the majority of TCAT students change their major after transferring.
T E N N E S S E E
H I G H E R
E D U C A T I O N
C O M M I S S I O N

Articulation and Transfer
in Tennessee
Higher Education
Annual Report
2012-13 Academic Year
October 1, 2013
Tennessee Higher Education Commission

Tennessee Higher Education Commission Articulation and Transfer Report 2013
ii
TENNESSEE HIGHER EDUCATION COMMISSION
2013 – 2014 COMMISSION MEMBERS
Mr. Cato Johnson, Chair, Bartlett, 7th Congressional District
Mr. Jon Kinsey, Vice-Chair, Chattanooga, 3rd Congressional District
Mr. Evan Cope, Vice-Chair, Murfreesboro, 4th Congressional District
Mayor A C Wharton, Secretary, Memphis, 9th Congressional District
Mr. Tre Hargett, Secretary of State
Mr. Justin P. Wilson, State Comptroller
Mr. David H. Lillard, Jr., State Treasurer
Mr. Keith Wilson, Kingsport, 1st Congressional District
Mr. Greg Isaacs, Knoxville, 2nd Congressional District
Ms. Pam Koban, Nashville, 5th Congressional District
Mr. Charles W. Bone, Hendersonville, 6th Congressional District
Ms. Sharon L. Hayes, Brownsville, 8th Congressional District
Dr. Gary Nixon, non-voting ex-officio, Executive Director, State Board of Education
Mr. Adam Jarvis, voting ex-officio, East Tennessee State University
Mr. Robert Fisher, non-voting ex-officio, University of Tennessee, Chattanooga

Tennessee Higher Education Commission Articulation and Transfer Report 2013
iii
TABLE OF CONTENTS
I. Background ......................................................................................................... 1
II. Executive Summary ............................................................................................. 3
III. Complete College Tennessee Act: Articulation and Transfer Policies ..................... 5
IV. Tennessee Transfer Student Profile: Academic Year 2012-13 ............................... 9
A. Statewide Student Transfer Activity ...................................................... 9
B. Transfer Activity in Public Higher Education ...................................... 15
C. Student Transfer Activity by Institution .............................................. 19
D. Academic Characteristics of Transfer Students ................................... 23
V. Student Migration from Tennessee Colleges of Applied Technology .................... 26
VI. Transfer History of 2011-12 Degree Completers at Public Universities ............... 31
VII. Conclusion ......................................................................................................... 32
APPENDIX A. Members of Reverse Transfer Taskforce ............................................. 33
APPENDIX B. Members of Reverse Transfer Taskforce Subcommittees .................... 36
APPENDIX C. Taskforce Recommended Policies, Procedures, and Guidelines for Reverse Transfer ............................................................................... 37
APPENDIX D. Transfers by Sector of Origin and as a Percent of Undergraduate Enrollment, Public Institutions, AY 2012-13 ..................................... 42
APPENDIX E. Transfers by Sector of Origin, TICUA Member Institutions, AY 2012-13 ....................................................................................... 43
APPENDIX F. Transfer Students by Sending Institution and Receiving University, Public Institutions, AY 2012-13 ........................................................ 44
APPENDIX G. Transfer Students by Sending Institution and Receiving Community College, Public Institutions, AY 2012-13 ........................ 45
APPENDIX H. Transfer Students by Credits and Degrees Brought to Receiving Institutions, AY 2012-13 ................................................................... 46
APPENDIX I. Public Transfer Students by Credit Hours Earned at Sending Institutions, AY 2012-13 ................................................................... 48

Tennessee Higher Education Commission Articulation and Transfer Report 2013
iv
LIST OF FIGURES
Figure 1. Student Transfer by Receiving Sector and Semester, AY 2012-13 .............. 9
Figure 2. Student Transfer Patterns, AY 2012-13 ................................................... 10
Figure 3. Transfers by Originating Location, In-State vs. Out-of-State, AY 2012-13 ............................................................................................. 11
Figure 4. Transfers into Tennessee Public and TICUA Institutions by State of Origin, AY 2012-13 ..................................................................... 12
Figure 5. Transfer and Total Undergraduate Headcount, Public Institutions, AY 2012-13 ............................................................................................. 15
Figure 6. Demographic Characteristics of Transfer and Native Students, AY 2012-13 ............................................................................................. 16
Figure 7. Transfers and Non-transfers by Enrollment Status and Semester, AY 2012-13 ............................................................................................. 16
Figure 8. Transfers into Public Institutions, AY 2012-13 ........................................ 17
Figure 9. Public Transfer Activity, AY 2012-13 ....................................................... 18
Figure 10. Transfer Students as a Percent of Public Higher Education Undergraduate Enrollment, AY 2012-13 .................................................. 19
Figure 11. Transfers as a Percent of TICUA Undergraduate Enrollment, Fall 2012 ................................................................................................. 21
Figure 12. Academic Majors of Transfer Students at Receiving Institutions,
AY 2012-13.............................................................................................. 23
Figure 13. Transfer Students by Credits and Degrees Transferred In, AY 2012-13.............................................................................................. 24
Figure 14. Academic Majors at Transfer with More than 60 Credits and No Prior Degree, AY 2012-13 .................................................................. 25
Figure 15. Demographic Characteristics of TCAT Transfers and Traditional Public Transfers, AY 2012-13 ................................................ 29

Tennessee Higher Education Commission Articulation and Transfer Report 2013
v
LIST OF TABLES
Table 1. Frequently Visited Tennessee Transfer Pathways, www.tntransferpathway.org ........................................................................ 6
Table 2. Frequently Visited Tennessee Transfer Pathway Institutions, www.tntransferpathway.org ........................................................................ 6
Table 3. Student Transfer Activity by Sector of Origin, AY 2012-13 ........................ 10
Table 4. Transfers by Sending State, Semester, and Receiving Sector, AY 2012-13 ............................................................................................... 13
Table 5. Fall Transfer Activity within Tennessee Public Sector, Fall 2007—Fall 2012 ................................................................................. 18
Table 6. Transfers as a Percent of Public Higher Education Undergraduate Enrollment,Fall 2007-Fall 2012 ................................................................ 20
Table 7. Transfers as a Percent of Undergraduate Enrollment by Sector and Semester ................................................................................................... 22
Table 8. Each Institution’s Share of Total Public Transfer Activity, AY 2012-13 ............................................................................................... 22
Table 9. Migration of TCAT Transfers into Tennessee Public Institutions, AY 2012-13 ............................................................................................... 27
Table 10. Migration of TCAT Transfers by Receiving Institution, AY 2012-13 ............ 28
Table 11. Student Registration Types of TCAT Transfers, AY 2012-13 ...................... 30
Table 12. TCAT Majors and Post-transfer Major Change, TCAT Transfers, AY 2012-13 ............................................................................................... 31

Tennessee Higher Education Commission Articulation and Transfer Report 2013
1
I. Background
The annual Articulation and Transfer report fulfills the statutory requirement of the Tennessee Higher Education Commission (THEC) to evaluate the progress of articulation and transfer policy implementation and transfer student activity.
The 2013 Articulation and Transfer report presents an update on the implementation of the articulation and transfer mandate of the Complete College Tennessee Act (CCTA) of 2010. It also examines Tennessee student transfer activity in the academic year (AY) 2012-13 as well as characteristics and institutional migration of former students of Tennessee Colleges of Applied Technology (TCAT).
For the first time, this report analyzes student transfer activity for the entire academic year 2012-13. Specifically, it looks at new transfers in Tennessee higher education institutions in the summer and fall of 2012 and the spring of 2013. To observe trends and to be consistent with the past reports, select tables and figures present data only for the fall 2012 term.
Definitions
A transfer student is a person who enrolled as an undergraduate at the receiving institution for the first time (that is, was not a returning or readmitted student) and brought in credits earned at another postsecondary institution. Transfer students include individuals returning to higher education with degrees at the baccalaureate level or above. This definition differs from the ones used in the Tennessee Higher Education Fact Book and in the outcomes-based funding formula in that it excludes returning and readmitted students who were coded as transfers by institutions. Therefore, the reader is cautioned not to compare the number of transfer students and the number of credit hours transferred that are produced by these distinct methodologies.
A native student is a student at a public Tennessee institution who has never transferred from another institution during her academic career. However, native students include individuals who took courses in a higher education institution different from their current institution of enrollment while in high school.
A non-transfer student is a student at a public Tennessee institution who was
not identified as a transfer student at any time during the academic year of interest. By definition, non-transfer students include native students as well as students who transferred into the Tennessee public sector prior to 2012-13.
A TCAT transfer is a student who was enrolled in a public Tennessee institution in the academic year 2012-13, who had taken classes at a Tennessee College of Applied Technology in the previous semester. For fall public enrollees, enrollment in TCAT classes may have occurred in either summer or spring. No assumption of transferred credits is made with these students.
Articulation and Transfer Policies
To meet the CCTA requirements, the Tennessee Board of Regents (TBR), University of Tennessee (UT), and THEC developed a University Parallel Track program. This initiative designed 49 transfer pathways across 28 disciplines between

Tennessee Higher Education Commission Articulation and Transfer Report 2013
2
the state’s community colleges and public universities. These pathways—and the Common General Education Core—provide seamless transfer for community college students to any Tennessee public university in the fields of study covered.
Additionally, the systems and THEC are developing a Reverse Transfer policy,
which will allow students who have accrued the appropriate number of credits after transferring to a public university to retroactively receive an associate’s degree from their originating community college. The Tennessee Prior Learning Assessment (PLA) initiative promotes the evaluation of non-traditional learning for academic credit at Tennessee public institutions and ensures transferability of PLA credits among systems and institutions.
Student Transfer and Migration Activity
The student population in Tennessee is rather mobile. Among bachelor’s degree recipients in 2011-12, 44.7 percent had attended two or more institutions during their academic career. In AY 2012-13, 5.6 percent of the undergraduate student body transferred into Tennessee public institutions or Tennessee Independent Colleges and Universities Association (TICUA) member institutions. Most transfers took place within Tennessee (over 60 percent), and a majority of students transferring from out-of-state institutions are returning Tennessee residents (56 percent of all out-of-state transfers). Transfer activity within the public sector is multidirectional, but is mostly vertical, among community colleges and universities. Although similar to their non-transfer counterparts, transfer students include more adults (39.3 percent compared to 23.6 percent). Over 29 percent of students transfer with more than 60 credits, and most do so without earning an associate’s degree. Individuals migrating into public colleges and universities from Tennessee Colleges of Applied Technology (TCAT) are quite similar to traditional transfer students but include a larger percentage of females. Unlike traditional transfers, TCAT transfers include mostly returning and readmitted students. The majority of TCAT transfers (75 percent) change their major at transfer.
Protecting Personally Identifiable Information
Throughout this report, THEC seeks to comply with Family Educational Rights and Privacy Act (FERPA) requirements to protect students’ personally identifiable information by suppressing individual cells containing five observations or fewer. As a
result, the totals reported in some tables may not equal the real total due to omitting these suppressed values. All such cases are identified with a special note under the respective table, where the unsuppressed total for the entire table is reported separately.
Acknowledgments
This report is made possible through the constant effort of the Tennessee Board of Regents and University of Tennessee systems and their member institutions to provide quality data on their student populations and updates on articulation and transfer policy implementation. For the fourth year, THEC acknowledges the unremitting effort of TICUA and its member institutions to provide data on transfer students for this report. This collaboration has made possible a statewide and yearlong snapshot of student transfer activity both in the public and private sectors.

Tennessee Higher Education Commission Articulation and Transfer Report 2013
3
II. Executive Summary
Statewide Student Transfer Activity
During the academic year 2012-13, comparable proportions of students transferred into the public sector and TICUA member institutions in each semester. The majority of students—about 60 percent in each sector—transferred in the fall semester. Less than 30 percent of all annual transfers (in each sector and in total) arrive in spring (Figure 1).
Most transfers (60.2 percent) took place within Tennessee higher education, while 36.5 percent of transfer students arrived from other states. Slightly over
three percent of transfers moved to TICUA institutions from unknown locations (Figure 2; Figure 3).
Over 56 percent of students transferring from out-of-state institutions were actually returning Tennessee residents (Figure 3).
Half of the out-of-state students transferred from only nine states (sending more than 400 students each): Mississippi, Georgia, Kentucky, Alabama, Virginia, North Carolina, Florida, California, and Texas (Figure 4, Table 4).
Trends, Demographics, and Enrollment Status
Transfer students have constituted a steady percentage of the overall public undergraduate enrollment in Tennessee over time. On average, 7.6 percent of the fall enrollment for the past seven years have been transfers (Figure 5).
Transfer students are similar to native students in terms of their demographic and academic characteristics; however, they include a higher percentage of adult students (Figure 6).
Public Sector Transfers
Over 54 percent of transfers into the public sector are from other Tennessee public institutions (Figure 2; Figure 9).
Transfer activity within the public sector is multidirectional; however, the majority (72.9 percent) of transfers is vertical—between community colleges and universities—rather than horizontal (27.1 percent). The direction and relative shares of transfers among Tennessee public institutions have been consistent for the past several years (Figure 9; Table 5).
The traditional model of transfer—from community colleges to public universities—accounts for less than half of all transfer activity within Tennessee public higher education (about 43 percent). The fall-semester share of community college transfers into public universities has remained stable over time, but it is lower for the entire academic year (Figure 9; Table 5).
During the entire 2012-13 academic year, 29.5 percent of internal public-sector transfers moved from a university into a community college. For the fall semester, this percentage is lower (24.2 percent) than for the whole academic year, although it is slightly higher than in previous years (Figure 9; Table 5).

Tennessee Higher Education Commission Articulation and Transfer Report 2013
4
Transfer Activity by Institution
On average, the portion of transfer students at Tennessee public universities (5.6 percent for AY 2012-13) is similar to the one at community colleges (5.7 percent) (Figure 10; Appendix D).
The share of transfer students in the fall semester, measured as a percent of public undergraduate enrollment, has been consistent across institutions and systems over time (Table 6).
The share of transfer students in the fall semester (7.5 percent) is much higher than in summer (4.7 percent) or spring (3.9 percent); this fact affects the estimation of the annual average (Table 7).
Academic Characteristics of Transfer Students
Just over 50 percent of all public transfer students major in three broad areas: Liberal Arts and Sciences, Health Professions and Related Services, and Business, Management and Administrative Services (Figure 12).
Almost 21 percent of public transfer students transfer before earning more than 12 credits and nearly 61 percent before earning over 48 credits (Figure 13).
Over 29 percent of students transfer with more than 60 hours; most of them do so without having earned an associate’s degree (Figure 13).
For students who transfer with more than 60 credits but without a degree, the most popular major at a new institution is Health Profession and Related Services (Figure 14).
Student Migration from Tennessee Colleges of Applied Technology
During the academic year 2012-13, Tennessee Colleges of Applied Technology sent 863 students to the state’s public colleges and universities (Table 9).
Students migrating from Tennessee Colleges of Applied Technology are quite similar to traditional public transfers in terms of their demographic characteristics but include a larger percentage of female students (Figure 15).
Unlike traditional transfers, most TCAT transfers are returning or readmitted students at their receiving institutions (Table 11).
After transfer, about 72 percent of TCAT transfers choose one of the four majors: Health Professions; Liberal Arts and Sciences; Business, Management and Administrative Services; Engineering, and Personal Improvement.
About 75 percent of TCAT transfers change their broad major fields after transferring into a college or university (Table 12).
Degree Completers at Tennessee Public Universities
Among 2011-12 baccalaureate completers, 44.7 percent had changed schools at least once during their postsecondary academic career.
Among 2011-12 baccalaureate completers, 33.4 percent previously enrolled at any two-year college and 29.1 percent at a Tennessee community college.
Tennessee Higher Education Commission Articulation and Transfer Report 2013
5
III. Complete College Tennessee Act: Articulation and Transfer Policies
Background
The State is developing and implementing policies that provide for better
articulation among institutions and more efficient transfer of students. A central focus of the Complete College Tennessee Act (CCTA) of 2010 was to improve the transferability and articulation of college credit between the community college and university sectors of higher education. Specifically, the CCTA directed the Tennessee Higher Education Commission (THEC), in cooperation with the University of Tennessee (UT) and the Tennessee Board of Regents (TBR), to ensure that 60 hours of instruction in defined Tennessee Transfer Pathways can be fully transferred from community colleges and applied toward the requirements for a bachelor’s degree at state universities.
Tennessee is making great strides to implement the articulation and transfer
mandate of the Complete College Tennessee Act of 2010. The systems, in collaboration with THEC, continue to monitor the health and productivity of the transfer process and implement new policy initiatives. In the area of articulation and transfer, the CCTA implementation has been structured around the following key initiatives: (a) establishing Tennessee Transfer Pathways, (b) developing a Reverse Transfer Policy, and (c) ensuring transferability of Prior Learning Assessment (PLA) credits.
[A] TENNESSEE TRANSFER PATHWAY
Recently implemented Tennessee Transfer Pathways expedite student
progression toward a bachelor’s degree. Introducing 60 hours of fully transferrable instruction from community colleges to state public universities has ensured a smoother transition of students into baccalaureate programs. Over time, 49 pathways were developed across 28 disciplines. These pathways provide seamless transfer for community college students to any public university or TICUA institution in Tennessee in the fields of study covered.
Transcripts of community college students who complete a transfer pathway
clearly state that the record involves a transfer pathway and denote the specific area of emphasis completed. Through the use of distinct program codes, student headcount and completion rates are collected and reported. Common course numbering has been established for all transfer pathways.
One of the primary methods of communicating information about transfer
pathways to students is through the Tennessee Transfer Pathways website (www.tntransferpathway.org). The two systems collaborated to develop this site as a comprehensive, one-stop reference point for students, faculty, advisors, and administrators. The website provides essential information for students concerning the mechanics of the transfer process, a curriculum for each pathway, progress worksheets for students, and links to relevant information.
This site has seen tremendous success in its first two years of operation. In the
past year, the website has been visited 95,112 times, for an average of 220 daily visits

Tennessee Higher Education Commission Articulation and Transfer Report 2013
6
(up from 205 visits a day in 2011). There have been 66,937 unique visitors to the site; almost 32 percent of the traffic is generated by repeat visitors. The top five cities generating traffic are Knoxville, Chattanooga, Nashville, Memphis, and Murfreesboro. Many out-of-state visitors are coming from Georgia, North Carolina, Illinois, California, and Texas.
Tables 1 and 2 present a traffic analysis of the site by transfer pathway and
institution.
Table 1. Frequently Visited Tennessee Transfer Pathways, www.tntransferpathway.org
Ranking Academic Pathway
1 Business Administration
2 Pre-Nursing
3 Accounting
4 Pre-Health (Dental, Medicine, Vet, etc.)
5 Biology
Table 2. Frequently Visited Tennessee Transfer Pathway Institutions,
www.tntransferpathway.org
Ranking Institution
1 Volunteer State Community College
2 Middle Tennessee State University
3 University of Tennessee, Knoxville
4 University of Tennessee, Chattanooga
5 Southwest Tennessee Community College
[B] REVERSE TRANSFER POLICY
THEC, TBR, and UT are collaborating to develop a comprehensive Reverse
Transfer Policy, which would allow students who transferred to a public university to also receive an associate’s degree from their originating community college if, after transferring, they have accrued the required number of credit hours. Reverse Transfer is defined as “a credit review of students who transfer from a community college to a four year institution prior to receipt of the associate’s degree to determine if and when the students complete the associate’s degree requirements and, if so, to award them an associate’s degree.” When implemented, the Reverse Transfer Policy will apply to all public and private institutions in Tennessee and will serve as a national model.
In April 2012, Governor Haslam signed HB 2827, which “authorized and
encouraged” the TBR community colleges to enter into reverse transfer agreements with the state’s public and private four-year institutions that are accredited by the

Tennessee Higher Education Commission Articulation and Transfer Report 2013
7
Southern Association of Colleges and Schools (SACS). The TBR and UT four-year institutions were also “authorized and encouraged” to enter into reverse transfer agreements with the TBR community colleges. Concurrently, Lumina Foundation announced it would receive grant proposals to “support partnerships of community colleges/universities that significantly scale-up approaches to awarding associate degrees to the many students who transfer from community colleges to universities before receiving the associates degree when students demonstrate the learning required for the degree.”
In July 2012, a taskforce was convened to begin work on the reverse transfer
policy. Members of the taskforce included representatives from TBR, UT, TICUA, and THEC. The University of Maryland’s reverse transfer system served to illustrate how a similar process could be developed and implemented across the three systems of higher education in Tennessee (TBR, UT, and TICUA). Members of the Reverse Transfer Taskforce are listed in Appendix A.
Although the grant was not funded, the three higher education systems and
THEC agreed to continue their collaboration towards a state-wide Reverse Transfer policy. Recently, Tennessee was invited to re-submit its proposal to be considered for a second round of funding.
The following subcommittees representing all higher education systems and
THEC were formed in the fall of 2012: Policy/Procedures, Costs, Marketing, Research Design, and Information Technology. Gloria Gammell, Program Manager from the UT office of Academic Affairs and Student Success, was enlisted to coordinate the project. In November 2012, the subcommittees began working on their respective charges. Subcommittees and their members are listed in Appendix B.
The Policy/Procedures subcommittee submitted its recommendations to the full
taskforce and the Articulation and Transfer Council in spring of 2013. The recommendations were revised and approved by the Council on May 29, 2013 (Appendix C).
[C] PRIOR LEARNING ASSESSMENT THEC continues to lead the work of the Tennessee Prior Learning Assessment
Task Force. The Task Force incorporates a broad statewide team to promote and expand ways of evaluating non-traditional learning for academic credit at Tennessee public institutions. Prior Learning Assessment will decrease time to degree for many students who have acquired learning outside the traditional classroom. This effort has been funded by a competitive grant award from Complete College America with the support from the Bill & Melinda Gates Foundation.
Regarding articulation and transfer policies, the key issue is the transferability
of PLA credits among systems and institutions. The main goal is to ensure that relevant PLA credits accepted by one institution will be accepted by all other institutions at the time of transfer in the same manner as traditional classroom credit. In fall of 2012, the Task Force drafted the Recommended Standards in Prior Learning Assessment (PLA) Policy and Practice for Tennessee Public Colleges and Universities,

Tennessee Higher Education Commission Articulation and Transfer Report 2013
8
which include guidelines for the transcription and transfer of PLA credit at public institutions.
The standards were formally approved by the TBR system in September 2013.
Although UT has not adopted the standards as a formal system-wide policy, it uses them to improve practice: PLA that is recognized as a course equivalent in a completed pathway, course cluster, or associate’s degree will transfer accordingly. Therefore, both systems have agreed to accept PLA credit in transfer if the credit falls within the aforementioned parameters.
In addition, the Task Force and THEC have continued to work to enhance PLA
programs at institutions, with a new focus on increasing capacity, resources, and demand for PLA programs on campuses across the state. Furthermore, THEC has been working with UT and TBR to standardize the tracking and collection of student PLA-related data.
Recent Developments and Future Actions
The Articulation and Transfer Council, a collaborative body of representatives
from TBR, UT, and TICUA, met in May 2013 to consider the following initiatives. The Council approved the work of the Reverse Transfer Taskforce, including
policies outlining how the work should be handled on the campuses and inclusion of TICUA institutions in Reverse Transfer conversations.
Realizing that much of the success of the initiative is tied directly to the software needed to fully automate the process, THEC, UT, and TBR will determine the best course of action regarding the software required to handle the implementation of Reverse Transfer Policy. It is anticipated that $300,000 will be appropriated for the purchase or development of this software.
The Council reviewed the extant transfer pathways and will take further
action on the Economics pathway in fall of 2013. The faculty in Early Childhood at the University of Tennessee at Knoxville
submitted a proposal to develop a pathway in that discipline. UT and TBR faculty met on September 23rd, 2013, to discuss the possibility of developing
this additional pathway. The Council agreed that the pathways should be reviewed on a rotating
basis to ensure they are current. The UT and TBR systems are developing a review cycle to begin in spring of 2014.
The University of Tennessee will begin collecting data at the end of the fall of
2013 to determine the number of students who transferred in on the pathways. These students will be followed to determine if they persist and graduate in a timely manner.

Tennessee Higher Education Commission Articulation and Transfer Report 2013
9
IV. Tennessee Transfer Student Profile: Academic Year 2012-13
This section examines patterns in Tennessee student transfers in the 2012-13
academic year and, when appropriate, trends over time. The analysis of student transfer activity is conducted and presented at the following levels: (1) statewide transfer activity, (2) transfers within public higher education, (3) transfers by sending and receiving institutions, and (4) select academic characteristics of transfer students. This section also compares various characteristics of transfer and native students.
A. Statewide Student Transfer Activity
Patterns in Student Transfer Activity During the 2012-13 academic year, 26,375 students transferred into Tennessee
public higher education institutions, and 6,905 students transferred into TICUA member institutions (Figure 1). Commensurate proportions of students moved into both sectors in each semester of the academic year. Most students transferred in the fall semester: almost 60 percent in the public sector and over 62 percent in TICUA institutions. About 29 percent of all transfers in each sector arrived in spring, and the smallest share of transfer happened in summer—11.6 percent into public institutions and 8.5 percent into TICUA institutions.
Figure 1. Student Transfer by Receiving Sector and Semester, AY 2012-13 *
* The percentages may not add up to 100 due to rounding.
During the academic year 2012-13, a total of 33,280 students transferred into a
Tennessee public or TICUA member institution (Figure 2).

Tennessee Higher Education Commission Articulation and Transfer Report 2013
10
Figure 2. Student Transfer Patterns, AY 2012-13
The majority of students (60.2 percent or 20,037 students) moved within Tennessee higher education from one state public or private nonprofit institution to another.
Thirty-six and a half percent (12,143 students) transferred from out-of-state institutions.
The remaining 3.3 percent of students transferred into TICUA institutions from unknown locations (1,100 students).
Comparable proportions of out-of-state students moved into the public sector
(36.5 percent) and TICUA institutions (36.6 percent). In sharp contrast, within-sector transfers accounted for 54.2 percent (14,285 students of 26,375 transfers) of the public institution total, but only 6.2 percent (425 students of 6,905 transfers) of TICUA transfers were from other TICUA institutions. This indicates that more intense internal transfer activity takes place within the public sector, as compared to transfers among TICUA member institutions.
Student Transfer Activity by Sector of Origin
In AY 2012-13, the public sector received 26,375 transfer students (79.3
percent of the total), while TICUA institutions received 6,905 transfers (20.7 percent). A majority of students (17,137 students or 51.5 percent) came from Tennessee public institutions; out-of-state institutions sent 12,143 students (36.5 percent); and 2,900 students (8.7 percent) transferred from Tennessee’s independent sector (Table 3).
Table 3. Student Transfer Activity by Sector of Origin, AY 2012-13
RECEIVING SECTOR TRANSFERS BY SECTOR OF ORIGIN
Total Transfers
Overall Enrollment
Tennessee Public
Tennessee Independent
Out-of-State
Unknown
Public University Total 8,170 1,162 5,114
14,446 258,952
Community College Total 6,115 1,313 4,501
11,929 209,759
PUBLIC HIGHER ED. TOTAL 14,285 2,475 9,615
26,375 468,711
TICUA TOTAL 2,852 425 2,528 1,100 6,905 –
GRAND TOTAL 17,137 2,900 12,143 1,100 33,280 –

Tennessee Higher Education Commission Articulation and Transfer Report 2013
11
See Appendix D and Appendix E for detailed tables of academic year 2012-13 enrollment and transfer activity by sector and institution.
Out-of-state Student Transfer Activity
The following caveats should be considered when interpreting the data on out-of-state transfers. First, for different graphs on public institutions, this report relies on either the resident status of transfer students or the state in which the previous institution is located. Due to the data structure at TICUA, the report uses only the state of the prior institution when examining the private sector. Second, out-of-state students are not homogeneous. They comprise two large groups: residents of other states and Tennessee residents transferring from out-of-state colleges and universities
to institutions in their home state. These two groups of transfer students, out-of-state residents and returning Tennessee residents, are reported separately (Figure 3).
Figure 3. Transfers by Originating Location, In-State vs. Out-of-State, AY 2012-13
As Figure 3 shows, Tennessee residents transferring into the state’s public and
private institutions accounted for 60.2 percent of all AY 2012-13 transfers into Tennessee higher education. The general group of out-of-state students accounted for 36.5 percent of all transfers and included the following categories: transfers into TICUA institutions (7.6 percent), transfers by residents of other states (8.4 percent), and transfers of Tennessee residents returning to their home state (20.5 percent).
It is remarkable that for public transfers, the group of returning Tennessee
residents is 2.4 times larger than the group of “true” out-of-state students and constitutes 56.1 percent of all out-of-state transfers. From a policy perspective, this observation is critical because it may allow us to better understand the reasons why a student might transfer. One may suppose that Tennessee students return due to a combination of financial, academic, convenience, and personal considerations. Such a

Tennessee Higher Education Commission Articulation and Transfer Report 2013
12
large number of returning residents suggests that, in the long run, Tennessee may be losing fewer students to other states than the data on high-school graduate out-migration would suggest. Availability of lottery scholarships could be a major factor in making a decision to transfer to a home state’s public institution.1
Figure 4 shows the state of origin for transfer students based on the location of
their sending institution. To capture a holistic picture of out-of-state transfers, this report examines transfers into the public sector and TICUA institutions together. As the figure shows, states differ greatly in the number of students they send to Tennessee. In AY 2012-13, nine states with the highest number of transfer students sent to Tennessee (more than 400 students each) accounted for 49.4 percent of all out-of-state transfers. These states included six neighboring states: Mississippi (8.8 percent), Georgia (6.7 percent), Kentucky (6.6 percent), Alabama (5.8 percent), Virginia (5.6. percent), and North Carolina (3.7 percent). This group also included three traditionally big providers of transfer students: Florida (5.3 percent), California (3.7 percent), and Texas (3.3 percent).
Figure 4. Transfers into Tennessee Public and TICUA Institutions by State of Origin, AY 2012-13
Table 4 presents this information by state, semester, and sector.
1 Tennessee residents, who were eligible for Tennessee Education Lottery Scholarships (TELS)
upon completion of high school requirements, but who enrolled in a regionally accredited out-
of-state postsecondary institution after high school graduation, may transfer to an eligible Tennessee postsecondary institution and receive a TELS award.


Tennessee Higher Education Commission Articulation and Transfer Report 2013
16
Figure 6. Demographic Characteristics of Transfer and Native Students, AY 2012-13
Figure 7 compares full-time and part-time enrollment of transfer and non-transfer students by semester. As defined in the Background section, non-transfer students include individuals who did not transfer in the term on interest; however, they include students who transferred in their prior academic history. In each semester, transfer and non-transfer students enrolled full-time and part-time at similar rates, indicating that transfer students were working towards their degree at the same level of intensity as native students. The largest difference between full-time and part-time enrollment is in the spring semester when over 65 percent of non-transfer students—as opposed to 59 percent of transfers—enroll full time. This drop in full-time enrollment in spring is likely related to the reasons for transfer: inadequate performance at the prior institution in fall, family and work obligations, and others.
Figure 7. Transfers and Non-transfers by Enrollment Status and Semester, AY 12-13
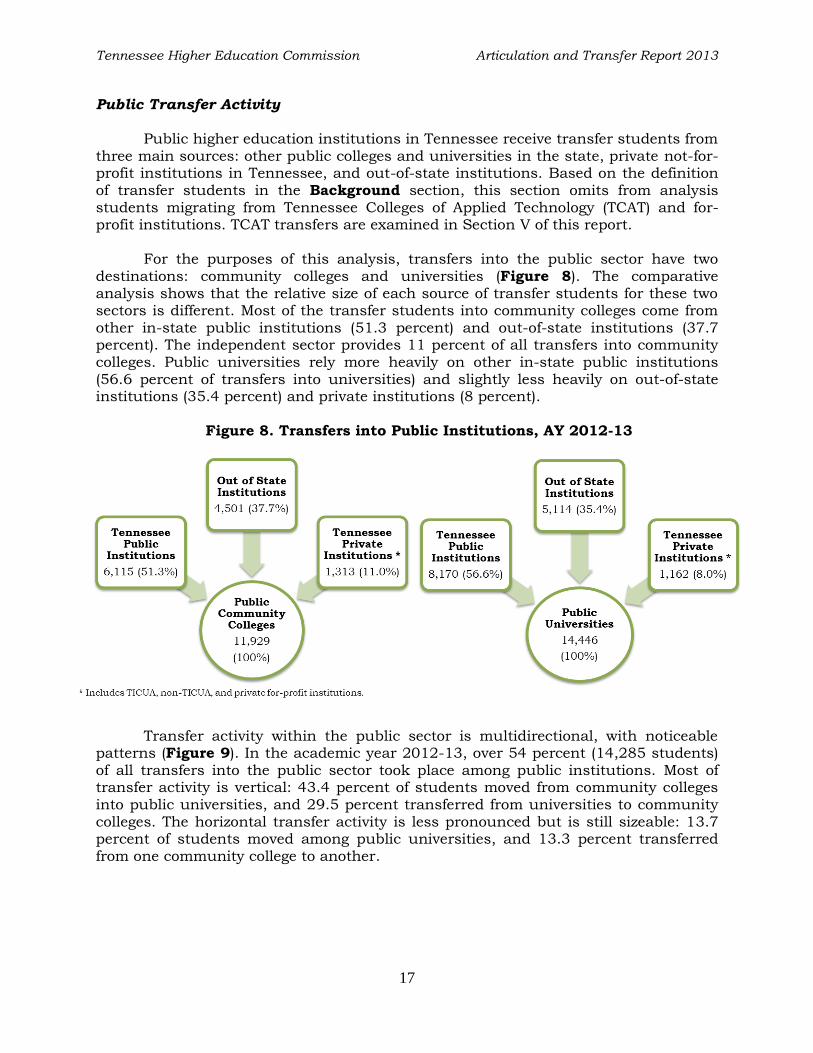
Tennessee Higher Education Commission Articulation and Transfer Report 2013
17
Public Transfer Activity
Public higher education institutions in Tennessee receive transfer students from
three main sources: other public colleges and universities in the state, private not-for-profit institutions in Tennessee, and out-of-state institutions. Based on the definition of transfer students in the Background section, this section omits from analysis students migrating from Tennessee Colleges of Applied Technology (TCAT) and for-profit institutions. TCAT transfers are examined in Section V of this report.
For the purposes of this analysis, transfers into the public sector have two
destinations: community colleges and universities (Figure 8). The comparative analysis shows that the relative size of each source of transfer students for these two sectors is different. Most of the transfer students into community colleges come from other in-state public institutions (51.3 percent) and out-of-state institutions (37.7 percent). The independent sector provides 11 percent of all transfers into community colleges. Public universities rely more heavily on other in-state public institutions (56.6 percent of transfers into universities) and slightly less heavily on out-of-state institutions (35.4 percent) and private institutions (8 percent).
Figure 8. Transfers into Public Institutions, AY 2012-13
Transfer activity within the public sector is multidirectional, with noticeable
patterns (Figure 9). In the academic year 2012-13, over 54 percent (14,285 students) of all transfers into the public sector took place among public institutions. Most of transfer activity is vertical: 43.4 percent of students moved from community colleges into public universities, and 29.5 percent transferred from universities to community colleges. The horizontal transfer activity is less pronounced but is still sizeable: 13.7 percent of students moved among public universities, and 13.3 percent transferred from one community college to another.

Tennessee Higher Education Commission Articulation and Transfer Report 2013
18
Figure 9. Public Transfer Activity, AY 2012-13
When restricted to the fall semester, the observed patterns of within-public-
sector transfers are consistent with the data from previous reports (Table 5). One may conclude that transfers among Tennessee public institutions have maintained the same relative size and direction for the past several years. Even with a slight drop in the headcount for students transferring within the public sector, the transfer rates among different types of institutions remained nearly constant.
Table 5. Fall Transfer Activity within Tennessee Public Sector,
Fall 2007—Fall 2012
Fall Fall Fall Fall Fall Fall
2007 2008 2009 2010 2011 2012
VERTICAL TRANSFERS
from community colleges to universities 49.8% 50.2% 48.2% 50.3% 49.9% 48.9%
from universities to community colleges 22.8% 23.4% 23.9% 22.2% 22.9% 24.2%
HORIZONTAL TRANSFERS
among community colleges 11.9% 10.7% 12.7% 12.4% 12.7% 12.3%
among universities 15.4% 15.6% 15.1% 15.1% 14.4% 14.6%
PUBLIC TRANSFERS TOTAL 7,868 7,804 8,645 9,008 9,388 8,873
The share of transfers from universities into community colleges has been sizeable over time: for the past six years it has never fallen below 22 percent of all fall public transfers. This share is higher for the entire academic year (Figure 9).

Tennessee Higher Education Commission Articulation and Transfer Report 2013
19
C. Student Transfer Activity by Institution
Transfer Students as a Percent of Undergraduate Enrollment
Figure 10 presents incoming transfer students as a percentage of undergraduate enrollment by institution and sector. In AY 2012-13, the total public undergraduate enrollment was 468,711 students; 26,375 (5.6 percent) of them were transfer students. Of the 209,759 students enrolled in community colleges, 5.7 percent (11,929 students) were transfers. The percent of enrollees that moved into the university sector was similar, at 5.6 percent (14,446 students).
Except TTU, all TBR universities were above the average share of transfers
relative to total undergraduate enrollment for public universities. For UT, the Chattanooga campus was above the university average; the campuses in Knoxville and Martin had percentages below the average for universities and the entire public sector (5.6 percent). For community colleges, six institutions enrolled transfer students at a proportion higher than, or equal to, the average for the sector (5.7 percent), while seven colleges were below this sector-wide average. Southwest Tennessee Community College, Austin Peay State University, and Tennessee State University had the largest populations of transfers: over 7 percent of their public undergraduate enrollment. Walters State enrolled the smallest percentage of transfer students (3 percent).
Figure 10. Transfers as a Percent of Public Undergraduate Enrollment, AY 2012-13

Tennessee Higher Education Commission Articulation and Transfer Report 2013
20
The share of transfer students measured as a percent of total undergraduate fall enrollment at public institutions has been consistent across institutions and systems over time (Table 6). For universities, the TBR system traditionally has a greater percentage of transfers than the University of Tennessee system. Public universities, on average, have more transfer students than community colleges.
Table 6. Transfers as a Percent of Public Higher Education Undergraduate Enrollment,
Fall 2007-Fall 2012
Institution Fall Fall Fall Fall Fall Fall
2007 2008 2009 2010 2011 2012
Austin Peay State University 12.1% 7.7% 9.6% 9.1% 9.7% 9.1%
East Tennessee State University 9.8% 7.5% 8.4% 8.8% 10.0% 9.7%
Middle Tennessee State University 9.3% 8.2% 8.4% 9.4% 9.3% 9.1%
Tennessee State University 8.7% 6.1% 6.4% 8.0% 9.0% 10.0%
Tennessee Technological University 9.5% 6.7% 6.9% 8.0% 8.4% 7.5%
University of Memphis 7.8% 6.0% 6.7% 8.9% 9.4% 8.8%
TBR system 9.3% 7.1% 7.8% 8.9% 9.3% 9.0%
University of Tennessee, Chattanooga 8.0% 6.8% 6.6% 9.5% 8.8% 8.2%
University of Tennessee, Knoxville 5.4% 4.4% 4.4% 5.6% 5.2% 5.0%
University of Tennessee, Martin 5.2% 6.5% 6.1% 6.4% 6.6% 5.6%
UT System 5.9% 5.3% 5.2% 6.7% 6.4% 6.0%
All Public Universities 8.2% 6.5% 6.9% 8.2% 8.4% 8.0%
Chattanooga State Community College 7.9% 6.6% 7.1% 6.8% 7.8% 7.4%
Cleveland State Community College 5.7% 6.1% 5.8% 5.6% 4.8% 5.1%
Columbia State Community College 9.6% 8.0% 7.7% 9.5% 9.1% 9.0%
Dyersburg State Community College 5.6% 6.0% 6.9% 5.9% 6.3% 5.8%
Jackson State Community College 5.8% 5.4% 6.3% 5.8% 5.5% 5.1%
Motlow State Community College 7.8% 8.3% 8.2% 6.5% 6.5% 7.1%
Nashville State Community College 8.3% 7.9% 8.4% 7.1% 8.2% 9.1%
Northeast State Community College 6.8% 6.4% 6.9% 6.7% 5.8% 6.4%
Pellissippi State Community College 7.0% 6.2% 7.6% 7.0% 6.2% 7.2%
Roane State Community College 6.7% 6.1% 5.4% 5.1% 5.1% 4.3%
Southwest Tennessee Community College 6.4% 6.8% 6.7% 6.4% 7.1% 8.0%
Volunteer State Community College 8.5% 6.6% 7.4% 7.2% 7.7% 6.5%
Walters State Community College 4.2% 4.7% 4.8% 4.1% 4.0% 3.6%
All Community Colleges 7.0% 6.6% 7.0% 6.5% 6.7% 6.8%
Public Higher Education 7.6% 6.5% 6.9% 7.4% 7.6% 7.5%

Tennessee Higher Education Commission Articulation and Transfer Report 2013
21
Figure 11 presents transfer students as a percent of the fall undergraduate enrollment for TICUA member institutions. For TICUA, enrollment information was available only for fall of 2012. The sector-wide percentage of TICUA transfer students (7.5 percent) was equal to that of fall transfers at public institutions (Table 7). In contrast to public institutions, however, the differences among TICUA institutions were larger. King University enrolled the largest percentage of transfer students at 23.9 percent, while Rhodes College had the lowest proportion at 0.5 percent. Twelve TICUA institutions (38.7 percent) had transfer enrollment of more than 10 percent. Nine institutions (29 percent) had transfer enrollment of 5 percent or less.
Figure 11. Transfers as a Percent of TICUA Undergraduate Enrollment, Fall 2012
Table 7 presents a summary of transfers as a percent of undergraduate
enrollment by sector and semester.

Tennessee Higher Education Commission Articulation and Transfer Report 2013
22
Table 7. Transfers as a Percent of Undergraduate Enrollment by Sector and Semester
SECTOR Summer 2012 Fall 2012 Spring 2013 TOTAL
TBR universities 4.4% 9.0% 3.9% 6.3%
UT universities 2.3% 6.0% 2.6% 4.1%
TBR community colleges 5.8% 6.8% 4.4% 5.7%
PUBLIC SECTOR TOTAL 4.7% 7.5% 3.9% 5.6%
TICUA institutions – 7.5% – –
ALL TENNESSEE TRANSFERS – 7.5% – –
Top Sending and Receiving Public Institutions
Table 8 presents each institution’s share of transfer-in and transfer-out
students. Middle Tennessee State University received the largest portion of transfers (12.6 percent) of all institutions. The other top receiving institutions were the University of Memphis (9.8 percent), Southwest Tennessee Community College (7.1 percent), and East Tennessee State University (7 percent). Middle Tennessee State University was also the top sending institution (7.9 percent), followed by Southwest Tennessee (7 percent), Pellissippi State (6.8 percent), and Nashville State (6.5 percent). See Appendix F and Appendix G for a detailed count of transfer activity among all public institutions, showing the sending and receiving partners for each institution.
Table 8. Each Institution’s Share of Total Public Transfer Activity, AY 2012-13
PUBLIC INSTITUTION SENT * RECEIVED *
Austin Peay State University 2.6% 3.0%
East Tennessee State University 4.7% 7.0%
Middle Tennessee State University 7.9% 12.6%
Tennessee State University 3.0% 4.6%
Tennessee Technological University 3.7% 5.6%
University of Memphis 5.7% 9.8%
TBR UNIVERSITIES 27.6% 42.6%
University of Tennessee, Chattanooga 6.4% 5.4%
University of Tennessee, Knoxville 6.3% 6.7%
University of Tennessee, Martin 2.9% 2.5%
UNIVERSITY OF TENNESSEE SYSTEM 15.6% 14.6%
Chattanooga State Community College 4.4% 4.4%
Cleveland State Community College 2.0% 0.8%
Columbia State Community College 3.8% 2.8%
Dyersburg State Community College 2.2% 1.9%
Jackson State Community College 3.0% 1.6%
Motlow State Community College 4.7% 2.8%
Nashville State Community College 6.5% 6.0%
Northeast State Community College 3.3% 2.7%
Pellissippi State Community College 6.8% 5.2%
Roane State Community College 4.1% 2.4%
Southwest Tennessee Community College 7.0% 7.1%
Volunteer State Community College 5.5% 3.9%
Walters State Community College 3.6% 1.3%
COMMUNITY COLLEGES 56.8% 42.8%
PUBLIC HIGHER EDUCATION 100% 100%
* Percent of the total transfers by category (Sent or Received)

Tennessee Higher Education Commission Articulation and Transfer Report 2013
23
D. Academic Characteristics of Transfer Students
Academic Major at Transfer
A few academic program choices were dominant among transfer students in the academic year 2012-2013. Three broad areas, Liberal Arts and Sciences, Health Professions and Related Services, and Business, Management and Administrative Services, were chosen by half (50.3 percent) of all transfers into the public sector. Additionally, 13.6 percent transferred with an unknown major, while the remaining 36 percent of transfer students chose from 25 other fields of study (Figure 12).
Figure 12. Academic Majors of Transfer Students at Receiving Institutions, AY 2012-13

Tennessee Higher Education Commission Articulation and Transfer Report 2013
24
Credit Hours and Degrees at Transfer
Students transfer in the public sector at various points in their academic
careers. During the academic year 2012-13, almost 21 percent of public students transferred before they earned more than 12 credit hours, and nearly 61 percent before they earned over 48 credits (Figure 13).
It is more common for students with a high number of credits to transfer
without a degree: 5,449 transfer students (21.4 percent of students with reported credits) had accumulated more than 60 hours without earning an associate’s degree. In contrast, only 2,031 students (8 percent of students with reported credits) transferred with more than 60 credit hours after obtaining a degree. Only 8 percent of all public transfers (2,120 students) arrived at their destination institution with an associate’s degree. Another small group of transfers (673 students) already had a degree at the baccalaureate level or higher, accounting for 2.6 percent of the AY 2012-13 public transfers. The total number of degree holders (2,793 students) exceeds the number of undergraduates who transfer with more than 60 hours and with a degree (2,031 students). This happens because (a) institutions do not always report all past credits, and (b) prior awards include degrees earned over the entire academic career. As a result, 762 students with previously earned degrees are included in various credit categories below 60 credits.
Appendix H presents a headcount and percentage of transfer students by credits and degrees brought to receiving institutions. Appendix I displays a headcount and percentage of transfer students by credit hours earned at their sending institutions.
Figure 13. Transfer Students by Credits and Degrees Transferred In, AY 2012-13
* Graph and percentage exclude 934 students with missing data on credits.
5,270
3,968 3,617
2,585 2,521
5,449
2,031 2,120
673
20.7% 15.6% 14.2% 10.2% 9.9% 21.4% 8.0%
<=12 13-24 25-36 37-48 49-60 >60 nodegree
>60 withdegree
AA/AS ≥BA/BS
Degree holders: 2,793

Tennessee Higher Education Commission Articulation and Transfer Report 2013
25
Figure 14 presents academic majors selected by students who transferred with more than 60 credits but without an associate’s degree. A comparison of Figures 12 and 14 shows that these students predominantly chose the same four broad academic fields as the majority of all transfer students; however, the order of preference in major was different. Liberal Arts and Sciences, the most popular field among all transfer students, occupies only the fourth position among students with many pre-transfer credits but no prior degree. For this group of students, Health Professions and Related Services is the most popular choice.
Figure 14. Academic Majors at Transfer with More than 60 Credits and No Prior Degree,
AY 2012-13

Tennessee Higher Education Commission Articulation and Transfer Report 2013
26
V. Student Migration from Tennessee Colleges of Applied Technology
This section examines institutional migration patterns and demographic and
academic characteristics of students migrating from Tennessee Colleges of Applied Technology (TCATs). Given the recent emphasis on improving articulation between TCATs and community colleges, student migration among TCATs and Tennessee public colleges and universities warrants special examination.
Students analyzed in this section do not meet the traditional definition of transfer students, as specified in the Background section. First, most of them return
to their community college or university and thus are not first-time-at-institution students. Such students are classified as returning students (individuals who were enrolled at the institution in the preceding semester) or readmitted students (individuals returning to that institution after a gap in their attendance). Second, because of program stipulations and definition of “contact hours” at TCATs, many former TCAT enrollees do not transfer credits from a TCAT to a community college or university—unless they do so as a 30-hour block.
To differentiate TCAT students from the general transfer population, this report refers to them as TCAT transfers. A TCAT transfer is a student who was enrolled in a Tennessee public institution in the academic year 2012-13 and who had taken classes at a Tennessee College of Applied Technology in the previous semester of enrollment; for fall public enrollees, enrollment in TCAT classes may have taken place either in summer or in spring. This definition includes returning and readmitted students as well as students who had been simultaneously enrolled in a TCAT and some other institution. Also, this definition does not take into account transferred credits.
Institutional Migration Patterns of TCAT Transfers
Because this section examines only student migration within the public sector, the institutional transfer patterns are limited to one type of “departure institution”—Tennessee Colleges of Applied Technology—and two possible “destinations”—community colleges or public universities.
Table 9 presents the institutional migration patterns of TCAT transfers by
sending TCAT and receiving sector. In the academic year 2012-13, 863 students migrated from TCATs into the state’s public colleges and universities. Tennessee community colleges received 698 migrant students from all 27 Tennessee Technology Colleges of Applied Technology, while public universities received 165 students from 24 TCATs.
Eight TCATs (Chattanooga, Nashville, Murfreesboro, Knoxville, Livingston, Pulaski, Oneida, and Elizabethton) each sent more than 40 students to the public sector for a total of 542 students, which accounted for 62.8 percent of all TCAT transfers. In contrast, six other TCATs (Jacksboro, McMinnville, Whiteville, Crump, McKenzie, and Covington) sent fewer than 10 students each for a total of 5.1 percent of all TCAT transfers. The average number of TCAT transfers for all colleges of applied technology is 32 students, with the per-institution number ranging from 4 to over 125 students. Because of data suppression to ensure student privacy, these numbers are not directly retrievable from Table 9.

Tennessee Higher Education Commission Articulation and Transfer Report 2013
27
Table 9. Migration of TCAT Transfers into Tennessee Public Institutions, AY 2012-13
SENDING INSTITUTION COMMUNITY
COLLEGES
PUBLIC
UNIVERSITIES
Tennessee College of Applied Technology at ATHENS 13 0
Tennessee College of Applied Technology at CHATTANOOGA 124 *
Tennessee College of Applied Technology at COVINGTON * *
Tennessee College of Applied Technology at CROSSVILLE 9 *
Tennessee College of Applied Technology at CRUMP 6 *
Tennessee College of Applied Technology at DICKSON 14 0
Tennessee College of Applied Technology at ELIZABETHTON 31 11
Tennessee College of Applied Technology at HARRIMAN 14 *
Tennessee College of Applied Technology at HARTSVILLE 24 6
Tennessee College of Applied Technology at HOHENWALD 12 *
Tennessee College of Applied Technology at JACKSBORO 9 0
Tennessee College of Applied Technology at JACKSON 28 *
Tennessee College of Applied Technology at KNOXVILLE 61 8
Tennessee College of Applied Technology at LIVINGSTON 51 *
Tennessee College of Applied Technology at MCKENZIE * *
Tennessee College of Applied Technology at MCMINNVILLE 6 *
Tennessee College of Applied Technology at MEMPHIS 20 10
Tennessee College of Applied Technology at MORRISTOWN 23 *
Tennessee College of Applied Technology at MURFREESBORO 43 31
Tennessee College of Applied Technology at NASHVILLE 53 34
Tennessee College of Applied Technology at NEWBERN 23 *
Tennessee College of Applied Technology at ONEIDA 41 *
Tennessee College of Applied Technology at PARIS 7 *
Tennessee College of Applied Technology at PULASKI 33 12
Tennessee College of Applied Technology at RIPLEY 19 *
Tennessee College of Applied Technology at SHELBYVILLE 20 10
Tennessee College of Applied Technology at WHITEVILLE 8 *
TOTAL (UNSUPPRESSED) 698 165
* To comply with FERPA requirements, cells containing 5 observations or fewer are suppressed. Data suppression makes it impossible to directly retrieve data described in the narrative from this table.

Tennessee Higher Education Commission Articulation and Transfer Report 2013
28
Table 10 shows the receiving public institutions that accepted TCAT transfers during the academic year 2012-13. Among universities, Middle Tennessee State University received the most TCAT transfers: 54 students. East Tennessee State University and University of Tennessee at Martin followed with 20 TCAT transfers each. At the other end, University of Tennessee at Chattanooga accepted fewer than 6 TCAT transfers. The average number of TCAT transfers for universities is 18 students.
Table 10. Migration of TCAT Transfers by Receiving Institution, AY 2012-13
RECEIVING INSTITUTION TCAT TRANSFERS
Austin Peay State University 10 students
East Tennessee State University 20 students
Middle Tennessee State University 54 students
Tennessee State University 15 students
Tennessee Technological University 16 students
University of Memphis 14 students
University of Tennessee, Chattanooga *
University of Tennessee, Knoxville 11 students
University of Tennessee, Martin 20 students
Chattanooga State Community College 132 students
Cleveland State Community College 11 students
Columbia State Community College 61 students
Dyersburg State Community College 37 students
Jackson State Community College 53 students
Motlow State Community College 49 students
Nashville State Community College 60 students
Northeast State Community College 38 students
Pellissippi State Community College 48 students
Roane State Community College 81 students
Southwest Tennessee Community College 26 students
Volunteer State Community College 71 students
Walters State Community College 31 students
* To comply with FERPA requirements, cells containing 5 observations or fewer are suppressed.

Tennessee Higher Education Commission Articulation and Transfer Report 2013
29
For community colleges, Chattanooga State and Roane State community colleges received the highest number of TCAT transfers, with 132 students and 81 students, respectively. Most TCAT transfers into Chattanooga State Community College (122 students) moved from the TCAT at Chattanooga located on the Chattanooga State’s campus. A large portion of TCAT transfers (39 students) into Roane State moved from the TCAT at Oneida. On the other end of the spectrum, Southwest Tennessee and Cleveland State received 26 and 11 TCAT transfers, respectively. The average for community colleges is 53 TCAT transfers per receiving institution.
Demographic and Academic Characteristics of TCAT Transfers
Because the comparison of TCAT transfers with the native students at
Tennessee public institutions is not very informative, this section compares TCAT transfers to the group of traditional public transfer students, that is, students who satisfy the definition of a transfer student as specified in the Background section.
Figure 15 shows that TCAT transfers are quite similar to traditional transfer
students. The greatest difference exists in the gender composition of these groups: there is a larger percentage of female students among TCAT transfers. The racial/ethnic composition of TCAT transfers resembles that of traditional transfer students, with Caucasian students being the predominant group and minorities accounting for slightly over 26 percent of all students coming from Tennessee Colleges of Applied Technology.
Figure 15. Demographic Characteristics of TCAT Transfers and Traditional Public
Transfers, AY 2012-13
Table 11 clearly shows why TCAT transfers do not fall under the traditional
definition of transfer students and, as a rule, are not coded as such by institutions. During the 2012-13 academic year, 477 students (about 55 percent) moving from

Tennessee Higher Education Commission Articulation and Transfer Report 2013
30
TCATs into Tennessee public institutions were either returning students (individuals who were registered at the institution during the preceding term) or readmitted students (individuals who had previously attended the institution and had a gap in their attendance). Sixty nine TCAT transfers were coded as pre-college students (high school students taking college courses in advance of high school graduation). Out of 317 students who enrolled at the institution for the first time, 227 were first-time college students, and only 68 former TCAT students were coded as transfer students by receiving institutions.
Table 11. Student Registration Types of TCAT Transfers, AY 2012-13
REGISTRATION TYPE First-Time at Institution
Student
Pre-College Student
Readmitted Student
Returning Student
TOTAL
First-Time College Student
227 – – – 227
Transfer Student 68 – 2 – 70
Transient Student 1 – 2 – 3
All Others 21 69 213 260 563
TOTAL 317 69 217 260 863
It is remarkable that 48.7 percent of TCAT transfers have some prior college
experience2. In other words, almost half of students migrating from Tennessee Colleges of Applied Technology had attended a Tennessee public institution before enrolling in a TCAT. Specifically, 344 such students (39.9%) had been enrolled in a Tennessee community college and 76 students (8.8%) had attended a Tennessee public university prior to enrolling in a TCAT.
Regarding academic majors, TCAT transfers predominantly chose the following
fields at their TCAT: Health Professions and Related Services (399 students); Trades and Industrial (211 students); and Business, Management and Administrative Services (116 students) (Table 12). In the new institution, 72.2 percent of all TCAT transfers opted for five major academic fields: Health Professions and Related Services (250 students); Liberal Arts and Sciences (230 students); Business, Management and Administrative Services (60 students); Engineering (43 students) and Personal Improvement and Leisure Programs (40 students)3. Out of 863 TCAT transfers, 649 students (75.2 percent) changed their broad major field after transferring into a public institution from a Tennessee College of Applied Technology.
2 Estimated from the available data but not presented in tables.
3 Estimated from the available data but not presented in tables.

Tennessee Higher Education Commission Articulation and Transfer Report 2013
31
Table 12. TCAT Majors and Post-transfer Major Change, TCAT Transfers, AY 2012-13
TCAT MAJOR TCAT TRANSFERS
CHANGED MAJOR AFTER TRANSFER
Students Percent of
Total Students
Percent of Total
Health Professions and Related Services
399 46.2% 204 23.6%
Trades and Industrial 211 24.4% 209 24.2%
Business, Management and Administrative Services
116 13.4% 101 11.7%
Unknown 89 10.3% 89 10.3%
Personal Improvement and Leisure Programs
31 3.6% 31 3.6%
Home Economics 14 1.6% 12 1.4%
Foreign Languages and Literatures 2 0.2% 2 0.2%
Visual and Performing Arts 1 0.1% 1 0.1%
Did not change major
214 24.8%
VI. Transfer History of 2011-12 Degree Completers at Public Universities
In addition to analyzing student transfer activity in the academic year 2012-13,
this report also examines past transfer history of 2011-12 bachelor’s degree completers in Tennessee public universities. The choice of AY 2011-12 for analysis is determined by data availability; the graduation data for spring 2013 will be available after the legislative submission date for this report.
The main statistics of interest include (a) the percent of bachelors graduates
who ever changed institutions (from outside or within the Tennessee public sector)
and (b) the percent of bachelors graduates who ever attended a community college. The analysis found that in the academic year 2011-12:
19,813 students received 19,956 bachelor’s degree awards at a Tennessee public university;
There were 11,144 instances when 8,863 baccalaureate graduates (44.7 percent of the total number of AY 2011-12 graduates) had changed institutions in their prior academic career;
There were 10,021 instances when 6,608 baccalaureate graduates (33.4 percent) had attended any two-year college (including out-of-state and private colleges);
There were 9,180 instances when 5,767 baccalaureate graduates (29.1 percent) had attended a Tennessee community college.

Tennessee Higher Education Commission Articulation and Transfer Report 2013
32
VII. Conclusion
Examination of student transfer activity in the 2012-13 academic year has identified several key implications for articulation and transfer policy implementation.
Although Tennessee’s student population is quite mobile (nearly 45 percent of bachelor’s degree completers transfer at least once in their academic career), the share of transfer students has remained stable over time. Based on past trends, one could expect that in the future, changes in the absolute numbers of transfer students will be consistently proportional to the size of the undergraduate enrollment.
A considerable number of what are termed “out-of-state students” are actually
returning Tennessee residents. Although understanding the exact reasons for their decision to transfer back to their home state remains speculative, Tennessee should continue the current practice of offering lottery opportunities to its returning students and strive to facilitate transfer of academic credit hours for these students.
In what may be a surprise to some, many students transfer from universities to community colleges. During the entire academic year, this transfer direction accounts for more than 29 percent of all transfers among Tennessee public institutions. This trend could mean that some of these students did not find the proper fit at universities and might have been better off starting at community colleges. This finding signifies a number of issues ranging from decreased probability of graduation for such students to possible misallocation of state and institutional resources. At the same time, it offers an opportunity for devising policies that better direct students towards institutions in which they can succeed.
A consistent finding from Articulation and Transfer reports is that many transfer students arrive at their destination institution with a large amount of credits; however, the majority of them do so without earning even an associate’s degree. Prior studies and reports also showed that transfer students take longer to graduate than native students. These findings confirm the uniqueness of transfer students as a group and require targeted responses at the state and institutional levels. Such policies should aim to optimize time and credits to degree both prior to and after transferring.
Tennessee is making great strides in devising innovative policy solutions to implement the mandate of the Complete College Tennessee Act. However, a number of
potential impediments may dampen the effect of new policies. One of the biggest issues of the transfer policy is low degree efficiency; on average, transfer students take longer to graduate and accumulate many extra credits by graduation. In this regard, Tennessee should continue efforts to revise standards for transferring credit hours for programs and degrees that are not included in the current transfer pathways and for transferring credits from out-of-state institutions. Also, high school students should receive better counseling on their college plans, which may require special training of high school counselors. Based on students’ personality type, career plans, academic performance, and aptitude, this training should focus on how to enable students to find an institutional type in which they can thrive personally and academically.
The 2012 THEC study investigated the effects of completing the common
general education core on transfer student success. It provided solid evidence for efficacy of completing general education requirements prior to transferring. Therefore, students should be encouraged to complete general education requirements early.

Tennessee Higher Education Commission Articulation and Transfer Report 2013
33
APPENDIX A. Members of Reverse Transfer Taskforce
Rick Osborn Dean Continuing Studies & Academic Outreach East Tennessee State University
Sharon Peters Director Center for Extended Education Tennessee State University
Theresa Thomas Director of Records Middle Tennessee State University
Jane Asamani Professor Instructional Support Tennessee State University
Evelyn Nettles
Associate Vice President Center for Extended Education Tennessee State University
Sharon X. Huo (Xiaoming)
Professor and Interim Associate Provost, Academic Affairs Tennessee Technological University
Yolanda Mathews Academic Transfer and Articulation, Coordinator The University of Memphis
Fannie Hewlett Provost and Vice President, Academic Affairs Chattanooga State Community College
Karen Payne Associate Professor Biology, Math, and Sciences Chattanooga State Community College
Linda Weeks Associate Professor Developmental Writing Dyersburg State Community College
Diane Berty Vice President Tennessee Independent Colleges and Universities Association
Katie High Interim Vice President for Academic Affairs and Student Success The University of Tennessee
Brenda Rector Registrar/Director of Admissions & Records Roane State Community College
Melanie Paradise Registrar Pellissippi State Community College
Lois Reynolds Assistant Vice President for Academic Affairs
Pellissippi State Community College
Dave Vinson Associate Professor
Mathematics Pellissippi State Community College
Tim Amyx Director Admissions , Records and Registration Volunteer State Community College
Lori Campbell Vice President Academic Affairs Walters State Community College
Emily House Director of Research Policy, Planning, and Research Tennessee Higher Education Commission
Brandy Cartmell Interim Executive Director of Student Engagement; Director of Academic Records The University of Tennessee, Martin

Tennessee Higher Education Commission Articulation and Transfer Report 2013
34
Gloria Gammell Program Manager Academic Affairs and Student Success The University of Tennessee
Ellen Weed Director Lumina Foundation Grant Tennessee Board of Regents
Sally McMillan Professor and Vice Provost for Academic Affairs The University of Tennessee, Knoxville
Nathan James Research Analyst Tennessee General Assembly
Tom Danford Chief Information Officer Tennessee Board of Regents
James D. Perry, II Interim Chief Information Officer The University of Tennessee
Greg Schutz Assistant Vice Chancellor Research and Assessment Tennessee Board of Regents
Warren Nichols Vice Chancellor for Community Colleges Tennessee Board of Regents
David L Wright Associate Executive Director Policy, Planning, and Research Tennessee Higher Education Commission
Ted Lewis Vice President Academic Affairs Pellissippi State Community College
Dennis Hengstler
Director IR The University of Tennessee
Judy Gosch
Director of Curriculum and New Program Development Pellissippi State Community College
Kay Clark Associate Vice Chancellor Academic Affairs Tennessee Board of Regents
Karen Brunner Vice President for Institutional Effectiveness and Research Roane State Community College
Robert Hodum Associate Vice President for Enrollment Management and Student Success Enrollment Management Tennessee Technological University
Susan Galbreath Associate Provost for Academic Administration and Strategic Initiatives Lipscomb University
Lana Hamilton Vice President for Academic Affairs Northeast State Community College
India Lane Assistant Vice President for Academic Affairs and Student Success The University of Tennessee
Mike Krause Director for Academic Affairs Tennessee Higher Education Commission
Betty Dandridge Johnson Associate Executive Director Academic Affairs Tennessee Higher Education Commission
Jessica Gibson
Director Productivity Grant Initiative Tennessee Higher Education Commission
Patrick Meldrim
Vice President Tennessee Independent Colleges and Universities

Tennessee Higher Education Commission Articulation and Transfer Report 2013
35
Russ Deaton Associate Executive Director Fiscal Policy & Administration Tennessee Higher Education Commission
Ken (Kenyatta) Lovett Executive Director Community College Initiatives, Office of Community Colleges Tennessee Board of Regents
John Townsend Executive Director Workforce Development, Office of Community Colleges Tennessee Board of Regents
Foster Chason Vice President for Student Affairs & Director of Athletics Walters State Community College

Tennessee Higher Education Commission Articulation and Transfer Report 2013
36
APPENDIX B. Members of Reverse Transfer Taskforce Subcommittees
Policy Teresa Thomas, TBR 4-year school Mike Krause, THEC Betty Dandridge Johnson, THEC Sharon Peters, TBR 4-year school
Diane Berty, TICUA Brenda Rector, TBR 2-year school
Costs Russ Deaton, THEC Susan Galbreath, TICUA Dave Vinson, TBR 2-year school
IT (Tracking/Banner) Tim Amyx, TBR 2-year school
Brandy Cartmell, UTM Greg Schutz, TBR James Perry, UT Patrick Meldrim, TICUA
Marketing
Lori Campbell, TBR 2-year school Bobby Hodum, TBR 4-year school John Townsend, TBR Jessica Gibson, THEC
Research
Karen Brunner, TBR 2-year school Tom Danford, TBR Emily House, THEC
Dennis Hengstler, UT David L Wright, THEC

Tennessee Higher Education Commission Articulation and Transfer Report 2013
37
APPENDIX C. Taskforce Recommended Policies, Procedures, and Guidelines for Reverse Transfer
Introduction and Purpose On April 4, 2012, Tennessee Governor Bill Haslam signed HB 2827 which amended Tennessee Code Annotated, Title 49 relative to higher education. This amendment added the following language to Section 1 Tennessee Code Annotated, Title 49, Chapter 7, Part 1:
The community colleges of the board of regents system are authorized and encouraged to enter into reverse articulation or reverse transfer agreements with
the universities of the board of regents and the University of Tennessee systems
and with private institutions of higher education that are accredited by the
Southern Association of Colleges and Schools. The universities of the board of
regents and the University of Tennessee systems are authorized and encouraged to enter into reverse articulation or reverse transfer agreements with the
community colleges of the board of regents system.
In July 2012, a taskforce was convened to develop and implement a Reverse Transfer Process across the State of Tennessee. The original taskforce was comprised of members from the Tennessee Higher Education Commission, the Tennessee Board of Regents (TBR), the Tennessee Independent Colleges and Universities Association (TICUA), and the University of Tennessee (UT) systems. The full taskforce defined Reverse Transfer as “a credit review of students who transfer from a community college to a four year institution prior to receipt of the associate’s degree to determine if and when the students complete the associate’s degree requirements and, if so, to award them an associate’s degree.” While the remaining courses required for the associate degree are completed at a Tennessee four-year institution, it is the responsibility of the associate degree-granting institution to verify degree completion and to award the two-year degree. Subsequently, workgroups were created and charged to develop components of the overall process. The workgroups included members from THEC, TICUA, TBR, and UT. The Policies/Procedures workgroup was charged with the development of academic
policy/procedures that will serve as the framework for Reverse Transfer across the State of Tennessee and among the three systems of higher education (Tennessee Board of Regents, University of Tennessee, and the Tennessee Independent Colleges and Universities). Definitions
1. The associate degree requirements are verified and the degree is awarded by the
appropriate two-year institution.
2. Potential Reverse Transfer degree candidates are those students:
who are currently enrolled at a Tennessee four-year institution and were previously enrolled at a Tennessee community college or other Tennessee associate degree-granting institution,

Tennessee Higher Education Commission Articulation and Transfer Report 2013
38
have earned a minimum of 15 college credits towards an associate degree at the associate degree-granting institution, and
have earned a combined minimum of 60 total college-level credits.
Participation
1. All TBR and UT institutions will participate in Reverse Transfer as encouraged
and supported by the State of Tennessee HB 2827. TICUA institutions may
choose to participate.
Governance and Compliance
1. The UT-TBR-TICUA Articulation and Transfer Council will have oversight of the Reverse Transfer process and policies and will review the policy and its impact annually. Oversight responsibilities include, but are not limited to, assessment and evaluation of the process, reporting to the Legislature, and modifications in the process/policies as needed.
2. The Tennessee Higher Education Commission (THEC) will house and maintain
the server and will have primary responsibility for the stored data (demographic
and academic) as well as the data extracted for evaluation and reporting
purposes. THEC will serve as a 3rd party to maintain the confidentiality and
integrity of the data and will have primary responsibility for research and
reporting related to Reverse Transfer.
3. Policies/procedures must be in compliance with the standards of accreditation
set forth by the Southern Association of Colleges and Schools (SACS).
a. Reverse Transfer candidates must complete “…at least 25 percent of the credit hours required for the degree” at the Tennessee institution awarding the associate’s degree. (SACS 3.5.2)
b. Reverse Transfer candidates must adhere to the Catalog requirements established by the degree-granting institution. (SACS 3.5.3)
4. All student information shared between and among institutions to facilitate
Reverse Transfer awards must be in compliance with FERPA guidelines and applicable State of Tennessee statutes.
Policies
1. The Tennessee Higher Education Commission will work to identify and make
any necessary modifications to the funding formula to reflect a spirit of full
collaboration among Tennessee institutions of higher education and reward
participating Tennessee institutions accordingly. Reverse Transfer, an initiative
to promote the educational attainment of adult learners through the full
cooperation and collaboration among Tennessee institutions of higher
education, will result in the generation of student and institutional outcomes
where none previously existed.

Tennessee Higher Education Commission Articulation and Transfer Report 2013
39
2. Each institution will be responsible for the accuracy of Equivalency Tables and
degree audits. Equivalency tables and degree audits must be reviewed and updated annually, or as new programs are approved.
3. The “last hours” policy shall be waived for Reverse Transfer degree candidates at all Tennessee institutions. Requiring students to complete any number of “last hours” at the community college would potentially place undue hardship on the student and would be counter-intuitive to the intent of Reverse Transfer.
4. To adhere to the FERPA guidelines, the four-year institution must have written permission from the student to send an electronic transcript to the associate degree-granting institution for reverse transfer degree audit purposes. (http://www2.ed.gov/policy/gen/guid/fpco/ferpa/index.html) According to LeRoy Rooker, AACRAO Senior Fellow and authority on FERPA, schools must obtain written consent from those students who appear to have the credits for associate degree completion and then send the transcript to the associate degree-granting institution. Additionally, four year institutions may provide a section on the transfer application to allow for the exchange of transcripts for reverse transfer audit purposes or to opt out of the reverse transfer degree audit.
5. If a Reverse Transfer degree candidate attended more than one associate degree-granting institution prior to transferring to a four-year institution, the degree confirming institution will be the institution where the student earned the most credits, provided the student earned a minimum of 15 credits at that institution to meet the SACS residency requirement (SACS 3.5.2) and the student meets the requirements for an associate degree at that institution. In the event the student has earned the same number of credits and meets the residency and degree requirements at two or more institutions, the institution that the student attended most recently will be considered as the degree-granting institution.
6. Students will not be assessed a fee for electronic transcripts exchanged in the
degree audit process of Reverse Transfer.
7. Reverse Transfer degree recipients will not be assessed a graduation fee at the
associate degree-granting institution.
8. Each community college and each participating four-year institution will designate a contact person for Reverse Transfer. The contact person will serve as a point of information to students, faculty, and advisors.
9. Students are afforded due process under the appeals process and procedures outlined in the Catalog at the appropriate institution.

Tennessee Higher Education Commission Articulation and Transfer Report 2013
40
Procedures
1. Initially, Reverse Transfer degree awards will be limited to those degree programs that are currently identified as a Tennessee Transfer Pathway major. All other associate degree majors should be added to the Reverse Transfer process as quickly as feasible.
2. The degree awarding process will be institution-initiated.
a. Reports will be generated each spring and fall semester (for May and December degree awards, respectively) to identify potential degree candidates and sent to the associate degree-granting institution for a degree audit and confirmation of degree. Potential degree candidates will be
identified through a match of descriptive attributes which may include full name, permanent address, birth date, or other identifiers.
b. The associate degree-granting institution will send eligible students a letter of degree confirmation, information regarding participation in graduation ceremonies, and then mail diploma. Students will not need to file degree application for the associate degree.
c. A student may decline the degree.
3. The associate degree-granting institution will notify, in writing, those students whose associate degree audit indicates outstanding academic requirements for the Reverse Transfer associate degree and any “holds” the student may have. a. Students will be notified of their progress toward the Reverse Transfer
degree twice a year (spring and fall) to coincide with the reporting schedule identified in Procedure 2.
b. It is the student’s responsibility to complete any outstanding academic requirements within his/her Catalog time limit in order to be considered for a Reverse Transfer degree.
c. It is the student’s responsibility to clear any and all “holds” to be considered for a Reverse Transfer degree.
4. Website information for Reverse Transfer will be developed with input from UT,
TBR, and TICUA, and will be located on the Tennessee Transfer Pathway website which is maintained by Tennessee Technological University. Each participating associate-degree granting institution will have a Reverse Transfer page that will include a link to the Reverse Transfer website. The institution’s Reverse Transfer contact person’s name, email, and telephone number as well as general information about Reverse Transfer will be included on the institution page.
Guidelines
1. All two-year degrees (A.A., A.S., and A.A.S.) may be considered for and awarded
through Reverse Transfer. While it is likely that the majority of Reverse Transfer degrees awarded will be either A.A. or A.S. degrees, it is possible that a student could complete the A.A.S. degree requirements at a four-year institution.
2. The general education assessment requirement may be waived for Reverse Transfer degree candidates at the discretion of the degree-granting institution.

Tennessee Higher Education Commission Articulation and Transfer Report 2013
41
a) The 2010 Tennessee Higher Education Commission’s Quality Assurance guidelines concerning General Education Assessment (p. 7) indicate: “Institutions may exclude students from testing for ‘good cause.’ Good cause exemptions must be supported by documentation from the institution’s chief academic officer. Exceptions should not be approved for simple inconvenience. This material should be available for review by Commission staff if needed.” (http://www.tennessee.gov/thec/Divisions/AcademicAffairs/performance_funding/PF%202010-15%20Guidebook%20Mar%2017%202011.pdf)
b) Reverse Transfer degree recipients will then complete the general education assessment as graduating seniors from a Tennessee baccalaureate degree program.
c) Therefore, community colleges will not be penalized under THEC Performance Funding Quality Assurance guidelines for waiving the general education assessment requirement for Reverse Transfer degree recipients (See Policy 1 in this document).
3. Upper division courses completed at a four-year institution may be considered
for lower division course substitution on a case-by-case basis and in accordance with current policy at the associate degree-granting institution.
4. Reverse Transfer degree recipients may participate in the graduation ceremonies at the degree-granting institution. Students who choose to participate in the ceremony will be responsible for cap and gown rental.
Approved by the Full Reverse Transfer Taskforce: 04/26/2013 Submitted by: Dr. Gloria R. Gammell University of Tennessee 05/03/2013 Revised and Approved by the Articulation and Transfer Council: 05/29/2013

Tennessee Higher Education Commission Articulation and Transfer Report 2013
42
APPENDIX D. Transfers by Sector of Origin and as a Percent of Undergraduate Enrollment, Public Institutions, AY 2012-13
Tennessee
Public
Tennessee
Independent
Out-of-
State
Austin Peay State University 428 87 1,029 1,544 7.1% 21,607
East Tennessee State University 1,005 125 566 1,696 6.3% 27,088
Middle Tennessee State University 1,798 266 1,017 3,081 6.1% 50,296
Tennessee State University 660 99 330 1,089 7.1% 15,266
Tennessee Technological University 799 70 173 1,042 4.8% 21,609
University of Memphis 1,398 204 928 2,530 6.5% 38,881
TBR System 6,088 851 4,043 10,982 6.3% 174,747
University of Tennessee, Chattanooga 770 95 369 1,234 5.6% 21,885
University of Tennessee, Knoxville 950 123 500 1,573 3.4% 46,273
University of Tennessee, Martin 362 93 202 657 4.1% 16,047
UT System 2,082 311 1,071 3,464 4.1% 84,205
PUBLIC UNIVERSITY TOTAL 8,170 1,162 5,114 14,446 5.6% 258,952
Chattanooga State 629 127 603 1,359 6.0% 22,641
Cleveland State 111 62 157 330 4.2% 7,940
Columbia State 394 100 343 837 7.0% 11,994
Dyersburg State 273 33 90 396 5.2% 7,548
Jackson State 225 78 128 431 4.2% 10,171
Motlow State 399 64 203 666 6.3% 10,649
Nashville State 857 169 677 1,703 7.0% 24,181
Northeast State 386 71 262 719 4.9% 14,530
Pellissippi State 740 168 501 1,409 5.7% 24,661
Roane State 345 64 162 571 3.9% 14,614
Southwest Tennessee 1,010 202 828 2,040 7.2% 28,225
Volunteer State 554 107 387 1,048 5.6% 18,633
Walters State 192 68 160 420 3.0% 13,972
COMMUNITY COLLEGE TOTAL 6,115 1,313 4,501 11,929 5.7% 209,759
PUBLIC HIGHER EDUCATION TOTAL 14,285 2,475 9,615 26,375 5.6% 468,711
* Transfer students include individuals meeting the definition on p. 1
TRANSFERS BY SECTOR OF ORIGINTotal
Undergad.
Enrollment
Transfer
Student
COUNT *
RECEIVING INSTITUTION
Transfers as
PERCENT of
Undergrad.
Enrollment

Tennessee Higher Education Commission Articulation and Transfer Report 2013
43
APPENDIX E. Transfers by Sector of Origin, TICUA Member Institutions, AY 2012-13
Tennessee
PublicTICUA
Non-
TICUA
Out-of-
stateUnknown
Aquinas College 97 10 28 36 171
Baptist College of Health Sciences 182 12 148 44 386
Belmont University 143 40 * 357 134 674
Bethel University 155 13 10 83 189 450
Bryan College 187 17 6 101 75 386
Carson-Newman College 71 * * 73 19 163
Christian Brothers University 72 11 * 53 * 136
Cumberland University 169 31 * 96 10 306
Fisk University 6 * 23 6 35
Freed-Hardeman University 24 * 47 * 71
Johnson University 40 7 * 66 15 128
King College 417 24 13 331 56 841
Lane College 30 * 43 81 154
Le Moyne-Owen College 94 35 69 19 217
Lee University 90 9 * 177 39 315
Lincoln Memorial University 276 12 6 105 11 410
Lipscomb University 62 12 102 42 218
Martin Methodist College 83 * 29 44 156
Maryville College 41 11 * 26 * 78
Memphis College of Art 17 14 * 20 * 51
Milligan College 79 11 32 * 122
Rhodes College * * 13 13
Sewanee-The University of the South * * 22 * 22
Southern Adventist University 28 * 200 8 236
Tennessee Wesleyan College 155 24 38 12 229
Trevecca Nazarene University 23 10 * 34 67
Tusculum College 21 * 39 6 66
Union University 266 43 * 138 10 457
Vanderbilt University *** 216 216
Watkins College of Art, Design & Film 14 7 * 16 9 46
Welch College * * 19 * 19
TOTAL (SUPPRESSED) * 2,852 372 53 2,528 1,100 6,839
TOTAL (UNSUPPRESSED) 6,905
* To comply with FERPA requirements, cells containing 5 observations or fewer are suppressed.
TOTAL (SUPPRESSED) does not include the values of the suppressed cells.
** Includes only values of the unsuppressed cells.
*** Vanderbilt University does not report sending institution of transfer students.
TRANSFERS BY SECTOR OF ORIGIN *
RECEIVING INSTITUTION
Transfer
Student
COUNT **

Tennessee Higher Education Commission Articulation and Transfer Report 2013
44
APPENDIX F. Transfer Students by Sending Institution and Receiving University, Public Institutions, AY 2012-13
APSU ETSU MTSU TSU TTU UM UTC UTK UTM
Austin Peay State University 157 12 43 28 11 21 14 8 20
East Tennessee State University 145 17 * 31 * 15 6 22 54 *
Middle Tennessee State University 370 28 19 * 82 33 83 48 44 33
Tennessee State University 124 22 7 50 * 34 * 11
Tennessee Technological University 148 16 14 79 * * 15 15 9
University of Memphis 129 18 * 44 13 * * 7 23 24
University of Tennessee, Chattanooga 385 22 54 125 17 37 55 52 23
University of Tennessee, Knoxville 332 24 13 98 14 12 54 49 60 8
University of Tennessee, Martin 128 20 * 35 * * 63 * 10
Chattanooga State Community College 517 * 64 36 11 44 8 337 17 *
Cleveland State Community College 139 * 20 19 * 12 * 68 20 *
Columbia State Community College 404 21 8 234 23 27 7 34 20 30
Dyersburg State Community College 213 * 13 * * 106 * 94
Jackson State Community College 325 20 3 41 * * 164 7 8 82
Motlow State Community College 502 13 7 322 23 115 * 14 8 *
Nashville State Community College 703 90 6 238 251 71 13 18 16 *
Northeast State Community College 403 364 13 * 12 * * 14 *
Pellissippi State Community College 714 11 113 56 * 90 11 28 405 *
Roane State Community College 395 7 58 34 192 * 10 94 *
Southwest Tennessee Community College 868 13 8 53 25 * 749 7 6 7
Volunteer State Community College 593 69 6 215 150 97 * 25 31 *
Walters State Community College 356 8 222 18 13 * * 95
TOTAL (SUPPRESSED) ** 8,050 419 998 1,797 637 781 1,374 755 948 341
TOTAL (UNSUPPRESSED) 8,170 428 1,005 1,798 660 799 1,398 770 950 362
* To comply with FERPA requirements, cells containing 5 observations or fewer are suppressed.
** TOTAL SENT and TOTAL (SUPPRESSED) do not include the values of the suppressed cells.
SENDING INSTITUTIONTOTAL
SENT **
RECEIVING INSTITUTION *

Tennessee Higher Education Commission Articulation and Transfer Report 2013
45
APPENDIX G. Transfer Students by Sending Institution and Receiving Community College, Public Institutions, AY 2012-13
CHSCC CLSCC COSCC DSCC JSCC MSCC NASCC NESCC PSCC RSCC STCC VSCC WSCC
Austin Peay State University 204 14 * 11 10 * * 91 * 7 16 55 *
East Tennessee State University 503 40 7 8 * * * 295 79 24 * * 50
Middle Tennessee State University 758 37 * 84 18 23 177 153 8 39 12 83 118 6
Tennessee State University 291 7 * 11 6 10 11 133 * 74 39 *
Tennessee Technological University 357 25 7 21 * * 42 103 * 30 37 7 74 11
University of Memphis 670 6 11 33 17 * 9 * 6 * 588 *
University of Tennessee, Chattanooga 527 32 10 24 * 8 10 34 18 241 45 51 29 25
University of Tennessee, Knoxville 553 271 21 47 * 6 21 35 * 54 14 56 28 *
University of Tennessee, Martin 274 6 20 71 83 6 18 * 60 10 *
Chattanooga State Community College 94 40 8 * 11 7 * 10 9 * 9 *
Cleveland State Community College 121 86 * * * * * 17 12 * * 6
Columbia State Community College 123 15 * * 28 54 9 * 17 *
Dyersburg State Community College 81 * * 40 * 8 * 33 *
Jackson State Community College 74 * * * 49 * 10 * 15 *
Motlow State Community College 148 21 * 40 * * 47 * 6 * * 34
Nashville State Community College 219 9 * 53 * 12 32 8 * * 105
Northeast State Community College 44 * * * * * 14 * * 30
Pellissippi State Community College 235 22 * * * 11 * 157 7 10 28
Roane State Community College 179 13 11 * * 8 12 * 116 * * 19
Southwest Tennessee Community College 111 * 6 64 9 6 17 * 9 * *
Volunteer State Community College 174 7 * 28 * * 20 101 * 9 9
Walters State Community College 136 * 6 * * * 37 77 16 * *
TOTAL (SUPPRESSED) ** 5,876 611 96 378 251 208 372 843 358 731 335 990 528 175
TOTAL (UNSUPPRESSED) 6,115 629 111 394 273 225 399 857 386 740 345 1,010 554 192
* To comply with FERPA requirements, cells containing 5 observations or fewer are suppressed.
** TOTAL SENT and TOTAL (SUPPRESSED) do not include the values of the suppressed cells.
SENDING INSTITUTIONTOTAL
SENT **
RECEIVING INSTITUTION *

Tennessee Higher Education Commission Articulation and Transfer Report 2013
46
APPENDIX H. Transfer Students by Credits and Degrees Brought to Receiving Institutions, AY 2012-13
<= 12 13-24 25-36 37-48 49-60> 60 no
degree
> 60 with
degreeAssociate's
Bachelor's
or higher
Austin Peay State University 149 186 206 163 150 551 79 1,484 73 12
East Tennessee State University 94 123 173 147 203 534 327 1,601 380 17
Middle Tennessee State University 169 251 385 363 359 1040 343 2,910 355 54
Tennessee State University 98 114 95 88 116 380 100 991 111 25
Tennessee Technological University 78 69 104 109 166 302 192 1,020 241 13
University of Memphis 78 179 349 296 357 901 245 2,405 285 38
University of Tennessee, Chattanooga 65 86 147 122 163 328 182 1,093 192 100
University of Tennessee, Knoxville 40 131 276 190 273 399 225 1,534 271 12
University of Tennessee, Martin 65 88 94 80 67 161 78 633 88 4
PUBLIC UNIVERSITY TOTAL 836 1,227 1,829 1,558 1,854 4,596 1,771 13,671 1,996 275
Chattanooga State 388 288 230 165 127 117 44 1,359 16 47
Cleveland State 167 59 45 25 16 15 3 330 4 3
Columbia State 314 254 160 66 26 16 1 837 8 32
Dyersburg State 103 88 66 47 28 49 2 383 2 4
Jackson State 183 95 77 28 19 25 4 431 4 13
Motlow State 208 151 97 61 32 71 17 637 11 20
Nashville State 597 367 270 160 121 119 67 1,701 21 63
Northeast State 277 153 96 68 54 47 24 719 6 28
Pellissippi State 379 360 248 142 103 133 34 1,399 17 44
Roane State 125 105 91 66 34 91 25 537 17 25
Southwest State 1272 509 184 56 13 3 2 2,039 4 54
Volunteer State 320 232 139 100 58 118 29 996 8 49
Walters State 101 80 85 43 36 49 8 402 6 16
COMMUNITY COLLEGE TOTAL 4,434 2,741 1,788 1,027 667 853 260 11,770 124 398
GRAND TOTAL 5,270 3,968 3,617 2,585 2,521 5,449 2,031 25,441 2,120 673
* Table excludes 934 s tudents with miss ing data on credits .
RECEIVING INSTITUTION
CREDIT HOURS AT TRANSFER Total
Transfer
Students *
DEGREE AT TRANSFER

Tennessee Higher Education Commission Articulation and Transfer Report 2013
47
APPENDIX H (Cont'd). Transfer Students by Credits and Degrees Brought to Receiving Institutions, AY 2012-13
<= 12 13-24 25-36 37-48 49-60> 60 no
degree
> 60 with
degreeAssociate's
Bachelor's
or higher
Austin Peay State University 10.0% 12.5% 13.9% 11.0% 10.1% 37.1% 5.3% 1,484 4.9% 0.8%
East Tennessee State University 5.9% 7.7% 10.8% 9.2% 12.7% 33.4% 20.4% 1,601 23.7% 1.1%
Middle Tennessee State University 5.8% 8.6% 13.2% 12.5% 12.3% 35.7% 11.8% 2,910 12.2% 1.9%
Tennessee State University 9.9% 11.5% 9.6% 8.9% 11.7% 38.3% 10.1% 991 11.2% 2.5%
Tennessee Technological University 7.6% 6.8% 10.2% 10.7% 16.3% 29.6% 18.8% 1,020 23.6% 1.3%
University of Memphis 3.2% 7.4% 14.5% 12.3% 14.8% 37.5% 10.2% 2,405 11.9% 1.6%
University of Tennessee, Chattanooga 5.9% 7.9% 13.4% 11.2% 14.9% 30.0% 16.7% 1,093 17.6% 9.1%
University of Tennessee, Knoxville 2.6% 8.5% 18.0% 12.4% 17.8% 26.0% 14.7% 1,534 17.7% 0.8%
University of Tennessee, Martin 10.3% 13.9% 14.8% 12.6% 10.6% 25.4% 12.3% 633 13.9% 0.6%
PUBLIC UNIVERSITY TOTAL 6.1% 9.0% 13.4% 11.4% 13.6% 33.6% 13.0% 13,671 14.6% 2.0%
Chattanooga State 28.6% 21.2% 16.9% 12.1% 9.3% 8.6% 3.2% 1,359 1.2% 3.5%
Cleveland State 50.6% 17.9% 13.6% 7.6% 4.8% 4.5% 0.9% 330 1.2% 0.9%
Columbia State 37.5% 30.3% 19.1% 7.9% 3.1% 1.9% 0.1% 837 1.0% 3.8%
Dyersburg State 26.9% 23.0% 17.2% 12.3% 7.3% 12.8% 0.5% 383 0.5% 1.0%
Jackson State 42.5% 22.0% 17.9% 6.5% 4.4% 5.8% 0.9% 431 0.9% 3.0%
Motlow State 32.7% 23.7% 15.2% 9.6% 5.0% 11.1% 2.7% 637 1.7% 3.1%
Nashville State 35.1% 21.6% 15.9% 9.4% 7.1% 7.0% 3.9% 1,701 1.2% 3.7%
Northeast State 38.5% 21.3% 13.4% 9.5% 7.5% 6.5% 3.3% 719 0.8% 3.9%
Pellissippi State 27.1% 25.7% 17.7% 10.2% 7.4% 9.5% 2.4% 1,399 1.2% 3.1%
Roane State 23.3% 19.6% 16.9% 12.3% 6.3% 16.9% 4.7% 537 3.2% 4.7%
Southwest State 62.4% 25.0% 9.0% 2.7% 0.6% 0.1% 0.1% 2,039 0.2% 2.6%
Volunteer State 32.1% 23.3% 14.0% 10.0% 5.8% 11.8% 2.9% 996 0.8% 4.9%
Walters State 25.1% 19.9% 21.1% 10.7% 9.0% 12.2% 2.0% 402 1.5% 4.0%
COMMUNITY COLLEGE TOTAL 37.7% 23.3% 15.2% 8.7% 5.7% 7.2% 2.2% 11,770 1.1% 3.4%
GRAND TOTAL 20.7% 15.6% 14.2% 10.2% 9.9% 21.4% 8.0% 25,441 8.3% 2.6%
* Table excludes 934 s tudents with miss ing data on credits .
RECEIVING INSTITUTION
CREDIT HOURS AT TRANSFER Total
Transfer
Students *
DEGREE AT TRANSFER

Tennessee Higher Education Commission Articulation and Transfer Report 2013
48
APPENDIX I. Public Transfer Students by Credit Hours Earned at Sending Institutions, AY 2012-13
<12 12-23 24-35 36-47 48-59 >= 60
Austin Peay State University 58 65 60 43 31 94 351
East Tennessee State University 100 123 133 71 43 163 633
Middle Tennessee State University 153 201 191 111 109 315 1,080
Tennessee State University 68 81 75 45 27 115 411
Tennessee Technological University 84 105 83 51 52 122 497
University of Memphis 109 168 156 86 68 175 762
University of Tennessee, Chattanooga 108 196 183 104 63 188 842
University of Tennessee, Knoxville 87 151 157 116 81 273 865
University of Tennessee, Martin 55 87 78 43 44 78 385
PUBLIC UNIVERSITY TOTAL 822 1,177 1,116 670 518 1,523 5,826
Chattanooga State 31 53 66 47 52 358 607
Cleveland State 38 27 46 28 40 98 277
Columbia State 48 55 77 44 62 238 524
Dyersburg State 26 46 43 35 28 128 306
Jackson State 32 35 56 40 36 210 409
Motlow State 53 53 81 71 75 319 652
Nashville State 106 118 96 104 105 371 900
Northeast State 25 34 24 33 38 305 459
Pellissippi State 80 78 109 80 81 499 927
Roane State 55 48 48 50 62 306 569
Southwest State 61 120 168 128 102 377 956
Volunteer State 63 74 93 99 94 334 757
Walters State 40 38 54 36 59 268 495
COMMUNITY COLLEGE TOTAL 658 779 961 795 834 3,811 7,838
GRAND TOTAL 1,480 1,956 2,077 1,465 1,352 5,334 13,664
* Table excludes 621 students with missing data on credits.
SENDING INSTITUTIONCREDIT HOURS AT TRANSFER Total Public
Transfers *
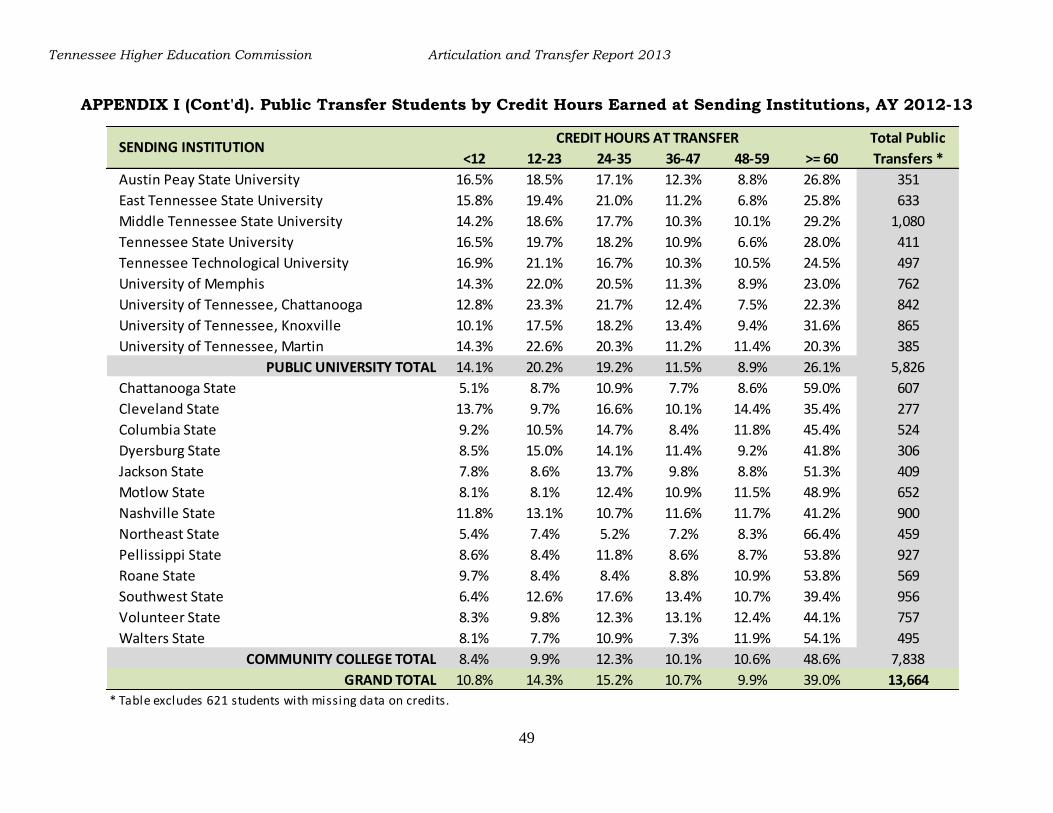
Tennessee Higher Education Commission Articulation and Transfer Report 2013
49
APPENDIX I (Cont'd). Public Transfer Students by Credit Hours Earned at Sending Institutions, AY 2012-13
<12 12-23 24-35 36-47 48-59 >= 60
Austin Peay State University 16.5% 18.5% 17.1% 12.3% 8.8% 26.8% 351
East Tennessee State University 15.8% 19.4% 21.0% 11.2% 6.8% 25.8% 633
Middle Tennessee State University 14.2% 18.6% 17.7% 10.3% 10.1% 29.2% 1,080
Tennessee State University 16.5% 19.7% 18.2% 10.9% 6.6% 28.0% 411
Tennessee Technological University 16.9% 21.1% 16.7% 10.3% 10.5% 24.5% 497
University of Memphis 14.3% 22.0% 20.5% 11.3% 8.9% 23.0% 762
University of Tennessee, Chattanooga 12.8% 23.3% 21.7% 12.4% 7.5% 22.3% 842
University of Tennessee, Knoxville 10.1% 17.5% 18.2% 13.4% 9.4% 31.6% 865
University of Tennessee, Martin 14.3% 22.6% 20.3% 11.2% 11.4% 20.3% 385
PUBLIC UNIVERSITY TOTAL 14.1% 20.2% 19.2% 11.5% 8.9% 26.1% 5,826
Chattanooga State 5.1% 8.7% 10.9% 7.7% 8.6% 59.0% 607
Cleveland State 13.7% 9.7% 16.6% 10.1% 14.4% 35.4% 277
Columbia State 9.2% 10.5% 14.7% 8.4% 11.8% 45.4% 524
Dyersburg State 8.5% 15.0% 14.1% 11.4% 9.2% 41.8% 306
Jackson State 7.8% 8.6% 13.7% 9.8% 8.8% 51.3% 409
Motlow State 8.1% 8.1% 12.4% 10.9% 11.5% 48.9% 652
Nashville State 11.8% 13.1% 10.7% 11.6% 11.7% 41.2% 900
Northeast State 5.4% 7.4% 5.2% 7.2% 8.3% 66.4% 459
Pellissippi State 8.6% 8.4% 11.8% 8.6% 8.7% 53.8% 927
Roane State 9.7% 8.4% 8.4% 8.8% 10.9% 53.8% 569
Southwest State 6.4% 12.6% 17.6% 13.4% 10.7% 39.4% 956
Volunteer State 8.3% 9.8% 12.3% 13.1% 12.4% 44.1% 757
Walters State 8.1% 7.7% 10.9% 7.3% 11.9% 54.1% 495
COMMUNITY COLLEGE TOTAL 8.4% 9.9% 12.3% 10.1% 10.6% 48.6% 7,838
GRAND TOTAL 10.8% 14.3% 15.2% 10.7% 9.9% 39.0% 13,664
* Table excludes 621 students with missing data on credits.
SENDING INSTITUTIONCREDIT HOURS AT TRANSFER Total Public
Transfers *

Agenda Item: II.C. DATE: November 14, 2013 SUBJECT: Office of P-16 Initiatives Status Report ACTION RECOMMENDED: Information BACKGROUND INFORMATION: The Office of P-16 Initiatives administers programs focused on college access and success in Tennessee. Current initiatives include: • GEAR UP TN provides Tennessee students with a clear path to college. Funded through a seven-year grant from the U.S. Department of Education, GEAR UP TN works with Collaboratives in 15 Tennessee counties to promote college readiness and success. GEAR UP TN Collaboratives serve a cohort of students starting in the seventh grade continuing through their first year of postsecondary education. The program also provides services to high school seniors each year of the grant. GEAR UP TN is designed to promote student achievement and expand the college-going culture statewide. • The College Access Challenge Grant (CACG) is a federal formula grant program focused on developing partnerships to promote college access and success. CACG creates professional development opportunities for college access professionals and enhances resources found on CollegeforTN.org. The program expands current college access programs via the Tennessee College Mentor Corps. The overall goal of Tennessee’s CACG is two-fold: (1) make college accessible to more Tennesseans and (2) facilitate the transition between high school and community college, and community college and four-year institutions, thereby aiding in college retention and completion. • In October 2011, Lumina Foundation for Education awarded the Tennessee Higher Education Commission a Latino Student Success Grant aimed at increasing the number of Latinos completing higher education in Memphis. The Memphis Latino Student Success Collaborative directs its work using a three-tiered approach: public will building through a community-wide Latino student success report card for Memphis and Shelby County, the development and expansion of college access and success programming including the Abriendo Puertas (Opening Doors) college access and success mentoring program, and the formal development of a community-wide collaborative focused on increasing Latino student success in Memphis. • The Tennessee College Access and Success Network connects college access and success programs with like-minded organizations for the purpose of increasing the number of Tennesseans participating and succeeding in postsecondary opportunities. The Network was established through a Lumina Foundation grant and expanded through Race to the Top funds. Its purpose is to create a college-going culture in communities across the state by expanding and creating new college access and success programs, educating professionals, and facilitating statewide advocacy.
T E N N E S S E E
H I G H E R
E D U C A T I O N
C O M M I S S I O N

DATE: November 14, 2013 SUBJECT: Core to College Status Report ACTION RECOMMENDED: Information
BACKGROUND INFORMATION: Core to College is a multi-state grant initiative designed to promote strong collaboration between higher education and the K-12 sectors in the implementation of the Common Core State Standards and aligned assessments. Core to College is funded by Rockefeller Philanthropy Associates with technical assistance provided by Education First. Through this funding, the Core to College Director has focused on successfully executing two projects: General Education Redesign and P-16 Curriculum Councils. Both of these projects were developed with specific, measurable outcomes and timelines that allow for a clear assessment regarding program progress and delivery. General Education Redesign With the support of the Tennessee Board of Regents and University of Tennessee, the Core to College Director formed faculty redesign teams to assess and align the K-12 Common Core State Standards to credit bearing, entry level courses in English and Math to create a more seamless transition from high school to college for Tennessee students. Each team consists of three primary content specialists and supplemented by a team of external evaluators representing each higher education institution and governing board. To date, both the English and Math primary teams have developed Core-Aligned Course Profiles with appendices for their respective entry-level courses: English 1010: Expository Writing and Math 1530: College Algebra. The materials are currently being reviewed by external evaluators in preparation for a spring pilot. Regional P-16 Curriculum Councils Eight regional Curriculum Councils were formed in partnership with the Tennessee Department of Education Centers of Regional Excellence (CORE) Offices to promote better communication and relationships between K-12 and higher education regarding Common Core implementation. To date, each council has met, identified a common area of need, and developed an action plan towards a measurable outcome for the coming year. Each council meeting was attended by a combination of faculty and administrators from K-12 districts, private and public institutions of higher education, and state governing agencies. Examples of council projects include: development of a regional handbook for student teaching experiences to ensure inclusion of all stakeholders, focused work on reading instruction alignment that spans the spectrum of pre-K to the work force, and conducting a regional skills gap analysis between K-12 preparation and higher education expectations.
Agenda Item: II.D. T E N N E S S E E
H I G H E R
E D U C A T I O N
C O M M I S S I O N

Agenda Item: II.E. DATE: November 14, 2013 SUBJECT: First to the Top Update ACTION RECOMMENDED: Information 2013 Report Card on the Effectiveness of Teacher Training Programs
The 2013 Report Card on the Effectiveness of Teacher Training Programs was released on Friday, November 1. This is the sixth year that the state has made data available to the public regarding the effectiveness of the state’s teacher training program completers. Over the past year, THEC staff members have worked in collaboration with the teacher training programs, the State Board of Education, the State Department of Education, and other key stakeholders to improve and expand the Report Card.
The report provides information on the placement and retention rates of teacher training program completers, Praxis II licensure exam passage rates, and the Tennessee Value-Added Assessment System (TVAAS) teacher effect data. Key findings of the report include information related to the academic preparation of Tennessee’s teachers and how well an institution’s completers perform in the classroom. A new feature of the 2013 Report Card is the inclusion of trend data which allows the tracking of a training program’s completer effectiveness over time. The full report, including individual program reports, is available on the THEC website.
Advanced Analytics The Tennessee Higher Education Commission and SAS Institute are working together to expand the research and insight available to teacher preparation programs using TVAAS data. The goal of the Advanced Analytics work is to provide diagnostic information for each teacher preparation program. THEC and the SAS Institute will provide up to ten individual reports to each teacher training program. The content of the reports and the variables included were developed through collaboration between THEC, SAS, and the teacher preparation programs statewide. Based on these conversations, the Advanced Analytics reports will examine a variety of variables such as program of study, course sequence, and the effect of mentor teachers on a completer’s future success.
T E N N E S S E E
H I G H E R
E D U C A T I O N
C O M M I S S I O N

2
Common Core Professional Development and Resources The Tennessee Higher Education Commission, in partnership with The Ayers Institute for Teacher Learning and Innovation at Lipscomb University, has created a multimedia, professional development program to support higher education institutions in imbedding Common Core State Standards (CCSS) into the pre-service teacher curriculum. The program includes full length videos of authentic, CCSS aligned lessons taught by highly qualified Tennessee K-12 teachers. The video modules are accompanied by additional resources for higher education faculty including a facilitator’s guide and strategies for using the modules in higher education classrooms. Six training sessions were held around the state to introduce these resources to higher education faculty and provide opportunities for institutions to create a strategic plan for incorporating the more rigorous CCSS into their training programs. Additional modules are currently in development and will be accompanied by statewide professional development opportunities for faculty around these new resources.

Agenda Item: II.F. DATE: November 14, 2013 SUBJECT: 2014 Commission Meeting Schedule ACTION RECOMMENDED: Information BACKGROUND INFORMATION:
Thursday, January 30, 2014 Winter Quarterly Meeting and Joint Meeting with the State Board of Education
Thursday, April 24, 2014 Spring Quarterly Meeting Thursday, July 24, 2014 Summer Quarterly Meeting Thursday, November 20, 2014 Fall Quarterly Meeting
The meetings will be held in the Commission’s board room.
T E N N E S S E E
H I G H E R
E D U C A T I O N
C O M M I S S I O N