Meeting Documents Regional Council RC - 17 2017...FOXWOOD REGION OF PEEL CUSHMAN & WAKEFIELD...
65
1 EMPLOYMENT STRATEGY DISCUSSION PAPER PREPARED FOR: REGION OF PEEL APPENDIX V PEEL 2041 GROWTH MANAGEMENT ROPA - REQUEST TO PROCEED WITH CONSULTATION ON DRAFT AMENDMENT 7.2 - 143
Transcript of Meeting Documents Regional Council RC - 17 2017...FOXWOOD REGION OF PEEL CUSHMAN & WAKEFIELD...

1
EMPLOYMENT STRATEGY DISCUSSION PAPER
PREPARED FOR: REGION OF PEEL
APPENDIX V PEEL 2041 GROWTH MANAGEMENT ROPA - REQUEST TO PROCEED WITH CONSULTATION ON DRAFT AMENDMENT
7.2 - 143

FOXWOOD
REGION OF PEEL CUSHMAN & WAKEFIELD
September 19, 2017
Adrian J. Smith, MCIP, RPP Manager of Policy Development Integrated Planning Division Corporate Services Department Region of Peel 10 Peel Centre Drive Brampton ON L6T 4B9 Regarding: Employment Strategy Discussion Paper This Employment Strategy Discussion Paper brings focus to employment issues that are facing the Region (within the context of the broader GTHA), as well as how these issues are manifested at the local municipal level in Caledon, Brampton, and Mississauga. Various strategies are identified that the Region and local municipalities can consider to help achieve the employment growth forecast.
Cushman & Wakefield was pleased to team with The Planning Partnership (Ron Palmer) and MDB Insight (Lauren Millier) in the preparation of this Discussion Paper. We are grateful for the collaboration of Hemson Consulting (Russell Mathew) and IBI Group (Brian Hollingworth) on aspects of the analysis. Further, we appreciate the inputs provided by Value Planning Group (Iain Dobson) and Metro Economics (Tom McCormack) to complement our work.
We look forward to discussing the analysis and strategies with you.
Respectfully submitted,
Cushman & Wakefield Ltd.
Andrew Browning Vice President Valuation & Advisory [email protected] 416 359 2510
APPENDIX V PEEL 2041 GROWTH MANAGEMENT ROPA - REQUEST TO PROCEED WITH CONSULTATION ON DRAFT AMENDMENT
7.2 - 144

EMPLOYMENT STRATEGY DISCUSSION PAPER
REGION OF PEEL CUSHMAN & WAKEFIELD
TABLE OF CONTENTS
1.0 Preamble .......................................................................................................................................... 1 1.1 Project Team Overview ................................................................................................................. 1 1.2 Growth Management Committee Motion and the New Growth Plan ............................................ 1 1.3 Discussion Paper Overview .......................................................................................................... 2 1.4 Employment Category Descriptions ............................................................................................. 3 1.5 The Importance of Employment Areas ......................................................................................... 4 1.6 Examination of Risks and Consequences – “Lenses” of Analysis ................................................ 5
2.0 Office and Industrial Market Overview ............................................................................................. 6 2.1 Introduction ................................................................................................................................... 6 2.2 Office Market Overview ................................................................................................................. 6 2.3 Industrial Market Overview ........................................................................................................... 9 2.4 Linkage to Employment Strategy and Outlook for Growth ......................................................... 11
3.0 Perspectives on Growth Management ........................................................................................... 12 3.1 Overview ..................................................................................................................................... 12 3.2 Proposed Framework of Land Use by Employment Category ................................................... 13 3.3 Summary ..................................................................................................................................... 14
4.0 The Employment Landscape – Challenges and Opportunities ...................................................... 15 4.1 Introduction ................................................................................................................................. 15 4.2 Background ................................................................................................................................. 15 4.3 Examination of Select Key Issues – Local Municipality-Level .................................................... 16 4.4 Examination of Issues – by Employment Type ........................................................................... 17
5.0 Employment Strategies .................................................................................................................. 25 5.1 Introduction ................................................................................................................................. 25 5.2 Major Office Employment (MOE) ................................................................................................ 25 5.3 Employment Land Employment (ELE) ........................................................................................ 26 5.4 Population-Related Employment (PRE) ..................................................................................... 28 5.5 Home-Based Employment (HBE) ............................................................................................... 29 5.6 No Fixed Place of Employment (NFPE) ..................................................................................... 29 5.7 Rural Employment (RE) .............................................................................................................. 30 5.8 Other Considerations .................................................................................................................. 30
APPENDIX V PEEL 2041 GROWTH MANAGEMENT ROPA - REQUEST TO PROCEED WITH CONSULTATION ON DRAFT AMENDMENT
7.2 - 145

EMPLOYMENT STRATEGY DISCUSSION PAPER
REGION OF PEEL CUSHMAN & WAKEFIELD
6.0 Recommendations .......................................................................................................................... 33 6.1 Introduction ................................................................................................................................. 33 6.2 Major Office Employment (MOE) ................................................................................................ 33 6.3 Employment Land Employment (ELE) ........................................................................................ 34 6.4 Population-Related Employment (PRE) ..................................................................................... 35 6.5 Home-Based Employment (HBE) ............................................................................................... 36 6.6 No Fixed Place of Employment (NFPE) ..................................................................................... 36 6.7 Rural Employment (RE) .............................................................................................................. 36 6.8 Broadband Infrastructure ............................................................................................................ 37
Appendix A – Broadband and Employment Growth Implications
APPENDIX V PEEL 2041 GROWTH MANAGEMENT ROPA - REQUEST TO PROCEED WITH CONSULTATION ON DRAFT AMENDMENT
7.2 - 146
EMPLOYMENT STRATEGY DISCUSSION PAPER
REGION OF PEEL CUSHMAN & WAKEFIELD 1
1.0 PREAMBLE
1.1 Project Team Overview Cushman & Wakefield was engaged as the lead proponent to undertake an Employment Strategy Discussion Paper on behalf of the Region of Peel. The scope of work for this project goes beyond employment trends and their impact on future commercial real estate development, and focuses on recommending strategy outcomes to support employment growth to 2041. Accordingly, we have teamed with sub-consultant firms The Planning Partnership (policy planning advisory) and MDB Insight (economic development perspectives) to form a multi-disciplinary project team. The firms collectively have extensive experience across the Region of Peel and the broader Greater Toronto and Hamilton Area (GTHA) in the areas of office and employment land strategies, growth management policy-making, and economic development.
1.2 Growth Management Committee Motion and the New Growth Plan At the Region of Peel’s Growth Management Committee meeting on January 19, 2017, a motion was passed directing staff to:
provide research and a strategy for local municipalities to achieve the employment targets, through the inter-municipal work group and the development industry workgroup;
work with the local municipalities to determine a strategy for transportation/transit to support employment growth that represents local municipal plans and identifies opportunities where the Region can support increased active and public transit, such as through the provision of data, and advocacy for funding, etc.;
report through the inter-municipal work group on the relevant public consultations, including reviewing the achievement of intensification targets through good design in other jurisdictions; and,
meet with staff of the Provincial government regarding the results of the Growth Management Strategy, the challenges of achieving the current Provincially-determined employment targets, the need for complete communities, and the need to consider these challenges when setting the next set of employment targets.
In addition to direction from Region of Peel’s Growth Management Committee, the Province of Ontario, through the new Growth Plan effective July 1, 2017, now also requires that:
Upper- and single-tier municipalities, in consultation with lower-tier municipalities, the Province, and other appropriate stakeholders, will each develop an employment strategy that:
− establishes a minimum density target for all employment areas, measured in jobs per hectare, that reflects the current and anticipated type and scale of employment that characterizes the employment areas and aligns with policy 2.2.5.1;
− identifies opportunities for the intensification of employment areas on sites that support active transportation and are served by existing or planned transit; and,
− will be implemented through a municipal comprehensive review, including official plan policies and designations and zoning by-laws.
APPENDIX V PEEL 2041 GROWTH MANAGEMENT ROPA - REQUEST TO PROCEED WITH CONSULTATION ON DRAFT AMENDMENT
7.2 - 147

EMPLOYMENT STRATEGY DISCUSSION PAPER
REGION OF PEEL CUSHMAN & WAKEFIELD 2
1.3 Discussion Paper Overview
Project Overview and Purpose
The purpose of this Employment Strategy Discussion Paper is to bring focus to employment issues that are facing the Region (within the context of the broader GTHA), as well as how these issues are manifested at the local municipal level in Caledon, Brampton, and Mississauga. The municipalities have shown leadership in calling for action on this issue; significant work has taken place to-date in order to position themselves to attract and retain employment, and to put in place policies that support and manage growth. This work has included Municipal Comprehensive Reviews, office and commercial-retail strategies, economic development initiatives, and other strategic plans. Our intent is to build upon this foundation in providing an Employment Strategy Discussion Paper to help guide future planning.
As a point of emphasis, the purpose of this Discussion Paper is to consider strategies towards achieving the employment growth figures that form the projections to 2041, and provide recommendations and next steps (including timing of action items). We recognize that it is important to have a vision for the future, and to develop a forecast that guides regional planning – and to monitor progress over time. Ultimately, the objective is for Peel to plan for the achievement of its 2041 employment and growth forecasts in a way that effectively contributes to achieving the desired goal of creating healthy, vibrant, and connected communities.
This Employment Strategy Discussion Paper, along with a Transportation Strategies to Support Employment Growth Discussion Paper prepared by IBI Group, and concurrent growth forecasting and planning policy work being undertaken by Hemson Consulting, form part of the Region’s broader Employment Strategy.
The Role and Value of an Employment Strategy
Informed by ongoing planning efforts at the Regional and local municipal levels, the role of this Employment Strategy Discussion Paper is to identify issues and trends across employment types and geographies, and identify approaches to understand, avoid, or mitigate risks. Such strategies assist in the coordination and alignment of government efforts, as meeting growth targets is a multi-departmental effort, including disciplines such as planning (Development Services), transportation and transit (Public Works), economic development, finance (Corporate Finance), and others. Underpinning these growth targets is the goal of maximizing opportunities, and providing livelihoods of residents in an increasingly global, competitive, and evolving economy.
Structure of the Report
This Discussion Paper is structured to provide the reader with a profile of Peel’s employment landscape, as well as highlighting key trends and challenges/risks. This leads to a consideration of issues at the municipal level, as well as by type of employment. Finally, a set of strategies and recommendations is presented to help achieve the forecast employment growth targets for Peel Region.
Following this Preamble (Section 1.0), the reader is provided with a synopsis of recent market performance in the Office and Industrial Market Overview in Section 2.0. Perspectives on Growth Management are discussed in Section 3.0. Section 4.0 explores The Employment Landscape – Challenges and Opportunities, which examines issues both at the municipal level, and by employment type. The Employment Strategies Section 5.0 identifies risks and opportunities, and again is organized by type of employment. Recommendations in Section 6.0 provide a synopsis of the key takeaways from the report. Appendix A, titled Broadband and Employment Growth Implications, discusses issues and opportunities associated with broadband infrastructure and employment growth.
APPENDIX V PEEL 2041 GROWTH MANAGEMENT ROPA - REQUEST TO PROCEED WITH CONSULTATION ON DRAFT AMENDMENT
7.2 - 148

EMPLOYMENT STRATEGY DISCUSSION PAPER
REGION OF PEEL CUSHMAN & WAKEFIELD 3
As a note to the reader, both metric and imperial measures are cited in this report. This is due to the common usage of imperial measures to describe commercial real estate (office and industrial building areas in square footage terms [sf], and rents in dollars per square foot [$psf]), while land areas are often cited in metric (square kilometres [km2]).
1.4 Employment Category Descriptions Planning for employment in the GTHA commonly divides jobs into six categories:
1. Major Office Employment (MOE) – In the Growth Plan, Major Office is described as “Freestanding office buildings of approximately 4,000 square metres of floor space or greater, or with approximately 200 jobs or more.1” In its population projections, Hemson Consulting describes Major Office Employment as “employment occurring in freestanding office buildings of 1,860 m2 (20,000 sf) or more.” In this report, the phrase Major Office generally is used in regard to buildings that accommodate Major Office Employment, as described by Hemson Consulting – which is aligned with the office inventories monitored by the major brokerage firms (including Cushman & Wakefield). Major Office functions typically concentrate in downtown areas or established suburban office parks, but developers may also pursue pioneering sites in complementing other existing commercial/retail properties or planned projects. Increasingly, office uses are being encouraged to locate in “centres and corridors”, where intensification is sought, and where transportation/transit investments can be leveraged.
2. Employment Land Employment (ELE) – The phrase “Employment Land Employment” refers principally to industrial-type jobs, and includes: manufacturing; research and development; warehousing and distribution; and wholesale trade. Typically a land-extensive form of development, these jobs are overwhelmingly located in single storey buildings, with a small office component which may be multi-storey. These functions are generally planned in distinct areas separate from other uses, given the nature of these businesses (which may generate noise, produce odours, are associated with truck traffic, and are often aesthetically unappealing).
3. Population-Related Employment (PRE) – The “Population-Related Employment” category of employment is that which exists in response to a resident population, and is not primarily located in employment areas. Some commercial, institutional, and accessory retail uses – and increasingly, community facilities/population-related functions (such as private educational institutions and places of worship) – may locate on employment lands. The extent of population-related land uses in employment areas varies among municipalities, and contributes to the mix of land uses and amenities within employment areas. Predominantly, however, Population-Related Employment is accommodated across the non-employment lands within a municipality (in residential mixed-use settings, and commercial designations, institutional sites, and various other locations).
4. Home-Based Employment (HBE) – As defined by Statistics Canada, these are “Persons whose job is located in the same building as their place of residence; persons who live and work on the same farm; building superintendents; and teleworkers who spend most of their work week working at home (also known as “work-at-home” jobs).2
5. No Fixed Place of Employment (NFPE) – As defined by Statistics Canada, these are “Persons who do not go from home to the same workplace location at the beginning of each shift. Such persons include building and landscape contractors, travelling salespersons, independent truck drivers, etc. (this category is also referred to as “no fixed place of work”).3
1 Places to Grow – Growth Plan for the Greater Golden Horseshoe, 2017.
2 Place of Work status – National Household Survey. http://www12.statcan.gc.ca/nhs-enm/2011/ref/dict/pop110-eng.cfm
3 Ibid.
APPENDIX V PEEL 2041 GROWTH MANAGEMENT ROPA - REQUEST TO PROCEED WITH CONSULTATION ON DRAFT AMENDMENT
7.2 - 149

EMPLOYMENT STRATEGY DISCUSSION PAPER
REGION OF PEEL CUSHMAN & WAKEFIELD 4
6. Rural Employment (RE) – Rural Employment is a category of employment which is of particular relevance to the Town of Caledon. This type of employment is most predominantly related to natural resources, agriculture, tourism, and recreation, in rural areas outside of settlement areas.
1.5 The Importance of Employment Areas4 Peel’s employment areas are similar in many respects to established industrial/employment areas of most of Canada’s large metropolitan areas. The industrial areas and business parks have been constructed over a period of many decades, with a mixture of heavy industrial and light industrial land uses; warehousing and distribution facilities; small and medium scale office buildings; and supporting commercial/retail establishments. Employment areas in Mississauga, Brampton, and Caledon are home to a significant share of the Greater Toronto Area’s suburban industrial and office supply, and are the headquarters to many local, national, and international firms.
Peel’s municipalities benefits from their location in the west-central portion of the GTHA, featuring excellent accessibility to multiple 400-series highways; the presence of Toronto Pearson International Airport and nearby intermodal facilities; proximity to a large and growing labour pool; and favourable access to U.S. border locations to the west (while avoiding some of the central GTHA traffic congestion).
Toronto Pearson International Airport is a significant employment generator and key infrastructure element. Identified as the second largest concentration of employment in the GTHA (after Downtown Toronto), its location in northeast Mississauga acts to draw employment uses – both industrial and office-type jobs. Proximity to the airport is a key site selection determinant for firms that engage in the import/export of materials and finished goods, as well as office users that require a mobile workforce. As well, development restrictions in the vicinity of the airport protect these lands as employment areas, since many other uses are prohibited. An effort is underway to establish a Pearson International Airport Transit Hub to complement the level of employment that surrounds this area.
In general, industrial and Employment Land Employment activities continue to be critical to the economic health of cities and regions. There are a number of reasons, as follows:
More local dollars and jobs increase economic stability for the entire community, including the overall standard of living. Established industrial/employment areas are an important component of the existing tax base, helping to maintain and improve local infrastructure and investment.
The industrial sector accommodated within Peel’s employment areas continues to be an important source of jobs. These areas supply a huge number of employment opportunities for residents of Peel and beyond. Having jobs in proximity to desirable residential communities creates an advantageous live-work relationship, reducing travel trips and times.
A diversified industrial land base – with alternative locations, land costs and contexts – helps accommodate and expand the local economy, and reduces a community’s vulnerability and dependence on a single industry sector.
The industrial/employment areas are home to many of the activities that support the local population, such as auto repair shops, household repair services, wholesale distribution, and warehousing of consumer products.
These areas provide small, cost-effective flexible space that is critical for startups and incubators for innovation in high technology sectors, as well as artist studios, making these older, industrially zoned areas important to a healthy, dynamic, and vital economy.
4 This section has been modified from the original text included in the City of Mississauga’s Municipal Comprehensive Review of Employment Lands (2015).
APPENDIX V PEEL 2041 GROWTH MANAGEMENT ROPA - REQUEST TO PROCEED WITH CONSULTATION ON DRAFT AMENDMENT
7.2 - 150
EMPLOYMENT STRATEGY DISCUSSION PAPER
REGION OF PEEL CUSHMAN & WAKEFIELD 5
After years of industrial activity, sites may carry a legacy of contamination (on-site and off-site). Under current economic conditions and existing remediation techniques, these parcels are often unsuitable for residential and commercial developments. For such properties, ongoing industrial activity remains the highest and best use.
Provincial policy directives promote the concept of a “complete community”5, where residents can fulfill all or most of their daily requirements within city boundaries. Complete communities provide opportunities to live, work, learn, and plan locally, supported by the potential for improved transit access, greater active transportation, reduced reliance on personal vehicle use, improved health outcomes, and reduced impacts on the environment. Having a full range of opportunities for local employment is fundamental to the “complete community” concept.
1.6 Examination of Risks and Consequences – “Lenses” of Analysis This Employment Strategy Discussion Paper can be viewed through a series of “lenses”. The following are some of the financial, social, and environmental risks, and consequences, of failing to achieve Peel’s projected employment growth target.
Financial
Infrastructure investments not aligned with employment outcomes – costly infrastructure allocations in areas where future market realities do not align with on-the-ground (or in-the-ground) investments, or where land uses do not require such extent of investment.
Insufficient job growth – if local jobs do not materialize, there will be increased pressure on the residential tax base to fund municipal services, as well as a shortfall of anticipated development-related revenues (development charges and building permits) to offset infrastructure spending.
Social
Lower activity rate – an imbalance of population growth without job opportunities in the community (a decline in the activity rate).
Insufficient job growth – fewer opportunities to work close to home result in prolonged commuting times, and absence from family, as well as younger workers leaving the community in search of opportunities elsewhere in the region (and never returning to form a new household).
Environmental
Increased pollution – inadequate transit linkages to employment areas result in increased greenhouse gas emission and resource consumption, as workers travel farther from home to work.
Low density form of growth – lack of focus on intensification potential and low density growth leads to excess consumption of agricultural lands and natural areas.
5 https://www.placestogrow.ca/index.php?option=com_content&task=view&id=359
APPENDIX V PEEL 2041 GROWTH MANAGEMENT ROPA - REQUEST TO PROCEED WITH CONSULTATION ON DRAFT AMENDMENT
7.2 - 151
EMPLOYMENT STRATEGY DISCUSSION PAPER
REGION OF PEEL CUSHMAN & WAKEFIELD 6
2.0 OFFICE AND INDUSTRIAL MARKET OVERVIEW
2.1 Introduction A considerable amount of background work has been undertaken by the local municipalities in the evaluation and implementation of employment forecasts. Among the components of this work has been analysis of the historic and current office and industrial market trends. These are closely tied to the employment dynamics such as the increasing presence of automation, and ongoing diversification away from a manufacturing-based economy to more service-based jobs. The purpose of this section of the report is to provide a current (year-end 2016) profile of conditions in Peel and across the Greater Toronto Area.
2.2 Office Market Overview
Introduction
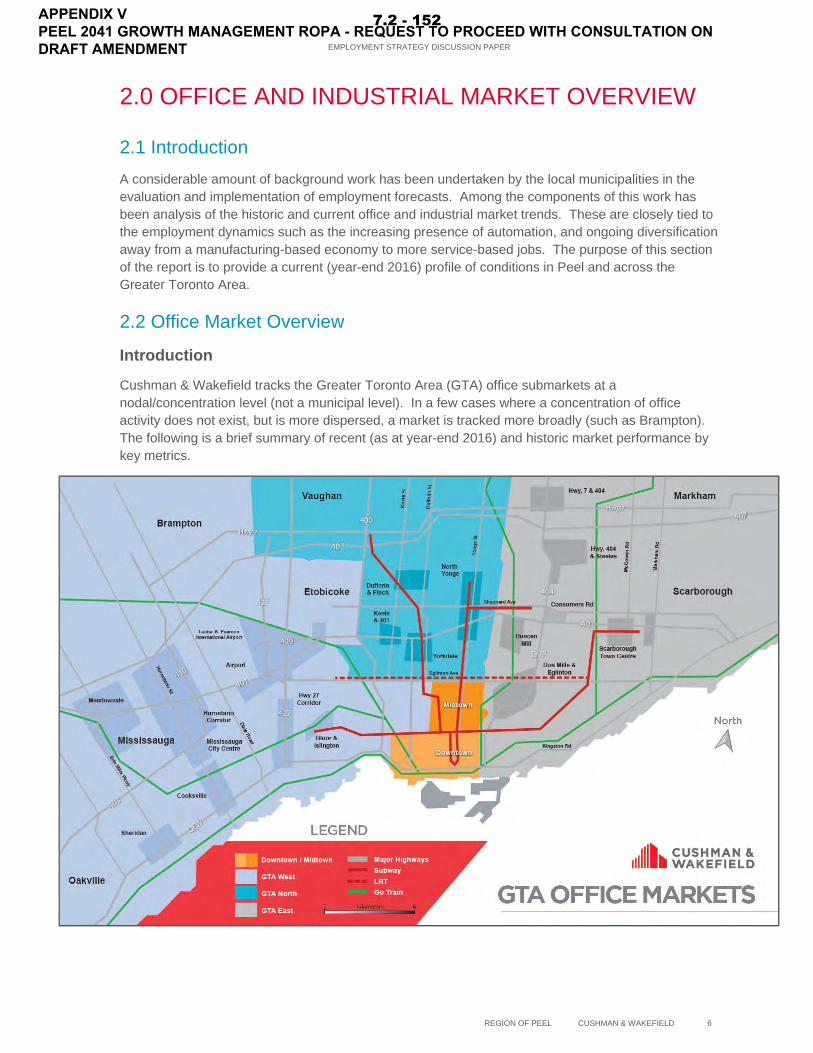
Cushman & Wakefield tracks the Greater Toronto Area (GTA) office submarkets at a nodal/concentration level (not a municipal level). In a few cases where a concentration of office activity does not exist, but is more dispersed, a market is tracked more broadly (such as Brampton). The following is a brief summary of recent (as at year-end 2016) and historic market performance by key metrics.
APPENDIX V PEEL 2041 GROWTH MANAGEMENT ROPA - REQUEST TO PROCEED WITH CONSULTATION ON DRAFT AMENDMENT
7.2 - 152
EMPLOYMENT STRATEGY DISCUSSION PAPER
REGION OF PEEL CUSHMAN & WAKEFIELD 7
Inventory
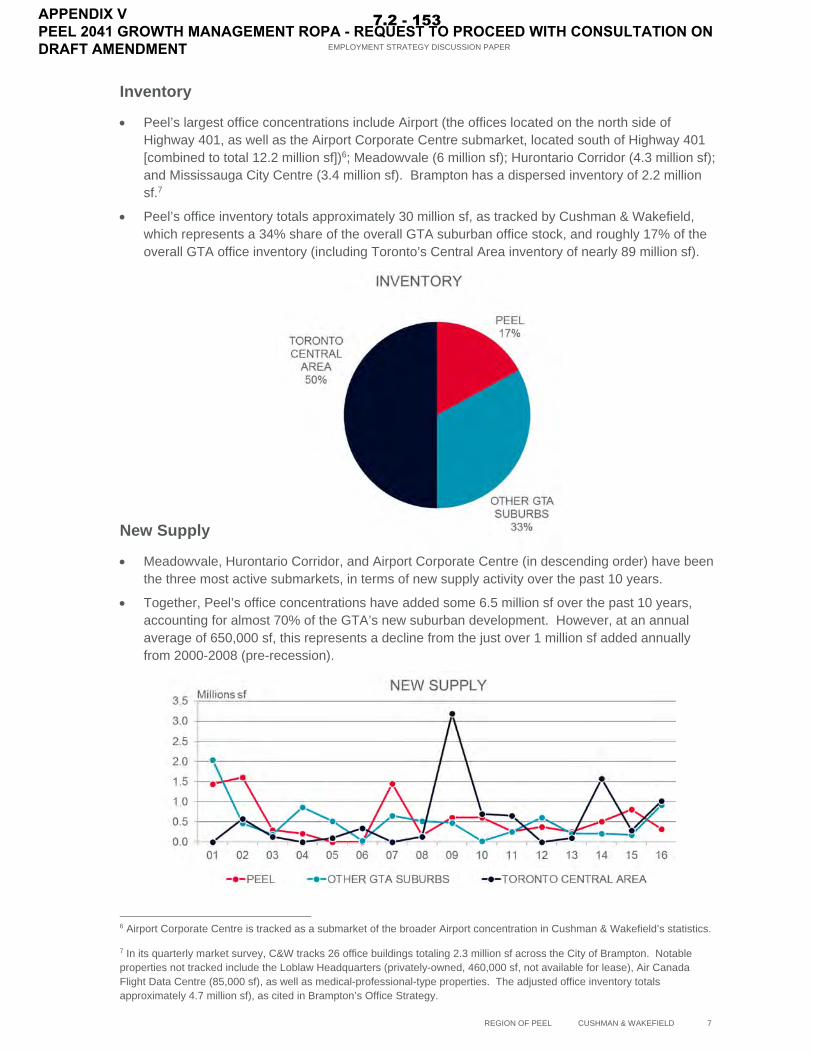
Peel’s largest office concentrations include Airport (the offices located on the north side of Highway 401, as well as the Airport Corporate Centre submarket, located south of Highway 401 [combined to total 12.2 million sf])6; Meadowvale (6 million sf); Hurontario Corridor (4.3 million sf); and Mississauga City Centre (3.4 million sf). Brampton has a dispersed inventory of 2.2 million sf.7
Peel’s office inventory totals approximately 30 million sf, as tracked by Cushman & Wakefield, which represents a 34% share of the overall GTA suburban office stock, and roughly 17% of the overall GTA office inventory (including Toronto’s Central Area inventory of nearly 89 million sf).
New Supply
Meadowvale, Hurontario Corridor, and Airport Corporate Centre (in descending order) have been the three most active submarkets, in terms of new supply activity over the past 10 years.
Together, Peel’s office concentrations have added some 6.5 million sf over the past 10 years, accounting for almost 70% of the GTA’s new suburban development. However, at an annual average of 650,000 sf, this represents a decline from the just over 1 million sf added annually from 2000-2008 (pre-recession).
6 Airport Corporate Centre is tracked as a submarket of the broader Airport concentration in Cushman & Wakefield’s statistics.
7 In its quarterly market survey, C&W tracks 26 office buildings totaling 2.3 million sf across the City of Brampton. Notable properties not tracked include the Loblaw Headquarters (privately-owned, 460,000 sf, not available for lease), Air Canada Flight Data Centre (85,000 sf), as well as medical-professional-type properties. The adjusted office inventory totals approximately 4.7 million sf), as cited in Brampton’s Office Strategy.
APPENDIX V PEEL 2041 GROWTH MANAGEMENT ROPA - REQUEST TO PROCEED WITH CONSULTATION ON DRAFT AMENDMENT
7.2 - 153

EMPLOYMENT STRATEGY DISCUSSION PAPER
REGION OF PEEL CUSHMAN & WAKEFIELD 8
Vacancy Rates
The overall average vacancy rate across Mississauga’s office concentrations plus Brampton is 14%. This exceeds the overall GTA suburban average of 11.7%, and is well above the GTA’s overall rate of 7.9%. The overall rate is influenced by the low vacancy rate of 4.1% recorded for the Central Area (Downtown and Midtown Toronto), which has not been this low since 2000.
Rental Rates
Rental rates across most of Mississauga’s office concentrations have remained unchanged over the past several years (in the range of $16-$19 psf net), despite rising vacancy. Cushman & Wakefield does not report rental rates for Brampton, given the relatively small size of its competitive office leasing inventory.
Across Peel, there is downward pressure on rents, due to persisting high levels of vacancy. In contrast, rents GTA-wide have increased by 20% from the post-recession low recorded in 2009.
Observations
Peel’s office market has seen persisting weakness since the recession of 2008-2009. Strong demand for office space in Downtown Toronto has fueled significant new supply activity in that submarket, at the expense of the suburban submarkets. While much of this new space has been the result of organic growth of downtown tenancies, there are instances where larger suburban tenants have consolidated space into Toronto’s Financial Core and Downtown Fringe markets, along with space absorption by new market entrants. This has pushed vacancy rates upward across Mississauga, while the smaller competitive office leasing inventory in Brampton has been less directly impacted. To date, asking net rental rates have held firm, but it is conceivable that landlords will have to reduce rents in order to fill vacancies in the near term. Persisting lower rents would inhibit new development interest in the suburban submarkets.
APPENDIX V PEEL 2041 GROWTH MANAGEMENT ROPA - REQUEST TO PROCEED WITH CONSULTATION ON DRAFT AMENDMENT
7.2 - 154

EMPLOYMENT STRATEGY DISCUSSION PAPER
REGION OF PEEL CUSHMAN & WAKEFIELD 9
2.3 Industrial Market Overview
Introduction
Cushman & Wakefield tracks the GTA’s industrial submarkets at a municipal level. The following is a brief summary of recent (as at year-end 2016) and historic market performance by key metrics.
Inventory
Mississauga has the largest industrial inventory in the GTA, at almost 172 million sf (22% share of GTA).
Brampton is home to the GTA’s second largest industrial inventory,8 at almost 96 million sf (12% share of GTA, just ahead of Vaughan).
Bolton/Caledon has an industrial inventory of just over 13 million sf (2% share of total GTA).
Together, Peel’s municipalities account for just over one-third of the GTA’s total inventory.
New Supply
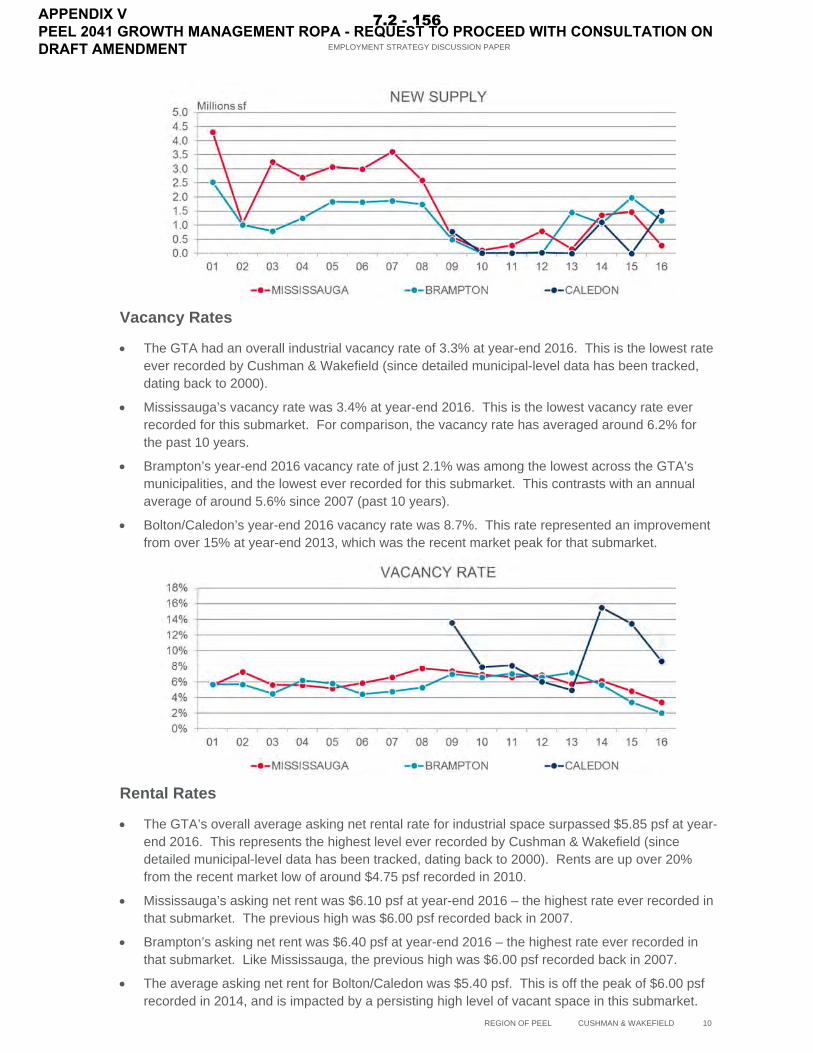
The amount of new industrial supply GTA-wide has increased in each of the past six years (since 2010). For 2016, total new supply was almost 6.3 million sf. However, this is still well below the 8.4 million sf average added annually from 2001-2008 (pre-recession).
Mississauga has added an annual average of 1.1 million sf of new supply over the past 10 years – the most in the GTA.
Brampton ranks second in the GTA, at 975,000 sf annually, followed by Milton/Halton Hills, at 900,000 sf annually.
Bolton/Caledon has added roughly 430,000 sf annually since 2009.9
8 Note: Cushman & Wakefield tracks the City of Toronto by its six former municipalities, which together total 250 million sf of inventory (accounting for a 32% share of the total GTA inventory). The largest submarket is North York, at some 75 million sf.
9 Bolton/Caledon was not tracked as an industrial submarket prior to 2009, due to its previously relatively small inventory.
APPENDIX V PEEL 2041 GROWTH MANAGEMENT ROPA - REQUEST TO PROCEED WITH CONSULTATION ON DRAFT AMENDMENT
7.2 - 155
EMPLOYMENT STRATEGY DISCUSSION PAPER
REGION OF PEEL CUSHMAN & WAKEFIELD 10
Vacancy Rates
The GTA had an overall industrial vacancy rate of 3.3% at year-end 2016. This is the lowest rate ever recorded by Cushman & Wakefield (since detailed municipal-level data has been tracked, dating back to 2000).
Mississauga’s vacancy rate was 3.4% at year-end 2016. This is the lowest vacancy rate ever recorded for this submarket. For comparison, the vacancy rate has averaged around 6.2% for the past 10 years.
Brampton’s year-end 2016 vacancy rate of just 2.1% was among the lowest across the GTA’s municipalities, and the lowest ever recorded for this submarket. This contrasts with an annual average of around 5.6% since 2007 (past 10 years).
Bolton/Caledon’s year-end 2016 vacancy rate was 8.7%. This rate represented an improvement from over 15% at year-end 2013, which was the recent market peak for that submarket.
Rental Rates
The GTA’s overall average asking net rental rate for industrial space surpassed $5.85 psf at year-end 2016. This represents the highest level ever recorded by Cushman & Wakefield (since detailed municipal-level data has been tracked, dating back to 2000). Rents are up over 20% from the recent market low of around $4.75 psf recorded in 2010.
Mississauga’s asking net rent was $6.10 psf at year-end 2016 – the highest rate ever recorded in that submarket. The previous high was $6.00 psf recorded back in 2007.
Brampton’s asking net rent was $6.40 psf at year-end 2016 – the highest rate ever recorded in that submarket. Like Mississauga, the previous high was $6.00 psf recorded back in 2007.
The average asking net rent for Bolton/Caledon was $5.40 psf. This is off the peak of $6.00 psf recorded in 2014, and is impacted by a persisting high level of vacant space in this submarket.
APPENDIX V PEEL 2041 GROWTH MANAGEMENT ROPA - REQUEST TO PROCEED WITH CONSULTATION ON DRAFT AMENDMENT
7.2 - 156

EMPLOYMENT STRATEGY DISCUSSION PAPER
REGION OF PEEL CUSHMAN & WAKEFIELD 11
Observations
The conservative levels of new supply being brought to market across the GTA amid rising demand from occupiers has contributed to record-low vacancy rates, and increases in rental rates to historic highs. Conditions in the GTA’s industrial market are considered favourable for landlords and developers, and the pace of new development is anticipated to accelerate. Peel’s municipalities have the site selection characteristics to continue to prosper, attracting continued employment growth.
2.4 Linkage to Employment Strategy and Outlook for Growth While Peel’s office market accounts for a roughly one-third share of the total suburban office inventory across the GTA, it has accounted for close to 70% of the new suburban office supply the past ten years. However, the emergence (current and planned) of new office nodes such as Vaughan Metropolitan Centre, Downtown Markham, and Midtown Oakville, will place increased competitive pressure on office attraction. Major Office employment growth projections will not be achieved without planning efforts to support intensification of existing employment areas, and new and improved transportation/transit infrastructure to provide labour accessibility, among other considerations.
Given historic and current performance, the outlook for continued employment growth for industrial-type space appears robust. Mississauga and Brampton are two of the GTA’s largest industrial markets, by inventory size; Caledon has emerged over the past decade and is certainly now “on the radar” for prospective tenants. Peel’s industrial areas have the key site selection attributes that occupiers desire. Vacancy rates are at or near historic lows, and rental rates are positioned to grow – indicating favourable conditions for landlords and developers (although this inflates occupancy costs for industrial users). These market metrics indicate very strong underlying fundamentals for industrial-type employment growth in the Region.
APPENDIX V PEEL 2041 GROWTH MANAGEMENT ROPA - REQUEST TO PROCEED WITH CONSULTATION ON DRAFT AMENDMENT
7.2 - 157

EMPLOYMENT STRATEGY DISCUSSION PAPER
REGION OF PEEL CUSHMAN & WAKEFIELD 12
3.0 PERSPECTIVES ON GROWTH MANAGEMENT
3.1 Overview The Province of Ontario, through Places to Grow, establishes population and employment growth forecasts for single and upper-tier municipalities, including Peel. These forecasts guide decision-making on matters ranging from the allocation of land; to the development of infrastructure; to the planning of social services; through to how finance public investments via mechanisms such as development charge by-laws.
Within this framework, employment growth figures provided by the Province are allocated among Peel’s local municipalities, and are to be utilized for future planning. It is necessary to establish context-specific targets for each employment category – Major Office Employment, Employment Land Employment, Population-Related Employment, Home-Based Employment, No Fixed Place of Employment, and Rural Employment – as these employment categories have different characteristics and needs ranging from employment densities (floor space per worker), different land use patterns (site selection preferences), and different infrastructure requirements (roads, water, wastewater, transit, etc.). It is necessary to understand the nuances among the employment types in order to plan for the accommodation, sustainability, and growth of jobs in Peel Region.
It is important to understand and identify how each of the employment categories will be accommodated in several ways, by addressing a series of inter-related questions:
What is the total amount of employment, and amount and pace of growth, that needs to be accommodated? What is the desired mix of employment within a municipality?
− Distribution of employment by type of jobs.
What is the geographic distribution of each category? Where should the jobs be located?
− Which type of employment are land-intensive (ELE), versus more easily accommodated across an urban area (MOE and PRE)?
− Are they to be situated in mixed-use centres and corridors, within retail-commercial nodes, within employment areas, or elsewhere?
Which employment categories are inclined to greenfield sites, versus intensification areas?
What are the context-specific metrics that accompany the preferred locations for each employment category? How much total land is required?
− Employment density – persons per unit of floor area (dictates the required building area).
− Employment density – building site coverage/floor space index (which, along with persons per unit of floor area, dictates the required land area).
− Built form/urban character associated with preferred building typology.
− Parking type associated with the built form/urban character (surface, structured, or underground parking), along with parking density (number of spaces provided).
By exploring and addressing the lines of enquiry above, effective growth management is linked with implementation strategies and economic development objectives to attract and retain the different categories of employment. The risks to accommodating, sustaining, and growing employment lie in the misallocation of resources – either allocating too few, too many, or locating them incorrectly – which could contribute to the employment growth forecast not being achieved. For instance, consider the following scenarios:
APPENDIX V PEEL 2041 GROWTH MANAGEMENT ROPA - REQUEST TO PROCEED WITH CONSULTATION ON DRAFT AMENDMENT
7.2 - 158

EMPLOYMENT STRATEGY DISCUSSION PAPER
REGION OF PEEL CUSHMAN & WAKEFIELD 13
An over-designation of lands for one employment use could have the unintended consequence of inhibiting the prospects for attracting other uses, due to a scarcity of lands (or inadequate provision of suitable locations for growth).
The siting of employment lands far removed from dense residential areas means that travel times are extended, commuter congestion is more likely, the provision of public transportation to link residents to employment opportunities is more costly, and residents are challenged in deciding how they want to (or whether they are able to) commute to work.
As established employment areas intensify (such as established office nodes), a failure to link these areas to enhanced transit services and infrastructure, and public realm improvements, could lead to them becoming less desirable over time, from a site selection perspective.
3.2 Proposed Framework of Land Use by Employment Category In considering how the employment categories relate to land use planning and growth management, the following observations are noted. These drivers should be considered in developing a future framework for land use to support employment growth.
1. Major Office Employment and smaller-scale office uses have a relatively low land requirement – compared to other employment uses – and can generally be accommodated in the same locations as mixed-use Population-Related Employment and many Employment Land Employment uses. In the future, it is anticipated that suburban offices that are situated in a mixed-use setting offering an urban environment, nearby amenities, are highly accessible (including private automobiles and via public transit), and offer superior levels of broadband service will be the most successful in attracting tenants. Office uses will increasingly be found in intensification areas, and well connected to transit infrastructure – as opposed to the greenfield, automobile-oriented pattern of development that has characterized office growth in Peel over the past several decades.
2. Employment Land Employment is suited to greenfield business parks (home to more prestige uses, including light industrial) and industrial areas (which are more land-intensive, and accommodate heavier manufacturing uses), as well as a component of mature business park areas, which feature a mix of employment uses, including offices. ELE will continue to be accommodated on greenfield sites, as warehousing and distribution facilities require large tracts of land. These uses are associated with low employment densities, which is a challenge in creating dense, live-work balanced communities. The Growth Plan (2017) now allows for designated employment lands to be excluded from the calculation of designated greenfield area densities. The potential introduction of Regional policy to designate employment areas – including the identification of strategic areas near major good movement facilities and corridors such as prime employment areas – could be beneficial in preserving these high-value sites for future employment opportunities, and for providing a focus for future Regional infrastructure investments. As with office locations, those areas that are planned to accommodate Employment Land Employment which are highly accessible (including private automobiles and via public transit) and offer superior levels of broadband service will be the most successful in attracting tenants.
3. Certain components of Population-Related Employment – including major retail uses, and major institutional uses – require more attention in planning for land uses. Traditionally, new PRE uses are accounted for in planning for greenfield residential areas, as well as part of intensification/redevelopment within established mixed-use areas – particularly within key centres and corridors. However, increased diligence is required in planning for major institutional uses in particular, to attract these uses, which can then generate spin-off employment. While major new retail development will not occur at the pace that has been seen in the past – due to some retailers transitioning to smaller store formats, and increased e-commerce – planning for some extent of large retail sites will remain important.
APPENDIX V PEEL 2041 GROWTH MANAGEMENT ROPA - REQUEST TO PROCEED WITH CONSULTATION ON DRAFT AMENDMENT
7.2 - 159
EMPLOYMENT STRATEGY DISCUSSION PAPER
REGION OF PEEL CUSHMAN & WAKEFIELD 14
Increasingly, as a result of higher land prices for prime locations, retail uses will be accommodated at vertically mixed-use sites. There are examples in the GTHA (particularly in the City of Toronto, but also in the suburbs) of shopping centre sites being targeted for conversion into mixed-use sites, incorporating medium and high density residential developments on former parking lots, alongside the retail uses that are retained. Property values are dictating a denser form of land use at shopping centres, which are often located on major arterial routes that offer excellent accessibility.
4. Home-Based Employment does not account for a significant component of the land base. It is anticipated to continue to grow (in absolute terms) as the overall population grows, but not change dramatically as a proportion of the overall mix of employment uses.
5. Similar to home-based employment, the No Fixed Place of Employment category does not account for a significant share of the land base. It will continue to grow (in absolute terms) as the overall population grows, but is not anticipated to change dramatically as a proportion of the overall mix of employment uses.
6. Rural Employment is predominantly related to natural resources (renewable and non-renewable); agricultural uses, including agricultural-related and on-farm diversified uses; recreation (passive and active); and tourism, including agri-tourism. It can include employment within rural settlements such as hamlets and villages. It accounts for a small component of Peel’s overall employment mix, and is of particular relevance to the Town of Caledon.
3.3 Summary In summary, the categories of employment have a different geographic distribution within an individual municipality (and among the three local municipalities in Peel). Some are inclined to greenfield sites, while others may seek intensification areas – all with varying infrastructure requirements to accommodate, sustain, and grow employment. As such, varied factors including employment densities, built form characteristics, and associated parking types, must be considered to ensure that the full range of employment types is planned for in strategic land use decision-making.
APPENDIX V PEEL 2041 GROWTH MANAGEMENT ROPA - REQUEST TO PROCEED WITH CONSULTATION ON DRAFT AMENDMENT
7.2 - 160

EMPLOYMENT STRATEGY DISCUSSION PAPER
REGION OF PEEL CUSHMAN & WAKEFIELD 15
4.0 THE EMPLOYMENT LANDSCAPE – CHALLENGES AND OPPORTUNITIES
4.1 Introduction Our approach to examining the current employment landscape across Peel Region, the broader GTHA, and beyond, lies in considering individual topics/issues; considering the risks inherent in these dynamics; and then identifying a strategy or strategies that municipalities can utilize to either mitigate a risk, or enhance the likelihood of attracting the type of employment that is envisioned in their plans to manage growth.
Forces such as automation, deregulation, and globalization have profoundly changed the nature of employment. These factors generate uncertainty in the outlook for employment growth, as well as the location of this growth across the GTHA. The overriding risk is that the employment growth forecasts are not achieved, and/or that planned growth is not aligned with on-the-ground (or in-the-ground) investments that are made to foster this growth – or some combination thereof. There are profound financial, social, and environmental implications for planning for one vision of growth in Peel Region, while so-called market realities instead dictate a different form, scale, and timing.
4.2 Background First, it is important to first take stock of how employment has grown over time in each of the local municipalities. While considerable background information exists in other reporting on this topic, a brief summary is presented below. This historic data and forecast has been prepared by Hemson Consulting.
TOTAL EMPLOYMENT BY MUNICIPALITY* Year Mississauga Brampton Caledon Total 1986 221,220 75,330 7,480 304,030
1991 278,880 88,090 11,200 378,180
1996 307,160 99,460 14,190 420,810
2001 382,230 133,640 18,430 534,310
2006 430,670 155,890 21,410 607,970
2011 454,670 172,120 22,640 649,420
2016 474,180 202,880 27,670 704,730
2021 499,470 234,430 32,280 766,180
2026 519,020 263,390 40,450 822,860
2031 534,000 285,000 51,000 870,000
2036 548,280 304,060 62,640 914,980
2041 565,000 325,000 80,000 970,000
* Note that the forecast employment shown in this table is based on the proposed municipal allocation of population and employment growth at the time of writing. Figures in this table are rounded, and may be revised through consultation with the local municipalities, and are ultimately subject to approval by Peel Regional Council.
APPENDIX V PEEL 2041 GROWTH MANAGEMENT ROPA - REQUEST TO PROCEED WITH CONSULTATION ON DRAFT AMENDMENT
7.2 - 161

EMPLOYMENT STRATEGY DISCUSSION PAPER
REGION OF PEEL CUSHMAN & WAKEFIELD 16
4.3 Examination of Select Key Issues – Local Municipality-Level
Town of Caledon
Achieving Growth Plan density targets is a significant challenge, given the lower density nature of residential development found in Caledon (versus Brampton and Mississauga), and the generally lower density forms of employment that are attracted to the community.
Employment Land Employment will be a principal driver of future growth.
The East-West corridor in northern Peel would greatly improve accessibility, from a goods movement perspective. It would also improve the inter-regional transportation network in general.
Forged from the GTA West Land Use Study initiated in 2014, Caledon’s Whitebelt Visioning is examining all land uses, such as residential, commercial, institutional, agriculture, and environmental protection, in addition to employment lands across the entire "Whitebelt".
− The "Whitebelt" is the area outside the Greenbelt Plan and existing settlement areas in south Caledon (roughly 15% of the land area of the municipality, or 105 km2).
City of Brampton
Has been attracting low density Employment Land Employment.
Office Strategy seeks to mitigate challenges and focus Major Office development.
New major institutional jobs (considered Population-Related Employment) are coming (hospital and university).
− And associated spin-off jobs from these institutional uses.
Population-Related Employment growth is critical to improving activity rate, along with Major Office and other higher employment density-type uses such as biotech, advanced manufacturing, and other uses.
City of Mississauga
Future growth must be through intensification – greenfield lands are essentially exhausted.
Office-type employment is a key component of future growth.
Airport and 400-series highways will continue to bring jobs.
Leveraging employment opportunities along the LRT corridor – particularly Downtown.
A proposed transit hub at Toronto Pearson International Airport with rail and bus connections across the region could improve accessibility and attract employment uses.
APPENDIX V PEEL 2041 GROWTH MANAGEMENT ROPA - REQUEST TO PROCEED WITH CONSULTATION ON DRAFT AMENDMENT
7.2 - 162

EMPLOYMENT STRATEGY DISCUSSION PAPER
REGION OF PEEL CUSHMAN & WAKEFIELD 17
4.4 Examination of Issues – by Employment Type
Introduction
Planning for employment in the GTHA commonly divides jobs into six categories (defined earlier in this report). The following considers important trends related to employment growth in each category, in the context of Peel and the broader GTHA.
Major Office Employment
There has been a profound re-balancing in new office space demand between Downtown Toronto and the GTA Suburbs.
− From 2000-2008, the GTA Suburbs accounted for 91% of all the new office supply added GTA-wide. However, from 2009-2016, this share fell to 47%.
Some suburban nodes have still not seen conditions rebound since the 2008/2009 recession.
− Persisting high vacancy rates (currently in excess of 12% across Peel – compared to around 5% in 2008), and rental rates that do not support the economics of new development.
The remaining office development land supply in Downtown Toronto is getting closer to capacity.
− Competitive pressures versus high density residential development contribute to this.
Office site selection characteristics:
− Access to labour is key.
− Public transit is increasingly important, as an alternative to auto-oriented commuting.
− Desire to live closer to work – especially millennials.
− Desire for mixed-use/”urban” environments – restaurants/bars, retail, recreation, public realm – quality of place.
− Access to superior levels of broadband.
Office densification – declining office space per worker leads to declining requirement for new construction.
Need to connect existing office parks/corporate centres to transit, and support ride-sharing.
− Build transit to support existing built form (corporate centres/office parks), prior to servicing new/unproven areas.
New locations have emerged for offices in the GTHA – such as Vaughan Metropolitan Centre, and Markham Centre – which is making the landscape even more competitive than in the past. Other potential future office hubs include the Lever Brothers site (east of Downtown Toronto, Toronto’s Port Lands, Downsview Park, Buttonville Airport Lands, and others.
Desolate areas will not attract jobs in the future, and could result in a decline in the tax base, as undesirable properties see falling rental rates compared to better located alternatives.
This historic data and forecast has been prepared by Hemson Consulting.
APPENDIX V PEEL 2041 GROWTH MANAGEMENT ROPA - REQUEST TO PROCEED WITH CONSULTATION ON DRAFT AMENDMENT
7.2 - 163
EMPLOYMENT STRATEGY DISCUSSION PAPER
REGION OF PEEL CUSHMAN & WAKEFIELD 18
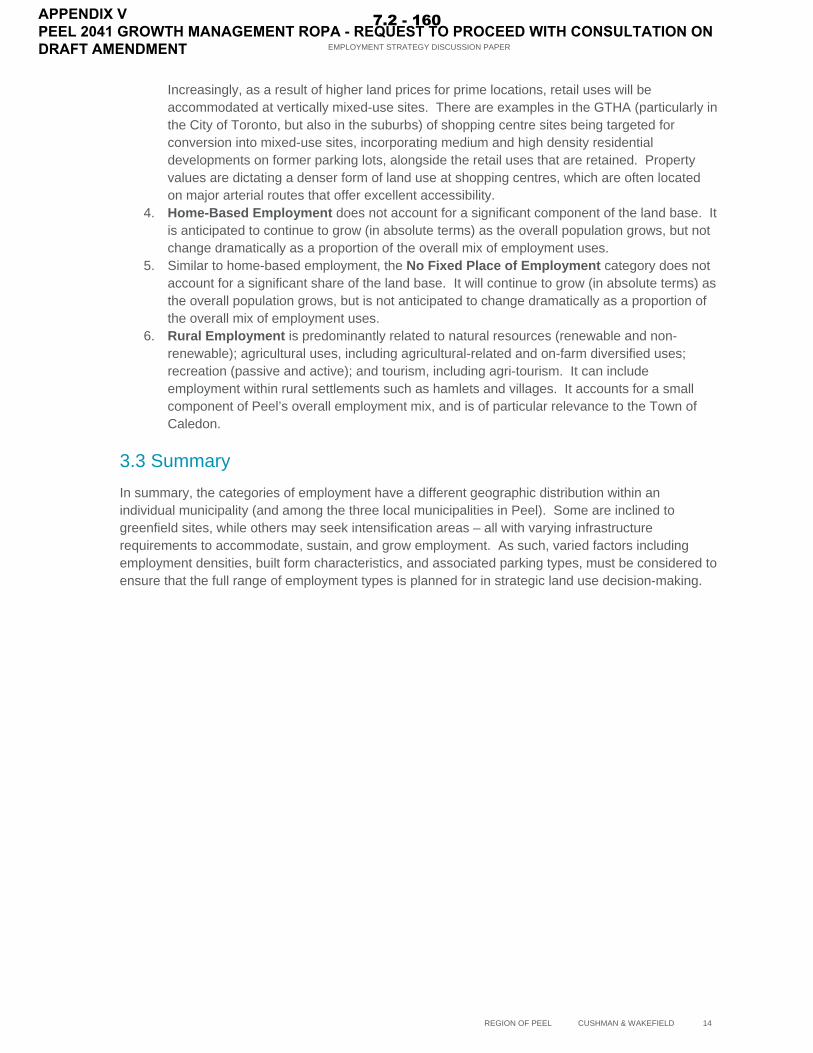
MAJOR OFFICE EMPLOYMENT* Year Mississauga Brampton Caledon Total 1986 22,550 4,780 0 27,330
1991 46,880 6,180 0 53,060
1996 50,370 6,040 0 56,420
2001 69,670 7,620 0 77,290
2006 88,440 9,830 0 98,270
2011 88,340 10,730 0 99,060
2016 94,500 12,800 0 107,300
2021 103,900 16,870 0 120,770
2026 114,960 23,060 350 138,380
2031 123,180 28,490 930 152,600
2036 129,960 34,770 1,760 166,500
2041 137,890 43,130 2,810 183,830
* Note that the forecast employment shown in this table is based on the proposed municipal allocation of population and employment growth at the time of writing. It does not include the portion of Major Office Employment that is in the No Fixed Place of Employment category. Figures in this table are rounded, and may be revised through consultation with the local municipalities, and are ultimately subject to approval by Peel Regional Council.
Employment Land Employment
The conversion of lands within employment areas is an ongoing issue. The nature of employment in the GTHA continues to evolve away from a historic manufacturing base to a more service-based economy. In addition, the siting of sensitive uses such as private schools, daycares, and places of worship, in areas planned for employment uses causes friction with adjacent industrial uses. In permitting the conversion of employment lands to a non-employment use, these lands are highly unlikely to revert in the future back to an employment use; they are “lost” forever. A land supply to meet residential growth targets (plus lands needed to accommodate Population-Related Employment) is sufficiently available in sites designated and planned for such uses.
APPENDIX V PEEL 2041 GROWTH MANAGEMENT ROPA - REQUEST TO PROCEED WITH CONSULTATION ON DRAFT AMENDMENT
7.2 - 164

EMPLOYMENT STRATEGY DISCUSSION PAPER
REGION OF PEEL CUSHMAN & WAKEFIELD 19
Industrial floor space per worker continues to increase.
− Automation is impacting traditional manufacturing employment.
− Warehousing and distribution is the dominant component of growth, and it has relatively low employment density. It is also subject to increased automation.
Regeneration and intensification within older industrial areas will be key to unlocking future employment potential.
− Could be office-type uses in a former industrial building (a multi-functional environment, with a mix of uses and building types) – offers lower cost of occupancy.
Due to the typically land-extensive built form environment, employment lands are not as conducive to public transit service.
− Affordable and reliable “last mile” travel solutions (including active transportation options) are needed to bridge this gap.
Historically, the number of jobs within employment areas declines over time as these areas mature.
Desolate areas will not attract jobs in the future.
Due to their large building footprint (and accordingly, land cost), warehousing and logistic uses are attracted to large sites on the urban periphery which feature ready access to multiple highways.
This historic data and forecast has been prepared by Hemson Consulting.
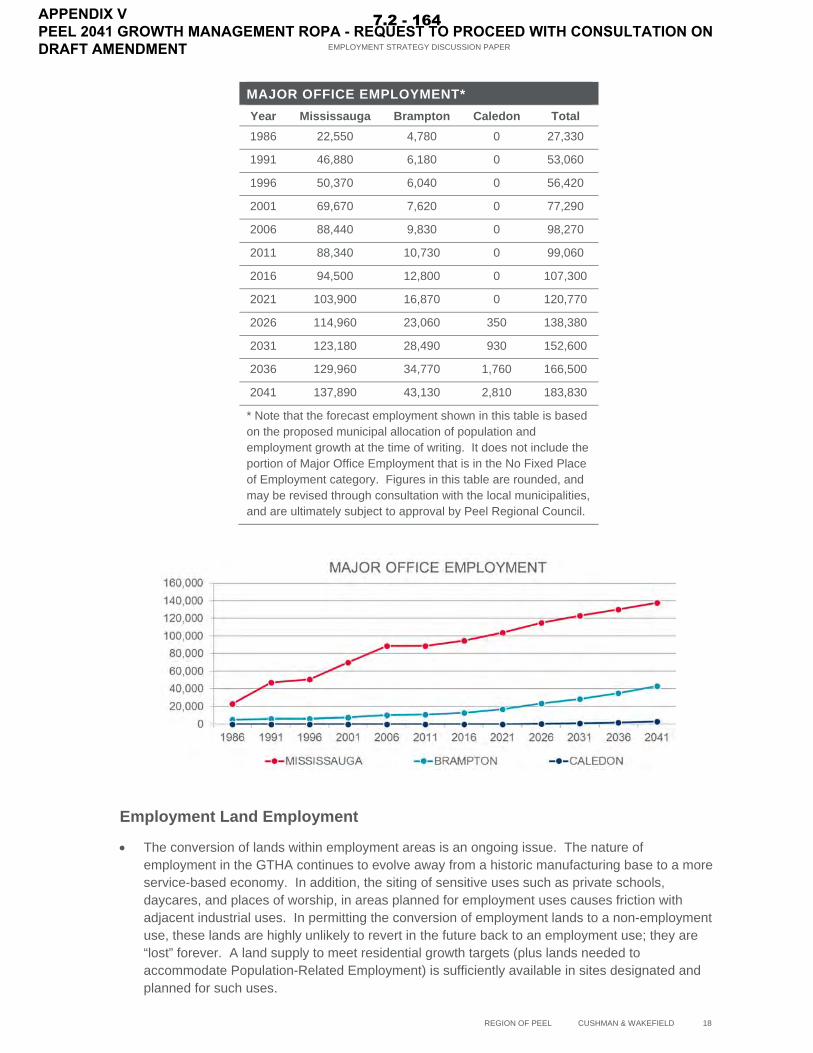
EMPLOYMENT LAND EMPLOYMENT* Year Mississauga Brampton Caledon Total 1986 131,800 43,400 2,900 178,000
1991 150,000 47,300 5,700 203,000
1996 168,100 56,300 8,300 232,700
2001 216,800 75,200 8,000 299,900
2006 237,800 79,200 9,600 326,600
2011 191,500 73,100 9,000 273,600
2016 196,700 86,500 12,100 295,200
2021 201,700 98,900 14,500 315,100
2026 203,700 109,400 19,100 332,200
2031 205,000 115,500 25,000 345,500
2036 205,900 119,700 31,500 357,100
2041 206,700 123,700 41,900 372,300
* Note that the forecast employment shown in this table is based on the proposed municipal allocation of population and employment growth at the time of writing. It does not include the portion of Employment Land Employment that is in the No Fixed Place of Employment category. Figures in this table are rounded, and may be revised through consultation with the local municipalities, and are ultimately subject to approval by Peel Regional Council.
APPENDIX V PEEL 2041 GROWTH MANAGEMENT ROPA - REQUEST TO PROCEED WITH CONSULTATION ON DRAFT AMENDMENT
7.2 - 165
EMPLOYMENT STRATEGY DISCUSSION PAPER
REGION OF PEEL CUSHMAN & WAKEFIELD 20
Population-Related Employment
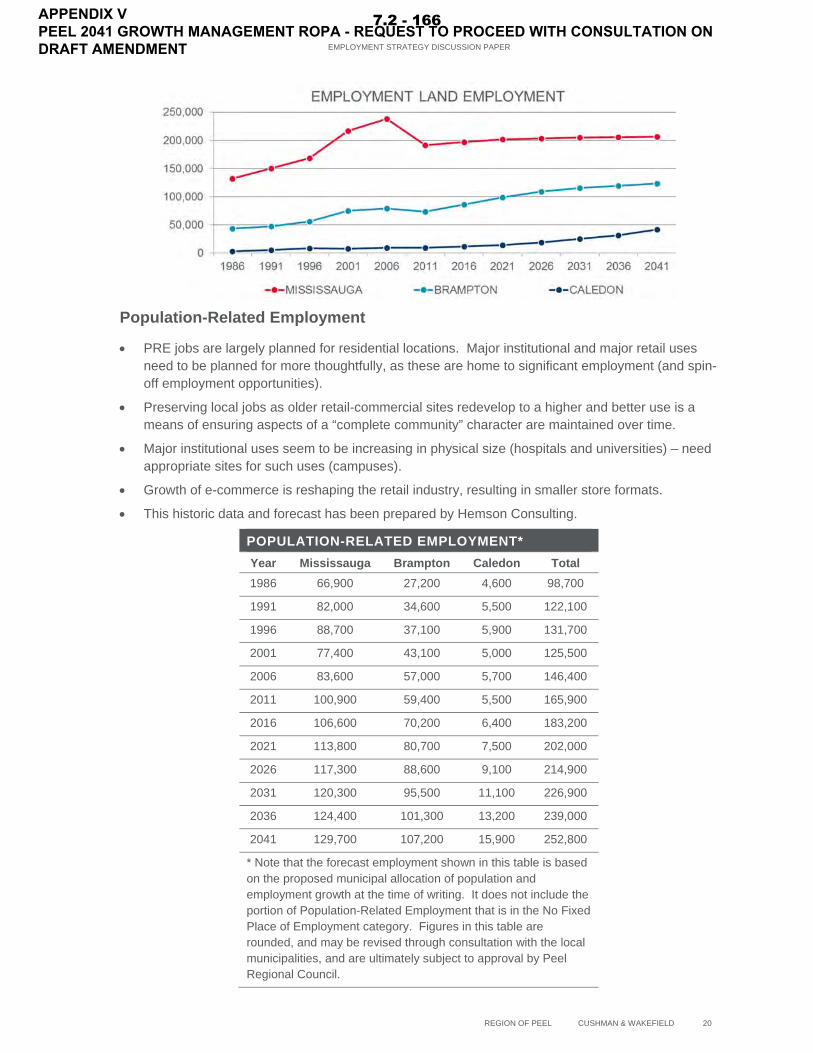
PRE jobs are largely planned for residential locations. Major institutional and major retail uses need to be planned for more thoughtfully, as these are home to significant employment (and spin-off employment opportunities).
Preserving local jobs as older retail-commercial sites redevelop to a higher and better use is a means of ensuring aspects of a “complete community” character are maintained over time.
Major institutional uses seem to be increasing in physical size (hospitals and universities) – need appropriate sites for such uses (campuses).
Growth of e-commerce is reshaping the retail industry, resulting in smaller store formats.
This historic data and forecast has been prepared by Hemson Consulting.
POPULATION-RELATED EMPLOYMENT* Year Mississauga Brampton Caledon Total 1986 66,900 27,200 4,600 98,700
1991 82,000 34,600 5,500 122,100
1996 88,700 37,100 5,900 131,700
2001 77,400 43,100 5,000 125,500
2006 83,600 57,000 5,700 146,400
2011 100,900 59,400 5,500 165,900
2016 106,600 70,200 6,400 183,200
2021 113,800 80,700 7,500 202,000
2026 117,300 88,600 9,100 214,900
2031 120,300 95,500 11,100 226,900
2036 124,400 101,300 13,200 239,000
2041 129,700 107,200 15,900 252,800
* Note that the forecast employment shown in this table is based on the proposed municipal allocation of population and employment growth at the time of writing. It does not include the portion of Population-Related Employment that is in the No Fixed Place of Employment category. Figures in this table are rounded, and may be revised through consultation with the local municipalities, and are ultimately subject to approval by Peel Regional Council.
APPENDIX V PEEL 2041 GROWTH MANAGEMENT ROPA - REQUEST TO PROCEED WITH CONSULTATION ON DRAFT AMENDMENT
7.2 - 166
EMPLOYMENT STRATEGY DISCUSSION PAPER
REGION OF PEEL CUSHMAN & WAKEFIELD 21
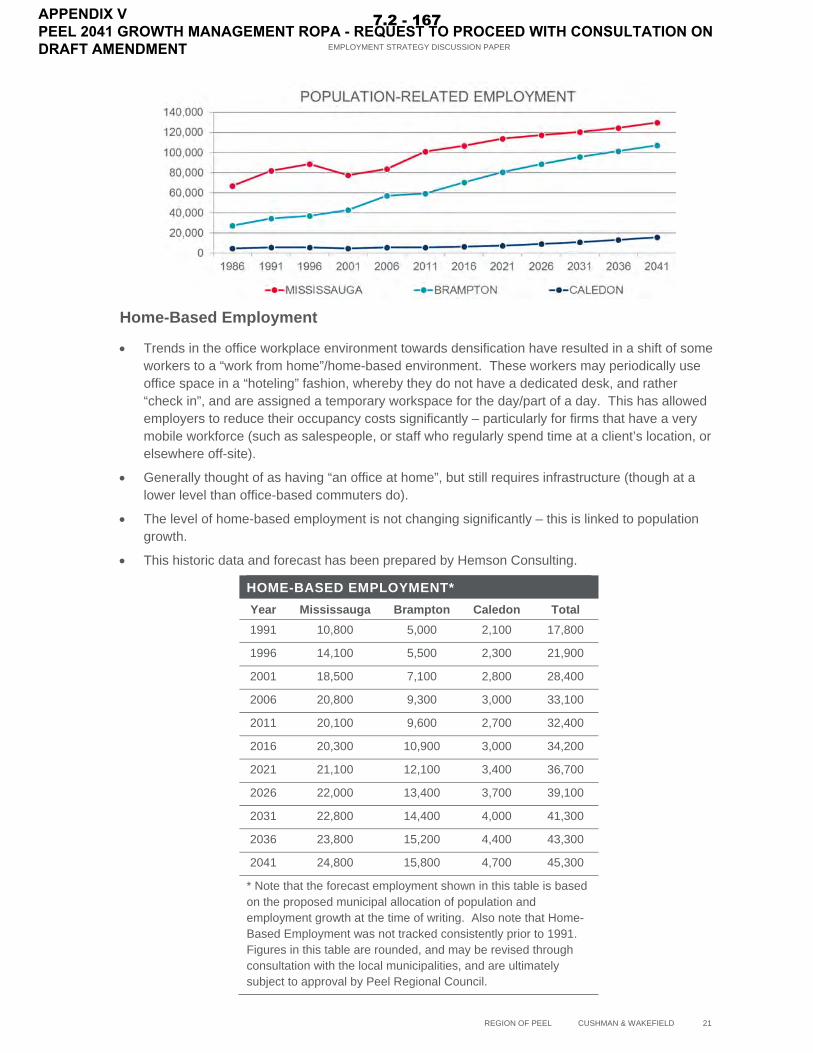
Home-Based Employment
Trends in the office workplace environment towards densification have resulted in a shift of some workers to a “work from home”/home-based environment. These workers may periodically use office space in a “hoteling” fashion, whereby they do not have a dedicated desk, and rather “check in”, and are assigned a temporary workspace for the day/part of a day. This has allowed employers to reduce their occupancy costs significantly – particularly for firms that have a very mobile workforce (such as salespeople, or staff who regularly spend time at a client’s location, or elsewhere off-site).
Generally thought of as having “an office at home”, but still requires infrastructure (though at a lower level than office-based commuters do).
The level of home-based employment is not changing significantly – this is linked to population growth.
This historic data and forecast has been prepared by Hemson Consulting.
HOME-BASED EMPLOYMENT* Year Mississauga Brampton Caledon Total 1991 10,800 5,000 2,100 17,800
1996 14,100 5,500 2,300 21,900
2001 18,500 7,100 2,800 28,400
2006 20,800 9,300 3,000 33,100
2011 20,100 9,600 2,700 32,400
2016 20,300 10,900 3,000 34,200
2021 21,100 12,100 3,400 36,700
2026 22,000 13,400 3,700 39,100
2031 22,800 14,400 4,000 41,300
2036 23,800 15,200 4,400 43,300
2041 24,800 15,800 4,700 45,300
* Note that the forecast employment shown in this table is based on the proposed municipal allocation of population and employment growth at the time of writing. Also note that Home-Based Employment was not tracked consistently prior to 1991. Figures in this table are rounded, and may be revised through consultation with the local municipalities, and are ultimately subject to approval by Peel Regional Council.
APPENDIX V PEEL 2041 GROWTH MANAGEMENT ROPA - REQUEST TO PROCEED WITH CONSULTATION ON DRAFT AMENDMENT
7.2 - 167
EMPLOYMENT STRATEGY DISCUSSION PAPER
REGION OF PEEL CUSHMAN & WAKEFIELD 22
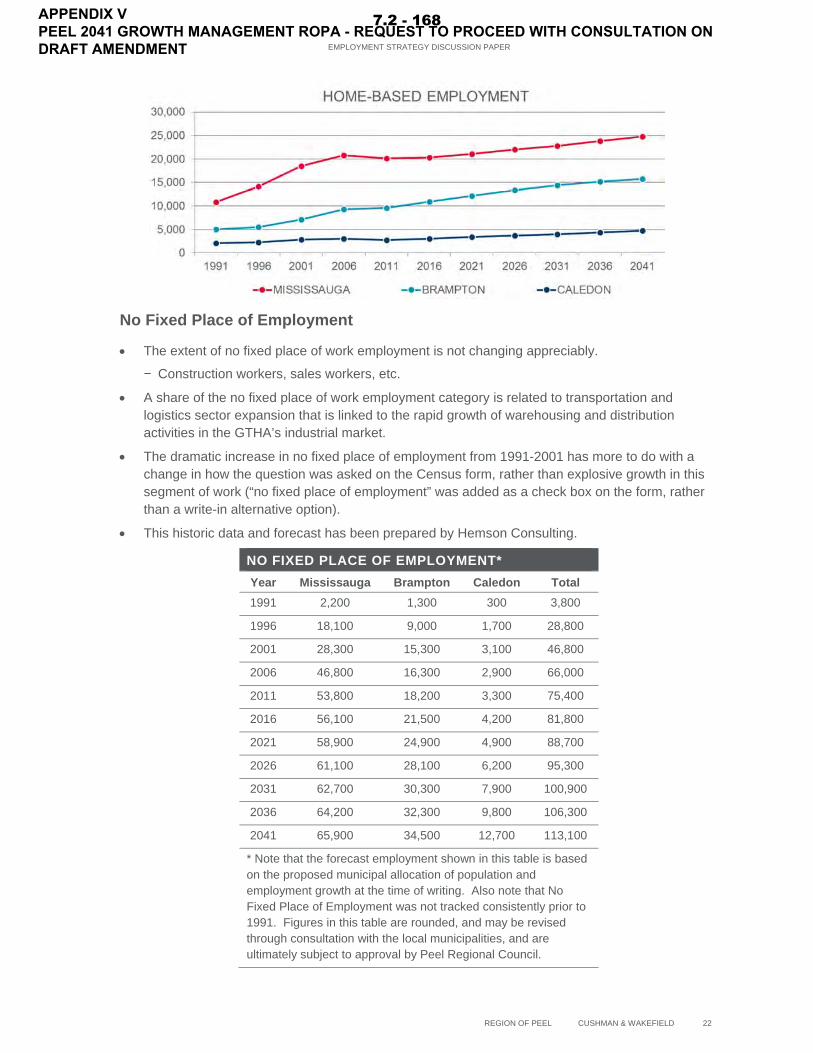
No Fixed Place of Employment
The extent of no fixed place of work employment is not changing appreciably.
− Construction workers, sales workers, etc.
A share of the no fixed place of work employment category is related to transportation and logistics sector expansion that is linked to the rapid growth of warehousing and distribution activities in the GTHA’s industrial market.
The dramatic increase in no fixed place of employment from 1991-2001 has more to do with a change in how the question was asked on the Census form, rather than explosive growth in this segment of work (“no fixed place of employment” was added as a check box on the form, rather than a write-in alternative option).
This historic data and forecast has been prepared by Hemson Consulting.
NO FIXED PLACE OF EMPLOYMENT* Year Mississauga Brampton Caledon Total 1991 2,200 1,300 300 3,800
1996 18,100 9,000 1,700 28,800
2001 28,300 15,300 3,100 46,800
2006 46,800 16,300 2,900 66,000
2011 53,800 18,200 3,300 75,400
2016 56,100 21,500 4,200 81,800
2021 58,900 24,900 4,900 88,700
2026 61,100 28,100 6,200 95,300
2031 62,700 30,300 7,900 100,900
2036 64,200 32,300 9,800 106,300
2041 65,900 34,500 12,700 113,100
* Note that the forecast employment shown in this table is based on the proposed municipal allocation of population and employment growth at the time of writing. Also note that No Fixed Place of Employment was not tracked consistently prior to 1991. Figures in this table are rounded, and may be revised through consultation with the local municipalities, and are ultimately subject to approval by Peel Regional Council.
APPENDIX V PEEL 2041 GROWTH MANAGEMENT ROPA - REQUEST TO PROCEED WITH CONSULTATION ON DRAFT AMENDMENT
7.2 - 168
EMPLOYMENT STRATEGY DISCUSSION PAPER
REGION OF PEEL CUSHMAN & WAKEFIELD 23
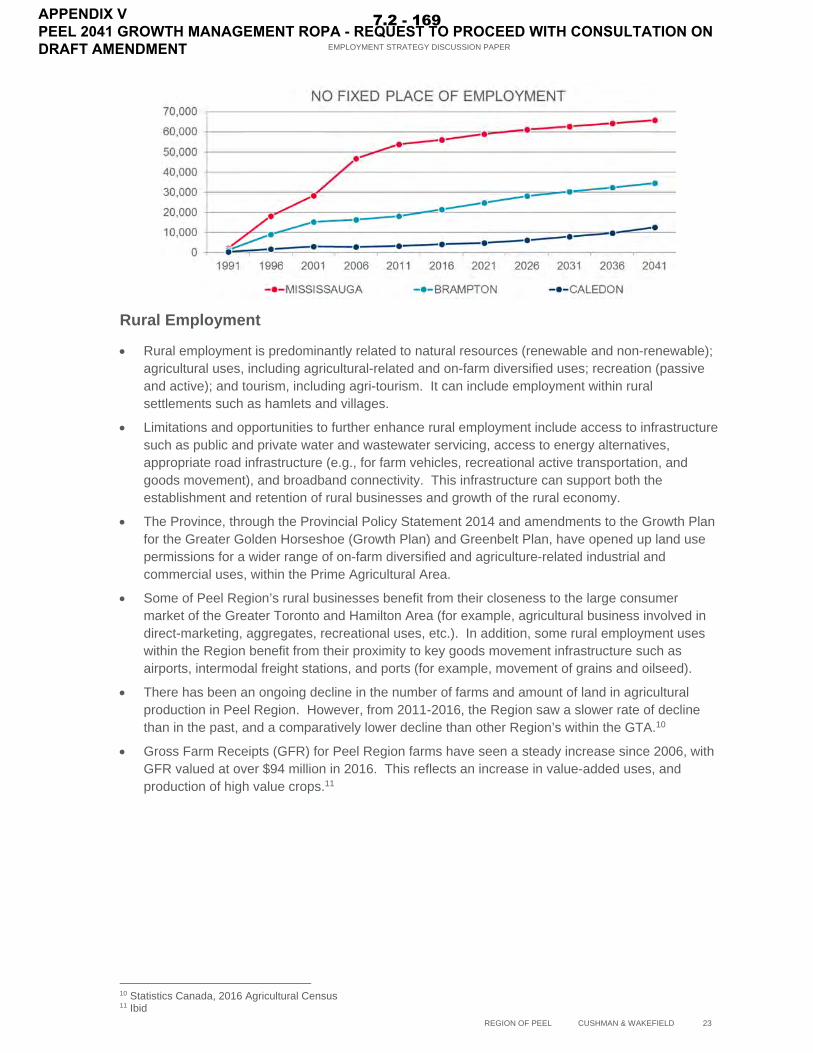
Rural Employment
Rural employment is predominantly related to natural resources (renewable and non-renewable); agricultural uses, including agricultural-related and on-farm diversified uses; recreation (passive and active); and tourism, including agri-tourism. It can include employment within rural settlements such as hamlets and villages.
Limitations and opportunities to further enhance rural employment include access to infrastructure such as public and private water and wastewater servicing, access to energy alternatives, appropriate road infrastructure (e.g., for farm vehicles, recreational active transportation, and goods movement), and broadband connectivity. This infrastructure can support both the establishment and retention of rural businesses and growth of the rural economy.
The Province, through the Provincial Policy Statement 2014 and amendments to the Growth Plan for the Greater Golden Horseshoe (Growth Plan) and Greenbelt Plan, have opened up land use permissions for a wider range of on-farm diversified and agriculture-related industrial and commercial uses, within the Prime Agricultural Area.
Some of Peel Region’s rural businesses benefit from their closeness to the large consumer market of the Greater Toronto and Hamilton Area (for example, agricultural business involved in direct-marketing, aggregates, recreational uses, etc.). In addition, some rural employment uses within the Region benefit from their proximity to key goods movement infrastructure such as airports, intermodal freight stations, and ports (for example, movement of grains and oilseed).
There has been an ongoing decline in the number of farms and amount of land in agricultural production in Peel Region. However, from 2011-2016, the Region saw a slower rate of decline than in the past, and a comparatively lower decline than other Region’s within the GTA.10
Gross Farm Receipts (GFR) for Peel Region farms have seen a steady increase since 2006, with GFR valued at over $94 million in 2016. This reflects an increase in value-added uses, and production of high value crops.11
10 Statistics Canada, 2016 Agricultural Census 11 Ibid
APPENDIX V PEEL 2041 GROWTH MANAGEMENT ROPA - REQUEST TO PROCEED WITH CONSULTATION ON DRAFT AMENDMENT
7.2 - 169
EMPLOYMENT STRATEGY DISCUSSION PAPER
REGION OF PEEL CUSHMAN & WAKEFIELD 24
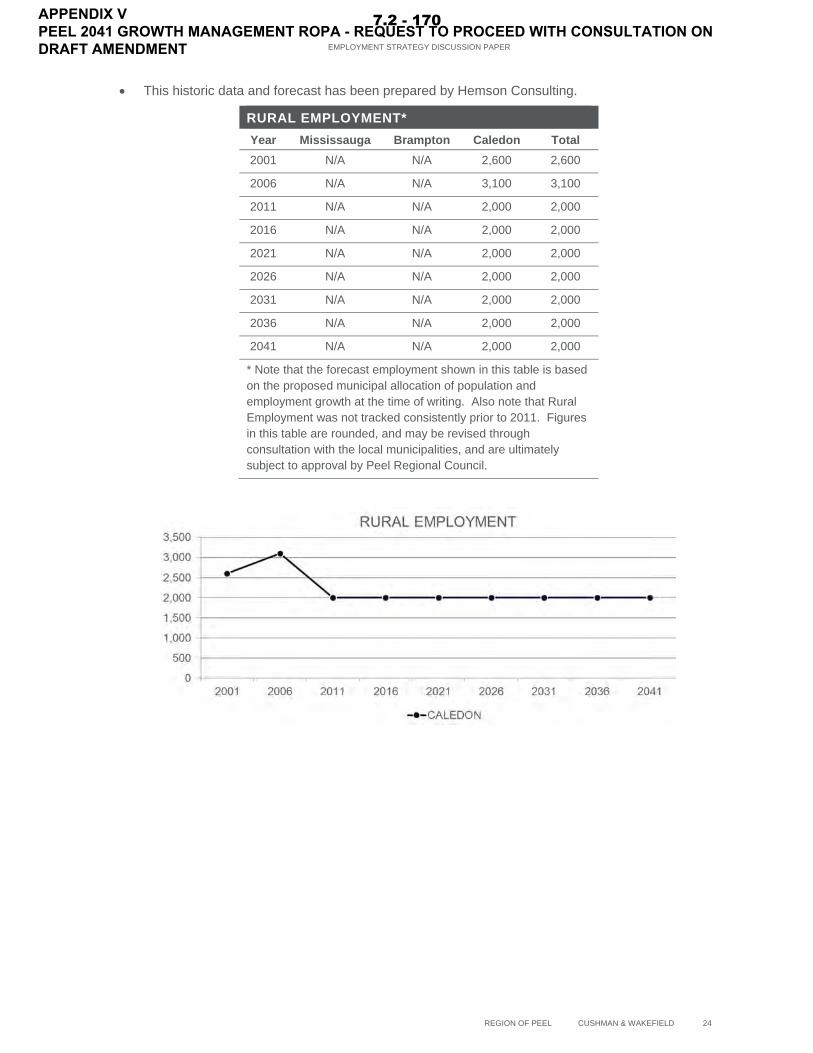
This historic data and forecast has been prepared by Hemson Consulting.
RURAL EMPLOYMENT* Year Mississauga Brampton Caledon Total 2001 N/A N/A 2,600 2,600
2006 N/A N/A 3,100 3,100
2011 N/A N/A 2,000 2,000
2016 N/A N/A 2,000 2,000
2021 N/A N/A 2,000 2,000
2026 N/A N/A 2,000 2,000
2031 N/A N/A 2,000 2,000
2036 N/A N/A 2,000 2,000
2041 N/A N/A 2,000 2,000
* Note that the forecast employment shown in this table is based on the proposed municipal allocation of population and employment growth at the time of writing. Also note that Rural Employment was not tracked consistently prior to 2011. Figures in this table are rounded, and may be revised through consultation with the local municipalities, and are ultimately subject to approval by Peel Regional Council.
APPENDIX V PEEL 2041 GROWTH MANAGEMENT ROPA - REQUEST TO PROCEED WITH CONSULTATION ON DRAFT AMENDMENT
7.2 - 170

EMPLOYMENT STRATEGY DISCUSSION PAPER
REGION OF PEEL CUSHMAN & WAKEFIELD 25
5.0 EMPLOYMENT STRATEGIES
5.1 Introduction Following from the preceding section which explored employment issues, the following section is organized by category of employment. Active and passive strategies have been identified to address current and emerging issues related to employment within Peel Region (and beyond). These strategies should be read as a “menu” of strategies – or a set of “principles” – that may be applicable to all municipalities, or may be tailored to address specific needs of a single municipality. In many instances, the strategic guidance would be implemented at the local municipal level, rather than the Regional level of planning.
5.2 Major Office Employment (MOE)
Suburban Locations Must Offer an Urban Environment to Compete for Sought-After Major Office Employment
Over the past decade, there has been a profound shift in new office construction to Downtown Toronto from the surrounding suburbs. This is due to a number of factors including superior transit accessibility; accessibility to a young and educated pool of labour residing nearby; and the wealth of amenities offered to workers.
Suburban municipalities must offer a compelling alternative on more than just a financial (rent) basis. Enhanced multi-modal transportation and an urban, amenity-rich environment is sought-after, and highly valued among office occupiers.
Leverage Positive Spin-Off Effects from Major Office Development
Office development has many positive spin-off effects for a municipality. The development-related financial benefits through the collection of development charges and ongoing property tax revenues are apparent. In the context of this Employment Strategy Discussion Paper, two other impacts are of importance:
− Demand for shopping, recreation, and other amenities to support the MOE workforce will drive PRE growth in the urban mixed-use nodes that will increasingly be home to new office space (including sites such as “innovation hubs”12).
− Office employment contributes a substantial opportunity to capture transit ridership, and a need to provide a multi-modal environment to be attractive to a broad local and regional labour pool.
Consider Financial Incentives to Attract New Office Development
Financial incentives such as development charge reductions, tax increment equivalent grants (TIEGs), municipally-built parking facilities, and other considerations could be explored to spur new office development, by making the development more cost competitive. These incentives could be tailored to specific locations where offices are being planned for and are sought by municipalities, in the form of a Community Improvement Plan.
12 Innovation Hub: A designated area with dedicated physical infrastructure, facilities and services – usually established in partnership with a post-secondary or research institution – with a strong link between academia and industry, contributing to the movement of ideas/discoveries from concept to commercialization. When cluster stakeholders are placed together in a specific, dense geography, it facilitates the kinds of cross-sector interactions that drive innovative activity. These areas provide an environment that attracts and retains talented workers, who increasingly want to live, work, and play, in dense urban areas that contain high concentrations of cultural amenities, links to transportation, and attractive public spaces.
APPENDIX V PEEL 2041 GROWTH MANAGEMENT ROPA - REQUEST TO PROCEED WITH CONSULTATION ON DRAFT AMENDMENT
7.2 - 171

EMPLOYMENT STRATEGY DISCUSSION PAPER
REGION OF PEEL CUSHMAN & WAKEFIELD 26
Monitor MOE Density to Understand Impacts on Real Estate Market
The trend toward a declining amount of office space per worker is well established. There are various factors contributing to the trend towards higher office employment densities, such as:
− more efficient office building design, allowing greater utilization of floor plates;
− higher occupancy costs (net rental rates, operating costs, and taxes), contributing to a reduced space allocation on a per employee basis by firms;
− greater use of technology, reducing paper filing and storage requirements; and,
− increased telecommuting and desk sharing among co-workers.
Higher office employment densities will impact office development in two ways:
− Some additional density will be accommodated within the existing building stock, reducing the need for future new development.
− New office buildings will be built to a modern standard that accommodated higher densities than some of the existing inventory, leading to less new development than has been required in the past to accommodate office jobs.
It is critical that municipalities plan for an appropriate level of office employment density, as this affects levies from new development (such as development charges). It could also impact the property values (and therefore taxes) collected from existing buildings that are able to accommodate higher densities (and thereby, higher rents than other properties in the market, as tenants have increased demand for such product).
Another impact of rising office employment densities is that in the future, more office workers will occupy space in existing business parks and corporate centre, placing more pressure on the road network, and driving more demand for sustainable transportation solutions (e.g. carpooling, ride-sharing, and public transit). Existing high density employment areas should be a priority for increased transit service and infrastructure, as opposed to planning for service to upstart locations that may emerge as nodes over time.
5.3 Employment Land Employment (ELE)
Protect Budgeted Employment Lands from Conversion
Industrial lands are typically a lower cost land use, compared to other employment-type land uses, and compared to residential lands. Municipalities must continue to protect the designated, budgeted employment lands that are necessary to meet employment targets from conversion to other uses that are seeking to capitalize on relatively lower cost of acquisition. Recent amendments to the Growth Plan necessitate that Municipal Comprehensive Reviews require Provincial approval, further underscoring the importance of identifying and protecting employment lands. While there are circumstances that may justify a conversion – such as seeking intensified land uses in Major Transit Station Areas – the default context should be that no conversion is appropriate. Further, the protection of employment lands from intrusion by sensitive uses (such as private schools, daycares, places of worship) must be ensured, in order to avoid friction from incompatible adjacent/nearby land uses.
APPENDIX V PEEL 2041 GROWTH MANAGEMENT ROPA - REQUEST TO PROCEED WITH CONSULTATION ON DRAFT AMENDMENT
7.2 - 172

EMPLOYMENT STRATEGY DISCUSSION PAPER
REGION OF PEEL CUSHMAN & WAKEFIELD 27
Identify Employment Areas
The requirement for Upper-tier and Single-tier municipal official plans to identify Employment Areas was introduced in recent amendments to the Growth Plan. Municipalities are also encouraged to identify large areas with high concentrations of employment that cross municipal boundaries and are large trip generators (Growth Plan policy 2.2.5.14). In addition, the Provincial Policy Statement allows municipalities to protect strategic employment areas beyond the planning horizon, provided the lands are not designated. The data, analysis, and strategies examined in this Discussion Paper – along with other elements from the Region’s growth management work – should be used to consider appropriate policies and mapping for inclusion in the Regional Official Plan.
Ensure Variety of Employment Lands – Location, Size, and Servicing
Municipalities should encourage a range of parcel sizes, locations, and timing/levels of servicing of employment lands, in order to be responsive to occupier and developer requirements. Having an adequate supply of serviced lands can act to suppress land price inflation, by ensuring choice in the marketplace, and enabling multiple market participants (not one dominant land owner/investor). If there is too limited a supply – or an insufficient range of choices of location/size – then occupiers will look elsewhere. Industrial developers are sensitive to land pricing – it is a key component of their development pro forma model – and they will seek markets that provide lower cost options (which generally coincides with movement from the core towards the urban periphery, or beyond).
Among the planning tools that may be employed to broaden the variety of employment lands within a municipality are:
− Designating additional lands – designating additional lands for employment uses, to increase the supply of vacant lands for development.
− Acquiring land – owning lands and creating a municipal business park (to have influence over the size of parcels, timing of development, and future ownership).
− Development incentives – providing financial incentives (waiver or reduction of building permits and/or development charges) for large landowners to subdivide a portion of lands into smaller lots, so that both smaller-scale uses and larger-scale users may be accommodated, as market demand dictates.
Support Employment Land Intensification Opportunities
Older industrial areas with buildings that no longer meet the requirements of contemporary business (i.e. lower ceiling clear height, less function site layout/truck movements/distribution, etc.) may convert over time to alternate uses – although there is uncertainty and complexity in anticipating the adaptive re-use of employment lands. While this may displace/replace Employment Land Employment, such adaptive re-use of buildings could include more office-type functions – particularly firms seeking low-cost environments that do not need conventional office space (such as high-tech start-ups, and other “new economy” uses). Providing flexibility in planning policy (such as permissive zoning, context-appropriate parking standards, etc.) to accommodate alternative, compatible uses will be important in attracting such opportunities for intensification of employment within established business parks.
APPENDIX V PEEL 2041 GROWTH MANAGEMENT ROPA - REQUEST TO PROCEED WITH CONSULTATION ON DRAFT AMENDMENT
7.2 - 173

EMPLOYMENT STRATEGY DISCUSSION PAPER
REGION OF PEEL CUSHMAN & WAKEFIELD 28
Recognize that Highway Access Increasingly Important
Direct or seamless access to highways – and multiple highway options is preferred – is increasingly important as a site selection driver for industrial occupiers. Logistics uses are increasing as a component of the industrial stock, as e-commerce growth is necessitating new distribution models for retailers. Peel’s municipalities offer ready access to the GTHA’s urban market and beyond, and will remain a sought-after location. Identifying opportunities for future employment lands adjacent to new highways/expanded arterial routes is crucial to remain competitive in the overall region in attracting ELE growth.
Recognize that Multi-Modal Transportation Access Increasingly Important
Employers will increasingly be attracted to employment areas that offer good accessibility, to draw upon the regional labour pool. With the low employment densities associates with many ELE uses, providing transit to serve employment areas can be challenging, from a service level perspective (and therefore, also a financial challenge). Emerging “last mile” travel solutions (including active transportation options) could be part of the solution in providing access to employment areas, while reducing private automobile congestion within the broader region.
Monitor ELE Density to Ensure Adequate Land Supply
Employment densities in industrial areas have been declining, due to the greater rate of warehousing and distribution activity over the past decade or more (and the relatively low employment density associated with this use), along with automation taking the place of some labourers in more traditional manufacturing workplaces. Municipalities must continue to monitor this trend, and align land budgets with the appropriate ELE density, in order to ensure an adequate supply is provided for this land-intensive use. The implication of lower ELE employment density is that more land will be required than before to accommodate the same level of employment.
5.4 Population-Related Employment (PRE)
Recognize that Population-Related Employment Requires a More Nuanced Level of Consideration
In growth management, Population-Related Employment is often not given as much attention as ELE and MOE. PRE is assumed to increase as the population grows, but consideration for the location of PRE employment, and the potential to leverage spin-off employment and synergies, may be overlooked.
In addition to a “General” category of PRE, Major Institutional and Major (large-scale) Retail employment should be considered more closely. Major Institutional and Major Retail can be significant consumers of land – unlike much of the smaller-scale PRE uses that could be grouped into the catch-all “General” category. While General PRE will locate throughout a municipality, in response to market demand, Major Institutional and Major Retail uses often are a self-contained land use – a campus-like ecosystem – without reliance on neighbouring land uses. For this reason, it is important to plan for the location of these uses in both greenfield and intensification development scenarios, in order to attract these forms of employment. Further, these uses generate high levels of employment, and are destinations (sometimes 24 hours a day, 7 days a week – in the case of a hospital; or may have operating hours beyond a typical work day – in the case of post-secondary institutions), which mean that they must be considered in the broader network of transportation and transit planning in the local municipality/Region.
APPENDIX V PEEL 2041 GROWTH MANAGEMENT ROPA - REQUEST TO PROCEED WITH CONSULTATION ON DRAFT AMENDMENT
7.2 - 174
EMPLOYMENT STRATEGY DISCUSSION PAPER
REGION OF PEEL CUSHMAN & WAKEFIELD 29
Plan for Decline in Future Retail Employment Demand, as E-Commerce Increases as a Share of Total Retail Spending
E-commerce spending on retail goods and services continues to increase as a proportion of total retail spending. This has already had a pronounced effect on retail real estate, as some chains shrink the size of their store model footprint. Over time, this could translate into fewer retail employees on a floor space basis. This will impact land demand for new retail development, and affect retail employment growth rates. This could be counteracted to some degree by increased employment in the logistics sector, in dealing with the fulfillment and delivery of online shopping orders. Another emerging trend is pick-up depots replacing traditional retail space. This could have land use implications such as zoning, footprint, access, and fit in the community.
5.5 Home-Based Employment (HBE)
Recognize a Continuum of Home-Based Employment, and Provide Supportive Policy
Home-Based Employment is a modest but growing component of the overall mix of employment. The growth in this segment is largely office-type jobs, as some employers are encouraging their workers to work remotely using technology (and benefit from lower corporate real estate occupancy costs). Planning policy should recognize a continuum of Home-Based Employment, and strike the right balance of permission for such uses, while maintaining the character of residential areas. These planning solutions are influenced by the built form of the structure. Business signage and staff/customer parking are typical issues to be addressed. The continuum is as follows:
− A “home office” for a single worker – whether an employee of a company, or a self-employed – accommodated within their place of residence. In this instance, the structure was built as a residence, and not intended to house a business.
− A “home business”, which includes the resident/employer, along with a small contingent of staff. This is a more intensive use than a single “home office”. Again, in this instance, the structure was built as a residence, and not intended to house a business.
− More formal, purpose-built, live-work settings, where the residential portion of the structure is operationally separated from the commercial portion of the structure, but not physically separated (it may be partitioned by walls, or situated on a different storey of the structure). In this instance, a building is constructed to accommodate commercial uses along with a residential use (unlike “home office”, where a portion of a residential dwelling is set aside for work purposes).
− Purpose-built, mixed-use building forms (small scale) that accommodate Home-Based Employment, as well as residential uses, but are a physically separated use within the building (i.e. separate entrances, and likely located on separate levels of the structure).
5.6 No Fixed Place of Employment (NFPE)
Covers All Employment Types
No Fixed Place of Employment refers to persons who do not go from home to the same workplace location at the beginning of each shift (according to Statistics Canada).
The employment strategies that apply to ELE, MOE, and PRE also apply to this category of employment.
APPENDIX V PEEL 2041 GROWTH MANAGEMENT ROPA - REQUEST TO PROCEED WITH CONSULTATION ON DRAFT AMENDMENT
7.2 - 175

EMPLOYMENT STRATEGY DISCUSSION PAPER
REGION OF PEEL CUSHMAN & WAKEFIELD 30
5.7 Rural Employment (RE)
Collaborate to Increase Rural Employment
In 2012, the Region, along with each Regional municipality within the Golden Horseshoe, as well as the Cities of Hamilton and Toronto, endorsed the “Golden Horseshoe Agriculture & Agri-Food Strategy – Food & Farming: An Action Plan, 2021”. The Action Plan outlines a ten-year vision and corresponding actions which strive to establish the Golden Horseshoe as a globally renowned vibrant food and farming cluster, characterized by profitable farming operations, a thriving hub of food processing, food retail, and food service businesses. Continued municipal support for the implementation of the Action Plan is encouraged to attract agricultural and corresponding rural-based businesses to the rural area to support this cluster.
In 2017, the Headwaters Food & Farming Alliance released an Action Plan complimentary to the Golden Horseshoe Food & Farming Action Plan. Collaboration between the two partnerships with Region of Peel programs is encouraged to further the implementation of the vision, goals, and objectives of both Action Plans.
Ongoing Regional support of the Region’s Peel Agricultural Advisory Working Group (PAAWG) is also recommended, as they assist the Region in its:
− protection of agricultural and rural lands;
− support of farming, and on-farm diversified and agricultural-related uses; and,
− promotion of the importance of the agricultural industry to the Region.
Ongoing support of Region of Peel programs such as the Grown in Peel local food guide and the Peel Rural Water Quality Program, which are delivered in partnerships to promote and support the viability of the Region’s agricultural sector.
Support the implementation of both the Region of Peel’s and Headwaters Food & Farming Alliance’s Food Charters. These charters bolster agricultural uses, and encourage support for the economic development and diversification of the sector.
Look for opportunities through existing partnerships to encourage the implementation of the Town of Caledon’s Economic Development Office’s economic development strategies that support the rural economy.
Implement New Provincial Policy
The Province, through its amendments to the Growth Plan and Greenbelt Plan, has encouraged municipalities to protect and enhance the Agri-Food Network that comprises the Provincial Agricultural System for the Greater Golden Horseshoe. Municipal employment and economic development strategies that promote the long-term economic prosperity of the Agri-Food Network are examples provided by the Province on how this policy direction can be implemented.
5.8 Other Considerations
Broadband Infrastructure
The Canadian Radio-television and Telecommunications Commission (CRTC) has established a universal service objective that all Canadians should have broadband internet access at a defined speed. For fixed (wired) broadband access, the minimum available speeds should be 50 Mbps download and 10 Mbps upload.
− Currently, almost 50% of Canadian subscribers have a service of 16 Mbps or faster.
− Subscriptions for 50 Mbps or faster has grown significantly in the last five years, and now comprises almost 20% of all subscriptions.
APPENDIX V PEEL 2041 GROWTH MANAGEMENT ROPA - REQUEST TO PROCEED WITH CONSULTATION ON DRAFT AMENDMENT
7.2 - 176

EMPLOYMENT STRATEGY DISCUSSION PAPER
REGION OF PEEL CUSHMAN & WAKEFIELD 31
While most cities offer a 4G network of services, the next generation of wireless 5G broadband technology is under development to enable the adoption of the “Internet of Things” – a key platform for any “Smart City” strategy.
Full deployment of 5G technology is not expected until 2020, but some telecommunications carriers have begun to prepare for this.
The most important trend in broadband is connectivity and speed, and this will continue to drive competition, innovation, and expansion of networks. Broadband allows for faster and automated information flow between companies, but it also connects residents to jobs through the effective use of online tools to support job matching, as well as online job training.
There are several benefits of accessible and adoptable broadband networks:
− They can act as a tool in helping cities to attract skilled workers, enable innovation, and create a stronger competitive edge for a community.
− They can contribute to the increase of specialized knowledge-intensive activities (e.g. IT services, engineering, accounting, and financial services), and support the growth of entrepreneurs working from home.
− Broadband access also affords a range of social benefits for a community, from enabling access to lower-cost online education and training, to better educational performance in children and adults, and improved citizen engagement.
Where possible, the Region should support local initiatives including data gathering, analysis, and the development of strategy regarding advanced telecommunications infrastructure, including broadband. This potentially relates to initiatives regarding supporting office clusters; intensification around Major Transit Station Areas; attracting industries such as biotech, life sciences, and advanced manufacturing; attracting post-secondary educational facilities; fostering Employment Land Employment growth (particularly in Caledon); and others. Please refer to Appendix A, titled Broadband and Employment Growth Implications, which discusses issues and opportunities associated with broadband infrastructure and employment growth.
Moving from Sprawl to Intensification
Affordable housing for workers (home ownership and rental) and affordable workplaces (occupancy costs) are vital to moving the region from sprawling development to a more intensified form. Providing accessible places of work (fast, efficient, affordable, and reliable) is important – particularly for millennial generation, where the auto ownership rate is much lower than prior generations.
Identifying which Employment Types (and Associated Land Uses) Require Permission, versus Protection, versus Incentives?
Permission refers to a balance between permitting flexibility versus applying planning control. This is a relevant consideration across all employment types, with regard to land use planning.
Protection is particularly necessary for employment lands, where alternative uses are seeking conversion of lands (often seeking a low land cost, as opposed to simply superior location attributes versus other vacant/available sites). It may be desirable to protect for Major Office uses in select locations where prime sites (such as those well served by transit) are sought for lower density uses.
APPENDIX V PEEL 2041 GROWTH MANAGEMENT ROPA - REQUEST TO PROCEED WITH CONSULTATION ON DRAFT AMENDMENT
7.2 - 177

EMPLOYMENT STRATEGY DISCUSSION PAPER
REGION OF PEEL CUSHMAN & WAKEFIELD 32
Incentives are intended for those employment segments that are more challenging to achieve.
− A competitive landscape exists for attracting Major Office Employment and certain Major Institutional uses (e.g. post-secondary educational institutions). Tax increment equivalent grants are one tool that may be employed to attract office users to a specific location/precinct.
− Retention of employment along historic main streets may be facilitated through incentives (such as heritage grants).
APPENDIX V PEEL 2041 GROWTH MANAGEMENT ROPA - REQUEST TO PROCEED WITH CONSULTATION ON DRAFT AMENDMENT
7.2 - 178
EMPLOYMENT STRATEGY DISCUSSION PAPER
REGION OF PEEL CUSHMAN & WAKEFIELD 33
6.0 RECOMMENDATIONS
6.1 Introduction The following section summarizes the recommendations stemming from the preceding research, analysis, and strategies. Discussion of the timing of these recommendations is included.
6.2 Major Office Employment (MOE)
Suburban Locations Must Offer an Urban Environment to Compete for Sought-After Major Office Employment
RECOMMENDATION: The Region and local municipalities should consider the provision of enhanced multi-modal transportation, and the design of urban, amenity-rich environments, in order to attract and retain office users. This includes evaluating the impact of improved transit service levels and enhanced infrastructure to established office nodes, and ensuring that a high quality public realm is a feature of new development/redevelopment.
TIMING: This should take place over the full planning horizon – particularly as opportunities arise to replace existing infrastructure.
Leverage Positive Spin-Off Effects from Major Office Development
RECOMMENDATION: Ensure that land use planning provides opportunities for shopping, recreation, and other amenities to support the office workforce, are accessible in established and emerging office locations. Urban, mixed-use nodes are likely to emerge as a location preference for office occupiers.
TIMING: As development applications are received, these issues can be reviewed on a local area basis. As well, as Official Plans are periodically reviewed, there is an opportunity to consider the range of uses in key commercial office nodes, and beyond.
RECOMMENDATION: As, office employment contributes a substantial opportunity to capture transit ridership, there is a need to provide a multi-modal environment to be attractive to a broad local and regional labour pool. Enhancing transit access/frequency of service to established office nodes will help ensure these areas remain vital. Provision of new service to emerging office locations will also be essential in attracting occupiers.
TIMING: Enhanced transit provision would provide immediate benefits, but as with any prospective investment, the costs must be weighed against the benefits. This is a matter for ongoing consideration, linking land use and transportation planning.
Consider Financial Incentives to Attract New Office Development
RECOMMENDATION: A range of financial incentives such as development charge reductions, tax increment equivalent grants (TIEGs), municipally-built parking facilities, and other considerations could be explored to spur new office development, by making the development more cost competitive. These incentives could be tailored to specific locations where offices are being planned for and are sought by municipalities, in the form of a Community Improvement Plan.
TIMING: In the near term, identification of financial (and non-financial) incentives that are in place in other GTHA municipalities to attract office development is a starting point. In time, evaluating the merits of each type of incentive should be studied. Ongoing monitoring of this topic is recommended.
APPENDIX V PEEL 2041 GROWTH MANAGEMENT ROPA - REQUEST TO PROCEED WITH CONSULTATION ON DRAFT AMENDMENT
7.2 - 179

EMPLOYMENT STRATEGY DISCUSSION PAPER
REGION OF PEEL CUSHMAN & WAKEFIELD 34
Monitor MOE Density to Understand Impacts on Real Estate Market
RECOMMENDATION: Since increasing office employment densities have a range of impacts – from the amount of new office development needed to accommodate growth, to financial considerations such as the collection of development charges and property taxes – ongoing quantitative analysis on this topic is essential. Data such as employer surveys and building permits are key inputs.
TIMING: This is an ongoing requirement. Analysis should be undertaken at least every five years, to assess trends in the marketplace.
6.3 Employment Land Employment (ELE)
Protect Budgeted Employment Lands from Conversion
RECOMMENDATION: Municipalities must continue to protect the designated, budgeted employment lands that are necessary to meet employment targets from conversion to other uses. Recent amendments to the Growth Plan necessitate that Municipal Comprehensive Reviews require Provincial approval, further underscoring the importance of identifying and protecting employment lands. While there are circumstances that may justify a conversion – such as seeking intensified land uses in Major Transit Station Areas – the default context should be that no conversion is appropriate. Further, the protection of employment lands from intrusion by sensitive uses (such as private schools, daycares, places of worship) must be ensured, in order to avoid friction from incompatible adjacent/nearby land uses.
TIMING: This is an ongoing matter of planning policy.
Identify Employment Areas
RECOMMENDATION: As a result of recent amendments to the Growth Plan, Upper-tier and Single-tier municipal official plans are required to identify Employment Areas. Municipalities are also encouraged to identify large areas with high concentrations of employment that cross municipal boundaries and are large trip generators. In addition, the Provincial Policy Statement allows municipalities to protect strategic employment areas beyond the planning horizon, provided the lands are not designated. The data, analysis, and strategies examined in this Discussion Paper – along with other elements from the Region’s growth management work – should be used to consider appropriate policies and mapping for inclusion in the Regional Official Plan.
TIMING: This planning policy should be addressed in the near term.
Ensure Variety of Employment Lands – Location, Size, and Servicing
RECOMMENDATION: Municipalities should encourage a range of parcel sizes, locations, and timing/levels of servicing of employment lands, in order to be responsive to occupier and developer requirements. Having an adequate supply of serviced lands can act to suppress land price inflation, by ensuring choice in the marketplace, and enabling multiple market participants. Among the planning tools that may be employed to broaden the variety of employment lands within a municipality are designating additional lands, acquiring land, and providing development incentives.
TIMING: The designation of additional lands would be undertaken in tandem with a land supply and demand study (such as a Municipal Comprehensive Review). Land acquisition could be considered proactively – approaching a landowner – or reactively – reviewing the merits of purchasing a property that is offered for sale. First, a land acquisition strategy would be completed that identifies the location, size, and timing of lands required. In the near term, identification of financial (and non-financial) incentives that are in place in other GTHA municipalities to attract employment land-type development is a starting point. In time, evaluating the merits of each type of incentive should be studied. Ongoing monitoring of this topic is recommended.
APPENDIX V PEEL 2041 GROWTH MANAGEMENT ROPA - REQUEST TO PROCEED WITH CONSULTATION ON DRAFT AMENDMENT
7.2 - 180

EMPLOYMENT STRATEGY DISCUSSION PAPER
REGION OF PEEL CUSHMAN & WAKEFIELD 35
Support Employment Land Intensification Opportunities
RECOMMENDATION: While this may displace/replace Employment Land Employment, providing flexibility in planning policy (such as permissive zoning, context-appropriate parking standards, etc.) to accommodate alternative, compatible uses will be important in attracting such opportunities for intensification of employment within established business parks. While new office construction should be directed to transit-supportive area (such as Major Transit Station Areas), the adaptive re-use of aging/obsolete industrial facilities as low-cost office spaces should be permitted, where market demand exists. We note that there is uncertainty and complexity in anticipating the adaptive re-use of employment lands, and this is an area for ongoing investigation/monitoring.
TIMING: This matter should be explored proactively, from a policy and land use planning perspective, to avoid reactionary planning that results from addressing “one-off” applications that involve intensification within an existing employment area.
Recognize that Highway Access Increasingly Important
RECOMMENDATION: Identifying opportunities for future employment lands adjacent to new highways/expanded arterial routes is crucial to remain competitive in the overall region in attracting ELE growth.
TIMING: This is an ongoing matter of aligning land use and transportation planning.
Recognize that Multi-Modal Transportation Access Increasingly Important
RECOMMENDATION: Regional and municipal staff should continue to explore ways to provide transit to lower density employment areas in a cost-effective way – including emerging “last mile” travel solutions (incorporating active transportation options, where possible). “Best practice” examples should be studied for suitability in Peel.
TIMING: This is an evolving niche within the transportation/transit mix, and should be pursued over time.
Monitor ELE Density to Ensure Adequate Land Supply
RECOMMENDATION: Municipalities must continue to monitor this trend, and align land budgets with the appropriate ELE density, in order to ensure an adequate supply is provided for this land-intensive use. The implication of lower ELE employment density is that more land will be required than before to accommodate the same level of employment.
TIMING: This is an ongoing requirement. Analysis should be undertaken at least every five years, to assess trends in the marketplace.
6.4 Population-Related Employment (PRE)
Recognize that Population-Related Employment Requires a More Nuanced Level of Consideration
RECOMMENDATION: In addition to a “General” category of PRE, Major Institutional and Major (large-scale) Retail employment should be considered more closely in growth management. Major Institutional and Major Retail can be significant consumers of land – unlike much of the smaller-scale PRE uses that could be grouped into the catch-all “General” category. Major Institutional and Major Retail uses often are a self-contained land use – a campus-like ecosystem, without reliance on neighbouring land uses. For this reason, it is important to plan for the location of these uses in both greenfield and intensification development scenarios, in order to attract these forms of employment.
APPENDIX V PEEL 2041 GROWTH MANAGEMENT ROPA - REQUEST TO PROCEED WITH CONSULTATION ON DRAFT AMENDMENT
7.2 - 181

EMPLOYMENT STRATEGY DISCUSSION PAPER
REGION OF PEEL CUSHMAN & WAKEFIELD 36
TIMING: This is a matter for ongoing attention.
Plan for Decline in Future Retail Employment Demand, as E-Commerce Increases as a Share of Total Retail Spending
RECOMMENDATION: Monitor the impact of rising e-commerce spending on retail-commercial land demand, and retail employment (it is a component of Population-Related Employment).
TIMING: This is an evolving trend which should continue to be monitored.
6.5 Home-Based Employment (HBE)
Recognize a Continuum of Home-Based Employment, and Provide Supportive Policy
RECOMMENDATION: Policy should recognize a continuum of Home-Based Employment, striking the right balance of permission for such uses, while maintaining the character of residential areas.
TIMING: This matter should be explored proactively, from a policy and land use planning perspective, to avoid reactionary planning that results from addressing “one-off” applications to permit a home-based business.
6.6 No Fixed Place of Employment (NFPE)
Covers All Employment Types
No Fixed Place of Employment refers to persons who do not go from home to the same workplace location at the beginning of each shift (according to Statistics Canada). The employment strategies and recommendations that apply to ELE, MOE, and PRE also apply to this category of employment.
6.7 Rural Employment (RE)
Collaborate to Increase Rural Employment
RECOMMENDATION: Continued municipal support for the implementation of the “Golden Horseshoe Agriculture & Agri-Food Strategy – Food & Farming: An Action Plan, 2021” is advised, along with support for the Headwaters Food & Farming Alliance’s Action Plan. Collaboration between the two partnerships with Region of Peel programs is encouraged to further the implementation of the vision, goals, and objectives of both Action Plans. As well, ongoing support for Region of Peel programs such as the Grown in Peel local food guide and the Peel Rural Water Quality Program, along with Region of Peel’s and Headwaters Food & Farming Alliance’s Food Charters. Finally, seeking opportunities through existing partnerships to encourage the implementation of the Town of Caledon’s Economic Development Office’s economic development strategies that support the rural economy is recommended.
TIMING: This is a matter for ongoing attention.
Implement New Provincial Policy
RECOMMENDATION: The Province, through its amendments to the Growth Plan and Greenbelt Plan, has encouraged municipalities to protect and enhance the Agri-Food Network that comprises the Provincial Agricultural System for the Greater Golden Horseshoe. Pursuing municipal employment and economic development strategies that promote the long-term economic prosperity of the Agri-Food Network is advised.
TIMING: This is a matter for ongoing attention.
APPENDIX V PEEL 2041 GROWTH MANAGEMENT ROPA - REQUEST TO PROCEED WITH CONSULTATION ON DRAFT AMENDMENT
7.2 - 182
EMPLOYMENT STRATEGY DISCUSSION PAPER
REGION OF PEEL CUSHMAN & WAKEFIELD 37
6.8 Broadband Infrastructure When considering next steps for broadband investment in Peel Region, and in particular, in its employment lands, the Region should consider undertaking the following activities:
1. Completion of a robust gap analysis that identifies existing broadband services and connectivity within Peel Region, including access, speed, and prices, to better understand the market, and the various gaps in service delivery within the Region.
2. Completion of a needs analysis that identifies the needs and interests of a range of public and private sector stakeholders, as well as the current challenges and obstacles in obtaining increased connectivity.
3. Completion of a detailed baseline data and background information set to ensure the Region and local municipalities can be ready for any future funding opportunities under the Government of Canada’s Connect to Innovate funding program.
4. Completion of an assessment of the appropriate role and scope that the Region and local municipalities should provide in enhancing and delivering broadband service within their jurisdiction, including partnerships and collaboration with private sector enterprises. This may include changes to municipal processes and procedures, or improvements to the Public Sector Network (PSN).
5. Consideration of technology options and approaches to servicing the needs highlighted through consultation, including potential costs. This could include the investigation of introducing public Wi-Fi across business parks, corridors, and centres.
6. Completion of a ‘Smart Peel Strategy’ that illustrates how broadband connectivity can assist the Region and local municipalities in becoming an ‘Intelligent/Smart Community’, and the related benefits and economic impacts of this designation.
APPENDIX V PEEL 2041 GROWTH MANAGEMENT ROPA - REQUEST TO PROCEED WITH CONSULTATION ON DRAFT AMENDMENT
7.2 - 183

EMPLOYMENT STRATEGY DISCUSSION PAPER
REGION OF PEEL CUSHMAN & WAKEFIELD
APPENDIX A – BROADBAND AND EMPLOYMENT GROWTH IMPLICATIONS
APPENDIX V PEEL 2041 GROWTH MANAGEMENT ROPA - REQUEST TO PROCEED WITH CONSULTATION ON DRAFT AMENDMENT
7.2 - 184

Broadband and Employment Growth Implications Region of Peel
White Paper
September 19, 2017
APPENDIX VPEEL 2041 GROWTH MANAGEMENT ROPA - REQUEST TO PROCEED WITH CONSULTATION ONDRAFT AMENDMENT
7.2 - 185
MDB Insight Page i
Table of Contents
1. What is Broadband? ....................................................................................................... 1
1.1 Introduction .............................................................................................................................. 1
1.2 Broadband Trends .................................................................................................................... 1
1.3 Benchmarking Broadband ........................................................................................................ 2
2. Broadband Implications .................................................................................................. 4
2.1 Broadband is a Key Element to ‘Smart City’ Development ...................................................... 4
2.2 Broadband Responds to the Pressures of the Digital Economy ............................................... 6
2.3 Broadband is a Standard Requirement for Growing Businesses .............................................. 7
2.4 Broadband and Economic Development .................................................................................. 8
2.5 Broadband in Agricultural Lands .............................................................................................. 8
3. Broadband Work Undertaken in Canada ...................................................................... 10
3.1 Work Undertaken in Peel Region ........................................................................................... 10
3.1.1 Public Sector Network ....................................................................................................................... 10
3.2 Other GTA Regional Governments ......................................................................................... 11
3.2.1 York Region ........................................................................................................................................ 11
3.2.2 Durham Region .................................................................................................................................. 13
3.3 Multi‐Government Networks ................................................................................................. 14
3.3.1 Southwestern Integrated Fibre Technology Network ....................................................................... 14
3.3.2 Eastern Ontario Regional Network .................................................................................................... 15
3.4 Smart Cities Undertaking Broadband Investment.................................................................. 18
3.4.1 Surrey, BC .......................................................................................................................................... 18
4. Considerations for Peel Region ..................................................................................... 20
5. Resources ..................................................................................................................... 21
APPENDIX VPEEL 2041 GROWTH MANAGEMENT ROPA - REQUEST TO PROCEED WITH CONSULTATION ONDRAFT AMENDMENT
7.2 - 186

MDB Insight Page 1
1. What is Broadband?1.1 Introduction There are widely varying definitions of what ‘broadband’ means practically. In the most basic sense, broadband is a type of access to the internet that is: a) always on; and b) faster than traditional phone‐line‐based dial‐up internet service. Given that much of the developed world has moved well beyond dial‐up internet services, most definitions of broadband now have to do with the speed of the internet service being provided. Broadband speed is measured in megabits per second, or ‘Mbps’.
The Canadian Radio‐Telecommunication Commission (CRTC) glossary defines broadband as “an always‐on, high‐speed connection to the internet through the facilities of an Internet‐Service‐Provider (ISP) that provide[s] download throughput of greater than 1 Mbps,”.
More recently, the CRTC established a ‘universal service objective’ that all Canadians should have broadband internet access, at a specified speed. For ‘fixed’ (wired) broadband access, the CRTC determined that the minimum available speeds should be 50 Mbps download and 10 Mbps upload.1 Throughout this report and to be consistent, when broadband is mentioned, this is the standard that is being referenced.
1.2 Broadband Trends An updated broadband standard is sensible given the subscription trends to internet services in Canada overall. As shown in the chart below, based on data gathered by the CRTC, Canadians are increasingly subscribing to higher‐speed internet services. Nearly 50% of Canadian subscribers have a service 16 Mbps or faster, while over the last five years, subscription to 50 Mbps or faster services has grown from almost non‐existent to 19.2% of subscriptions. The trend suggests that consumers, businesses, and residents, are looking for ubiquitous and constant connectivity.
Figure 1: Internet Service, One‐Month Subscriber Distribution (%), by Advertised Download Speed
Source: CRTC, Communications Monitoring Report, 2016
1 CRTC, 2016. Telecom Regulatory Policy 2016‐496. http://crtc.gc.ca/eng/archive/2016/2016‐496.pdf
4.3
2.9
24.6
18.2
7.3
3.7
2.9
45.6
41.3
32.8
26.9
23.4
15.6
10.1
25.6
25.6
24.1
9.2
23.5
26.3
31.9
29.4
3.6
5
9.8
19.2
0% 20% 40% 60% 80% 100%
2011
2012
2013
2014
20150‐256 Kbps
300‐1400 Kbps
1.5 to 4 Mbps
5 to 9 Mbps
10 to 15 Mbps
16 to 49 Mbps
50 Mbps and higher
APPENDIX VPEEL 2041 GROWTH MANAGEMENT ROPA - REQUEST TO PROCEED WITH CONSULTATION ONDRAFT AMENDMENT
7.2 - 187
MDB Insight Page 2
This trend coincides with a general move from wired to wireless connectivity for everyday uses of broadband. This desire to be connected will continue to be the driver of competition, innovation, and expansion of broadband networks into the future.
Current wireless speeds in the Greater Toronto Area are already more than the CRTC’s broadband wired standard. Several carriers are using wireless technologies to expand outside of major centres, instead of installing fibre. This is due to the fact that carriers can deliver broadband (50+ Mbps) via wireless at a much lower cost compared to fibre.
As consumer demand for data grows, it will lead to wireless network capacity issues. Globally, Cisco expects mobile data traffic to expand sevenfold between 2016 and 2021.2 To meet this greater demand for data, carriers have already started on the next generation of wireless broadband technology: 5G, or 5th Generation of broadband delivery.
Standards for 5G are still in development globally, but carriers are targeting for gigabit speed delivery, with the objective of improving coverage and capacity, and significantly reducing latency. The 5G networks would be deployed primarily through a higher density of ‘small cells’ and in‐building distributed antenna systems, in addition to traditional towers.
The growth of 5G technology will see an increased demand from traditional carriers for the use of city/region infrastructure such as street poles and buildings. Already at this pre‐5G stage, the inclusion of, or provision for, distributed antenna systems (DAS) inside new office buildings has become common. These systems provide wireless service within a geographic area or structure. Full deployment of 5G technology in Canada is not expected until 2020 at the earliest. However, some carriers have already begun preparations for the changes that will be required. These changes are not anticipating the use of underground fibre lines, but deploying large wireless fields off the top of buildings and city infrastructure. Municipal restrictions on electromagnetic radiation might be a concern for the advancement of 5G technology.
The Internet of Things (IoT) defined as the interconnection via the internet of computing devices embedded in everyday objects, enabling them to send and receive data, also promises to change the way society operates. IoT will see the increase of smart infrastructure as technology on common infrastructure (i.e. roads, streetlights, and sewers) become mechanised, and transmit performance metrics that can be viewed to improve, repair, or otherwise, change the infrastructure, or the way services are delivered. New smartphone applications will appear that enable new delivery of city services, either on the City’s, initiative or through private developers. The evolution of untraditional wireless networks will occur to enable machine‐to‐machine communication (M2M), enabling automation, and new business systems.
1.3 Benchmarking Broadband In most cases, download speed is the only benchmark businesses and residents are concerned with. However, this alone is not always a reliable way of determining great broadband versus good broadband. Upload speeds – the rate at which data is transferred from your device to the internet – is slowing becoming a required benchmark. With Cloud computing, many businesses are using the internet for uploading just as much as downloading.
2 Cisco, 2015. VNI Mobile Forecast Highlights, 2016‐2021.
APPENDIX VPEEL 2041 GROWTH MANAGEMENT ROPA - REQUEST TO PROCEED WITH CONSULTATION ONDRAFT AMENDMENT
7.2 - 188

MDB Insight Page 3
The type of connection a business’ internet is supplied can also be a benchmark into the quality of their connection. The distance from the exchange, quality of wiring, and whether the connection is shared with other users in the area, will affect the consistency of internet speeds. If a connection is shared, the internet is delivered to a central node in the area by fibre optic cable, coax cable, or copper wire phone line. If the connection is a leased line – a dedicated connection between the business and the ISP – the speeds the customer receives will not be impacted by a neighbour’s usage, because they are not sharing bandwidth capacity. This option gives businesses download and upload speeds that are guaranteed not to fluctuate. However, as you might expect, dedicated internet access is much more expensive.
It should be noted that broadband is difficult to compare across various jurisdictions. While speed tests generally suggest that Canadian communities are behind global jurisdictions in countries like South Korea and Singapore, it is not a result of infrastructure not being adequate enough, but rather national and local policies that might inhibit or enhance an ISP’s capability to offer services. An example might be speed restrictions in a certain area, or electromagnetic indicators that limit the type of infrastructure. To accurately measure how well Peel communities can benchmark against other jurisdictions, the Region would require specialized broadband knowledge – in particular, connections to the existing ISPs in the area, and the policy limits of their infrastructure.
APPENDIX VPEEL 2041 GROWTH MANAGEMENT ROPA - REQUEST TO PROCEED WITH CONSULTATION ONDRAFT AMENDMENT
7.2 - 189
MDB Insight Page 4
2. Broadband Implications
2.1 Broadband is a Key Element to ‘Smart City’ Development While the internet has transformed everything from how people search for a job to how people communicate with friends and family, cities are looking to use digital technology to address stubborn challenges such as reducing poverty, promoting economic development, and making local governments more accessible and efficient. The Intelligent Community Forum (ICF) describes this transformation as the era of “Smart City Development.” At the heart of this transformation lies the core investment that supports its growth – broadband infrastructure. The ICF claims that for a city to be “Smart”, it requires that existing broadband infrastructure be accessible and adoptable by all parties (residents, businesses, and the public sector).
Recent trends worldwide have pointed to the several benefits of accessible and adoptable broadband networks. In many cases, the ICF describes that an accessible and adoptable broadband network can act as a tool in helping cities to attract skilled workers, and enable opportunities for innovation and new competitive edges.3 The ICF goes on to also describe benefits to schools, residents, and research interests, as these parties can access improved tools, access global connections, and improve their community involvement.
Globally, investment in broadband technology, infrastructure, and networks, is leading business opportunities and establishing new jobs. Research has shown that companies which adopt broadband‐based processes can improve employee productivity.4 In Cornwall, UK, four years after the implementation of a broadband development program, the business sector saw an increase of 10% in yearly growth, and an annual increase of 7% in productivity compared to the rest of the United Kingdom.5 Broadband connectivity also opens up possibilities for more advanced hope‐based businesses, replacing the economic need for a traditional workplace.6 Broadband also allows for faster and automated information flow between companies, increasing the specialising of knowledge‐intensive activities. In Europe, this change in the business environment shifts 725,000 jobs annually from traditional economic sectors to business sectors (e.g. IT services, engineering, accounting, and financial services).7
3 Intelligent Community Forum, 2015. What is an Intelligent Community? Retrieved from: http://www.intelligentcommunity.org/what_is_an_intelligent_community 4 MICUS, 2008. Impact of Broadband on Growth and Productivity. Retrieved from: https://www8.gsb.columbia.edu/citi/sites/citi/files/Panel%203.Martin%20Fornefeld%20paper.pdf 5 MICUS, 2008. Impact of Broadband on Growth and Productivity. 6 ERICSSON, 2015. Socioeconomic Effects of Broadband Speed. Retrieved from: https://www.ericsson.com/res/thecompany/docs/corporate‐responsibility/2013/ericsson‐broadband‐final‐071013.pdf 7 ERICSSON, 2015. Socioeconomic Effects of Broadband Speed. Retrieved from: https://www.ericsson.com/res/thecompany/docs/corporate‐responsibility/2013/ericsson‐broadband‐final‐071013.pdf
APPENDIX VPEEL 2041 GROWTH MANAGEMENT ROPA - REQUEST TO PROCEED WITH CONSULTATION ONDRAFT AMENDMENT
7.2 - 190
MDB Insight Page 5
Regarding city investment, the development of municipally‐run broadband networks provides structured business development and job creation opportunities. The City‐owned broadband connection in Chattanooga, Tennessee expanded its business community and established new employment opportunities to its residents through the creation of an innovation corridor with a world‐class smart‐grid internet network.8 In the first ten years of the creation of the network, the city established over 3,600 new jobs. As a result of this investment, a nationally‐renowned call centre relocated its head office to Chattanooga because the network’s maximum connection speeds were higher than the company’s previous headquarters. Further, companies in neighbouring communities have expanded into Chattanooga to take advantage of the network. Businesses in Chattanooga credit the city network with some of the company’s success. The investment in broadband also helped to attract computer engineers, tech entrepreneurs, and investors, and helped to create an environment suitable for venture capital. For example, local entrepreneurs established a venture incubator, Lamp Post, which provides capital and mentorship to start‐ups.9
In Chanute, Kansas, its municipal network provides a 10 Gbps fibre‐optic broadband ring around the municipality, which generates $600,000 per year in leasing contracts with telecom providers that enable the network to be reinvested and upgraded continuously.10 The network has been credited in attracting high‐tech manufacturing firms and retention of large design firms.11
Lebanon, Virginia – following investments in broadband infrastructure through its public‐private utility company (Bristol Virginia Utilities) – has seen its broadband access and affordability greatly improve. The public‐private utility company is responsible for creating and laying the fibre connections alongside other municipal utilities, and contracts out separate output levels to a variety of telecom providers. The result has led to an interesting market dynamism that has providers focused on both higher speed and usage users, and smaller market affordable basic services. The result of the investment helped Lebanon develop a series of high‐tech hubs, where under the same building, different speeds could be prioritised without impacting performance on the overall network.12
In Toronto, broadband connection and investments into internet infrastructure play a critical role in both economic development and job creation. A recent report by Economists Incorporated for Bell Canada pointed to the creation of 3,783 sustained new jobs from the Fibre‐to‐the‐home (FTTH) project in Toronto alone (both direct and spin‐off), and had the potential to generate $3 billion in higher economic outcome for the city.
8 Sturgis, 2015. Why Housing is Key to Chattanooga’s Tech‐Hub Ambitions. Retrieved from: http://www.citylab.com/housing/2015/03/why‐housing‐is‐key‐to‐chattanoogas‐tech‐hub‐ambitions/386776/ 9 Executive Office of the President, Community‐based Broadband Solutions. Retrieved from: https://muninetworks.org/sites/www.muninetworks.org/files/fact‐sheet‐econ‐dev.pdf 10 Community Networks, Community Broadband Creates Jobs. Retrieved from: https://muninetworks.org/sites/www.muninetworks.org/files/fact‐sheet‐econ‐dev.pdf 11 Ibid 12 Ibid
APPENDIX VPEEL 2041 GROWTH MANAGEMENT ROPA - REQUEST TO PROCEED WITH CONSULTATION ONDRAFT AMENDMENT
7.2 - 191

MDB Insight Page 6
In the City of Toronto’s Workforce Development Strategy, some priorities emerged related to connecting residents to jobs, including: the use of public sector developments as employment opportunities; the use of online tools to support job matching; and ensuring that services available to job seekers get the best outcomes for unemployed residents. The report also identifies some priorities related to enhanced business supports, including providing increased support for entrepreneurs, as well as using public sector developments to gain labour market intelligence. Enhanced internet access would benefit entrepreneurs working at home or in weak‐signal areas of the city, and is an opportunity for generating employment and economic growth throughout the city.
The Workforce Development Strategy also speaks about the intrinsically required broadband access to support training and enhanced business support opportunities for residents and businesses. Examples include launching new digital innovation hubs and programs (like Digital Main Street); increasing services related to expanding digital access and literacy; and increasing the number of learning labs in public libraries as highlighted in the TO Prosperity: Toronto Poverty Reduction Strategy and the TO Prosperity 2017 Work Plan. These actions work to provide opportunities for all residents and businesses to gain needed employment and business skills.
2.2 Broadband Responds to the Pressures of the Digital Economy
In 2016, the Information and Communications Technology Council of Canada (ICTC) reported that in the next 3‐5 years, the adoption of smart and connected technologies, such as the IoT, will exponentially reshape all aspects of the economy, including how essential city services are delivered. The 2017 Federal Budget responded to this by proposing new investments that will assist Canadians in accessing digital learning opportunities, improve internet inclusivity, and make home internet access more affordable for low‐income families. Digital skills widen Canadian’s access to a world of possibilities. The 2017 Budget proposes $29.5 million over the next five years for a new Digital Literacy Exchange program. The program will support non‐profit organizations to implement initiatives that teach basic digital skills, including how to use the internet for business, at pre‐existing facilities such as public libraries and employment centres.
According to the Economist Intelligence Unit, Canada is tied for 8th out of 75 countries in terms of internet inclusivity. Canada does particularly well on measures of internet affordability – ranking first overall. Canada is also successful in terms of internet quality and availability, and in terms of having local and relevant internet content. Research has shown that cities that have invested in broadband accessibility and affordability experience numerous social‐economic benefits, with residents reporting improved labour market conditions; businesses reporting increased economic growth; and government services reporting improved access, efficiencies, and enhanced civic participation. Investment in broadband accessibility and affordability allow individuals to search for jobs, submit applications, and communicate to employers online. Investment into broadband connectivity has made medical care and medical information more convenient and more accessible, allowing access to training professionals at lower costs. Increased broadband speed has made access to services possible and efficient, including real‐time information sharing between service providers and users. Broadband connectivity enables access to lower‐cost online education and training opportunities, and enables an inclusive education for people with disabilities, allowing for enhanced support beyond the traditional classroom. Household internet access has also been correlated to better educational performances in children/young adults.
APPENDIX VPEEL 2041 GROWTH MANAGEMENT ROPA - REQUEST TO PROCEED WITH CONSULTATION ONDRAFT AMENDMENT
7.2 - 192
MDB Insight Page 7
2.3 Broadband is a Standard Requirement for Growing Businesses
From an economic development and business development perspective, broadband is increasingly less an attraction factor and more a standard of site selection. Broadband is a key enabler of businesses to generate and use their intellectual property; without it, modern businesses are not able to function and will only locate where this access is available. Internet access is not enough – competitive speeds, and access to services like AWS (Amazon Web Services), locally hosted data centre providers, and carrier redundancy, are becoming the standard in business practice.
As the digital economy advances, broadband has become a ‘utility’ – it is essential to economic growth, job creation, public service delivery, and knowledge and innovation transfers.13 Investing in broadband generates economies of scale, and is important to innovation and productivity in both primary and advanced industries. A background paper for the World Development Report 2016 Digital Dividends estimated that a 10% increase in fixed broadband penetration would increase GDP growth by 1.2% in developed economies and 1.38% in developing ones.14 Broadband has the potential to improve labour efficiency, contribute towards job creation, and increase the number of businesses. For example, in comparing the economic growth between counties in the State of Florida, it was determined that Lake County experienced greater economic growth relative to comparable Florida counties since making its municipal fibre optic network available to businesses and municipal institutions in the county.15 In another example, the Sacramento Regional Research Institute for AT&T measured broadband use from 2001 to 2006 in 39 California counties and determined that broadband deployment contributed towards employment and total payroll growth, but not to an increased number of physical business establishments.16 In both instances, improved broadband availability contributed to employment growth in most industries to some degree.
The impact of broadband on businesses cannot be accurately quantified, as various other factors that include employment and population play a role in economic growth. However, it can either decrease unemployment by improving the efficiency of the labour market, or increase unemployment by varying the demand for particular labour skills.17 Furthermore, it is estimated that a critical amount of broadband infrastructure may be needed to increase employment, but once a community is completely built out, additional broadband infrastructure will not (cannot) further affect employment growth.18
13 www.intelligentcommunity.org/broadband_utility_resolution Dumitrescu, G. C. (2014). The New World of Information and Communication Technologies: Global and Regional Trends. Knowledge Horizons. Economics, 6(4), 17. 14 http://pubdocs.worldbank.org/en/391452529895999/WDR16‐BP‐Exploring‐the‐Relationship‐between‐Broadband‐and‐Economic‐Growth‐Minges.pdf 15 Ford, G. S., & Koutsky, T. M. (2005). Broadband and economic development: A municipal case study from Florida. Review of urban & regional development studies, 17(3), 216‐229. 16 Van Gaasbeck, K., Perez, S., Sharp, R., Schaubmayer, H., Owens, A., & Cox, L. (2007). Economic Effects of Increased Broadband Usage in California. Summary Report. Sacramento Regional Research Institute. 17 Holt, L., & Jamison, M. (2009). Broadband and contributions to economic growth: Lessons from the US experience. Telecommunications Policy, 33(10), 575‐581. 18 Shideler, D., & Badasyan, N. (2007). The economic impact of broadband deployment in Kentucky.
APPENDIX VPEEL 2041 GROWTH MANAGEMENT ROPA - REQUEST TO PROCEED WITH CONSULTATION ONDRAFT AMENDMENT
7.2 - 193
MDB Insight Page 8
Changing labour dynamics, decreasing office space, national and international collaborations, and increasing trends of remote work, have also resulted in the need for faster internet services for businesses. An example would be the technology Voice over Internet Protocol (VoIP), which requires access to high‐bandwidth internet, and can realise significant savings.19
2.4 Broadband and Economic Development The availability of ultra‐high‐speed connectivity is increasingly being used to promote economic development in communities. Opportunities that some communities have embraced include:
Business Incubators – Developing research and business incubators supporting researching andcommercialization of new technologies and processes.
High‐Tech Business Parks – Developing new business parks with state‐of‐the‐art connectivity madeavailable to companies.
Community Test Labs – Using their high‐speed networks, municipalities are enticing high‐techbusinesses to invest in their communities by offering a place to test new technologies and services.
Also, the changing nature of work as a result of technology is having an impact on connectivity. Some of the trends in applications include:
Telework and Work‐At‐Home – Knowledge‐based companies and offices are accelerating theirtelework programs to enhance recruitment and retention by improving work‐life balance, and insome cases, to decrease real estate costs; teleworkers access voice, video, and data services overthe network, all of which increase traffic.
Pervasive Video – There is increasing use of video for collaboration, communication, training, clientinteraction, security management, and entertainment, within the private sector.
‘Big Data’ – Companies throughout the world are accessing increasingly large image files andunstructured ‘big data’ for analysis and market development, requiring increasingly large speed andcapacity of connectivity.
Network – Web‐based applications and backups, including cloud services, are moving functionalityfrom the desktop to the network; this is a great benefit to businesses as they gain capacity andflexibility, and reduced requirements for IT support for locally‐hosted applications.
2.5 Broadband in Agricultural Lands The rise of ‘precision agriculture’, combined with increasing interest in the use of ‘telematics’ and ‘big data’ for agriculture, raises the question of how available broadband connectivity is for rural agricultural lands. The 2016 Census of Agriculture indicates that 43% of all Canadian farms have begun to use technology as part of day‐to‐day operations. However, a significant number of those connections were via technologies that may not be adequate when it comes to accessing and delivering the large quantities of data that are associated with some precision agriculture processes.
19 https://www.ontario.ca/page/how‐business‐can‐use‐internet‐technology‐voice‐communications#section‐3
APPENDIX VPEEL 2041 GROWTH MANAGEMENT ROPA - REQUEST TO PROCEED WITH CONSULTATION ONDRAFT AMENDMENT
7.2 - 194

MDB Insight Page 9
Farm businesses have made increasingly more frequent use of internet services. Over the last decade, farmers went from having to deliberately acquire internet connectivity, to now essentially every farmer with a cellular phone having internet connectivity. Early on, farmers used the internet to participate in discussion forums and shop for equipment parts, while today a farmer’s use of the internet is ubiquitous. Nearly every farmer with a smartphone uses it to check weather conditions and commodity prices in near‐real‐time.
Over the last few years, telematics has become the quintessential example of how farmers make use of the internet for precision agriculture. It allows farmers to remotely monitor their equipment and the farm workers operating the equipment; upload variable rate prescriptions to applicators; and gather real‐time equipment diagnostics and site‐specific sensor data.
Historically, farmers managed their crops at the field level, applying nutrients at a constant rate, and analyzing data from the entire field – even though they knew that not all portions of the field would perform the same. The advent of precision agriculture has shifted this paradigm, and allowed for crop management at a much finer level of detail. Simply defined, precision agriculture is the application of information technology to farm‐level production operations and management decision making. The focus of this technology has evolved: from mapping site‐specific soil properties, to geo‐referenced yield monitors, to variable rate applications, to automated guidance and, finally, to the more recent emphasis on ‘big data.’ The concept of precision agriculture has always been about data – particularly, site‐specific decision making based on that data. As the technologies and data requirements associated with precision agriculture continue to grow, it will be vital to understanding the demands being placed on the local broadband network.
APPENDIX VPEEL 2041 GROWTH MANAGEMENT ROPA - REQUEST TO PROCEED WITH CONSULTATION ONDRAFT AMENDMENT
7.2 - 195

MDB Insight Page 10
3. Broadband Work Undertaken in Canada3.1 Work Undertaken in Peel Region 3.1.1 Public Sector Network
In June 1999, a partnership to develop a fibre optic network (known as the Public Sector Network – PSN) between the Region of Peel, the City of Brampton, the City of Mississauga, and the Town of Caledon, was formed. The key principle of the partnership is that each partner is responsible for construction of the fibre optic network within its municipal boundaries. However, spare fibre would be made available for use by the other member partners.
The partnership has invested more than $17 million in construction of the PSN, and it now consists of over 690 kilometres of fibre connecting over 580 partner and subscriber facilities across the Region. The PSN has become a subscription‐driven asset that can be leveraged within Peel Region to provide facilities direct broadband access beyond the need of an ISP.
PSN has been able to bring administrative efficiency within the Region, and has provided the ability to share data amongst the partners and subscribers at a minimal cost. It has been able to cultivate a program within a Region where various municipal and public sector partners have a shared vision of a fibre optic network, and invest financially to support this build through contributions from their respective budgets.
The cities of Mississauga and Brampton have increasingly been using broadband to improve service delivery and infrastructure. Use of the PSN network has led to the advancement of traffic management, field mobility, and IoT operations. In Mississauga, the network is deploying over 800 wireless access points that are enabling the connection of sensors, traffic intersections, buses, fire trucks, and the office mobile workforce and fieldwork force. Access to the network has also allowed for the development and use of IoT technologies such as smart streetlights and smart waterways. In Brampton, the PSN is factoring into the decisions around communications infrastructure as it relates to the advancement of the health sciences, advanced manufacturing, and research sectors.
Post‐secondary institutions such as, Sheridan College’s Hazel McCallion Campus are looking to expand on the PSN and become a build ultra‐high speed secure private networks (i.e. not connected to the public internet) that seek to link companies and services.
In Caledon, the PSN is being furthered levied by the special tax levy for broadband. The special levy aims to generate $300,000 per year, which results in a high‐speed internet investment of $1,200,000 to $1,500,000 over 4 and 5 years, respectively. The plan is that these funds will be invested into the Southwestern Integrated Fibre Technology (SWIFT) network project, and the investment will translate into an approximate $22,500,000 fibre infrastructure buildout in Caledon with Federal, Provincial, and private sector contributions also factored in.
APPENDIX VPEEL 2041 GROWTH MANAGEMENT ROPA - REQUEST TO PROCEED WITH CONSULTATION ONDRAFT AMENDMENT
7.2 - 196

MDB Insight Page 11
3.2 Other GTA Regional Governments 3.2.1 York Region
York Region’s Economic Development Action Plan highlighted the need for improved broadband connectivity to keep pace with the needs of businesses, the public sector, and residents. Approved by Regional Council in December 2012, the York Region Economic Development Action Plan has as a Transformational goal: “Provide Connectivity Infrastructure to Support Innovation.” Through extensive consultation, facilitating investments in broadband infrastructure was identified as critical to supporting existing business growth, to attract and expand research functions, and attract and retain a knowledge‐based workforce within York Region. The Economic Development Action Plan called for an assessment of bandwidth capabilities across the Region, and development of a strategy for improving connectivity.
A consulting firm was retained to undertake the Broadband Strategy work. The process involved consultation with an array of public and private sector stakeholders, including telecommunications companies with an interest in serving residents (such as Bell, Rogers, Cogeco, Terago and others), and businesses from York Region’s employment areas. Public agencies within York Region, such as hospitals, education institutions, and local municipalities, were also engaged, as they also play a critical role in helping develop and promote innovation. The development of the Strategy included some actions, such as a:
Gap Analysis – An analysis of the current service areas within York Region.
Community Needs Analysis – Engagement of public and private sector stakeholders to identify theirconnectivity infrastructure and application needs.
Telecommunication Provider Consultation – Engagement of private telecommunications companiesto discuss their coverage areas, and opportunities for investment.
Technology Infrastructure – Identification of target connectivity speeds and technologies for YorkRegion.
Road Map – Development of a range of actions for improving connectivity within York Region.
The study found that in relation to other municipalities in Ontario, broadband internet connectivity speeds in some locations within York Region are very good. However, while there is connectivity in all parts of York Region, it is not always available at the speed and price point that makes York Region competitive with other jurisdictions. The challenge is not access to high‐speed connectivity itself, but access to high‐speed connectivity that is robust and cost‐effective across all parts of York Region to support innovation and maintain competitiveness.
The Gap Analysis and Community Needs Analysis identified various connectivity challenges both in urban and rural areas. Different locations present specific challenges that require improved connectivity if they are going to assist York Region in competing for business growth, and fostering an educated and creative labour force. Three areas, in particular, have been identified as being important to future regional economic vitality:
1. York Region’s Centres and Corridors will compete with Waterfront Toronto and other global centresfor office employment and knowledge workers. Whereas these centres provide ultra‐high‐speedconnectivity infrastructure, York Region’s Centres and Corridors do not, putting them at acompetitive disadvantage.
APPENDIX VPEEL 2041 GROWTH MANAGEMENT ROPA - REQUEST TO PROCEED WITH CONSULTATION ONDRAFT AMENDMENT
7.2 - 197

MDB Insight Page 12
2. York Region’s employment areas offer another challenge for connectivity: while most employmentareas are located in urban settings, private sector telecommunications companies are focused onthe residential market, with service to employment areas taking a secondary role. This meanssmaller businesses within these business parks cannot get access to wired fibre optic solutionswithout significant investments, leaving them to rely on expensive wireless solutions.
3. In York Region’s rural communities, businesses face high costs for connectivity that puts them at adisadvantage in relation to urban peers, as cost limits them in their ability to access business,research, and education resources. This leaves entrepreneurs and home‐based businesses in thesecommunities at a competitive disadvantage, and workers in rural communities specifically at adisadvantage when it comes to accessing education opportunities online.
To address the challenges identified in the Gap Analysis, the following objectives were set as part of the York Region Broadband Strategy to help establish appropriate actions:
Encourage investments that will provide higher connectivity speeds and lower price points acrossYork Region – this objective is key to increasing York Region’s competitiveness.
Create an environment that facilitates open, competitive, and innovative services and applications –this objective aims to promote the use of broadband infrastructure in delivering services, promotingcollaboration, and encouraging economic development.
Maximise the efficient investment of both public and private sector funding to improve connectivitythroughout York Region – this objective focuses on ensuring public sector investments do notduplicate efforts of the private sector to provide connectivity.
To attain these objectives, the York Region Broadband Strategy identifies improved connectivity targets based on its land uses. The targets include the speed and technology requirements for the mid‐term (five years) and long‐term (10 years). The targets are the ideal and are not meant to set the expectation that York Region or its local municipalities are going to invest in providing connectivity to the target speeds if the private sector does not realize those targets across all parts of the Region. Rather, it helps frame the type of infrastructure investment necessary to achieve competitive connectivity in locations such as Centres and Corridors, employment lands, and in rural communities.
The study also identifies the role that municipalities within York Region can play. Predominantly, municipalities can play a big role in making it easier for telecommunications companies to make investments in connectivity. By leveraging planning processes and infrastructure investments, connectivity can be integrated alongside municipal initiatives. Examples stated include:
Harmonize Municipal Access Agreements – Harmonize the process for accessing municipal right‐of‐ways to support fibre investments.
Wireless Tower Master Plan – Develop a wireless tower master plan focused on increasing wirelessconnectivity and coordinating private and public sector tower investment.
Development Approval Process – Work with local municipalities to include connectivityconsiderations within the development approval process
Include Fibre Conduit in Regional Infrastructure Projects – Develop a policy and business case forincluding installation of fibre conduit as part of applicable and appropriate Regional infrastructureprojects, such as road (re)construction and water/wastewater projects.
APPENDIX VPEEL 2041 GROWTH MANAGEMENT ROPA - REQUEST TO PROCEED WITH CONSULTATION ONDRAFT AMENDMENT
7.2 - 198
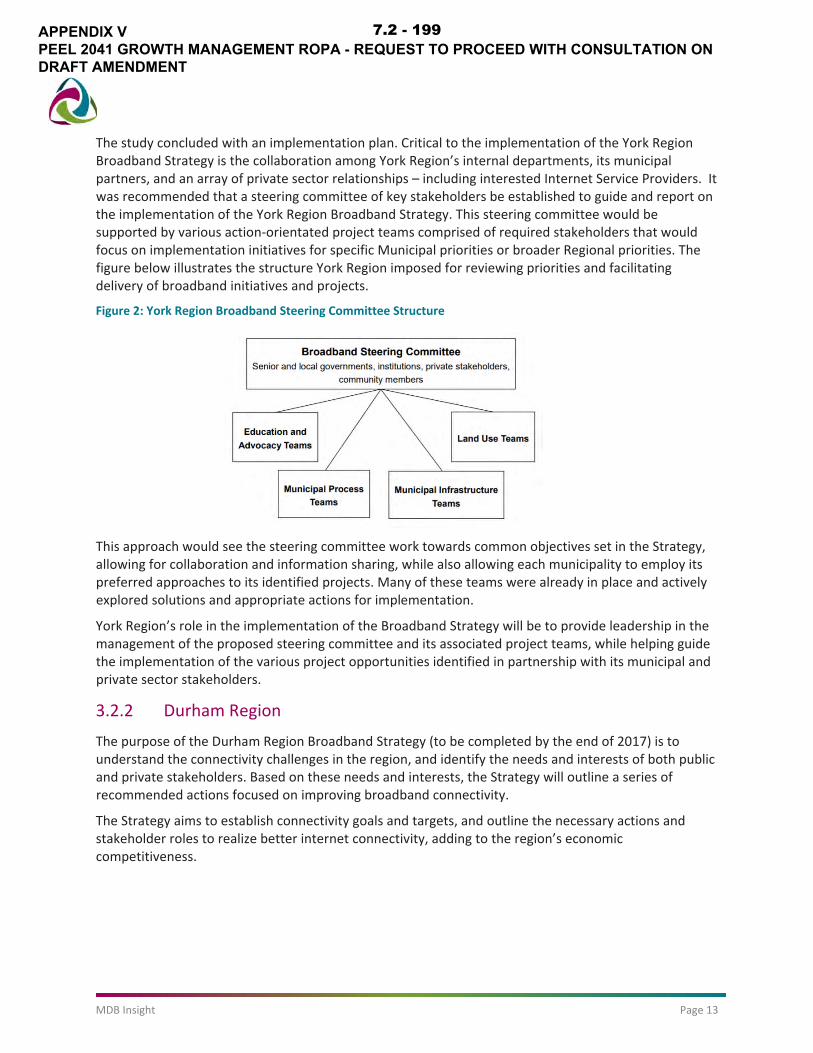
MDB Insight Page 13
The study concluded with an implementation plan. Critical to the implementation of the York Region Broadband Strategy is the collaboration among York Region’s internal departments, its municipal partners, and an array of private sector relationships – including interested Internet Service Providers. It was recommended that a steering committee of key stakeholders be established to guide and report on the implementation of the York Region Broadband Strategy. This steering committee would be supported by various action‐orientated project teams comprised of required stakeholders that would focus on implementation initiatives for specific Municipal priorities or broader Regional priorities. The figure below illustrates the structure York Region imposed for reviewing priorities and facilitating delivery of broadband initiatives and projects.
Figure 2: York Region Broadband Steering Committee Structure
This approach would see the steering committee work towards common objectives set in the Strategy, allowing for collaboration and information sharing, while also allowing each municipality to employ its preferred approaches to its identified projects. Many of these teams were already in place and actively explored solutions and appropriate actions for implementation.
York Region’s role in the implementation of the Broadband Strategy will be to provide leadership in the management of the proposed steering committee and its associated project teams, while helping guide the implementation of the various project opportunities identified in partnership with its municipal and private sector stakeholders.
3.2.2 Durham Region
The purpose of the Durham Region Broadband Strategy (to be completed by the end of 2017) is to understand the connectivity challenges in the region, and identify the needs and interests of both public and private stakeholders. Based on these needs and interests, the Strategy will outline a series of recommended actions focused on improving broadband connectivity.
The Strategy aims to establish connectivity goals and targets, and outline the necessary actions and stakeholder roles to realize better internet connectivity, adding to the region’s economic competitiveness.
APPENDIX VPEEL 2041 GROWTH MANAGEMENT ROPA - REQUEST TO PROCEED WITH CONSULTATION ONDRAFT AMENDMENT
7.2 - 199

MDB Insight Page 14
Specific objectives of the project are as follows:
Identify the broadband needs to ensure there is cost‐competitive and equitable connectivitythroughout the Region.
Identify the broadband infrastructure required to ensure local businesses, students, and residents,can remain competitive and grow in an increasingly connected world.
Identify the types of projects that are of interest to both the private and public sector. This shouldinclude justification for investments in broadband infrastructure that improves service delivery andenhances the Region’s economic competitiveness.
Foster a culture of collaboration, partnerships, and cooperation among Regional, Area Municipal,and private sector broadband initiatives.
Identify current trends and future scenarios of connectivity to ensure the Region is future‐focused.
Develop a business model that emphasises a collaborative approach to encouraging private andpublic investments into increased connectivity.
Consolidate the necessary information and data to ensure that the Region and Area Municipalitiescan be ‘application ready’ for future funding opportunities under the Government of Canada’sConnect to Innovate (or similar Federal or Provincial) funding program.
An analysis of how broadband connectivity can assist Durham Region and Area Municipalities inbecoming an ‘Intelligent/Smart Community’, and the related benefits and economic impacts of thisdesignation.
An implementation plan that provides Durham Region and its Area Municipal partners with thenecessary actions to move forward with the implementation of the Broadband Strategy.
3.3 Multi‐Government Networks 3.3.1 Southwestern Integrated Fibre Technology Network
The Southwestern Integrated Fibre Technology (SWIFT) network is a long‐term plan to help the region compete, connect, and keep pace in a changing digital world. Notably, the Town of Caledon is a member of the network. The foundation of the network design is built upon an 80 Channel, 100 Gbps fibre optic transport network inter‐connecting all major centres in Southwestern Ontario. This transport network would be connected to the 40 Gbps aggregation points in each county. Each access aggregation point would then be connected to 10 Gbps access nodes in various cities, towns, villages, and hamlets across the region. The largest deterrent for Internet Service Providers investing into rural communities has been infrastructure limitations. In larger urban centres, Internet Service Providers can connect to ‘Points of Presence’ (POPs – cell towers, wireless fields) at a much cheaper rate as there are several POPs in denser areas. In rural centres, POPs are less frequent and as such, more expensive to connect into. The SWIFT network aims to build about 350 POPs across Southwestern Ontario, including into areas with population densities as low as four people per square kilometre. This will make it easier, faster, and cheaper, for Internet Service Providers to connect customers to high‐speed internet.
APPENDIX VPEEL 2041 GROWTH MANAGEMENT ROPA - REQUEST TO PROCEED WITH CONSULTATION ONDRAFT AMENDMENT
7.2 - 200
MDB Insight Page 15
The SWIFT network anticipates that it will be able to bring fibre connections closer to businesses and consumers beginning in 2018. Its priority will be to connect fibre to public sector organizations and larger businesses because these large users will help SWIFT achieve the critical mass it needs to expand services more broadly. Municipalities who participate in the SWIFT network program will be guaranteed to receive POPs in its communities, and will have the opportunity to direct where those POPs are located. The SWIFT Network aims to emulate the success of its Eastern Ontario counterpart EORN.
3.3.2 Eastern Ontario Regional Network
Since it was established by the Eastern Ontario Wardens’ Caucus (EOWC) five years ago, the Eastern Ontario Regional Network (EORN) has substantially increased broadband access across rural Eastern Ontario by working in partnership with all levels of government and the private sector.
The result of the network has been the complete build‐out of an extensive high‐capacity fibre optic backhaul network across the region. This backbone connects to nearly two dozen local access networks that provide wired or fixed wireless broadband access to about 90% of the homes and businesses in Eastern Ontario. EORN supplemented this network by negotiating improved satellite packages to reach those parts of the region that it could not otherwise connect. It also built fibre services to more than 60 business parks and core business areas across the region.
With the completion of the network infrastructure, EORN is shifting gears to ensure the region reaps the benefits of this important investment. To create a digitally connected region, Eastern Ontario needs not just broadband access, but also the skills and capacity to use technology effectively. The Digital Strategy offers a road map for the region to embrace the economic and social benefits of internet‐based tools to create strong, successful communities.
The Strategy is based on the latest research and understanding of the digital economy, as well as EORN’s own local experience and success in building rural broadband services. Through the first phase of the project, EORN built trust and credibility by developing solutions that were based on sound data analysis and evidence. It cultivated good relationships with partners through open lines of communication, and the flexibility to meet and balance different stakeholder needs. EORN will continue to seek out strategic partnerships with organizations that share its goals and priorities. This will involve working with local and national businesses, economic development groups, non‐profit groups, and those who deliver public services. EORN will also continue to seek out federal and provincial funding opportunities to provide support.
Three goals align the strategy:
1. Increase User Uptake – Working with private and public sector partners, EORN will promote theadoption of digital technology across Eastern Ontario. Citizens, businesses, and public institutions,will be encouraged and supported in the adoption of high‐speed internet service and digitaltechnology.
2. Improve Broadband Access – Driven by the perpetual demand for higher speed and more capacity,EORN will leverage the existing broadband network in Eastern Ontario to expand and enhance fixedand mobile broadband access throughout the region.
3. Demonstrate Technology Leadership – EORN will investigate, develop and promote the adoption ofnew technologies that support wealth creation, job growth, and educational opportunities.
APPENDIX VPEEL 2041 GROWTH MANAGEMENT ROPA - REQUEST TO PROCEED WITH CONSULTATION ONDRAFT AMENDMENT
7.2 - 201

MDB Insight Page 16
EORN will achieve its goals by focusing on four key areas:
1. Regional Economic Development – EORN will work with Eastern Ontario businesses, not‐for‐profitorganizations, and public institutions, to develop innovative ways to use the new broadbandnetwork as a springboard for increased wealth and job creation. In particular, EORN will focus onways to connect businesses to in‐region and out‐of‐region markets, secure increased sales andbusiness revenues, and increase efficiency. EORN will also work on strengthening access to qualitylabour market intelligence to address the needs of businesses and individuals. This will fostereconomic growth in the form of improved regional GDP and productivity, better jobs, and higherpersonal incomes. Those benefits will help to build a stronger residential and commercial propertytax base that supports more sustainable communities.
2. Municipal Services – EORN will help Eastern Ontario municipalities use internet‐based applicationsto improve service levels, better manage the costs of delivering vital public services, and engagecitizens in local government. The Strategy identifies opportunities such as training, shared services,and new application development, that would support these goals and create more responsive localgovernments with improved citizen satisfaction.
3. Broadband Education – Individuals with new access to broadband may not realize the many ways inwhich it can be used to improve their social interactions and prepare them for our changing world –both globally and locally. Through education and training programs, EORN will help EasternOntarians learn how to use the new regional broadband network, and will pursue networkapplications to reduce social isolation, improve education and skills, and improvepersonal/household prosperity. This delivers direct benefits through reduced spending on socialprograms, as well as indirect benefits in the form of higher employment levels, stronger householdincomes, and a stronger property tax base.
4. Broadband Infrastructure (Fixed & Mobile) – EORN has successfully built a $170‐million fixedbroadband network that meets the speed and capacity demands of Eastern Ontarians today, withthe capacity to grow in the future. However, there is still work to be done to ensure that the currentinfrastructure is fully scaled and expanded upon to meet the needs of citizens in 2024. This includesbuilding off the current network to increased mobile access in the future.
APPENDIX VPEEL 2041 GROWTH MANAGEMENT ROPA - REQUEST TO PROCEED WITH CONSULTATION ONDRAFT AMENDMENT
7.2 - 202
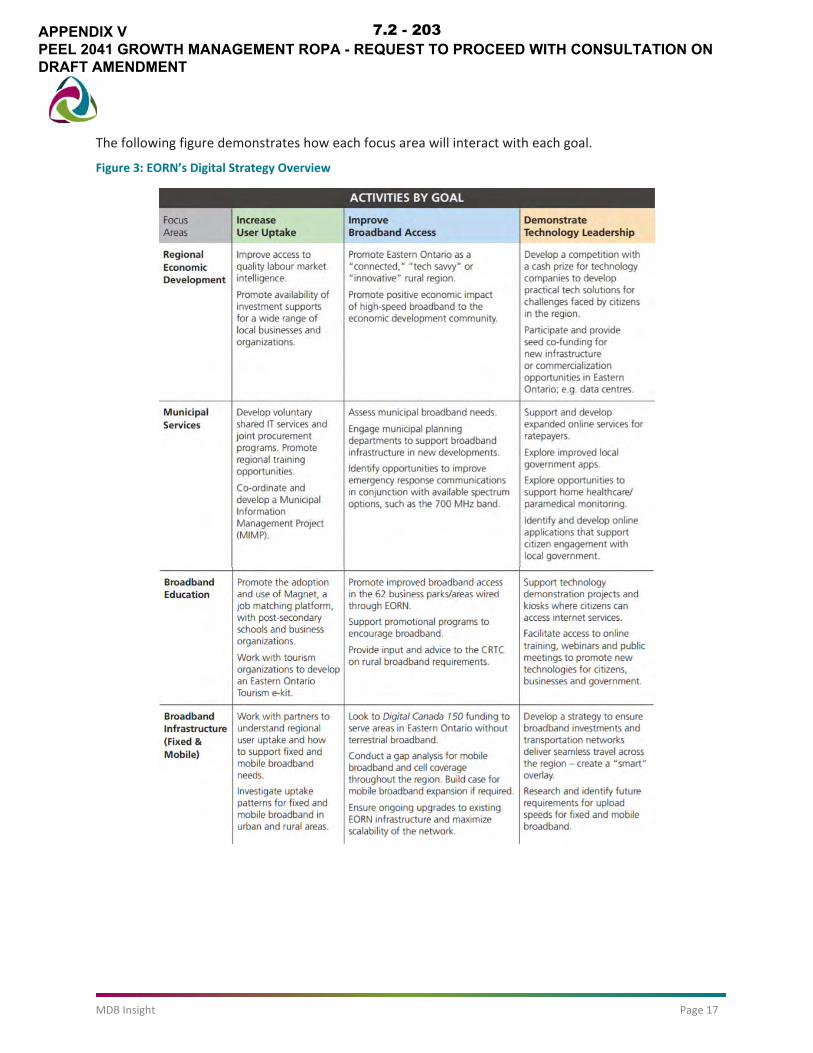
MDB Insight Page 17
The following figure demonstrates how each focus area will interact with each goal.
Figure 3: EORN’s Digital Strategy Overview
APPENDIX VPEEL 2041 GROWTH MANAGEMENT ROPA - REQUEST TO PROCEED WITH CONSULTATION ONDRAFT AMENDMENT
7.2 - 203
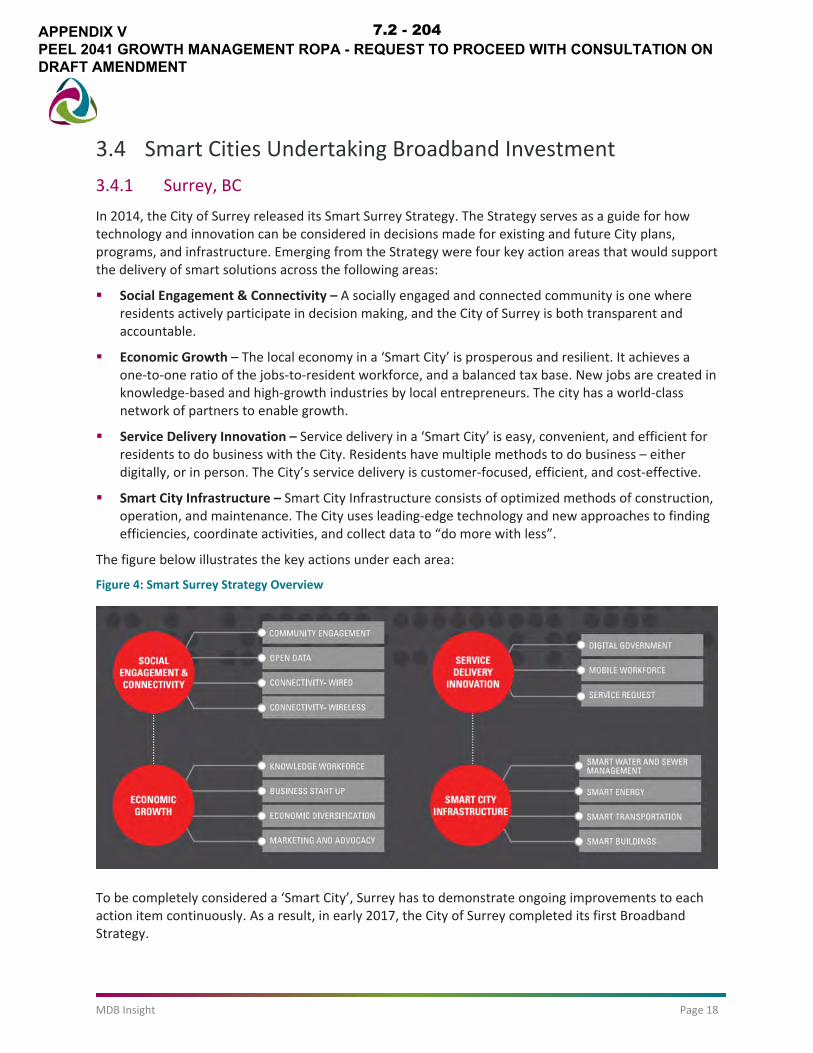
MDB Insight Page 18
3.4 Smart Cities Undertaking Broadband Investment 3.4.1 Surrey, BC
In 2014, the City of Surrey released its Smart Surrey Strategy. The Strategy serves as a guide for how technology and innovation can be considered in decisions made for existing and future City plans, programs, and infrastructure. Emerging from the Strategy were four key action areas that would support the delivery of smart solutions across the following areas:
Social Engagement & Connectivity – A socially engaged and connected community is one whereresidents actively participate in decision making, and the City of Surrey is both transparent andaccountable.
Economic Growth – The local economy in a ‘Smart City’ is prosperous and resilient. It achieves aone‐to‐one ratio of the jobs‐to‐resident workforce, and a balanced tax base. New jobs are created inknowledge‐based and high‐growth industries by local entrepreneurs. The city has a world‐classnetwork of partners to enable growth.
Service Delivery Innovation – Service delivery in a ‘Smart City’ is easy, convenient, and efficient forresidents to do business with the City. Residents have multiple methods to do business – eitherdigitally, or in person. The City’s service delivery is customer‐focused, efficient, and cost‐effective.
Smart City Infrastructure – Smart City Infrastructure consists of optimized methods of construction,operation, and maintenance. The City uses leading‐edge technology and new approaches to findingefficiencies, coordinate activities, and collect data to “do more with less”.
The figure below illustrates the key actions under each area:
Figure 4: Smart Surrey Strategy Overview
To be completely considered a ‘Smart City’, Surrey has to demonstrate ongoing improvements to each action item continuously. As a result, in early 2017, the City of Surrey completed its first Broadband Strategy.
APPENDIX VPEEL 2041 GROWTH MANAGEMENT ROPA - REQUEST TO PROCEED WITH CONSULTATION ONDRAFT AMENDMENT
7.2 - 204

MDB Insight Page 19
The Broadband Strategy is driven by a vision to introduce a world‐class connected city with widespread, affordable, reliable, scalable, high‐speed broadband access, which enhances economic prosperity and supports a high quality of life.
The Strategy highlighted that there are two approaches to building a world‐class connected city. The first is to partner with the private sector, and the second approach is to place the city's fibre conduit in strategic locations, which has already begun by generating conditions whereby residents and businesses have access to affordable services and have a choice. This approach will attract Internet Service Providers to invest in Surrey, which is already evident with Novus and Urbanfibre making plans to use the city's infrastructure in City Centre.
In addition to the build‐out approaches, there are six other objectives that make up the Strategy. Within each area, there are a collection of strategic initiatives that help support the overall vision, ranging from a “dig once” approach, to advancing public Wi‐Fi, to ensuring that fibre infrastructure is included in the City's asset management programs among roads, water, sewer and District Energy programs. The Strategy has many expected outcomes, several of which are well underway.
APPENDIX VPEEL 2041 GROWTH MANAGEMENT ROPA - REQUEST TO PROCEED WITH CONSULTATION ONDRAFT AMENDMENT
7.2 - 205
MDB Insight Page 20
4. Considerations for Peel RegionWhen considering next steps for broadband investment in Peel Region, and in particular, in its employment lands, the Region should consider undertaking the following activities:
1. Completion of a robust gap analysis that identifies existing broadband services and connectivitywithin Peel Region, including access, speed, and prices, to better understand the market, and thevarious gaps in service delivery within the Region.
2. Completion of a needs analysis that identifies the needs and interests of a range of public andprivate sector stakeholders, as well as the current challenges and obstacles in obtaining increasedconnectivity. This task will assist in identifying a standard of service towards which the region canstrive for.
3. Completion of a detailed baseline data and background information set, to ensure the Region andArea Municipalities can be ready for any future funding opportunities under the Government ofCanada’s Connect to Innovate funding program. This task should also aim to answer any financialexpenditure expected with broadband investment.
4. Completion of an assessment of the appropriate role and scope that the Region and AreaMunicipalities should provide in enhancing and delivering broadband service within theirjurisdiction, including partnerships and collaboration with private sector enterprises. This mayinclude changes to municipal processes and procedures, or improvements to the Public SectorNetwork (PSN). This task will assist in identifying any policy or program changes required to improvebroadband accessibility and affordability in the Region. This can also include leveraging the PSN toconnect employment lands and commercial corridors.
5. Consideration of technology options and approaches to servicing the needs highlighted throughconsultation, including potential costs. This could include the investigation of introducing public Wi‐Fi across business parks, corridors, and centres.
6. Completion of a ‘Smart Peel Strategy’ that illustrates and leverages existing initiatives on howbroadband connectivity can assist the Region and Area Municipalities in becoming an‘Intelligent/Smart Community’, and the related benefits and economic impacts of this designation.
APPENDIX VPEEL 2041 GROWTH MANAGEMENT ROPA - REQUEST TO PROCEED WITH CONSULTATION ONDRAFT AMENDMENT
7.2 - 206

MDB Insight Page 21
5. ResourcesEastern Ontario Regional Network Digital Strategy https://www.eorn.ca/en/resources/Digital_Strategy/EORN_Digital_Strategy_2015‐2024.pdf
SWIFT Network Feasibility Study
http://swiftnetwork.ca/WOWC02‐Regional_Broadband_Feasibility_Study_07‐12‐13_REDACTED.pdf
York Region Broadband Strategy
http://www.yorklink.ca/wp‐content/uploads/2014/05/york‐region‐broadband‐strategy‐may‐2014.pdf
Smart Surrey Strategy
http://www.surrey.ca/files/Smart_Surrey_Strategy_‐_March_2015_WEB.pdf
Smart Surrey Broadband Strategy
http://www.surrey.ca/files/(16329)%20Broadband%20Strategy%20WEB.pdf
Innovations in Farm Families and Rural Communities: Capacity Development for Broadband Use in Southern Ontario
http://swiftnetwork.ca/Rural_Broadband‐final_paper.pdf
APPENDIX VPEEL 2041 GROWTH MANAGEMENT ROPA - REQUEST TO PROCEED WITH CONSULTATION ONDRAFT AMENDMENT
7.2 - 207