Meeting 4 Electron Spect Auger
39
Electron Spectroscopy: Electron Spectroscopy: Auger Electron Auger Electron Spectroscopy Spectroscopy by Didik Setiyo W. by Didik Setiyo W.
description
AES
Transcript of Meeting 4 Electron Spect Auger

Electron Spectroscopy:Electron Spectroscopy: Auger Electron Auger Electron
SpectroscopySpectroscopy
by Didik Setiyo W.by Didik Setiyo W.

IntroductionIntroduction
Electron spect. Is a powerful method forIdentification of all elements with
exception of H and HeDetermination of elemental oxidation
state and type of species bonded to itLearn the electron structure of
moleculesMost important: determination of
surface chemistry of a solid (metal, alloy, semiconductor, heterogeneous catalyst)

ApplicationsApplications
Electron Spectroscopy has been successfully applied to
GasSolidSolutionLiquid
Because of poor penetrating power of electrons, these method provide information that is restricted largely to a surface layer that is a few particles thick (20 to 50 Å)

PrinciplesPrinciplesName Method of producing
electrons from the analyte
X-Ray photoelectron spect.(XPS or ESCA)
Exposure to monochromatic X-rays
Ultraviolet Photoelectron Spect. (UPS or PES)
Exposure to monochromatic, vacuum-ultraviolet radiation
Auger Spectroscopy(AES)
Bombardment with electrons or exposure to X-ray
And others (INS, EIP, PIS)

Principles Principles (…………………..continued )(…………………..continued )
e—
Eb
E’’b
E’b
Ev
E’’vE’v
Ek = h - Eb
X-rays,h
XPS or ESCA
Ek = h - Ev
UV,h e—
UPS

Principles Principles (………………………………………………………………….continued )(………………………………………………………………….continued )
eA—
Eb
E’’b
E’b
Ev
E’’vE’v
Ek = Eb - 2E’b
Vacant orbitalAES (low atomic number)
hf = Eb – E’b
XFS (high A.N.)


The Auger ProcessThe Auger Process
Comparing with other spect. Comparing with other spect. methodsmethods
In the electron spectroscopy:
Kinetic energy of emitted electron is recorded
Spectrum is a plot of number of electron emitted (power of electron beam) as a function of energy (frequency or wavelength) of electron emitted
AUGER SPECTROSCOPYAUGER SPECTROSCOPYby Pierre V. Auger in the 1920sby Pierre V. Auger in the 1920s
The method includes two-step process
Process involves formation of electronically exited ion, A+ * by exposing the analyte to a beam of X-ray or high energy electron
Relaxation processThe Auger effect is a process where an atom that has been ionized with the emission of a core level electron undergoes a transition in which a second electron, the Auger electron, is emitted.
Auger electron spectroscopy, AES, is a surface analytical technique that utilizes the Auger effect to measure the elemental composition of surfaces

Formation of Exited IonFormation of Exited Ionwith X-rays:
A + h A+* + e- with electron:
A + e-i A+* + e-’
i + e- where
e-i is an incident light
e-’i is an incident light after interacting
with A
e- electron ejected from one of the inner orbital of A

Relaxation ProcessRelaxation Process
Relaxation process
A+* A++ + e-A
or,A+* A+ + hf
Auger electron
A fluorescent photon
Corresponding method:
X-Ray Fluorescence Spectroscopy

Corresponding methodCorresponding method
In line with releasing auger electron, this is a radiation less process
Energy given up in relaxation results in the ejection of an electron, e-
A with kinetic energy of Ek Ek do not depend on photon energy or electron to form vacant orbital formerly at Eb Ek is the difference between energy released in relaxation process and the energy required to remove a second electron from its orbits (Eb’)

Corresponding methodCorresponding method
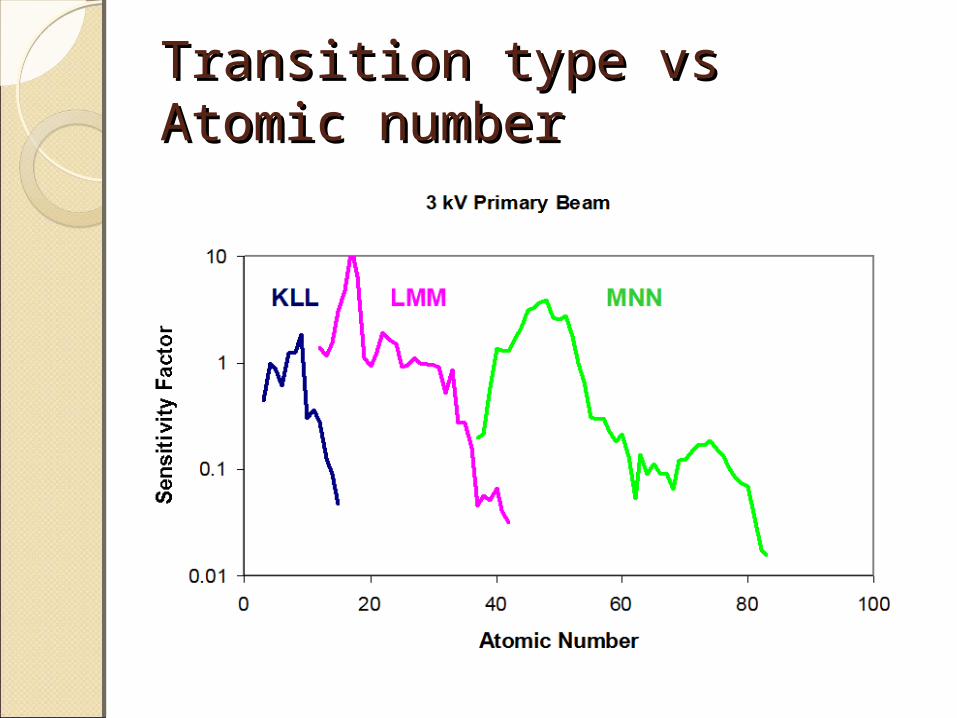
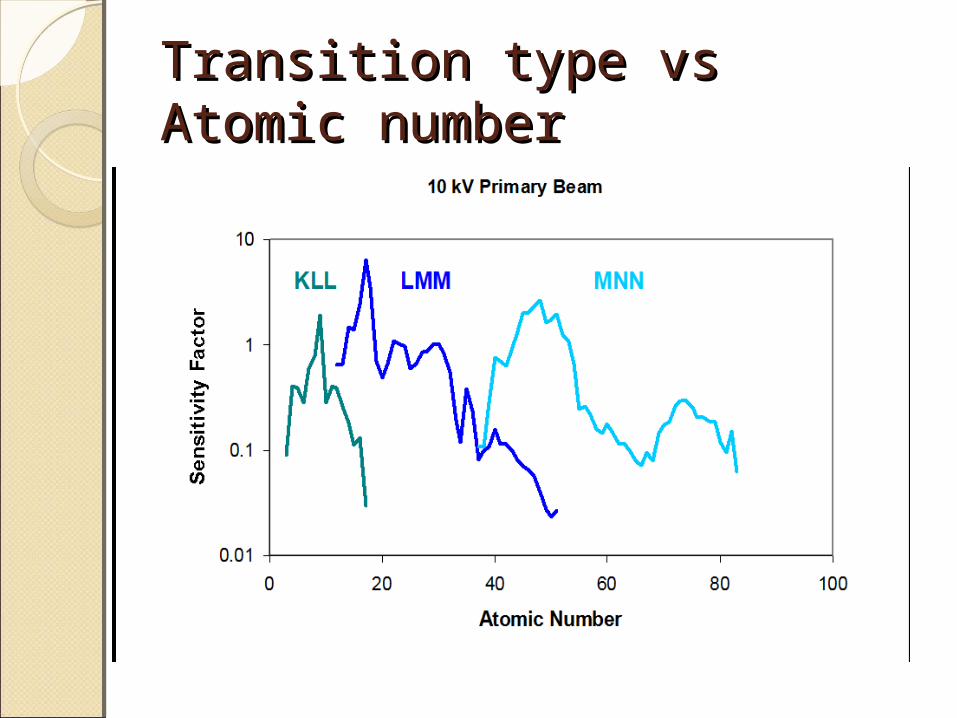
Auger emission are described in term of the type of orbital transitions involved in the production of electron. e.g. KLL, LMM, etc.
Auger transition involves an initial removal of a K electron followed by transition of an L electron to the K orbital with simultaneous ejection of a second L electron with spesific Ek
KLL
LMM
MNN ?

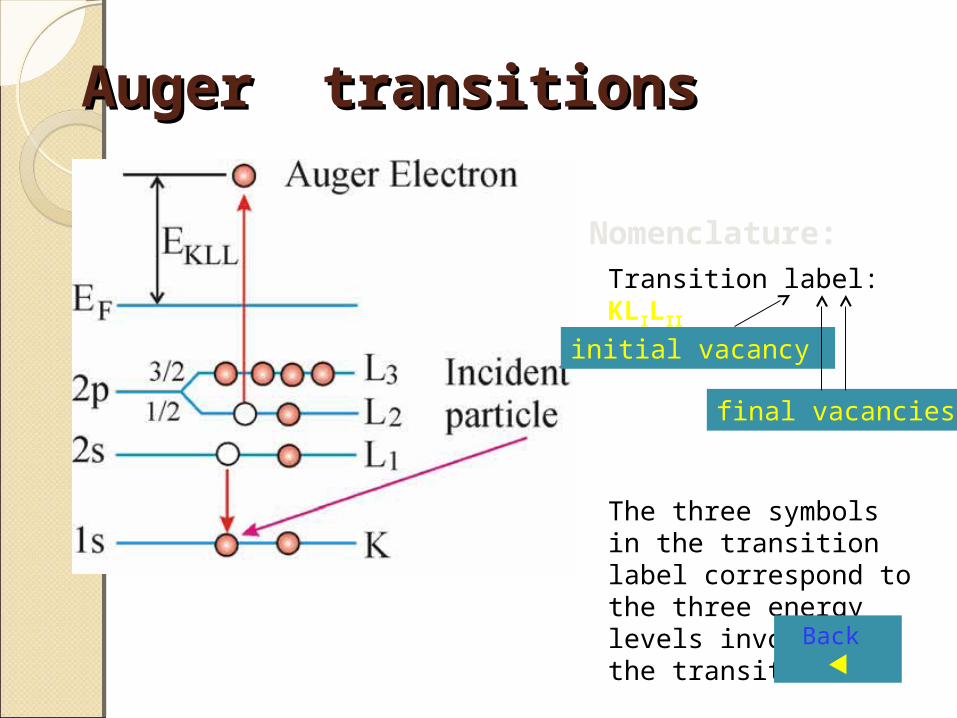
Auger transitionsAuger transitions
Transition label: KLILII
The three symbols in the transition label correspond to the three energy levels involved in the transition.
Nomenclature:
initial vacancy
final vacancies
Transition type vs Atomic Transition type vs Atomic numbernumber
Transition type vs Atomic Transition type vs Atomic numbernumber

SpectraSpectra
Consist of a few characteristics peaks lying in the region of 20 to 1000 eV
Ordinate: derivative of a counting rate as a function of the kinetic energy of the electron, d N(E)/d(E)◦ The derivative:
To enhance small peak To repress the effect of the scattered
electron background radiation

SpectraSpectra
The derivative
High secondary electron background

Spectra:Spectra: a typical spectra of 70 % Cu 30 % Ni a typical spectra of 70 % Cu 30 % Ni alloy (McGuire, 1978)alloy (McGuire, 1978)
Auger electron energy (eV)
200 400 600 1200
dN(E
) /d (
E)
NiNi
Ni CuO
CS
Cl

InstrumentationInstrumentation
Electron Spectrometers are made up of components whose functions are completely analogous to those encountered in optical spectroscopic instr.◦Source◦Sample holder/container◦An analyzer (like a monochromator)◦Detector◦Signal processor and readout
Integral unit from which discrete-energy electron from the sample are directed through a slit to the electron analyzer

Instrumentation Instrumentation (…………………….continued)(…………………….continued)
SourceElectron gun:
◦Similar in construction to electron source in CRT
◦Produce a beam of 1 to 10 keV◦Produce a beam of 5 to 10 um (Auger
microprobe) that are employed for scanning solid surface in order to detect and determine the elemental composition of inhomogeneities

Instrumentation Instrumentation (…………………….continued)(…………………….continued)
Sample CompartmentSamples are mounted in a fixed position as close to electron source and the entrance slit of the spectrometer as possible
◦In vacuum (for better) to avoid attenuation of the electron beam to avoid contamination by substance such as oxygen

Instrumentation (…………………….continued)Instrumentation (…………………….continued)
AnalyzerTwo basic type of analyzer are encountered:
1. Retarding field instrument
2. Dispersion type
Electron from the sample pass through to silidrical grids to an outer collector (also silindrical)• Grid: metallic screen (provide 70 % transmission)
An increasing potential difference is applied across the grid to retard electron flowing from resource to the collector

Retarding field instrument ( ……..cont.)Retarding field instrument ( ……..cont.)
At high enough potential diff. electron of energy e2 will be retarded and the collector signal will decrease
The collector signal q is amplified, differentiated and displayed on a recorder as the grid potential is scanned.

Dispersion typeDispersion type
In this type of instrument the electron beam is deflected by an electrostatic or magnetic field in such a way that the electron travel in a curved path
◦The curvature is dependent upon the kinetic energy and the magnitude of the field
◦By varying the field electrons of various kinetic energies can be focused on the detector
◦The media is maintained vacuum

DetectorDetector
Mostly, the system are based upon solid-state, channel electron multipliers tube which is doped with lead or vanadium
When a potential of several kilovolts is applied across these material, a pulse of 106 to 108 electron is produce for each incident electron
The pulse then counted

ReadoutReadout
CRTRecorderAlphanumeric display unit

ApplicabilityApplicability
Qualitative and quantitative information about elemental composition of matter (solid surfaces)—complementary system with X-ray photoelectron spectroscopy
Useful structural informationParticular strength:
◦Its sensitivity for atoms of low atomic number
◦Its minimal matrix effect◦High spatial resolution◦Today to provide the kind of structural and
oxidation state

Applicability Applicability (………………………….…….…….cont.)(………………………….…….…….cont.)
Qualitative AnalysisTypically, Auger spectrum is obtained by
bombarding a small area of surface with a beam of electron
Advantage: that with low energy Auger electron (20 to 1000 eV) are able to penetrate only a few atomic layer (3 to 20 Å that is more grater depth below the surface), the spectrum is more likely in reflecting the true surface composition of solid than is an ESCA spectrum

Applicability Applicability (………………………….…….…….cont.)(………………………….…….…….cont.)
Depth profiling surfaceDepth profiling involves the determination of the elemental composition of a surface as it is being etched away by a beam of argon ions.
◦ Etching rate is related to time, depth profile of elemental composition is obtained
◦ Above are of vital information in corrosion chem., catalyst, properties of semiconductor junction
A depth profile obtained on a specimen of Si which was coated in Au and then Ag and then Au again (provided after combining AES with etching ion beam)

Line ScanningUsed to characterize surface composition as a function of distance along a straight line of 100 um or more

ProblemsProblems1. Describe the mechanism of the production
of ana. MNN Auger electron !b. LMM Auger electron !
2. Explain the phenomenon of Auger electron ejection ! Differentiate those with generation of a fluorescent photon !
3. What are the numerous information obtained by applying the method to solid surface? Explain !
4. With the method, how can we come to conclusion of qualitative information of solid surface? Explain with typical data !

The ProcessA beam of energetic electrons, 3 to 25 keV, is
used to eject a core level electron from surface atoms
To release energy, those atoms may emit Auger electrons from their induced excited state.
The energy of the Auger electron, specific to the atom from which it originated, is measured and the quantity of Auger electrons is proportional to the concentration of the atoms on the surface
Auger electron spectroscopy can measure two dimensional maps of elements on a surface and elemental depth profiles when accompanied by ion sputtering.
..

Ask the audience to Ask the audience to continue the classcontinue the class
Auger transitionsAuger transitions
Transition label: KLILII
The three symbols in the transition label correspond to the three energy levels involved in the transition.
Nomenclature:
initial vacancy
final vacancies
Back

A typical instrument of A typical instrument of AESAES(by Perkin-Elmer type PHI-651](by Perkin-Elmer type PHI-651]
Back

Auger spectraAuger spectra
Raw Auger electron energy spectrum. Auger peaks are weak on strongbackground.
Plotting the differentialof the raw spectrum, dN(E)/dE,makes peaks more clear
d[E x N(E)]/dE provides most clear structures.Commonly used to present Auger spectra
The Auger electrons have discreetenergies, depending on the:• chemical element• transition• oxidation state of the atom
Back

[email protected][email protected]
Resume (maks. 0,5 hal. A4) artikel (jurnal)
File Resume dan jurnal dikirim via email tsb.
Maks 19 Juni 2013Pukul 12.00Tugas diterima, file materi XRD dikirim