Meet the expert: Melanom - Oncology Conferences · 2/19/2016 1 Meet the expert: Melanom Christoph...
51
2/19/2016 1 Meet the expert: Melanom Christoph Höller Universitätsklinik für Dermatologie Medizinische Universität Wien DESO St. Gallen 18.&19. Februar 2016 Certified Skin Tumor Center Sprecher‐Honorare, Advisor von Mögliche Interessenskonflikte •BMS •GSK •MSD •Novartis •Roche •Amgen C. Höller 2016
Transcript of Meet the expert: Melanom - Oncology Conferences · 2/19/2016 1 Meet the expert: Melanom Christoph...
2/19/2016
1
Meet the expert:Melanom
Christoph Höller
Universitätsklinik für Dermatologie
Medizinische Universität Wien
DESO St. Gallen 18.&19. Februar 2016
Certified Skin Tumor Center
Sprecher‐Honorare, Advisor von
Mögliche Interessenskonflikte
•BMS•GSK•MSD•Novartis•Roche•Amgen
C. Höller 2016
2/19/2016
2
Inhalt
• Melanom‐Basics
• Prävention
• Operatives Vorgehen Stadium I‐III
• Adjuvante Therapie
• Therapie im nicht operable metastasierten Stadium• Lokoregionäre Therapie
• Systemische Therapie
Interrupt me whenever you like….
C. Höller 2016
2/19/2016
3
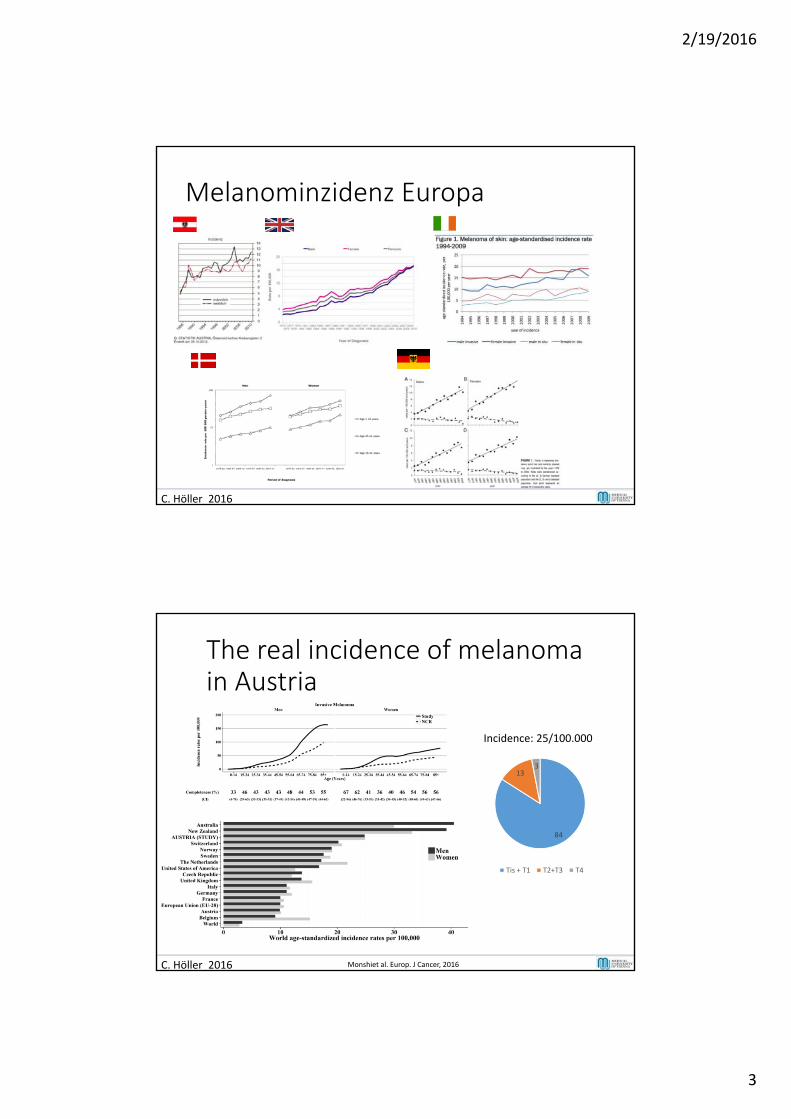
Melanominzidenz Europa
C. Höller 2016
The real incidence of melanoma in Austria
C. Höller 2016 Monshiet al. Europ. J Cancer, 2016
Incidence: 25/100.000
84
133
Tis + T1 T2+T3 T4
2/19/2016
4
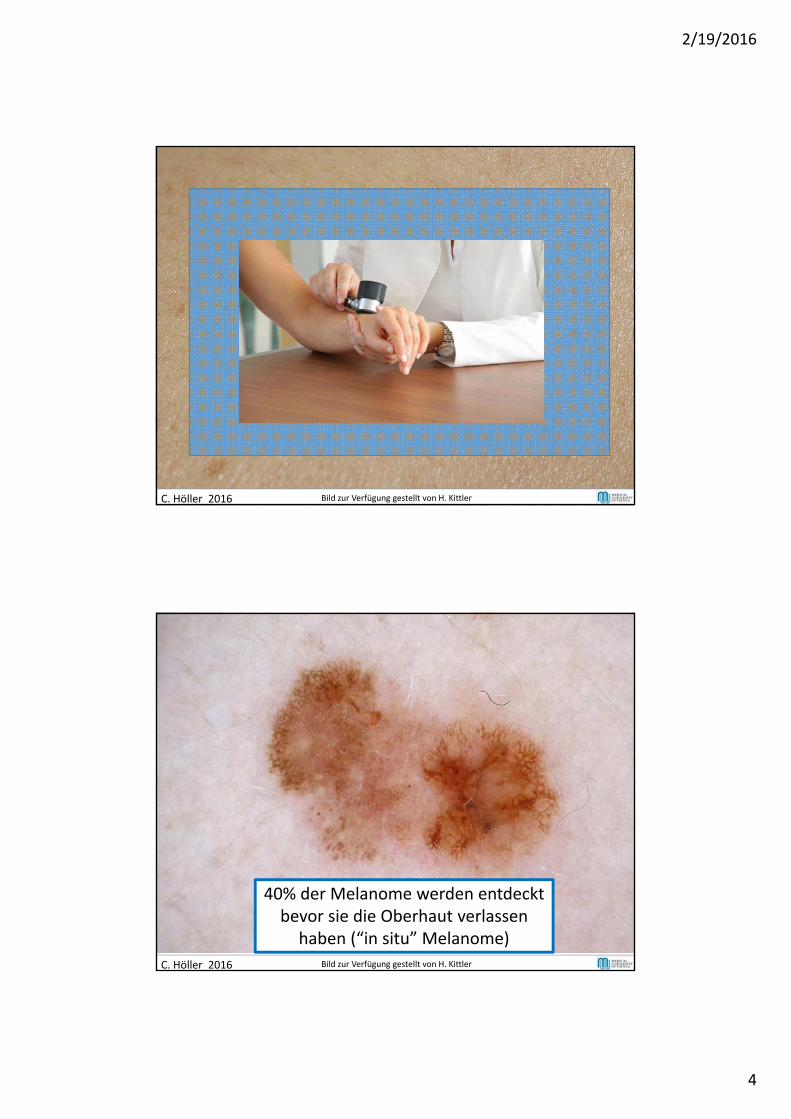
C. Höller 2016 Bild zur Verfügung gestellt von H. Kittler
40% der Melanome werden entdecktbevor sie die Oberhaut verlassen
haben (“in situ” Melanome)
C. Höller 2016 Bild zur Verfügung gestellt von H. Kittler
2/19/2016
5
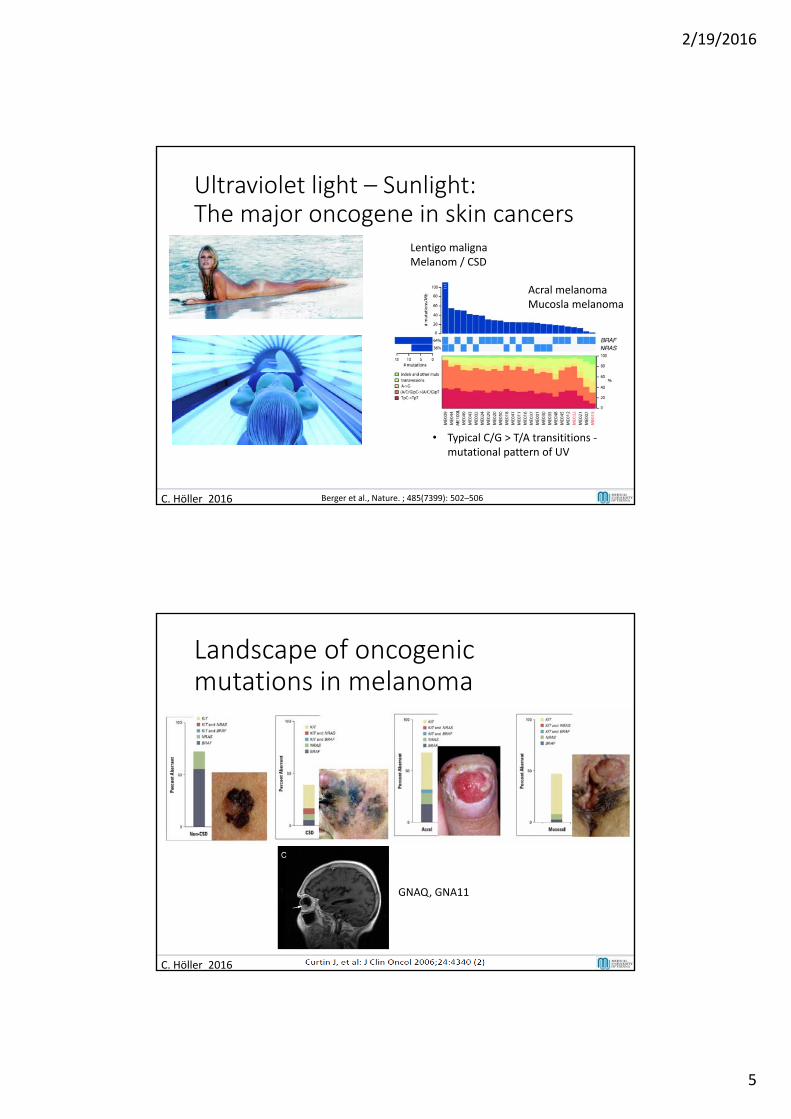
Ultraviolet light – Sunlight:The major oncogene in skin cancers
C. Höller 2016 Berger et al., Nature. ; 485(7399): 502–506
Acral melanomaMucosla melanoma
• Typical C/G > T/A transititions ‐mutational pattern of UV
Lentigo malignaMelanom / CSD
Landscape of oncogenic mutations in melanoma
C. Höller 2016
GNAQ, GNA11
2/19/2016
6
C. Hoeller 2016
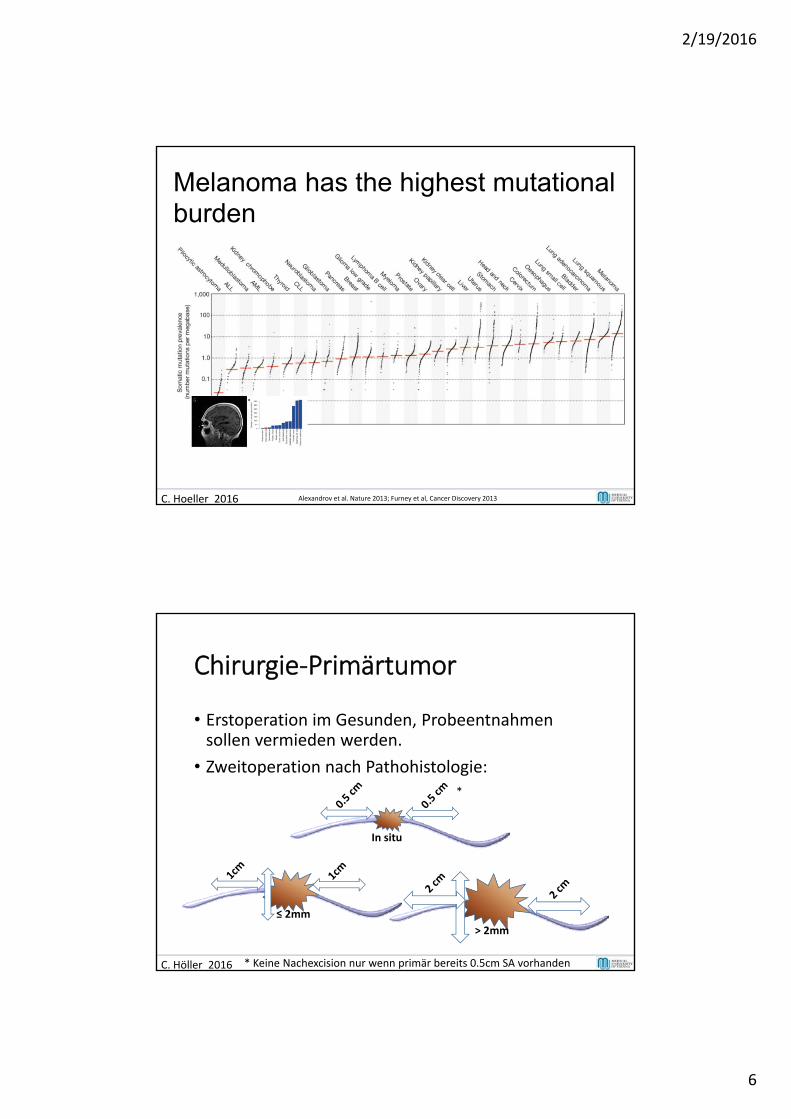
Melanoma has the highest mutational burden
Alexandrov et al. Nature 2013; Furney et al, Cancer Discovery 2013
Chirurgie‐Primärtumor
• Erstoperation im Gesunden, Probeentnahmensollen vermieden werden.
• Zweitoperation nach Pathohistologie:
C. Höller 2016
≤ 2mm
> 2mm
In situ
*
* Keine Nachexcision nur wenn primär bereits 0.5cm SA vorhanden
2/19/2016
7
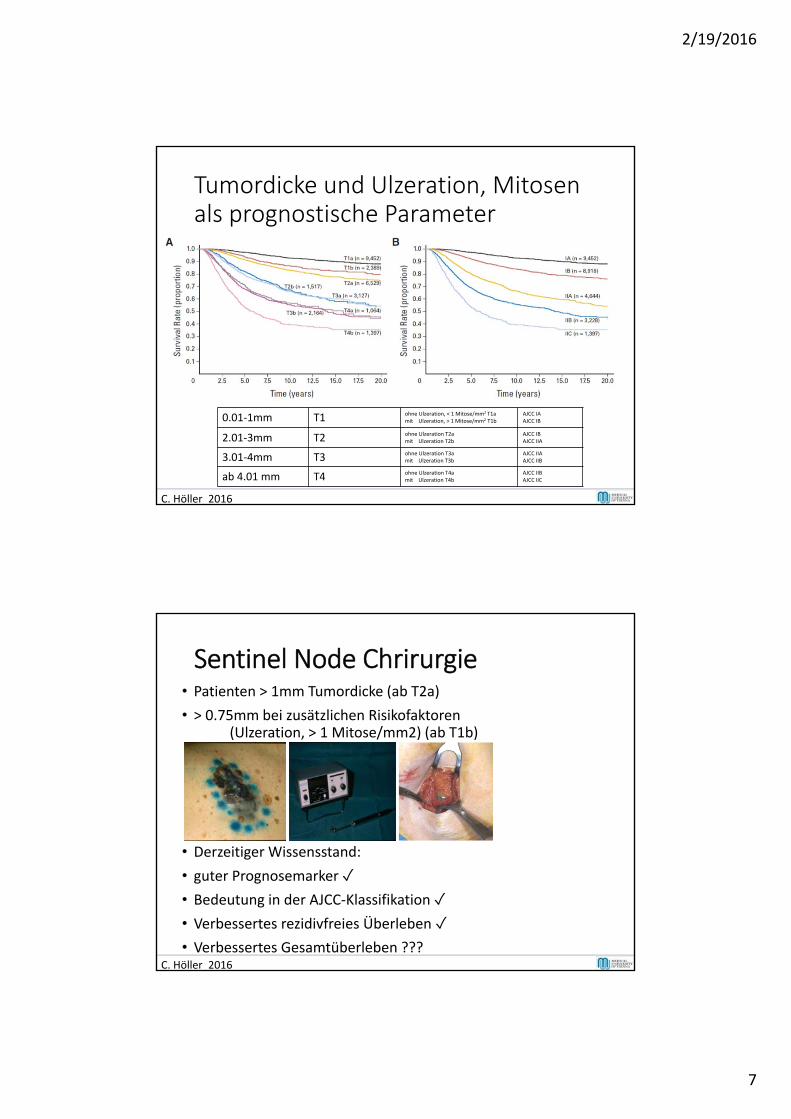
Tumordicke und Ulzeration, Mitosenals prognostische Parameter
C. Höller 2016
0.01‐1mm T1 ohne Ulzeration, < 1 Mitose/mm2 T1amit Ulzeration, > 1 Mitose/mm2 T1b
AJCC IAAJCC IB
2.01‐3mm T2 ohne Ulzeration T2amit Ulzeration T2b
AJCC IBAJCC IIA
3.01‐4mm T3 ohne Ulzeration T3amit Ulzeration T3b
AJCC IIAAJCC IIB
ab 4.01 mm T4 ohne Ulzeration T4amit Ulzeration T4b
AJCC IIBAJCC IIC
Sentinel Node Chrirurgie• Patienten > 1mm Tumordicke (ab T2a)
• > 0.75mm bei zusätzlichen Risikofaktoren(Ulzeration, > 1 Mitose/mm2) (ab T1b)
• Derzeitiger Wissensstand:
• guter Prognosemarker ✓• Bedeutung in der AJCC‐Klassifikation ✓• Verbessertes rezidivfreies Überleben ✓• Verbessertes Gesamtüberleben ???
C. Höller 2016
2/19/2016
8
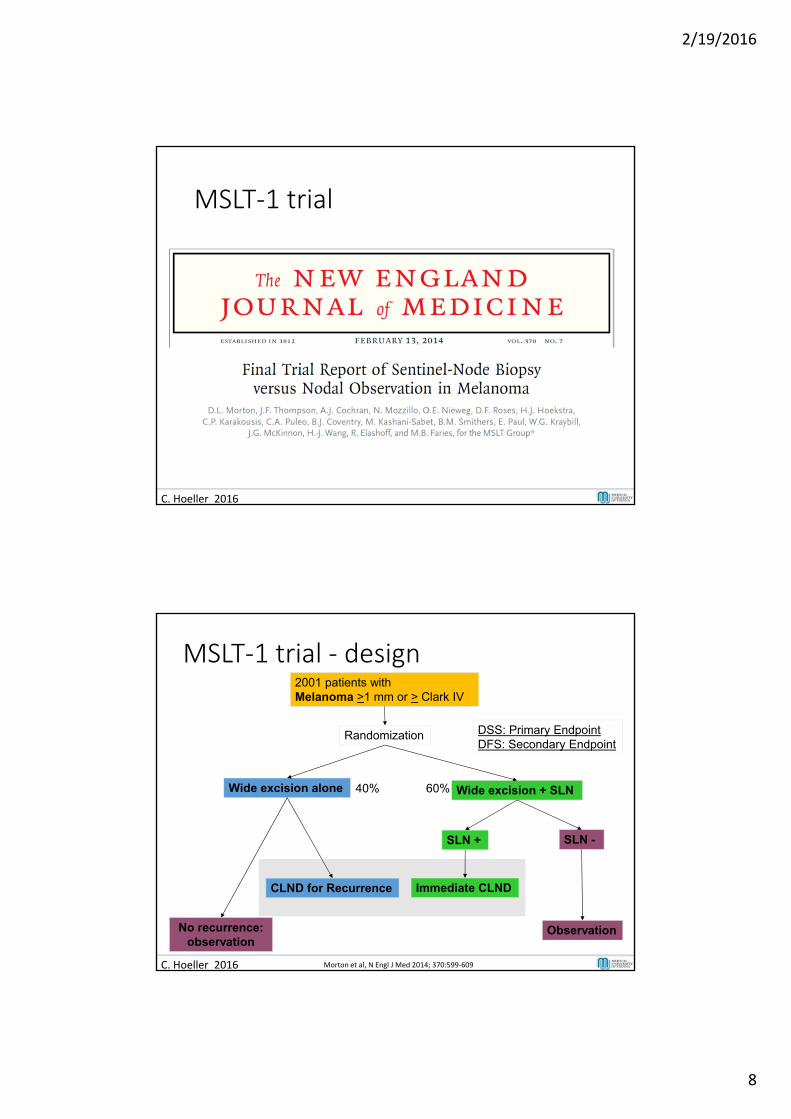
MSLT‐1 trial
C. Hoeller 2016
2001 patients with Melanoma >1 mm or > Clark IV
Wide excision alone Wide excision + SLN
SLN + SLN -
Observation
Immediate CLNDCLND for Recurrence
Randomization
No recurrence: observation
DSS: Primary EndpointDFS: Secondary Endpoint
40% 60%
C. Hoeller 2016 Morton et al, N Engl J Med 2014; 370:599‐609
MSLT‐1 trial ‐ design
2/19/2016
9
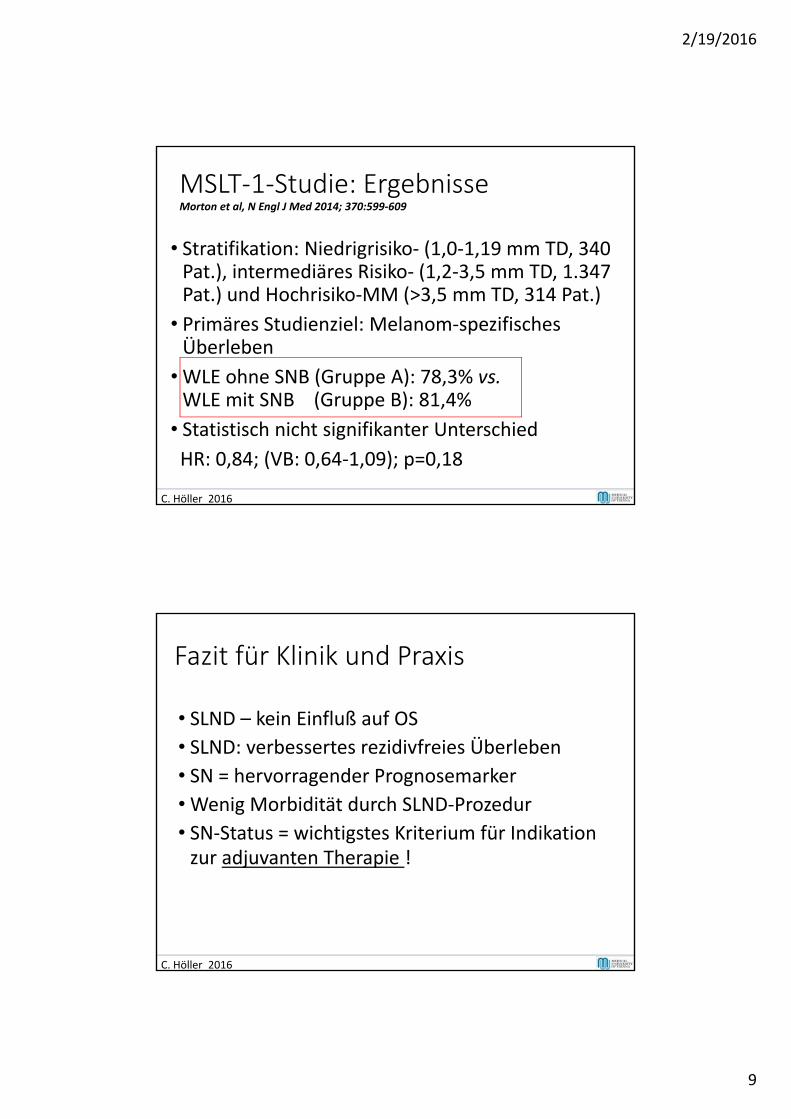
• Stratifikation: Niedrigrisiko‐ (1,0‐1,19 mm TD, 340 Pat.), intermediäres Risiko‐ (1,2‐3,5 mm TD, 1.347 Pat.) und Hochrisiko‐MM (>3,5 mm TD, 314 Pat.)
• Primäres Studienziel: Melanom‐spezifisches Überleben
• WLE ohne SNB (Gruppe A): 78,3% vs. WLE mit SNB (Gruppe B): 81,4%
• Statistisch nicht signifikanter UnterschiedHR: 0,84; (VB: 0,64‐1,09); p=0,18
23
MSLT‐1‐Studie: ErgebnisseMorton et al, N Engl J Med 2014; 370:599‐609
C. Höller 2016
• SLND – kein Einfluß auf OS
• SLND: verbessertes rezidivfreies Überleben • SN = hervorragender Prognosemarker
• Wenig Morbidität durch SLND‐Prozedur
• SN‐Status = wichtigstes Kriterium für Indikation zur adjuvanten Therapie !
Fazit für Klinik und Praxis
C. Höller 2016
2/19/2016
10
Comparison of Survival Rates at Stages I, II, and III (AJCC 2009)
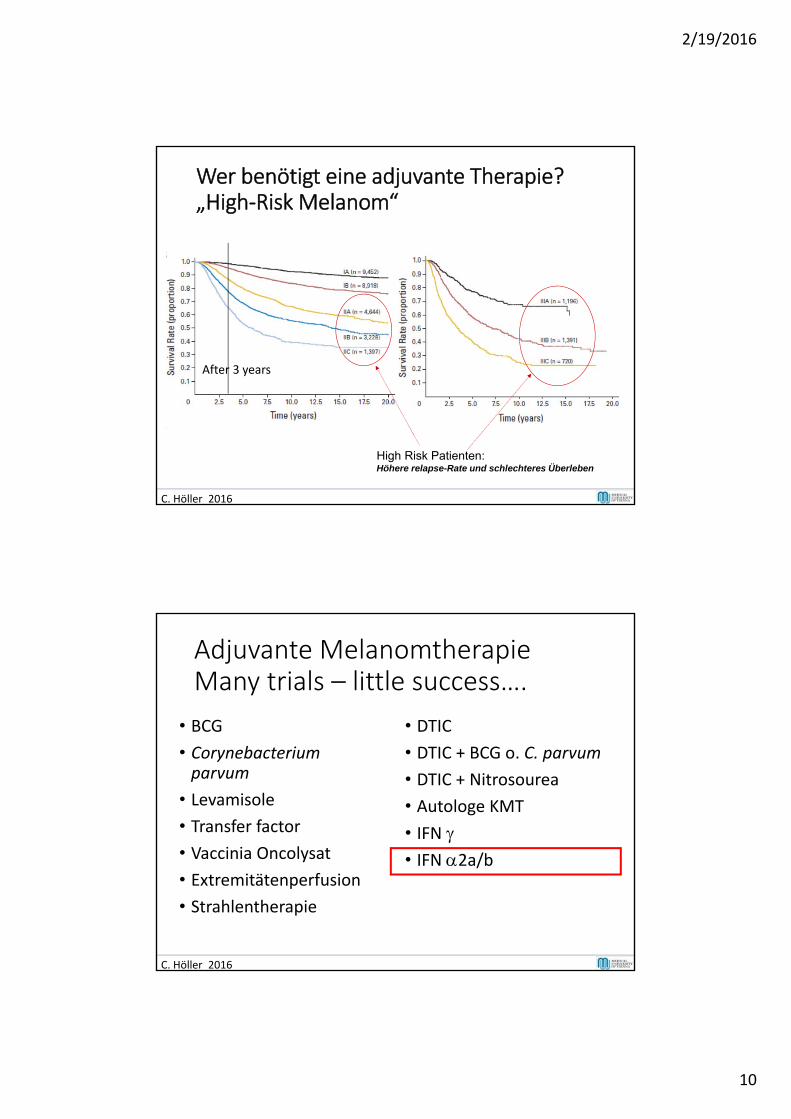
Wer benötigt eine adjuvante Therapie?„High‐Risk Melanom“
Balch et al. J Clin Oncol 2009;27:6199 -6206
High Risk Patienten: Höhere relapse-Rate und schlechteres Überleben
After 3 years
C. Höller 2016
Adjuvante MelanomtherapieMany trials – little success….
• BCG
• Corynebacteriumparvum
• Levamisole
• Transfer factor
• Vaccinia Oncolysat
• Extremitätenperfusion
• Strahlentherapie
• DTIC
• DTIC + BCG o. C. parvum
• DTIC + Nitrosourea
• Autologe KMT
• IFN • IFN 2a/b
C. Höller 2016
2/19/2016
11
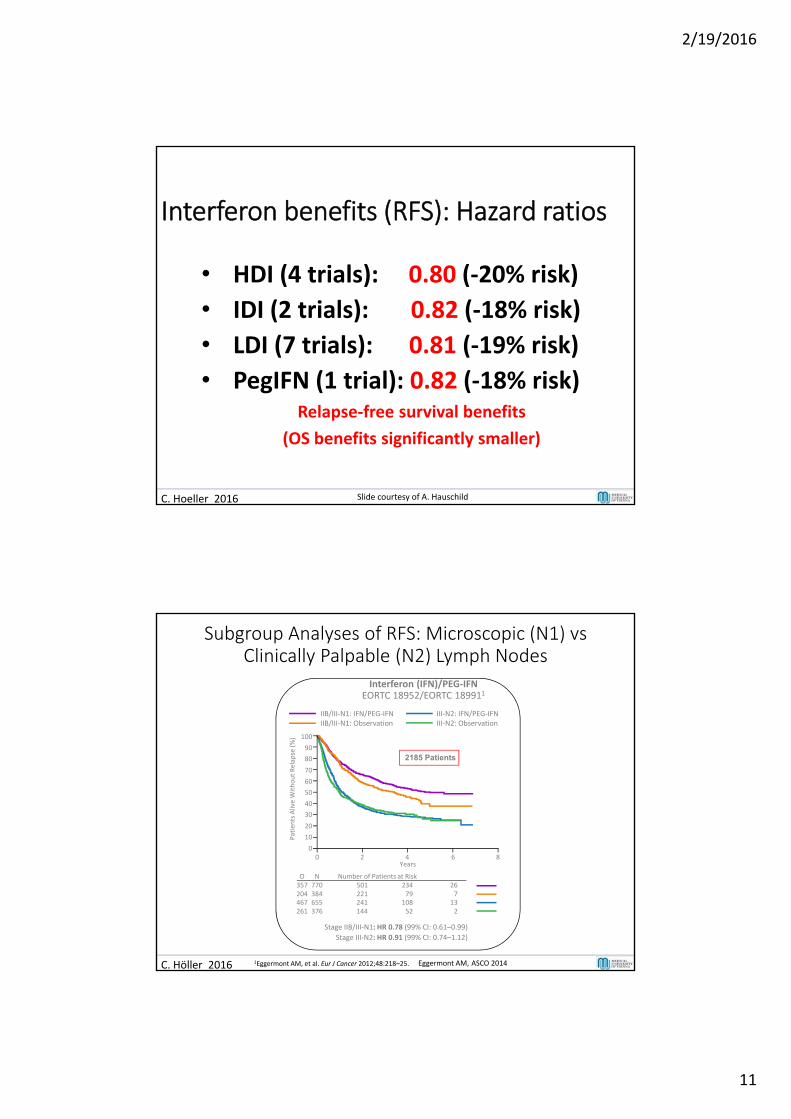
Interferon benefits (RFS): Hazard ratios
• HDI (4 trials): 0.80 (‐20% risk)
• IDI (2 trials): 0.82 (‐18% risk)
• LDI (7 trials): 0.81 (‐19% risk)
• PegIFN (1 trial): 0.82 (‐18% risk)Relapse‐free survival benefits
(OS benefits significantly smaller)
23C. Hoeller 2016 Slide courtesy of A. Hauschild
C. Höller 2016
Years0 2 4 6 8
0
Patients Alive Without Relap
se (%)
10
20
30
40
50
60
70
80
90
100
Interferon (IFN)/PEG‐IFNEORTC 18952/EORTC 189911
IIB/III‐N1: IFN/PEG‐IFN IIB/III‐N1: Observation
III‐N2: IFN/PEG‐IFN III‐N2: Observation
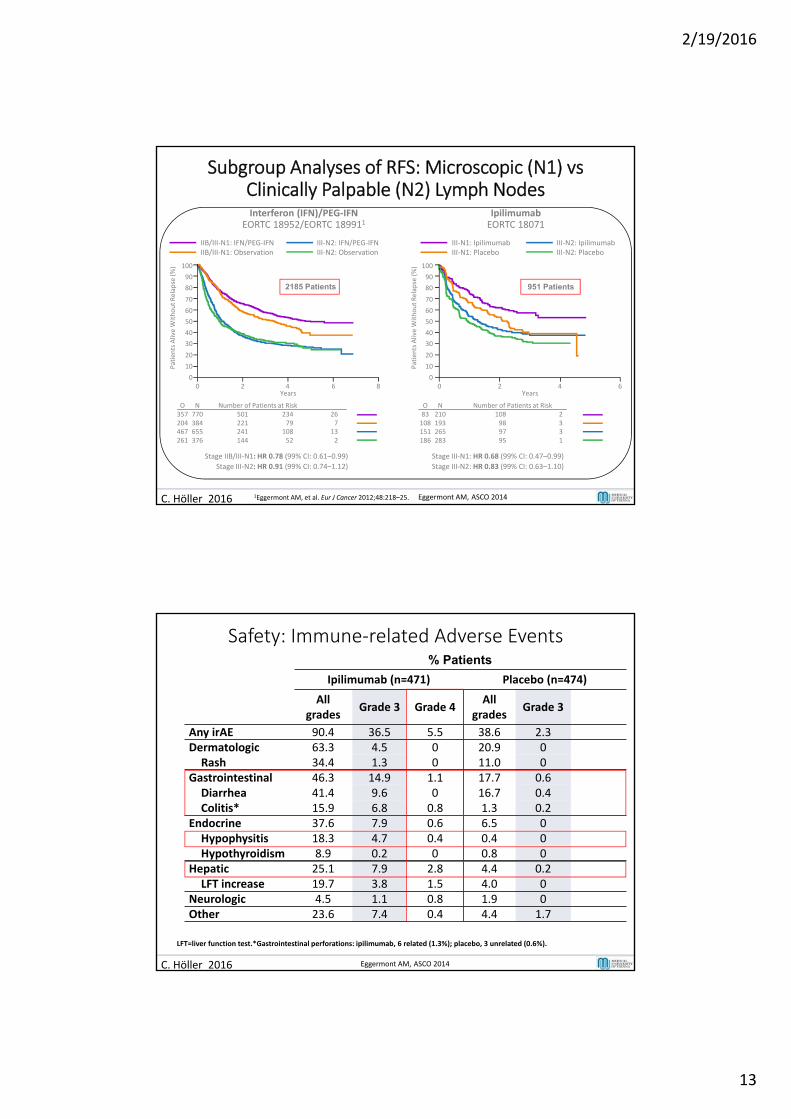
Subgroup Analyses of RFS: Microscopic (N1) vs Clinically Palpable (N2) Lymph Nodes
Stage IIB/III‐N1: HR 0.78 (99% CI: 0.61–0.99)
O N Number of Patients at Risk357 770 501 234 26204 384 221 79 7
1Eggermont AM, et al. Eur J Cancer 2012;48:218–25.
2185 Patients
467 655 241 108 13261 376 144 52 2
Stage III‐N2: HR 0.91 (99% CI: 0.74–1.12)
Eggermont AM, ASCO 2014
2/19/2016
12
C. Höller 2016
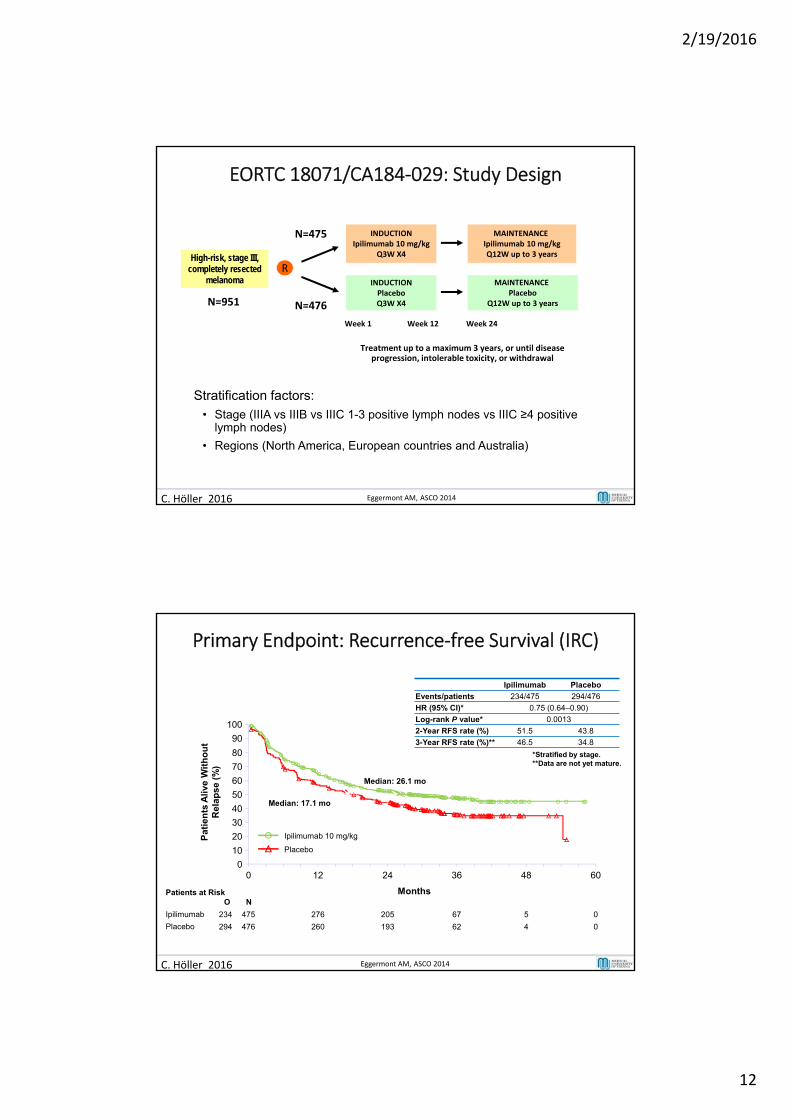
EORTC 18071/CA184‐029: Study Design
INDUCTIONIpilimumab 10 mg/kg
Q3W X4High-risk, stage III, completely resected
melanoma INDUCTIONPlaceboQ3W X4
R
MAINTENANCE Ipilimumab 10 mg/kgQ12W up to 3 years
MAINTENANCE Placebo
Q12W up to 3 years
Treatment up to a maximum 3 years, or until disease progression, intolerable toxicity, or withdrawal
N=475
N=476
Week 1 Week 12 Week 24
Stratification factors:
• Stage (IIIA vs IIIB vs IIIC 1-3 positive lymph nodes vs IIIC ≥4 positive lymph nodes)
• Regions (North America, European countries and Australia)
N=951
Eggermont AM, ASCO 2014
C. Höller 2016
Primary Endpoint: Recurrence‐free Survival (IRC)
Ipilimumab Placebo
Events/patients 234/475 294/476
HR (95% CI)* 0.75 (0.64–0.90)
Log-rank P value* 0.0013
2-Year RFS rate (%) 51.5 43.8
3-Year RFS rate (%)** 46.5 34.8
Ipilimumab 10 mg/kg
Placebo
Patients at RiskO N
Ipilimumab
Placebo
Pat
ien
ts A
live
Wit
ho
ut
Rel
apse
(%
)
100
90
80
70
60
50
40
30
20
10
00 12 24 36 48 60
Months
475
476
276
260
205
193
67
62
5
4
0
0
Median: 17.1 mo
Median: 26.1 mo
*Stratified by stage. **Data are not yet mature.
234
294
Eggermont AM, ASCO 2014
2/19/2016
13
C. Höller 2016
Years0 2 4 6 8
0
Patients Alive Without Relap
se (%)
10
20
30
40
50
60
70
80
90
100
Interferon (IFN)/PEG‐IFNEORTC 18952/EORTC 189911
IpilimumabEORTC 18071
IIB/III‐N1: IFN/PEG‐IFN IIB/III‐N1: Observation
III‐N2: IFN/PEG‐IFN III‐N2: Observation
Subgroup Analyses of RFS: Microscopic (N1) vs Clinically Palpable (N2) Lymph Nodes
Stage IIB/III‐N1: HR 0.78 (99% CI: 0.61–0.99)
O N Number of Patients at Risk357 770 501 234 26204 384 221 79 7
Stage III‐N1: HR 0.68 (99% CI: 0.47–0.99)
O N Number of Patients at Risk83 210 108 2108 193 98 3
Years0 2 4 6
0
10
20
30
40
50
60
70
80
90
100
Patients Alive Without Relap
se (%)
1Eggermont AM, et al. Eur J Cancer 2012;48:218–25.
III‐N1: Ipilimumab III‐N1: Placebo
III‐N2: Ipilimumab III‐N2: Placebo
2185 Patients 951 Patients
467 655 241 108 13261 376 144 52 2
Stage III‐N2: HR 0.91 (99% CI: 0.74–1.12)
151 265 97 3186 283 95 1
Stage III‐N2: HR 0.83 (99% CI: 0.63–1.10)
Eggermont AM, ASCO 2014
% Patients
Ipilimumab (n=471) Placebo (n=474)
All grades
Grade 3 Grade 4All
gradesGrade 3 Grade 4
Any irAE 90.4 36.5 5.5 38.6 2.3 0.2Dermatologic 63.3 4.5 0 20.9 0 0Rash 34.4 1.3 0 11.0 0 0
Gastrointestinal 46.3 14.9 1.1 17.7 0.6 0.2Diarrhea 41.4 9.6 0 16.7 0.4 0Colitis* 15.9 6.8 0.8 1.3 0.2 0
Endocrine 37.6 7.9 0.6 6.5 0 0Hypophysitis 18.3 4.7 0.4 0.4 0 0Hypothyroidism 8.9 0.2 0 0.8 0 0
Hepatic 25.1 7.9 2.8 4.4 0.2 0LFT increase 19.7 3.8 1.5 4.0 0 0
Neurologic 4.5 1.1 0.8 1.9 0 0Other 23.6 7.4 0.4 4.4 1.7 0
LFT=liver function test.*Gastrointestinal perforations: ipilimumab, 6 related (1.3%); placebo, 3 unrelated (0.6%).
Safety: Immune‐related Adverse Events
C. Höller 2016 Eggermont AM, ASCO 2014
2/19/2016
14
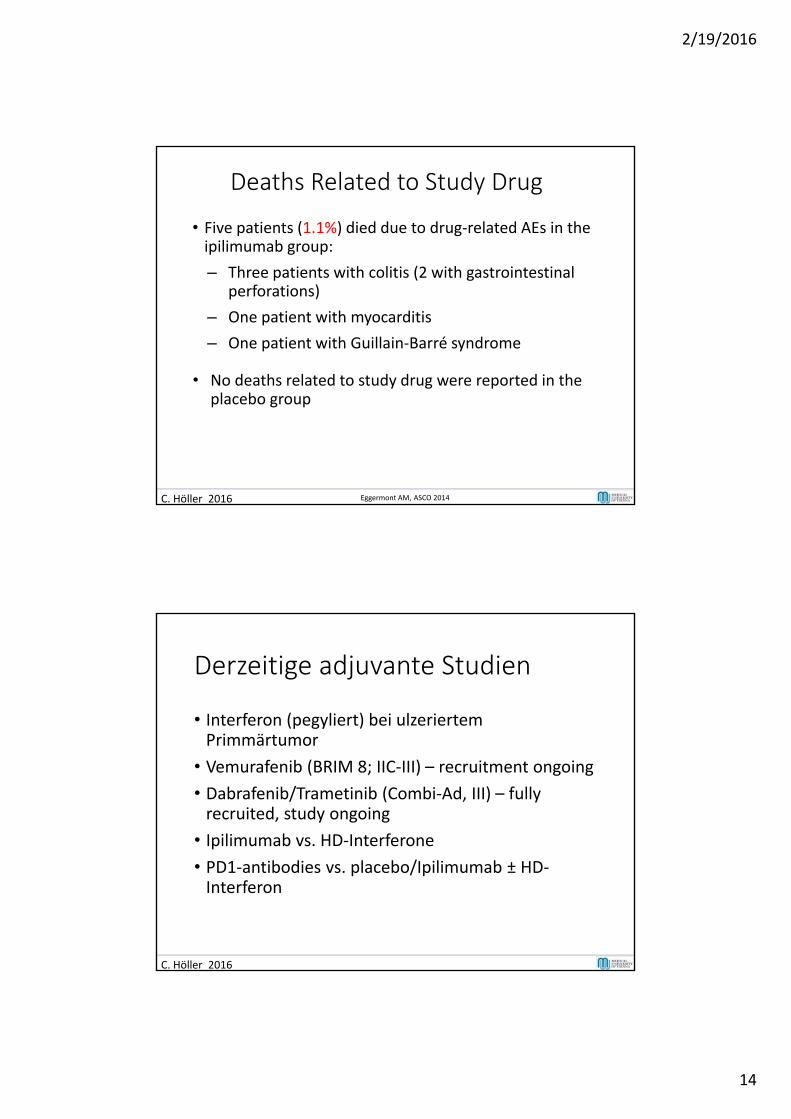
• Five patients (1.1%) died due to drug‐related AEs in the ipilimumab group:
– Three patients with colitis (2 with gastrointestinal perforations)
– One patient with myocarditis
– One patient with Guillain‐Barré syndrome
• No deaths related to study drug were reported in the placebo group
Deaths Related to Study Drug
C. Höller 2016 Eggermont AM, ASCO 2014
Derzeitige adjuvante Studien
• Interferon (pegyliert) bei ulzeriertemPrimmärtumor
• Vemurafenib (BRIM 8; IIC‐III) – recruitment ongoing
• Dabrafenib/Trametinib (Combi‐Ad, III) – fully recruited, study ongoing
• Ipilimumab vs. HD‐Interferone
• PD1‐antibodies vs. placebo/Ipilimumab ± HD‐Interferon
C. Höller 2016
2/19/2016
15
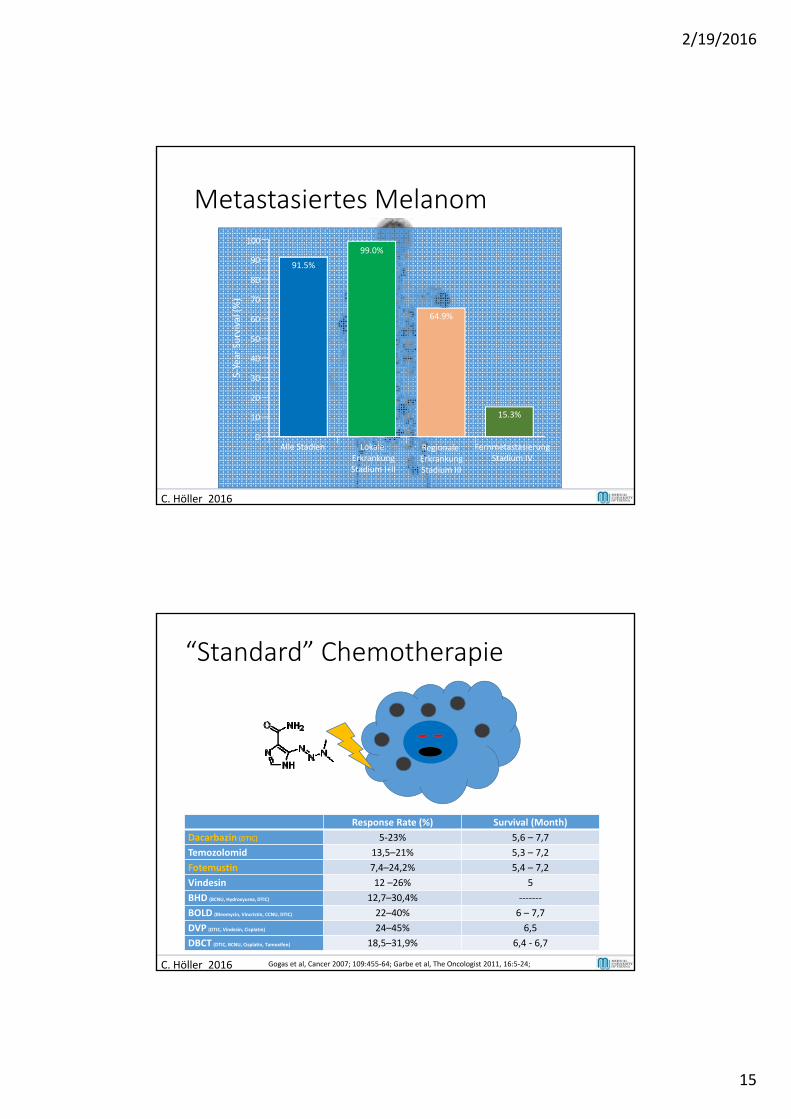
Metastasiertes Melanom100
90
80
70
60
50
40
30
20
10
0
5‐Yea
r Su
rvival (%)
Alle Stadien LokaleErkrankungStadium I+II
RegionaleErkrankungStadium III
91.5%
99.0%
64.9%
FernmetastasierungStadium IV
15.3%
C. Höller 2016
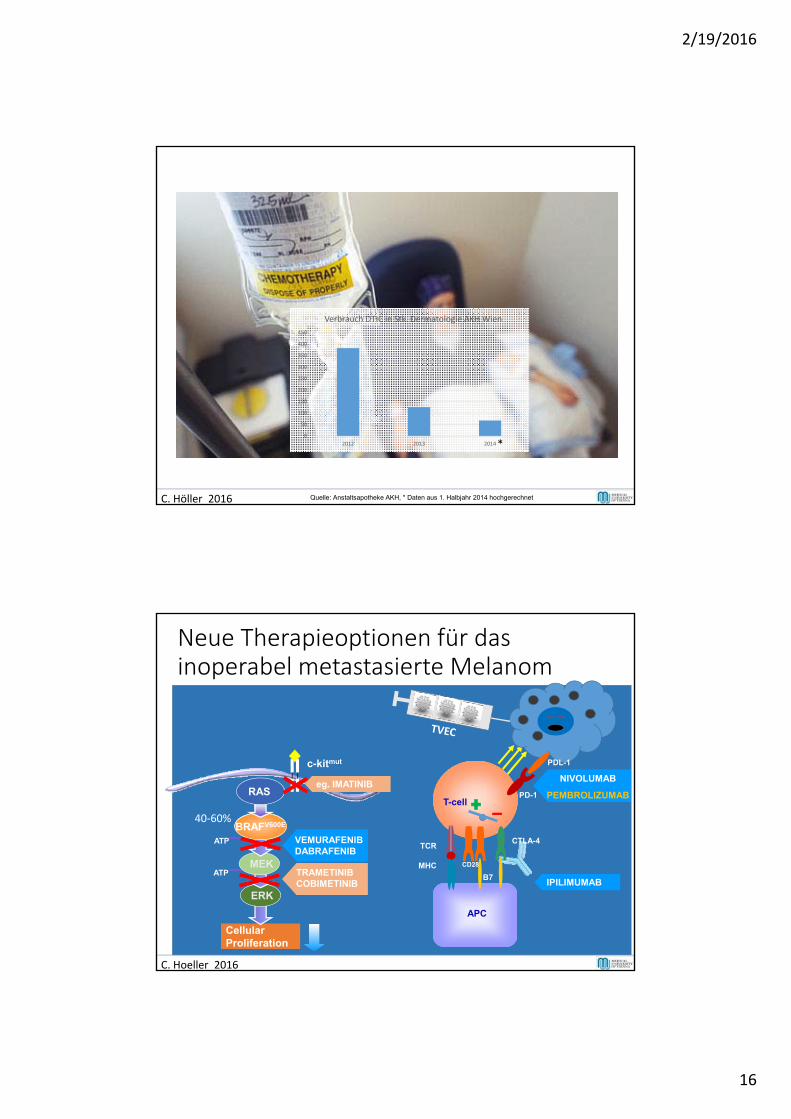
“Standard” Chemotherapie
Response Rate (%) Survival (Month)
Dacarbazin (DTIC) 5‐23% 5,6 – 7,7
Temozolomid 13,5–21% 5,3 – 7,2
Fotemustin 7,4–24,2% 5,4 – 7,2
Vindesin 12 –26% 5
BHD (BCNU, Hydroxyurea, DTIC) 12,7–30,4% ‐‐‐‐‐‐‐
BOLD (Bleomycin, Vincristin, CCNU, DTIC) 22–40% 6 – 7,7
DVP (DTIC, Vindesin, Cisplatin) 24–45% 6,5
DBCT (DTIC, BCNU, Cisplatin, Tamoxifen) 18,5–31,9% 6,4 ‐ 6,7
C. Höller 2012C. Höller 2016 Gogas et al, Cancer 2007; 109:455‐64; Garbe et al, The Oncologist 2011, 16:5‐24;
2/19/2016
16
C. Höller 2016
0
50
100
150
200
250
300
350
400
450
2012 2013 2014
Verbrauch DTIC in Stk. Dermatologie AKH Wien
*
Quelle: Anstaltsapotheke AKH, * Daten aus 1. Halbjahr 2014 hochgerechnet
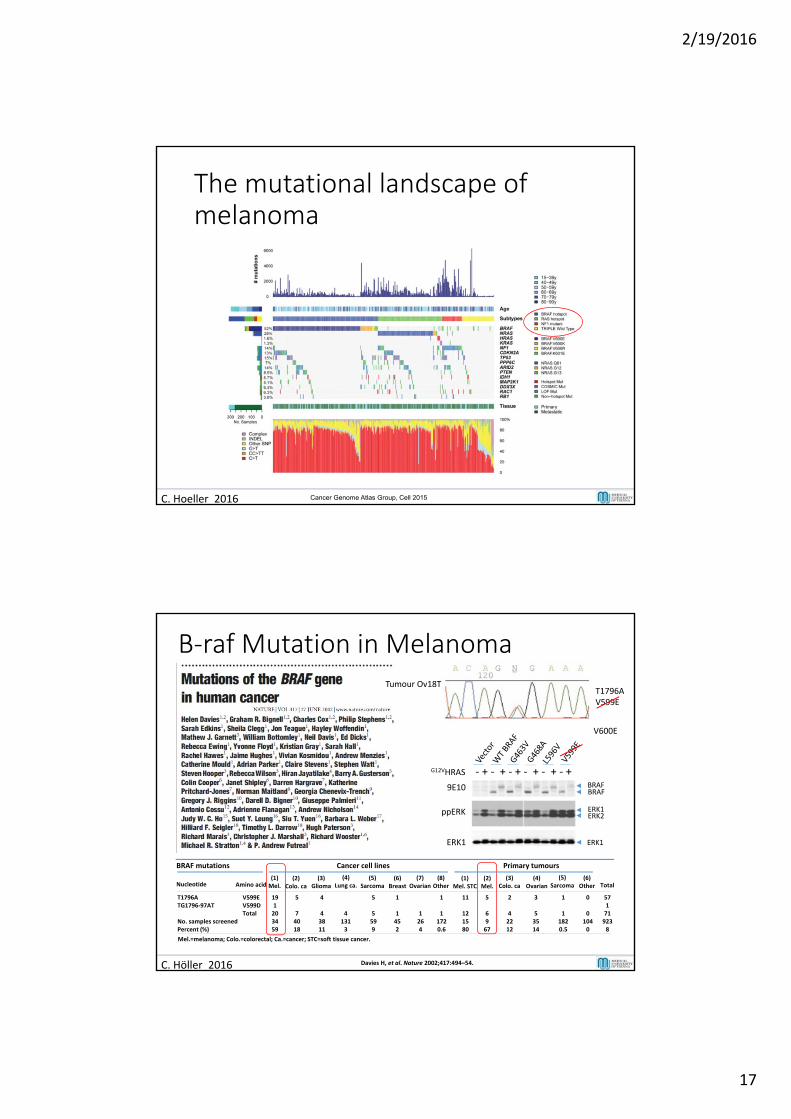
Neue Therapieoptionen für das inoperabel metastasierte Melanom
CellularProliferation
RAFVEMURAFENIBDABRAFENIB
ATP
ATP
ERK
MEK
BRAFV600E
RAS
MHC
TCR
IPILIMUMAB
T-cell
APC
B7
CD28
C. Hoeller 2016
40‐60%
TRAMETINIBCOBIMETINIB
PD-1
CTLA-4
NIVOLUMAB
PEMBROLIZUMAB
PDL-1c-kitmut
eg. IMATINIBeg. IMATINIB
2/19/2016
17
The mutational landscape ofmelanoma
C. Hoeller 2016 Cancer Genome Atlas Group, Cell 2015
B‐raf Mutation in Melanoma
Mel.=melanoma; Colo.=colorectal; Ca.=cancer; STC=soft tissue cancer.
BRAF mutations Cancer cell lines Primary tumours
Nucleotide Amino acid(1)Mel.
T1796ATG1796‐97AT
No. samples screenedPercent (%)
V599EV599DTotal
191203459
(2)Colo. ca
5
74018
(3)Glioma
4
43811
(4)Lung ca.
41313
(5)Sarcoma
5
5599
(6)Breast
1
1452
(7)Ovarian
1264
1
11720.6
(8)Other
(1)Mel. STC
11
121580
5
6967
(2)Mel.
(3)Colo. ca
2
42212
3
53514
(4)Ovarian
1
11820.5
(5)Sarcoma
(6)Other
0
01040
571719238
Total
Tumour Ov18TT1796AV599E
V600E
G12VHRAS
9E10
ppERK
ERK1
BRAFBRAF
ERK1ERK2
ERK1
‐ + ‐ + ‐ + ‐ + ‐ + ‐ +
C. Höller 2016 Davies H, et al. Nature 2002;417:494–54.
2/19/2016
18
E
> 85%
C. Höller 2016
BRAF‐inhibition:• A…Hohe Ansprechrate• B…Rasches Ansprechen• C…Resistenzentwicklung im Mittel nach 6.9 Monaten• D…verbessertes Gesamtüberleben
C
B
Vemurafenib, tested against DTIC, First‐line, BrafV600
A
Clinical benefit withinonly 2 weeks
8W
SCR
d0d0
w2
w8 w8
DWeek 18
Chapman et al, N Engl J Med 2011, 364: 2507‐16
2/19/2016
19
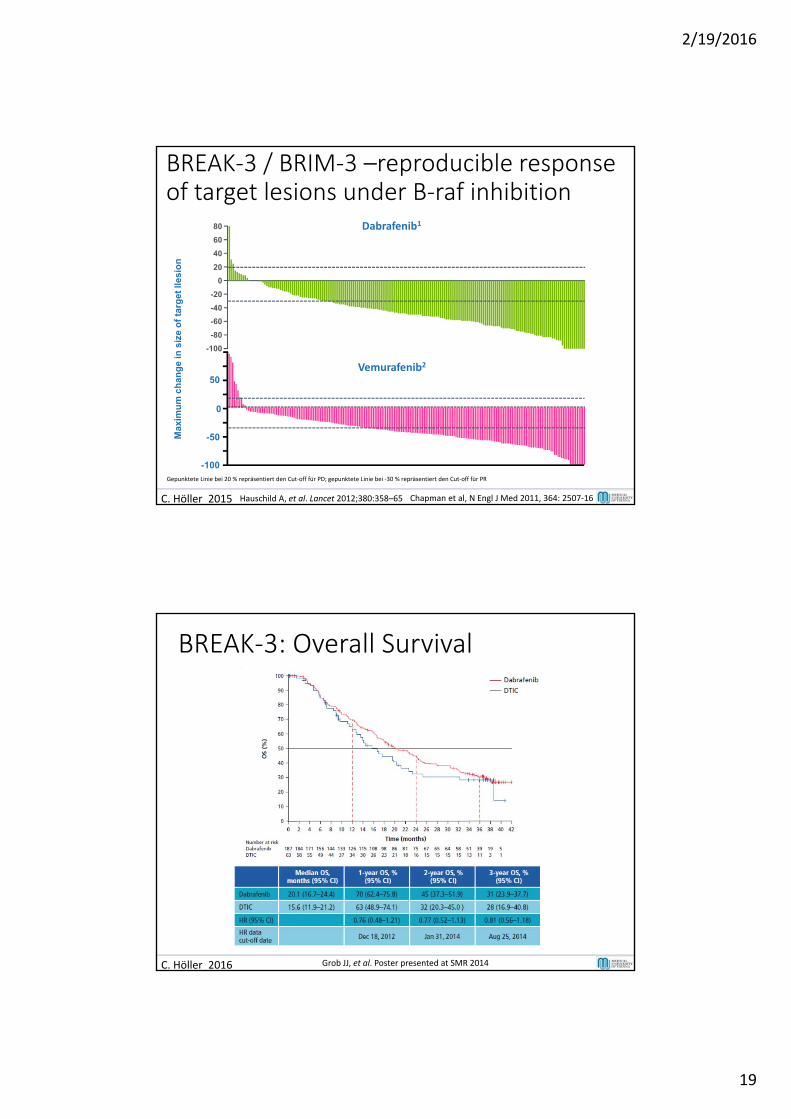
BREAK‐3 / BRIM‐3 –reproducible response of target lesions under B‐raf inhibition
Gepunktete Linie bei 20 % repräsentiert den Cut‐off für PD; gepunktete Linie bei ‐30 % repräsentiert den Cut‐off für PR
Max
imu
m c
han
ge
in s
ize
of
targ
et ll
esio
n
Dabrafenib180
60
40
20
0
-20
-40
-60
-80
-100
50
0
-50
-100
Vemurafenib2
C. Höller 2015 Hauschild A, et al. Lancet 2012;380:358–65 Chapman et al, N Engl J Med 2011, 364: 2507‐16
BREAK‐3: Overall Survival
C. Höller 2016 Grob JJ, et al. Poster presented at SMR 2014
2/19/2016
20
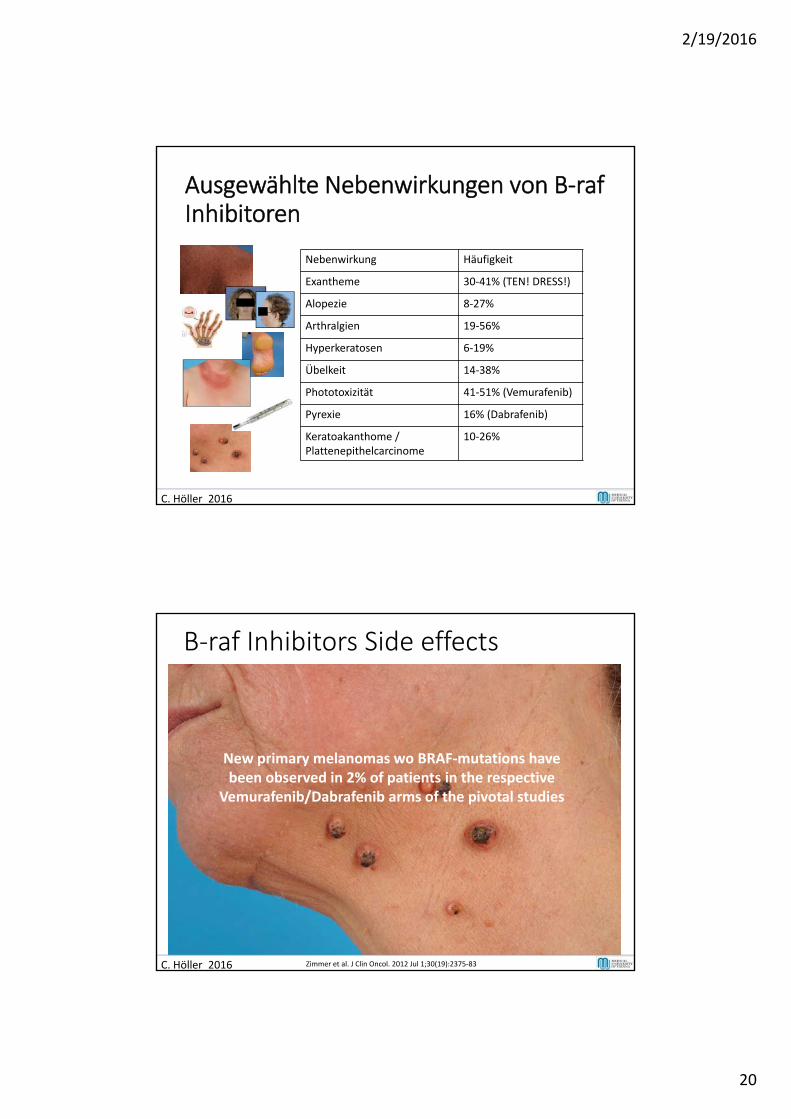
Ausgewählte Nebenwirkungen von B‐rafInhibitoren
C. Höller 2016
Nebenwirkung Häufigkeit
Exantheme 30‐41% (TEN! DRESS!)
Alopezie 8‐27%
Arthralgien 19‐56%
Hyperkeratosen 6‐19%
Übelkeit 14‐38%
Phototoxizität 41‐51% (Vemurafenib)
Pyrexie 16% (Dabrafenib)
Keratoakanthome / Plattenepithelcarcinome
10‐26%
B‐raf Inhibitors Side effects
C. Höller 2016
New primary melanomas wo BRAF‐mutations havebeen observed in 2% of patients in the respective
Vemurafenib/Dabrafenib arms of the pivotal studies
Zimmer et al. J Clin Oncol. 2012 Jul 1;30(19):2375‐83
2/19/2016
21
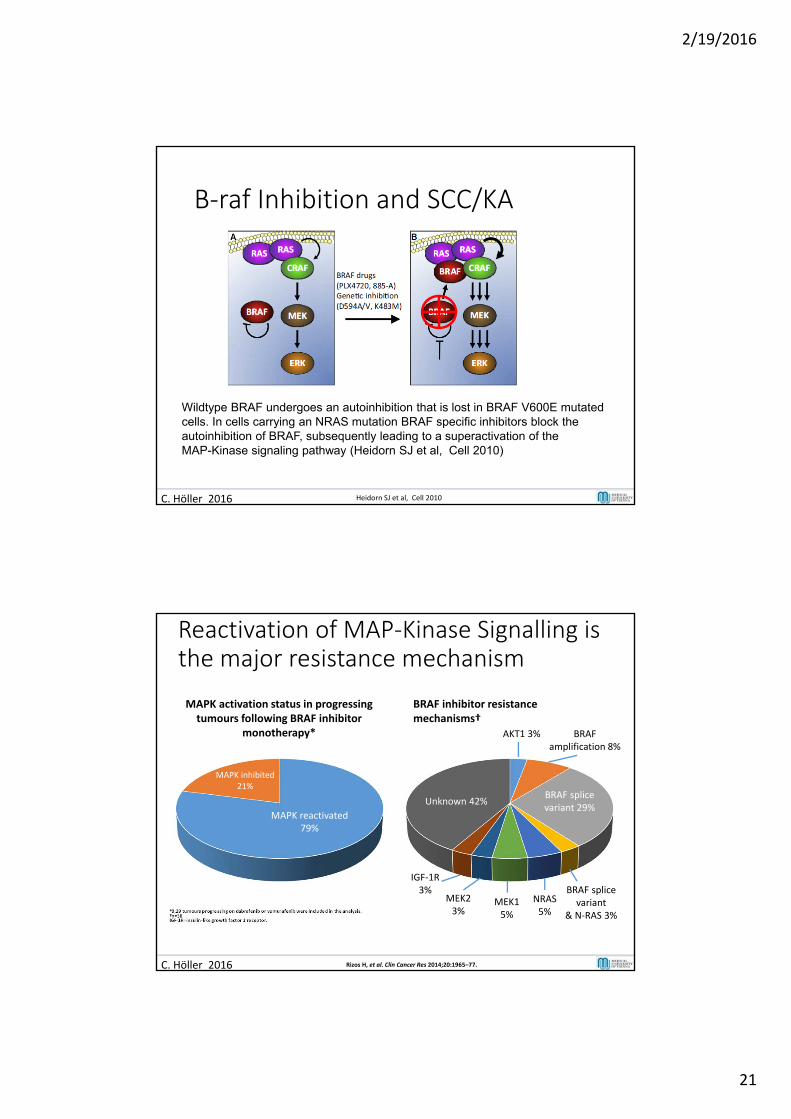
B‐raf Inhibition and SCC/KA
Wildtype BRAF undergoes an autoinhibition that is lost in BRAF V600E mutated cells. In cells carrying an NRAS mutation BRAF specific inhibitors block the autoinhibition of BRAF, subsequently leading to a superactivation of the MAP-Kinase signaling pathway (Heidorn SJ et al, Cell 2010)
C. Höller 2016 Heidorn SJ et al, Cell 2010
BRAF amplification 8%
Reactivation of MAP‐Kinase Signalling is the major resistance mechanism
*8,29 tumours progressing on dabrafenib or vemurafenib were included in the analysis.†n=38IGF‐1R=insulin‐like growth factor 1 receptor.
AKT1 3%
BRAF splice variant 29%
Unknown 42%
BRAF splicevariant
& N‐RAS 3%
MEK2 3%
IGF‐1R 3%
MEK1 5%
NRAS5%
BRAF inhibitor resistance mechanisms†
MAPK inhibited 21%
MAPK reactivated 79%
MAPK activation status in progressing tumours following BRAF inhibitor
monotherapy*
C. Höller 2016 Rizos H, et al. Clin Cancer Res 2014;20:1965–77.
2/19/2016
22
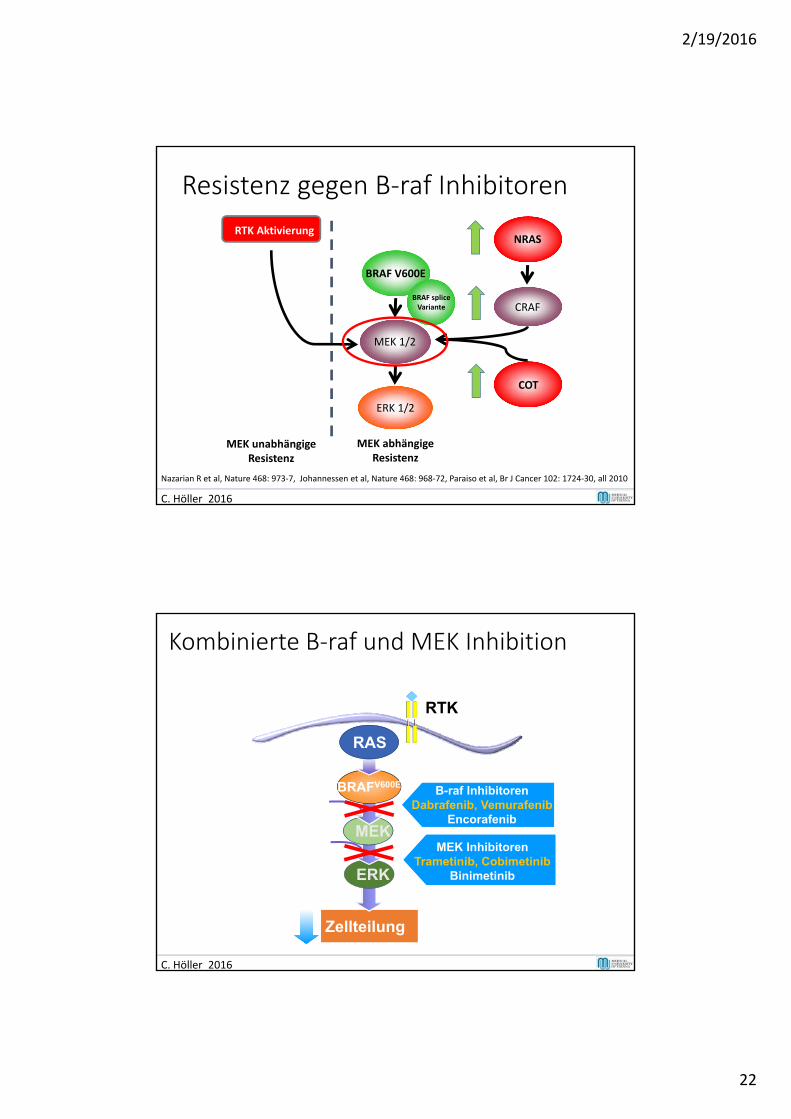
Resistenz gegen B‐raf Inhibitoren
C. Höller 2016
Nazarian R et al, Nature 468: 973‐7, Johannessen et al, Nature 468: 968‐72, Paraiso et al, Br J Cancer 102: 1724‐30, all 2010
RTK Aktivierung
BRAF V600E
MEK 1/2
ERK 1/2
NRAS
CRAF
COT
MEK unabhängigeResistenz
MEK abhängigeResistenz
BRAF spliceVariante
Kombinierte B‐raf und MEK Inhibition
Zellteilung
RTK
RAFATP
ATP
ERK
MEK
BRAFV600E
RAS
40-60% of melanomas B-raf InhibitorenDabrafenib, Vemurafenib
Encorafenib
MEK InhibitorenTrametinib, Cobimetinib
Binimetinib
C. Höller 2016
2/19/2016
23
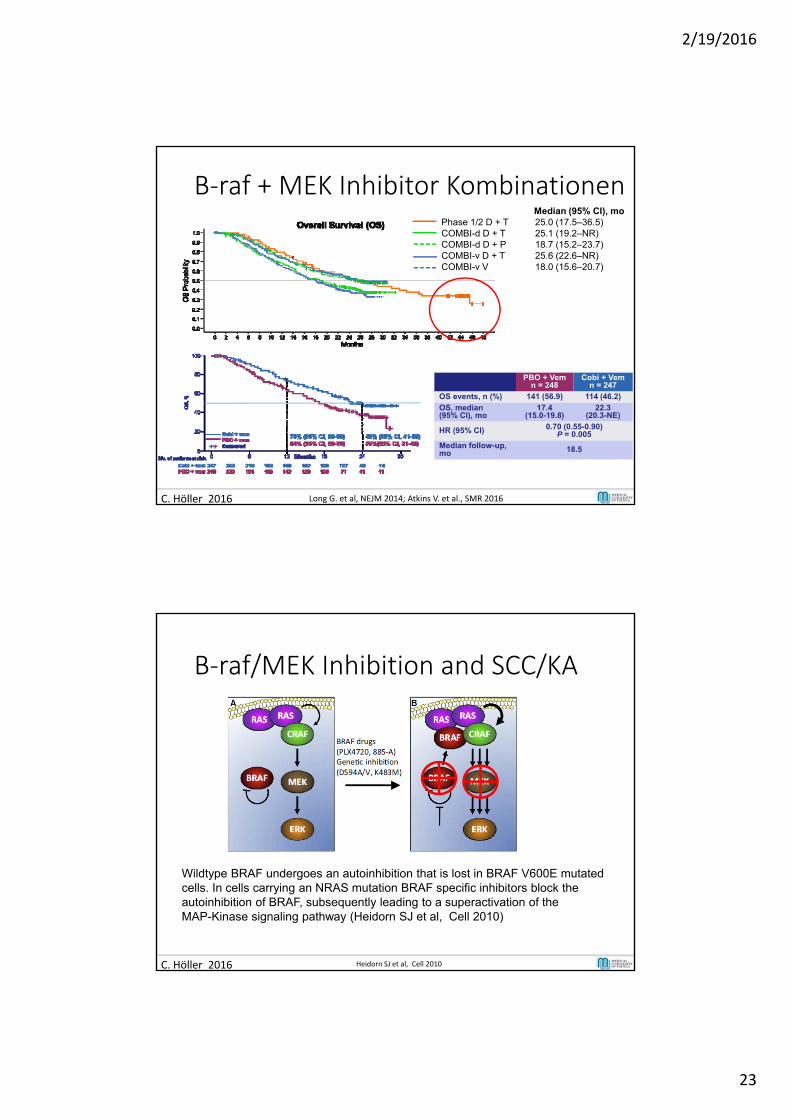
B‐raf + MEK Inhibitor Kombinationen
C. Höller 2016 Long G. et al, NEJM 2014; Atkins V. et al., SMR 2016
PBO + Vem n = 248
Cobi + Vem n = 247
OS events, n (%) 141 (56.9) 114 (46.2)
OS, median (95% CI), mo
17.4 (15.0-19.8)
22.3 (20.3-NE)
HR (95% CI) 0.70 (0.55-0.90)P = 0.005
Median follow-up, mo 18.5
Median (95% CI), moPhase 1/2 D + T 25.0 (17.5–36.5)COMBI-d D + T 25.1 (19.2–NR)COMBI-d D + P 18.7 (15.2–23.7)COMBI-v D + T 25.6 (22.6–NR)COMBI-v V 18.0 (15.6–20.7)
B‐raf/MEK Inhibition and SCC/KA
C. Höller 2016 Heidorn SJ et al, Cell 2010
Wildtype BRAF undergoes an autoinhibition that is lost in BRAF V600E mutated cells. In cells carrying an NRAS mutation BRAF specific inhibitors block the autoinhibition of BRAF, subsequently leading to a superactivation of the MAP-Kinase signaling pathway (Heidorn SJ et al, Cell 2010)
2/19/2016
24
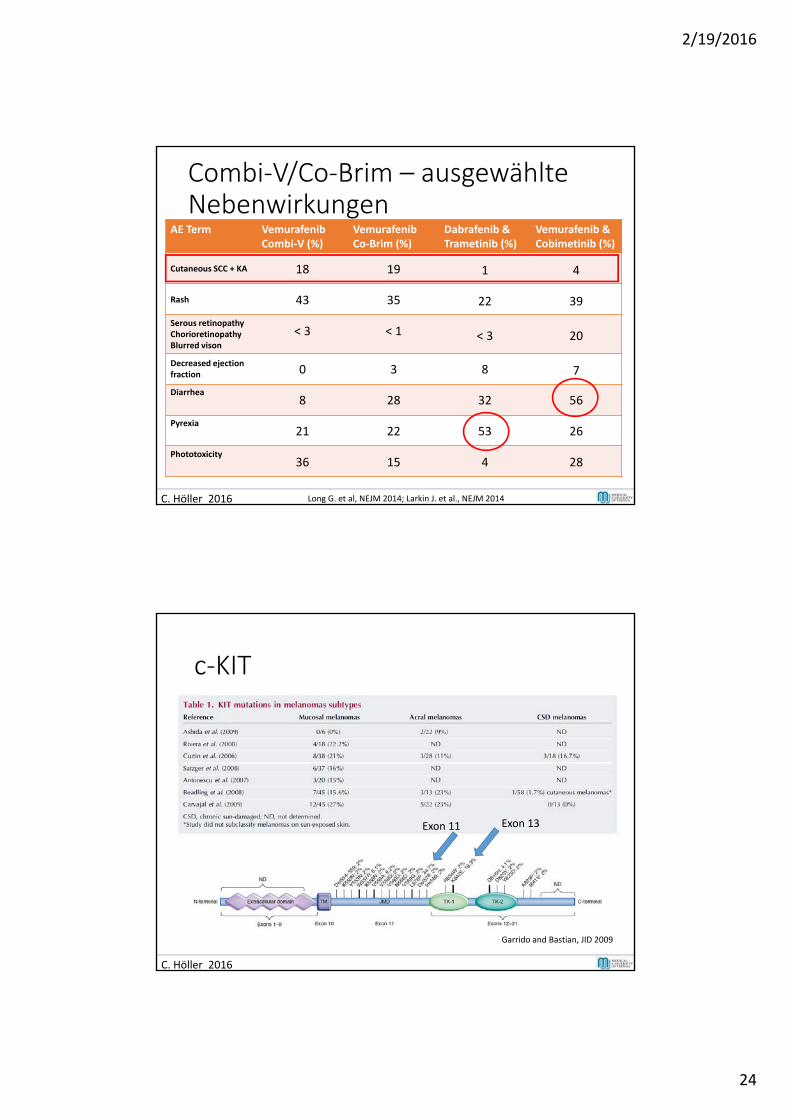
Combi‐V/Co‐Brim – ausgewählteNebenwirkungen
AE Term VemurafenibCombi‐V (%)
VemurafenibCo‐Brim (%)
Dabrafenib & Trametinib (%)
Vemurafenib & Cobimetinib (%)
Cutaneous SCC + KA 18 19 1 4
Rash 43 35 22 39
Serous retinopathyChorioretinopathyBlurred vison
< 3 < 1 < 3 20
Decreased ejection fraction 0 3 8 7
Diarrhea8 28 32 56
Pyrexia21 22 53 26
Phototoxicity36 15 4 28
C. Höller 2016 Long G. et al, NEJM 2014; Larkin J. et al., NEJM 2014
c‐KIT
Garrido and Bastian, JID 2009
C. Höller 2016
Exon 11 Exon 13
2/19/2016
25
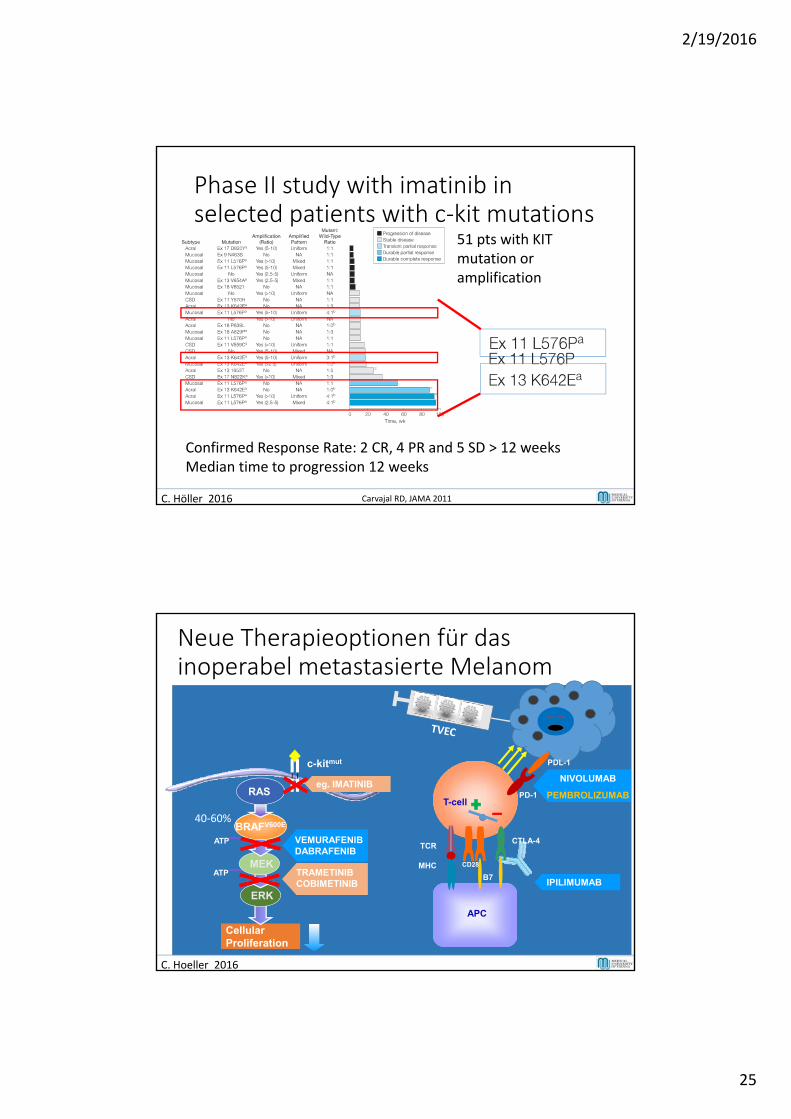
Phase II study with imatinib in selected patients with c‐kit mutations
51 pts with KIT mutation oramplification
Confirmed Response Rate: 2 CR, 4 PR and 5 SD > 12 weeksMedian time to progression 12 weeks
C. Höller 2016 Carvajal RD, JAMA 2011
Neue Therapieoptionen für das inoperabel metastasierte Melanom
CellularProliferation
RAFVEMURAFENIBDABRAFENIB
ATP
ATP
ERK
MEK
BRAFV600E
RAS
MHC
TCR
IPILIMUMAB
T-cell
APC
B7
CD28
C. Hoeller 2016
40‐60%
TRAMETINIBCOBIMETINIB
PD-1
CTLA-4
NIVOLUMAB
PEMBROLIZUMAB
PDL-1c-kitmut
eg. IMATINIBeg. IMATINIB
2/19/2016
26
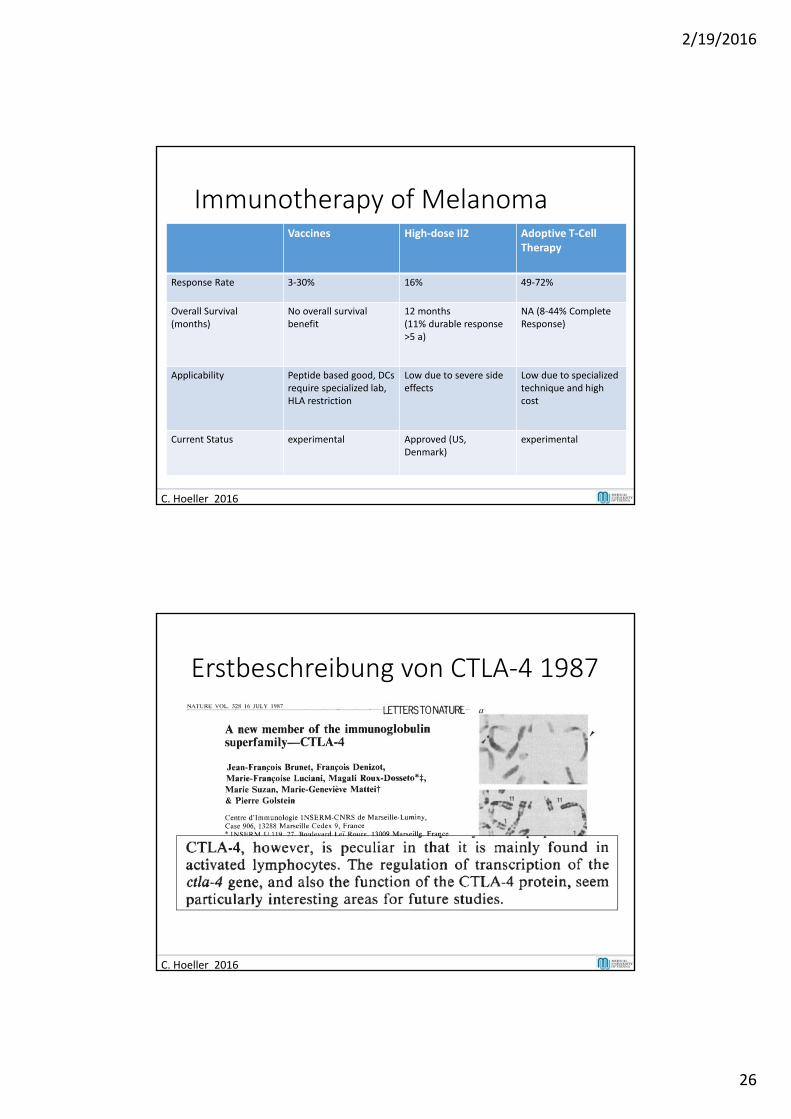
Immunotherapy of Melanoma
C. Hoeller 2016
Vaccines High‐dose Il2 Adoptive T‐Cell Therapy
Response Rate 3‐30% 16% 49‐72%
Overall Survival (months)
No overall survival benefit
12 months (11% durable response >5 a)
NA (8‐44% Complete Response)
Applicability Peptide based good, DCs require specialized lab, HLA restriction
Low due to severe side effects
Low due to specialized technique and high cost
Current Status experimental Approved (US, Denmark)
experimental
Erstbeschreibung von CTLA‐4 1987
C. Hoeller 2016
2/19/2016
27
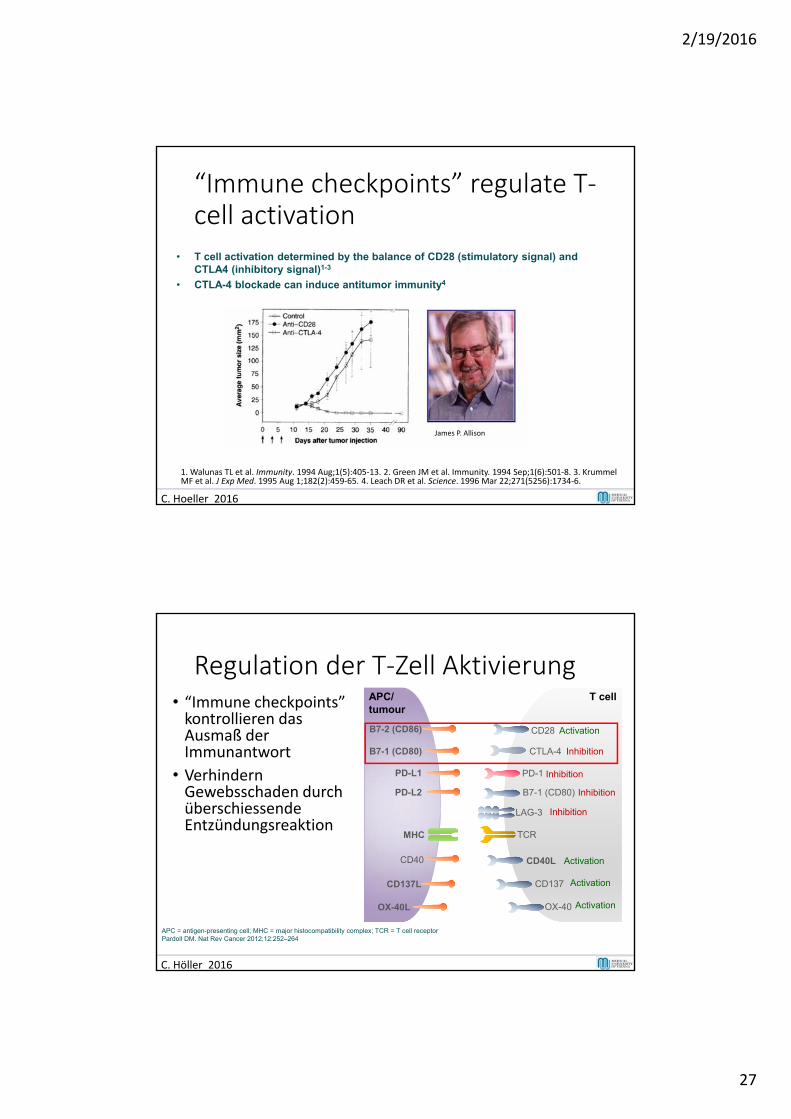
“Immune checkpoints” regulate T‐cell activation
• T cell activation determined by the balance of CD28 (stimulatory signal) and CTLA4 (inhibitory signal)1-3
• CTLA-4 blockade can induce antitumor immunity4
C. Hoeller 2016
1. Walunas TL et al. Immunity. 1994 Aug;1(5):405‐13. 2. Green JM et al. Immunity. 1994 Sep;1(6):501‐8. 3. Krummel MF et al. J Exp Med. 1995 Aug 1;182(2):459‐65. 4. Leach DR et al. Science. 1996 Mar 22;271(5256):1734‐6.
James P. Allison
Regulation der T‐Zell Aktivierung• “Immune checkpoints” kontrollieren das Ausmaß der Immunantwort
• VerhindernGewebsschaden durchüberschiessendeEntzündungsreaktion
APC/tumour
T cell
PD-1
B7-1 (CD80)
PD-L1
PD-L2
CD40 CD40L
CD137
OX-40
CD137L
OX-40L
LAG-3
MHC
CD28 ActivationB7-2 (CD86)
B7-1 (CD80) CTLA-4 Inhibition
TCR
Inhibition
Inhibition
Activation
Activation
Activation
Inhibition
APC = antigen-presenting cell; MHC = major histocompatibility complex; TCR = T cell receptorPardoll DM. Nat Rev Cancer 2012;12:252–264
C. Höller 2016
2/19/2016
28
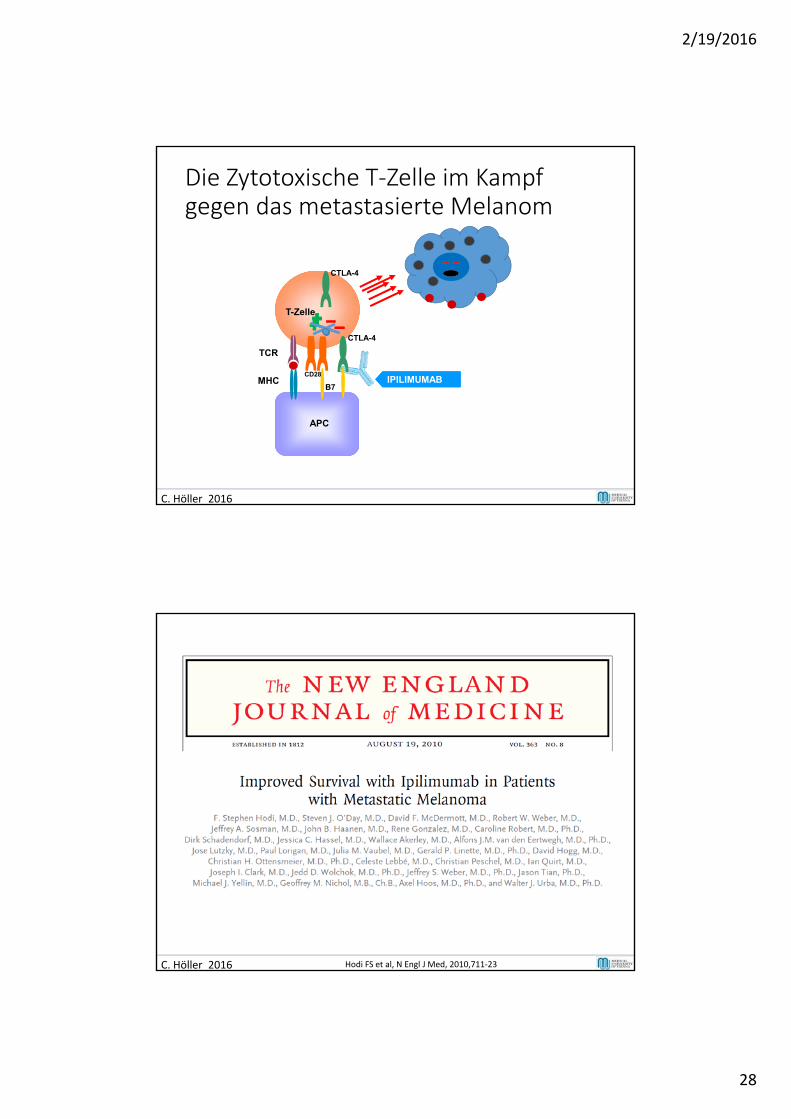
Die Zytotoxische T‐Zelle im Kampf gegen das metastasierte Melanom
MHC
TCR
IPILIMUMAB
T-Zelle
APC
B7
CD28
C. Höller 2016
CTLA-4
CTLA-4
Vollständig humaner IgG1 Antikörper welcher gegen CTLA4 gerichtet ist. Halbwertszeit: 12.5 Tage
MHC
TCR
3
C. Höller 2016 Hodi FS et al, N Engl J Med, 2010,711‐23
2/19/2016
29
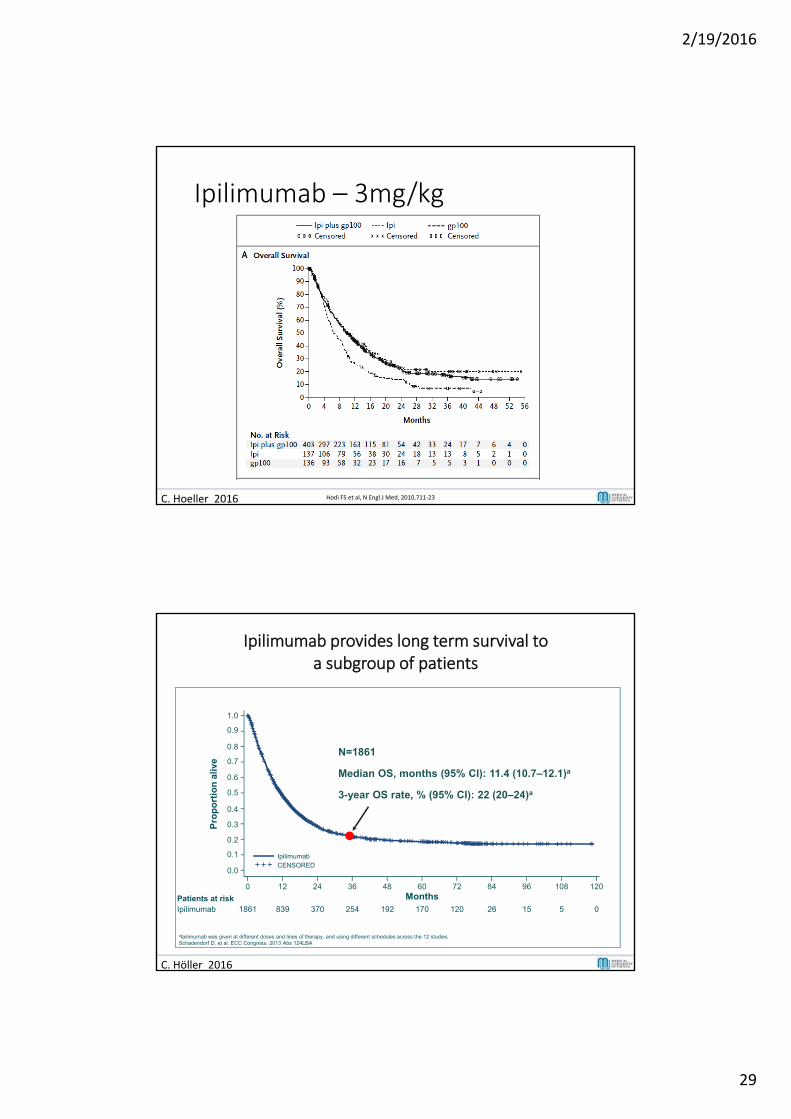
Ipilimumab – 3mg/kg
Hodi FS et al, N Engl J Med, 2010,711‐23 C. Höller 2012C. Hoeller 2016 Hodi FS et al, N Engl J Med, 2010,711‐23
0.0
0.1
0.2
0.3
0.4
0.5
0.6
0.7
0.8
0.9
1.0
Ipilimumab provides long term survival to a subgroup of patients
Patients at riskIpilimumab 1861 839 370 254 192 170 120 26 15 5 0
N=1861
0 12 24 36 48 60 72 84 96 108 120
Pro
po
rtio
n a
live
Months
Median OS, months (95% CI): 11.4 (10.7–12.1)a
3-year OS rate, % (95% CI): 22 (20–24)a
IpilimumabCENSORED
aIpilimumab was given at different doses and lines of therapy, and using different schedules across the 12 studiesSchadendorf D, et al. ECC Congress. 2013 Abs 124LBA
C. Höller 2016
2/19/2016
30
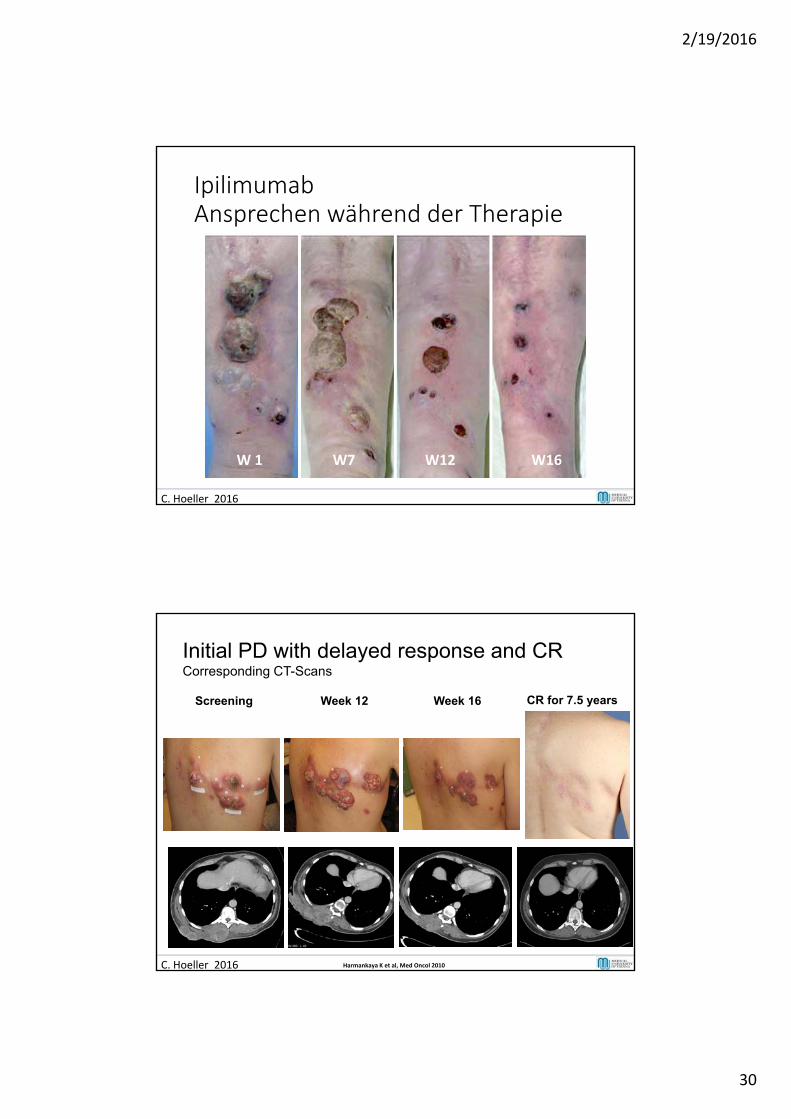
IpilimumabAnsprechen während der Therapie
W 1 W7 W12 W16
C. Hoeller 2016
C. Hoeller 2016 Harmankaya K et al, Med Oncol 2010
Initial PD with delayed response and CRCorresponding CT-Scans
Screening Week 12 Week 16 CR for 7.5 years
2/19/2016
31
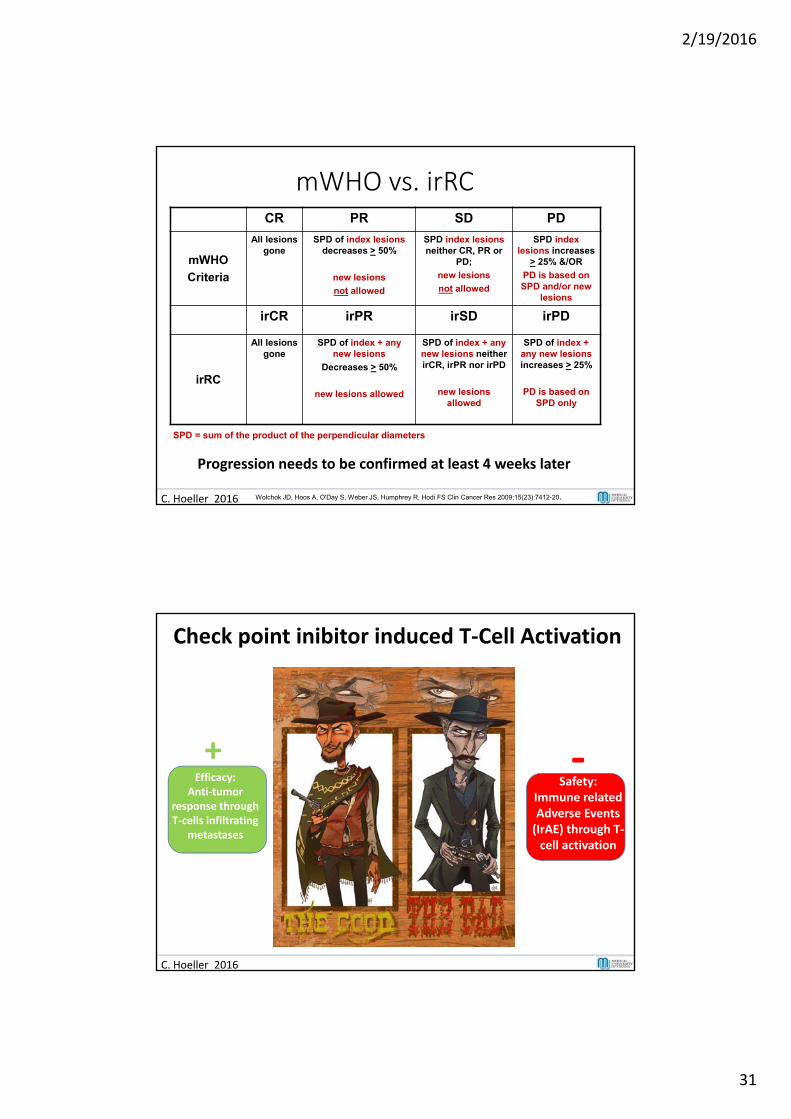
mWHO vs. irRCCR PR SD PD
mWHO
Criteria
All lesions gone
SPD of index lesions decreases > 50%
new lesions
not allowed
SPD index lesions neither CR, PR or
PD;
new lesions
not allowed
SPD index lesions increases
> 25% &/OR
PD is based on SPD and/or new
lesions
irCR irPR irSD irPD
irRC
All lesions gone
SPD of index + any new lesions
Decreases > 50%
new lesions allowed
SPD of index + any new lesions neither irCR, irPR nor irPD
new lesions allowed
SPD of index + any new lesions increases > 25%
PD is based on SPD only
SPD = sum of the product of the perpendicular diameters
C. Hoeller 2016 Wolchok JD, Hoos A, O'Day S, Weber JS, Humphrey R, Hodi FS Clin Cancer Res 2009;15(23):7412-20.
17
Progression needs to be confirmed at least 4 weeks later
Check point inibitor induced T‐Cell Activation
Efficacy: Anti‐tumor
response throughT‐cells infiltrating
metastases
+ ‐Safety:
Immune relatedAdverse Events (IrAE) through T‐cell activation
C. Hoeller 2016
2/19/2016
32
Side effects observed under treatment with check point inhibitors
Encephalitis
Thyroiditis
FatigueHypophysitis
Pneumonitis
Myositis, Myasthenia gravis
Neuritis, Guillaine BarreSyndrome
Hepatitis
Adrenal insufficiency
Nephritis
Pancreatitis, Hyperglycemia, Diabetes
Uveitis
Arthritis
Colitis
Vasculitis
Thrombopenia
Rash (including but not limited to Dermatomyositis, Bulluous Pemhigoid, SJS/TEN, Psoriasis)
C. Hoeller 2016
C. Hoeller 2016
What happens to the tumor response if you use immunomodulatingagents?
46
Baurain et al. ASCO 2012, Abstract 8539
2/19/2016
33
PD‐1 blockade in tumor models
65
C. Hoeller 2016 Iway et al.,PNAS 2002
Tasuku Honjo
CD8+ T‐cell Exhaustion Due to Chronic Antigen Simulation
Cytotoxic capacity
Proliferative
Potential
Apoptosis
Naïve CD8+
T cell Antigen +costimulation
Effector CD8+ T cell
PD‐1
LAG‐3
CD244 (2B4)
CD160 (and so on)
Highly polyfunctional memory CD8+ T cell
CD8+ T‐cell Exhaustion
Antigen persists
Antigen cleared
66
C. Hoeller 2016 Modified from: Wherry et al. Nat Immunol. 2011;12(6):492‐499.
2/19/2016
34
PD1 – Blockade: Mode of action
Recognition of tumour by T cell through MHC/antigen interaction mediates IFNγ release and PD‐L1/2
upregulation on tumour
Priming and activation of T cells through MHC/antigen and CD28/B7 interactions with antigen‐presenting cells
MHC
PD‐L1
PD‐1 PD‐1
PD‐1 PD‐1
PD1 Receptor Blocking Ab
T‐cellreceptor
T cellreceptor
PD‐L1PD‐L2
PD‐L2
MHC
CD28 B7
T cell
NFκBOther
PI3KDendritic
cellTumour cell
IFNγIFNγR
Shp‐2
Shp‐2
67
C. Hoeller 2016 Pardoll DM. Nat Rev Cancer. 2012 Mar 22;12(4):252‐64.
C. Höller 2016
2/19/2016
35
C. Hoeller 2016 G Long et al., N Engl J Med. 2015 Jan 22;372(4):320‐30
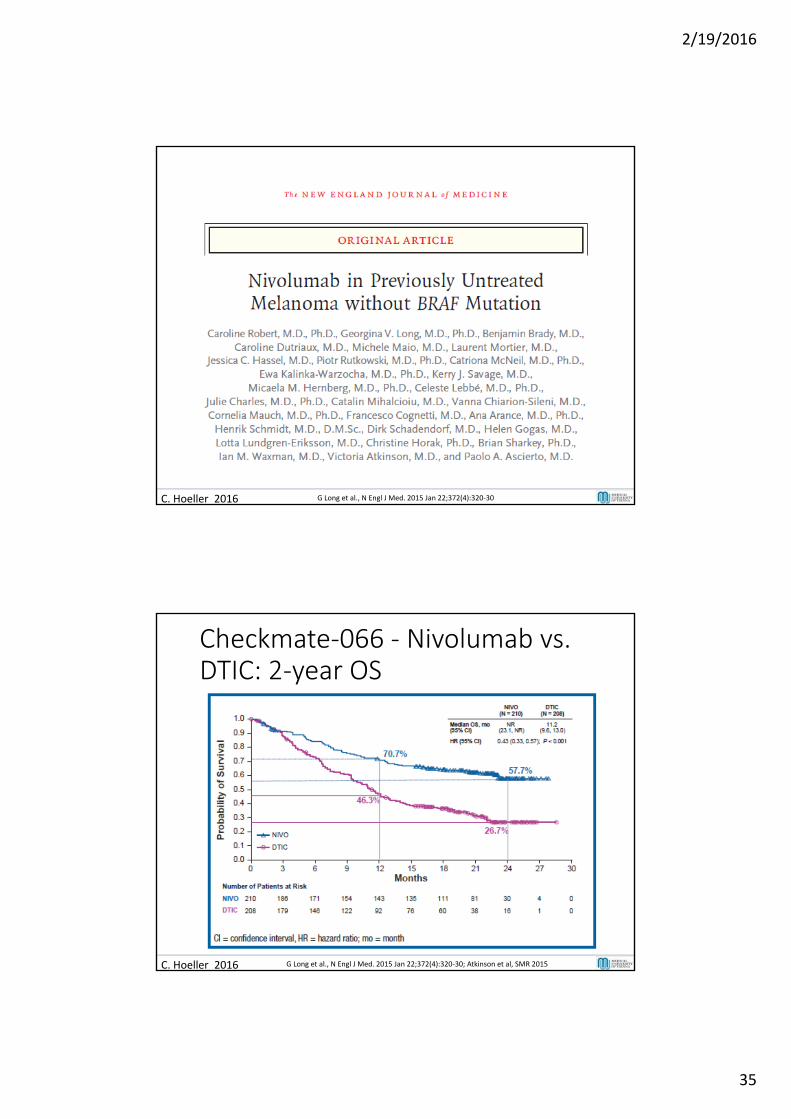
Checkmate‐066 ‐ Nivolumab vs. DTIC: 2‐year OS
C. Hoeller 2016 G Long et al., N Engl J Med. 2015 Jan 22;372(4):320‐30; Atkinson et al, SMR 2015
2/19/2016
36
C. Hoeller 2016
2/19/2016
37
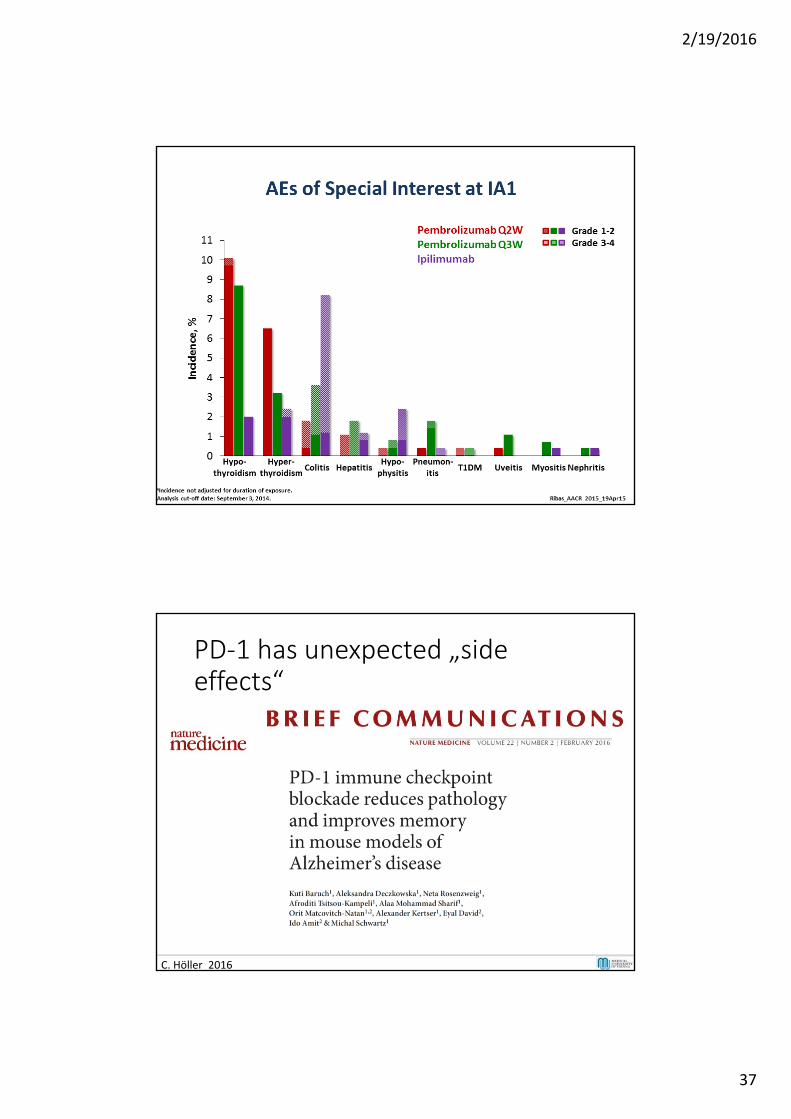
PD‐1 has unexpected „sideeffects“
C. Höller 2016
2/19/2016
38
Active immunotherapy
Adoptive cell transfer (ACT)immunotherapy
IL-2IFNIL-15IL-21
Peptide vaccineDC vaccineGenetic vaccine
OX40
CD137
CD40
PD-1CTLA4
T cell cloningTIL therapy
T cell checkpointblocking and
stimulatingantibodies
TCR or CAR genetic engineering
Immunotherapy– T cell versus melanoma
C. Höller 2016 Slide courtesy of Toni Ribas, UCLA
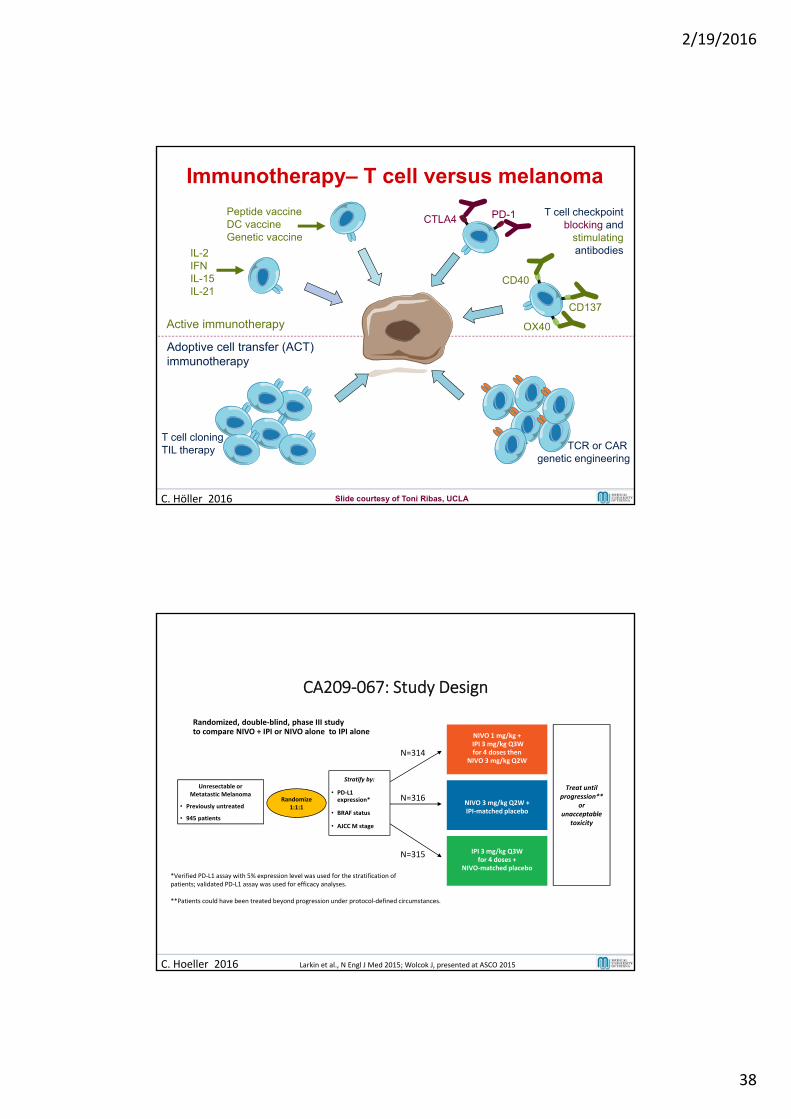
CA209‐067: Study Design
Randomized, double‐blind, phase III studyto compare NIVO + IPI or NIVO alone to IPI alone
Unresectable orMetatastic Melanoma
• Previously untreated
• 945 patients
Treat until progression**
orunacceptable
toxicity
NIVO 3 mg/kg Q2W +IPI‐matched placebo
NIVO 1 mg/kg + IPI 3 mg/kg Q3W for 4 doses then
NIVO 3 mg/kg Q2W
IPI 3 mg/kg Q3W for 4 doses +
NIVO‐matched placebo
Randomize1:1:1
Stratify by:
• PD‐L1 expression*
• BRAF status
• AJCC M stage
*Verified PD‐L1 assay with 5% expression level was used for the stratification of patients; validated PD‐L1 assay was used for efficacy analyses.
**Patients could have been treated beyond progression under protocol‐defined circumstances.
N=314
N=316
N=315
C. Hoeller 2016 Larkin et al., N Engl J Med 2015; Wolcok J, presented at ASCO 2015
2/19/2016
39
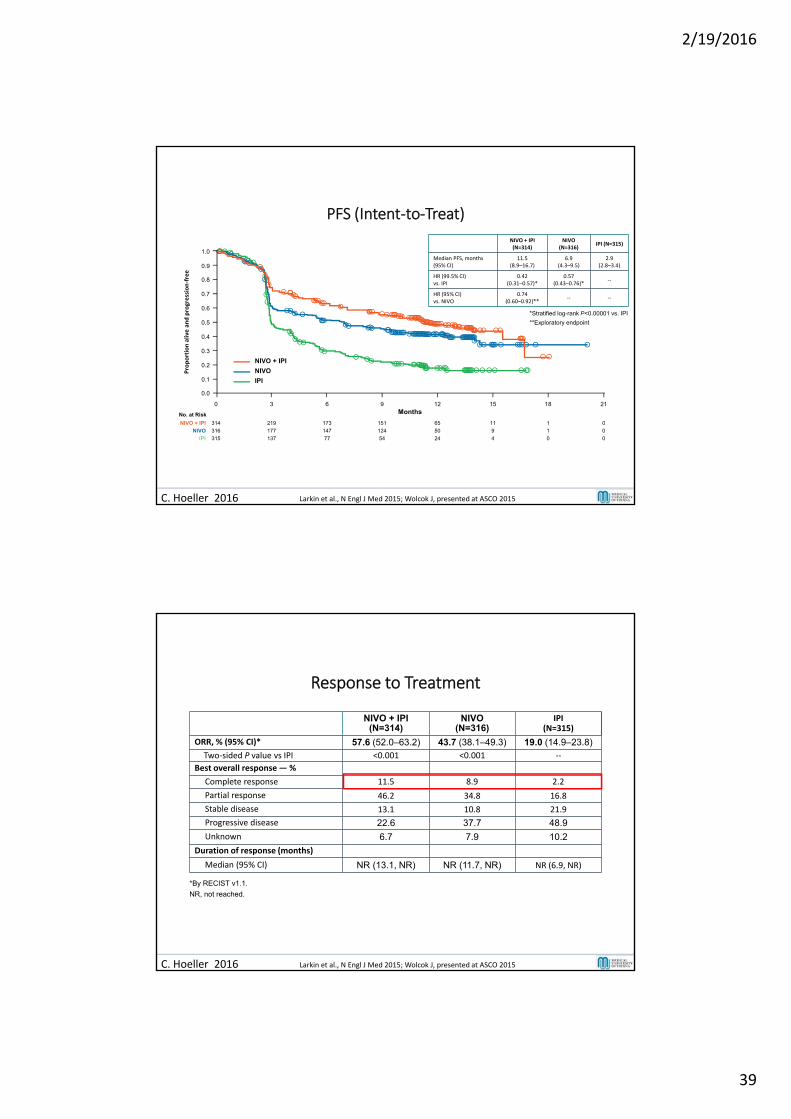
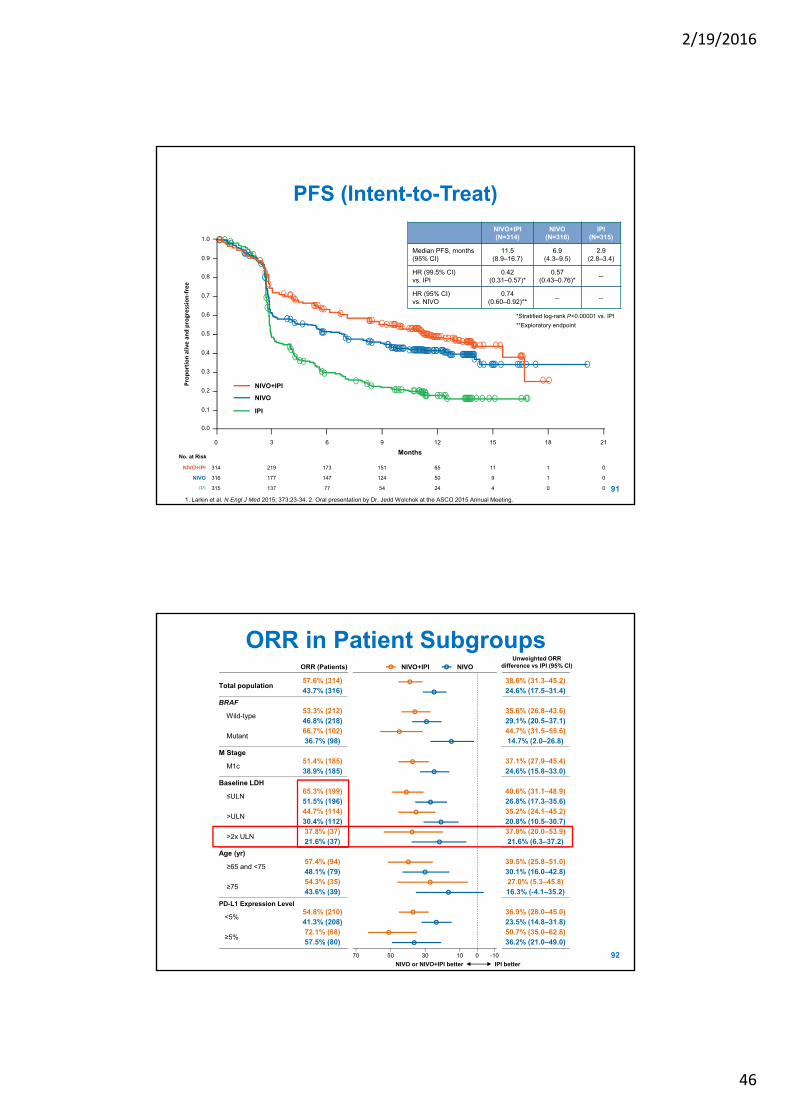
PFS (Intent‐to‐Treat)
NIVO + IPI (N=314)
NIVO(N=316)
IPI (N=315)
Median PFS, months (95% CI)
11.5 (8.9–16.7)
6.9 (4.3–9.5)
2.9 (2.8–3.4)
HR (99.5% CI)vs. IPI
0.42 (0.31–0.57)*
0.57(0.43–0.76)*
‐‐
HR (95% CI)vs. NIVO
0.74 (0.60–0.92)**
‐‐ ‐‐
*Stratified log-rank P<0.00001 vs. IPI
**Exploratory endpoint
No. at Risk
314NIVO + IPI 173 151 65 11 1219 0
316NIVO 147 124 50 9 1177 0
315IPI 77 54 24 4 0137 0
0 6 9 12 15 183 21
NIVO
NIVO + IPI
IPI
Months
1.0
0.9
0.8
0.7
0.6
0.5
0.4
0.3
0.2
0.1
0.0
Proportion alive and progression‐free
C. Hoeller 2016 Larkin et al., N Engl J Med 2015; Wolcok J, presented at ASCO 2015
Response to Treatment
NIVO + IPI(N=314)
NIVO(N=316)
IPI(N=315)
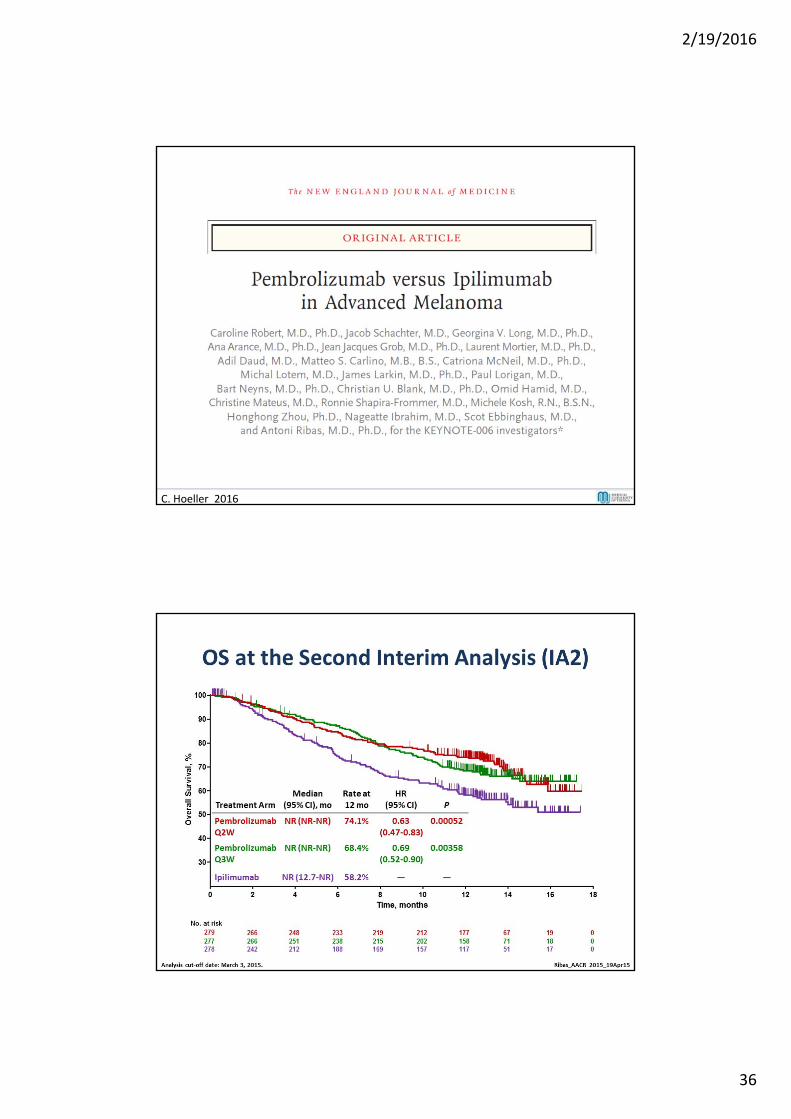
ORR, % (95% CI)* 57.6 (52.0–63.2) 43.7 (38.1–49.3) 19.0 (14.9–23.8)Two‐sided P value vs IPI <0.001 <0.001 ‐‐
Best overall response — %
Complete response 11.5 8.9 2.2
Partial response 46.2 34.8 16.8
Stable disease 13.1 10.8 21.9
Progressive disease 22.6 37.7 48.9
Unknown 6.7 7.9 10.2
Duration of response (months)
Median (95% CI) NR (13.1, NR) NR (11.7, NR) NR (6.9, NR)
*By RECIST v1.1.
NR, not reached.
C. Hoeller 2016 Larkin et al., N Engl J Med 2015; Wolcok J, presented at ASCO 2015
2/19/2016
40
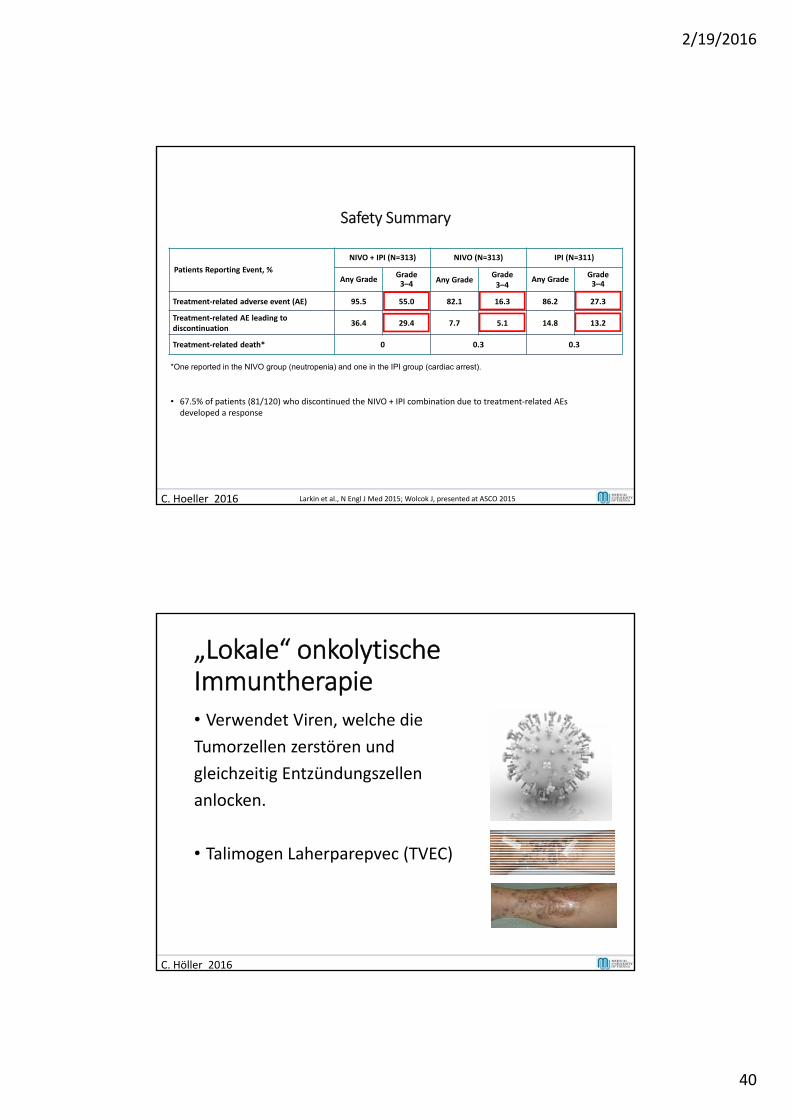
Safety Summary
Patients Reporting Event, %
NIVO + IPI (N=313) NIVO (N=313) IPI (N=311)
Any GradeGrade 3–4 Any Grade
Grade 3–4
Any GradeGrade 3–4
Treatment‐related adverse event (AE) 95.5 55.0 82.1 16.3 86.2 27.3
Treatment‐related AE leading to discontinuation
36.4 29.4 7.7 5.1 14.8 13.2
Treatment‐related death* 0 0.3 0.3
*One reported in the NIVO group (neutropenia) and one in the IPI group (cardiac arrest).
• 67.5% of patients (81/120) who discontinued the NIVO + IPI combination due to treatment‐related AEs developed a response
C. Hoeller 2016 Larkin et al., N Engl J Med 2015; Wolcok J, presented at ASCO 2015
„Lokale“ onkolytischeImmuntherapie• Verwendet Viren, welche die
Tumorzellen zerstören und
gleichzeitig Entzündungszellen
anlocken.
• Talimogen Laherparepvec (TVEC)
C. Höller 2016
2/19/2016
41
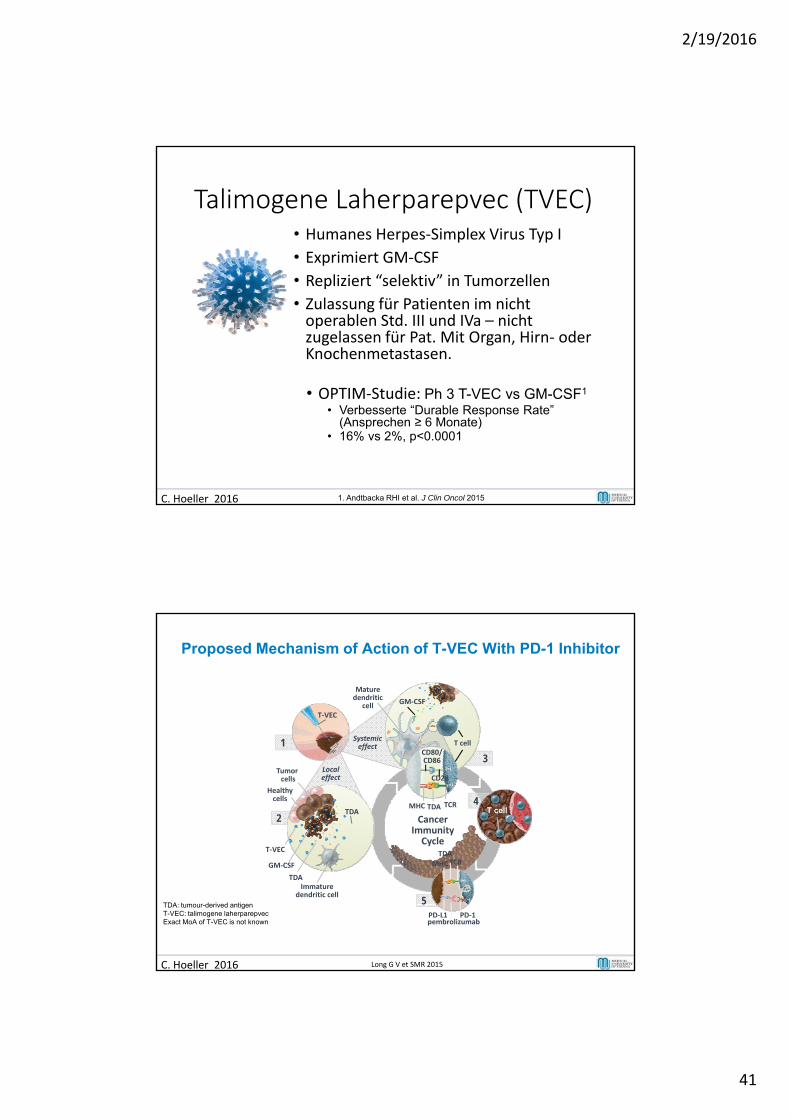
Talimogene Laherparepvec (TVEC)• Humanes Herpes‐Simplex Virus Typ I
• Exprimiert GM‐CSF
• Repliziert “selektiv” in Tumorzellen
• Zulassung für Patienten im nichtoperablen Std. III und IVa – nichtzugelassen für Pat. Mit Organ, Hirn‐ oderKnochenmetastasen.
• OPTIM‐Studie: Ph 3 T-VEC vs GM-CSF1
• Verbesserte “Durable Response Rate” (Ansprechen ≥ 6 Monate)
• 16% vs 2%, p<0.0001
C. Hoeller 2016 1. Andtbacka RHI et al. J Clin Oncol 2015
Proposed Mechanism of Action of T-VEC With PD-1 Inhibitor
TDA: tumour-derived antigenT-VEC: talimogene laherparepvecExact MoA of T-VEC is not known
1
T‐VEC
Systemiceffect
3
Mature dendritic
cell
T cell
GM‐CSF
TDAMHC TCR
CD80/CD86
CD28
4T cell
5
TDA
MHCTCR
PD‐L1 PD‐1pembrolizumab
Cancer ImmunityCycle
Localeffect
2
Healthy cells
T‐VEC
GM‐CSF
TDAImmature
dendritic cell
Tumor cells
TDA
C. Hoeller 2016 Long G V et SMR 2015
2/19/2016
42
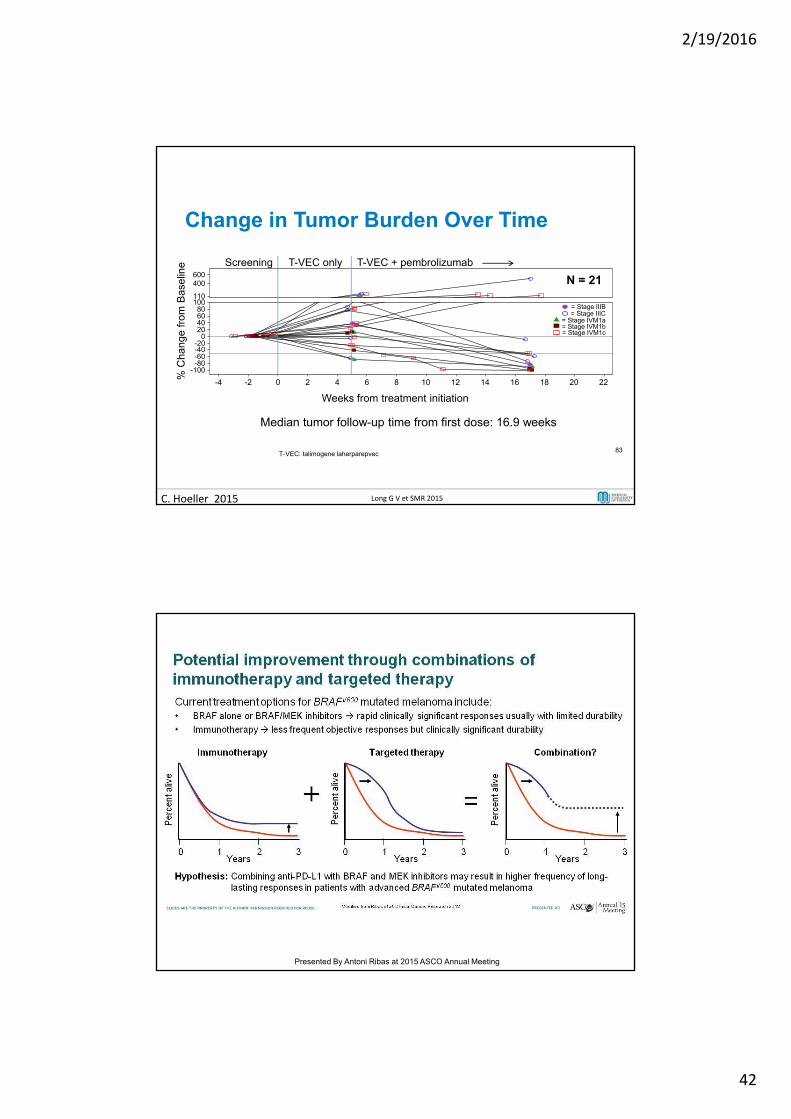
Change in Tumor Burden Over Time
T-VEC only T-VEC + pembrolizumabScreening
Median tumor follow-up time from first dose: 16.9 weeks
-4 -2 0 2 4 6 8 10 12 14 16 18 20 22
Weeks from treatment initiation
-100-80-60-40-20
020406080
100110
400600
% C
hang
e fr
om B
asel
ine
= Stage IIIB= Stage IIIC
= Stage IVM1a= Stage IVM1b= Stage IVM1c
T-VEC: talimogene laherparepvec83
N = 21
C. Hoeller 2015 Long G V et SMR 2015
Slide 3
Presented By Antoni Ribas at 2015 ASCO Annual Meeting
2/19/2016
43
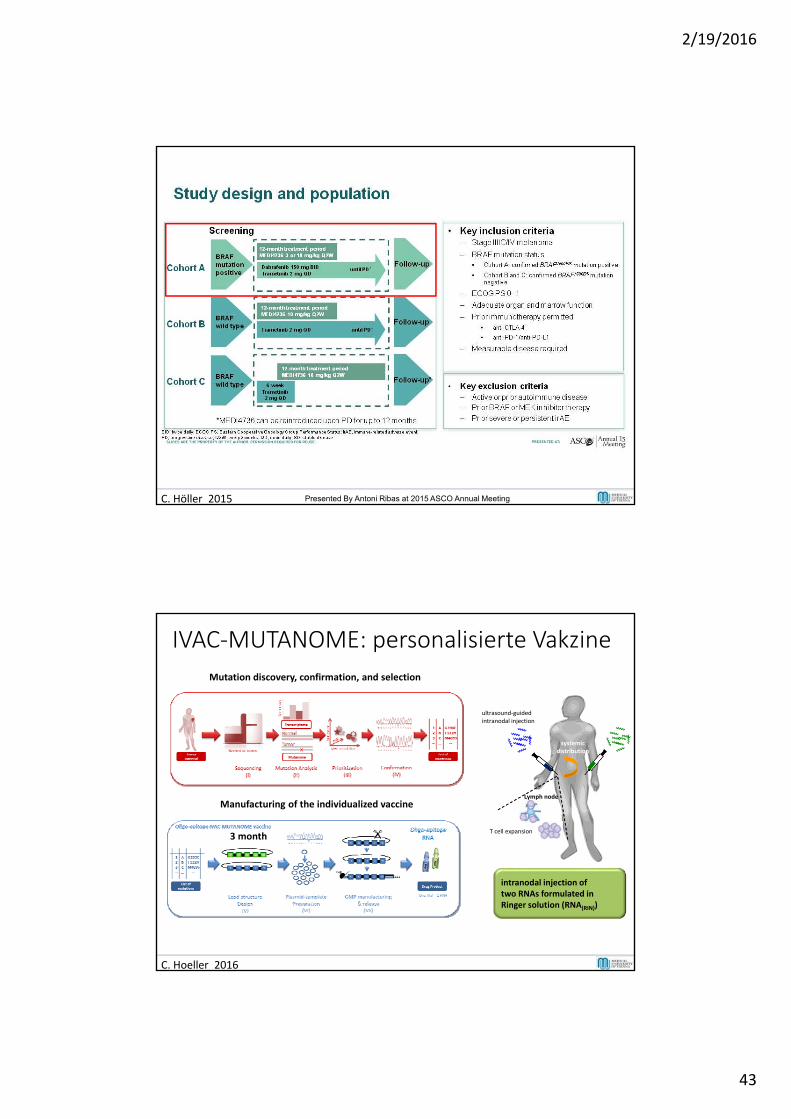
Study design and population
C. Höller 2015 Presented By Antoni Ribas at 2015 ASCO Annual Meeting
Manufacturing of the individualized vaccine
Mutation discovery, confirmation, and selection
3 month
C. Hoeller 2016
T cell expansion
Lymph node
systemicdistribution
ultrasound‐guidedintranodal injection
intranodal injection oftwo RNAs formulated in Ringer solution (RNA(RIN))
IVAC‐MUTANOME: personalisierte Vakzine
2/19/2016
44
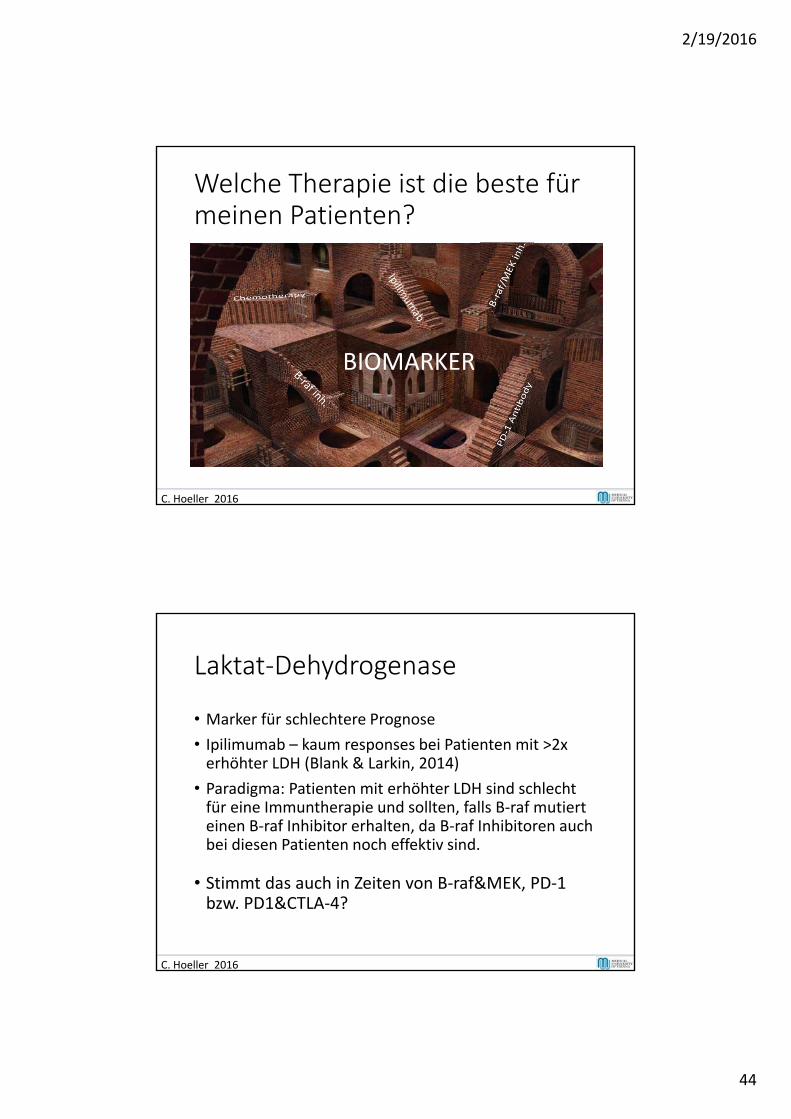
Welche Therapie ist die beste fürmeinen Patienten?
C. Hoeller 2016
BIOMARKER
Laktat‐Dehydrogenase
• Marker für schlechtere Prognose
• Ipilimumab – kaum responses bei Patienten mit >2x erhöhter LDH (Blank & Larkin, 2014)
• Paradigma: Patienten mit erhöhter LDH sind schlecht für eine Immuntherapie und sollten, falls B‐raf mutiert einen B‐raf Inhibitor erhalten, da B‐raf Inhibitoren auch bei diesen Patienten noch effektiv sind.
• Stimmt das auch in Zeiten von B‐raf&MEK, PD‐1 bzw. PD1&CTLA‐4?
C. Hoeller 2016
2/19/2016
45
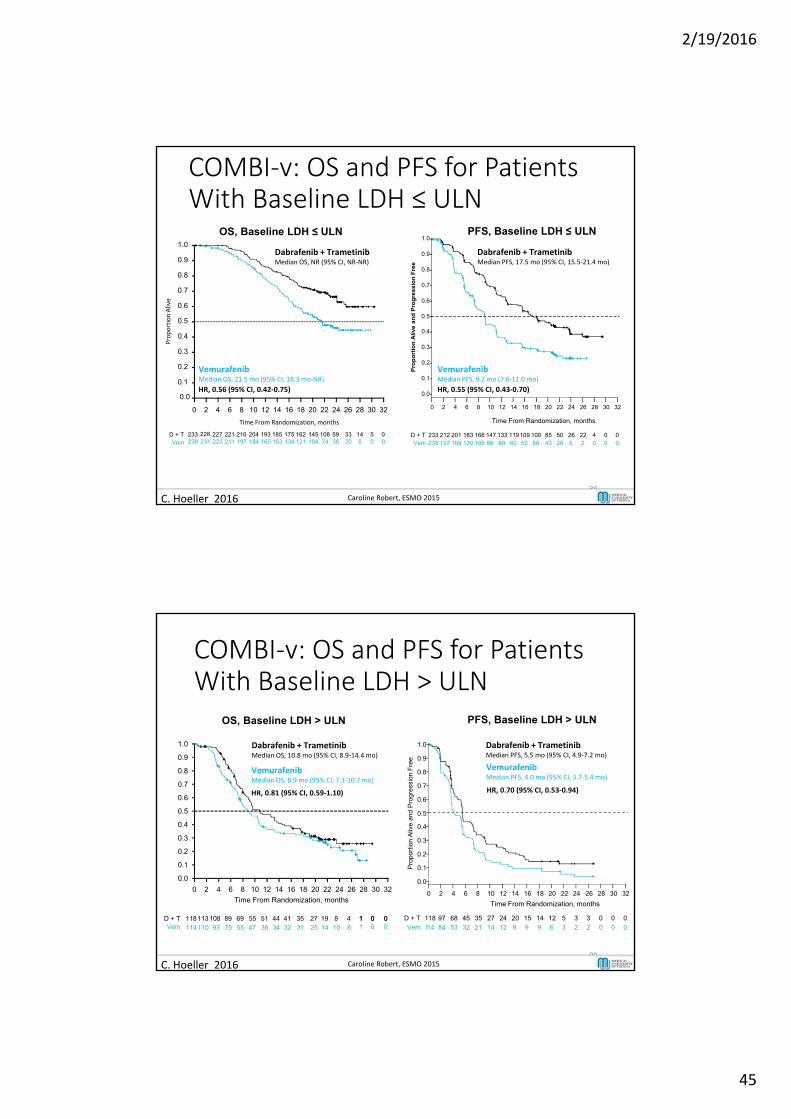
COMBI‐v: OS and PFS for Patients With Baseline LDH ≤ ULN
89
OS, Baseline LDH ≤ ULN1.0
0.9
0.8
0.7
0.6
0.5
0.4
0.3
0.2
0.1
0.0
0 2 4 6 8 10 12 14 16 18 20 22 24 26 28 30 32
Time From Randomization, months
233 228 227 221 216 204 193 185 175 162 145 108 59 33 14 5 0238 231 222 211 197 184 165 153 134 121 104 74 36 20 6 0 0
0
0.0
0.1
0.2
0.3
0.4
0.5
0.6
0.7
0.8
0.9
1.0
2 4 6 8 10 12 14 16 18 20 22 24 26 28 30 32
233 212 201 183 166 147 133 119109 100 85 50 26 22 4 0 0238
D + TVem 197 169 130 106 86 69 60 52 50 43 20 6 2 0 0 0
Time From Randomization, monthsP
rop
ort
ion
Ali
ve a
nd
Pro
gre
ss
ion
Fre
e
Vemurafenib Median OS, 21.5 mo (95% CI, 18.3 mo‐NR)
HR, 0.56 (95% CI, 0.42‐0.75)
Dabrafenib + Trametinib Median OS, NR (95% CI, NR‐NR)
Vemurafenib Median PFS, 9.2 mo (7.6‐11.0 mo)
HR, 0.55 (95% CI, 0.43‐0.70)
Dabrafenib + Trametinib Median PFS, 17.5 mo (95% CI, 15.5‐21.4 mo)
PFS, Baseline LDH ≤ ULN
D + TVem
Proportion Alive
C. Hoeller 2016 Caroline Robert, ESMO 2015
0
0.0
0.1
0.2
0.3
0.4
0.5
0.6
0.7
0.8
0.9
1.0
2 4 6 8 10 12 14 16 18 20 22 24 26 28 30 32
118 97 68 45 35 27 24 20 15 14 12 5 3 3 0 0 0
114
D + T
Vem 84 53 32 21 14 12 9 9 9 6 3 2 2 0 0 0
Time From Randomization, months
Pro
port
ion
Aliv
e an
d P
rogr
essi
on F
ree
OS, Baseline LDH > ULN
1.0
0.9
0.8
0.7
0.6
0.5
0.4
0.3
0.2
0.1
0.0
0 2 4 6 8 10 12 14 16 18 20 22 24 26 28 30 32
Time From Randomization, months
Vemurafenib Median OS, 8.9 mo (95% CI, 7.3‐10.7 mo)
HR, 0.81 (95% CI, 0.59‐1.10)
Dabrafenib + Trametinib Median OS, 10.8 mo (95% CI, 8.9‐14.4 mo)
COMBI‐v: OS and PFS for Patients With Baseline LDH > ULN
90
PFS, Baseline LDH > ULN
Vemurafenib Median PFS, 4.0 mo (95% CI, 3.7‐5.4 mo)
HR, 0.70 (95% CI, 0.53‐0.94)
Dabrafenib + Trametinib Median PFS, 5.5 mo (95% CI, 4.9‐7.2 mo)
D + TVem
118113 108 89 69 55 51 44 41 35 27 19 8 4 1 0 0114 110 93 75 55 47 36 34 32 31 25 14 10 8
1 0 01 0 0
C. Hoeller 2016 Caroline Robert, ESMO 2015
2/19/2016
46
NIVO+IPI (N=314)
NIVO(N=316)
IPI (N=315)
Median PFS, months (95% CI)
11.5 (8.9–16.7)
6.9 (4.3–9.5)
2.9 (2.8–3.4)
HR (99.5% CI)vs. IPI
0.42 (0.31–0.57)*
0.57(0.43–0.76)*
--
HR (95% CI)vs. NIVO
0.74 (0.60–0.92)**
-- --
*Stratified log-rank P<0.00001 vs. IPI
**Exploratory endpoint
PFS (Intent-to-Treat)
No. at Risk
314NIVO+IPI 173 151 65 11 1219 0
316NIVO 147 124 50 9 1177 0
315IPI 77 54 24 4 0137 0
0 6 9 12 15 183 21
NIVO
NIVO+IPI
IPI
Months
1.0
0.9
0.8
0.7
0.6
0.5
0.4
0.3
0.2
0.1
0.0
Proportion alive and progression‐free
911. Larkin et al. N Engl J Med 2015; 373:23-34. 2. Oral presentation by Dr. Jedd Wolchok at the ASCO 2015 Annual Meeting.
Total population57.6% (314) 38.6% (31.3–45.2)43.7% (316) 24.6% (17.5–31.4)
BRAF
Wild-type 53.3% (212) 35.6% (26.8–43.6)46.8% (218) 29.1% (20.5–37.1)
Mutant 66.7% (102) 44.7% (31.5–55.6)36.7% (98) 14.7% (2.0–26.8)
M Stage
M1c51.4% (185) 37.1% (27.9–45.4)38.9% (185) 24.6% (15.8–33.0)
Baseline LDH
≤ULN65.3% (199) 40.6% (31.1–48.9)51.5% (196) 26.8% (17.3–35.6)
>ULN44.7% (114) 35.2% (24.1–45.2)30.4% (112) 20.8% (10.5–30.7)
>2x ULN37.8% (37) 37.8% (20.0–53.9)21.6% (37) 21.6% (6.3–37.2)
Age (yr)
≥65 and <7557.4% (94) 39.5% (25.8–51.0)48.1% (79) 30.1% (16.0–42.8)
≥7554.3% (35) 27.0% (5.3–45.8)43.6% (39) 16.3% (-4.1–35.2)
PD-L1 Expression Level
<5%54.8% (210) 36.9% (28.0–45.0)41.3% (208) 23.5% (14.8–31.8)
≥5%72.1% (68) 50.7% (35.0–62.8)57.5% (80) 36.2% (21.0–49.0)
NIVO+IPI NIVOUnweighted ORR
difference vs IPI (95% CI)
70 -10103050 0
IPI betterNIVO or NIVO+IPI better
ORR in Patient Subgroups
92
ORR (Patients)
2/19/2016
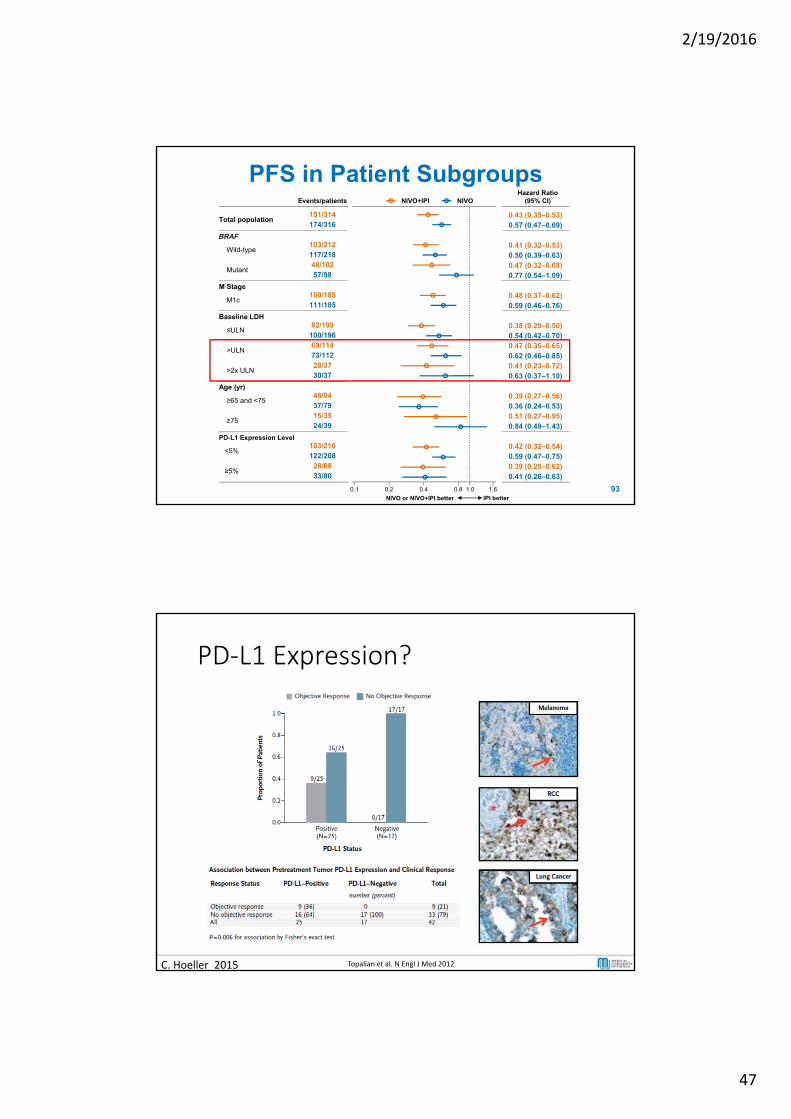
47
Total population151/314 0.43 (0.35–0.53)174/316 0.57 (0.47–0.69)
BRAF
Wild-type 103/212 0.41 (0.32–0.53)117/218 0.50 (0.39–0.63)
Mutant 48/102 0.47 (0.32–0.68)57/98 0.77 (0.54–1.09)
M Stage
M1c100/185 0.48 (0.37–0.62)111/185 0.59 (0.46–0.76)
Baseline LDH
≤ULN82/199 0.38 (0.29–0.50)
100/196 0.54 (0.42–0.70)
>ULN69/114 0.47 (0.35–0.65)73/112 0.62 (0.46–0.85)
>2x ULN28/37 0.41 (0.23–0.72)30/37 0.63 (0.37–1.10)
Age (yr)
≥65 and <7548/94 0.39 (0.27–0.56)37/79 0.36 (0.24–0.53)
≥7515/35 0.51 (0.27–0.95)24/39 0.84 (0.49–1.43)
PD-L1 Expression Level
<5%103/210 0.42 (0.32–0.54)122/208 0.59 (0.47–0.75)
≥5%28/68 0.39 (0.25–0.62)33/80 0.41 (0.26–0.63)
PFS in Patient Subgroups
93
NIVO+IPI NIVOHazard Ratio
(95% CI)Events/patients
0.1 1.60.2 0.4 0.8
IPI betterNIVO or NIVO+IPI better
1.0
PD‐L1 Expression?
C. Hoeller 2015 Topalian et al. N Engl J Med 2012
2/19/2016
48
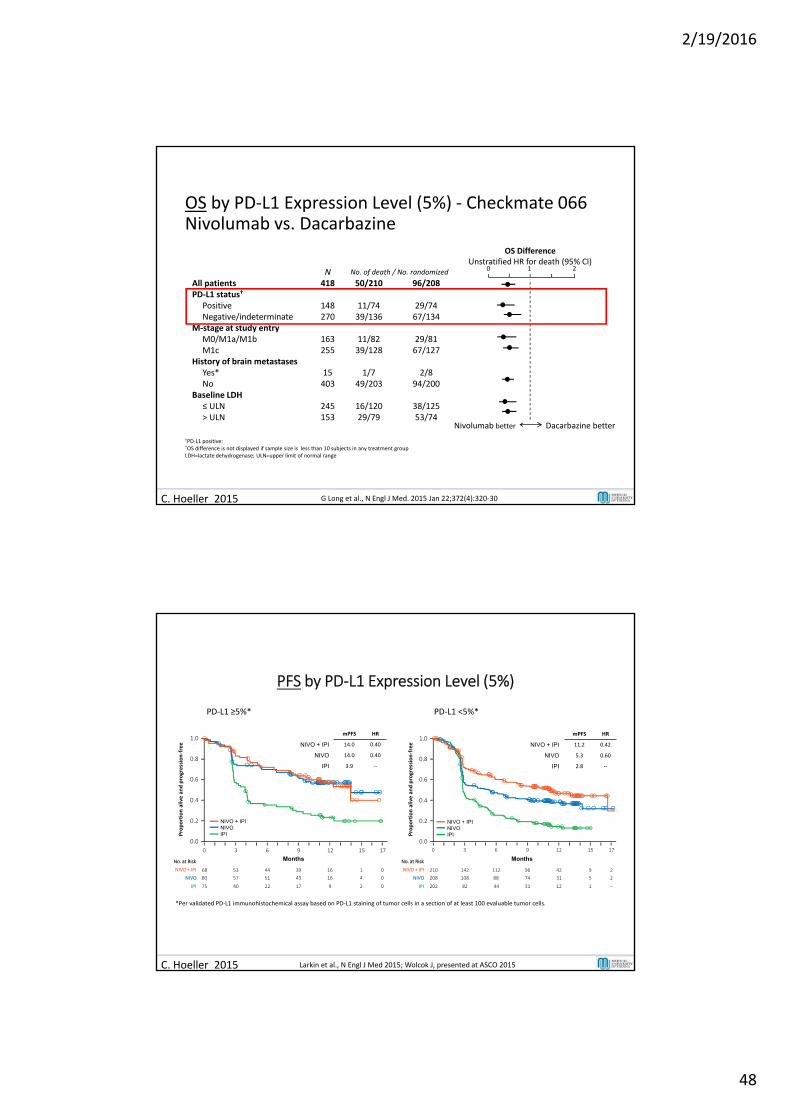
OS by PD‐L1 Expression Level (5%) ‐ Checkmate 066Nivolumab vs. Dacarbazine
†PD‐L1 positive: ≥ 5% tumor cell surface staining*OS difference is not displayed if sample size is less than 10 subjects in any treatment group LDH=lactate dehydrogenase; ULN=upper limit of normal range
Nivolumab DacarbazineN No. of death / No. randomized
All patients 418 50/210 96/208PD‐L1 status†
Positive 148 11/74 29/74Negative/indeterminate 270 39/136 67/134
M‐stage at study entryM0/M1a/M1b 163 11/82 29/81M1c 255 39/128 67/127
History of brain metastasesYes* 15 1/7 2/8No 403 49/203 94/200
Baseline LDH≤ ULN 245 16/120 38/125> ULN 153 29/79 53/74
OS DifferenceUnstratified HR for death (95% CI)
Nivolumab better Dacarbazine better
0 1 2
C. Hoeller 2015 G Long et al., N Engl J Med. 2015 Jan 22;372(4):320‐30
No. at Risk
IPI –202 82 44 31 12 1
NIVO 208 108 88 74 31 5 2
NIVO + IPI 210 142 112 96 42 9 2
0 3 6 9 12 15 17
Months
1.0
0.8
0.6
0.4
0.2
0.0
0 3 6 9 12 15 17
No. at Risk
IPI 075 40 22 17 9 2
NIVO 80 57 51 43 16 4 0
NIVO + IPI 68 53 44 39 16 1 0
Months
NIVO + IPINIVOIPI
NIVO + IPINIVOIPI
PFS by PD‐L1 Expression Level (5%)
PD‐L1 ≥5%* PD‐L1 <5%*
*Per validated PD‐L1 immunohistochemical assay based on PD‐L1 staining of tumor cells in a section of at least 100 evaluable tumor cells.
Proportion alive and progression‐free
Proportion alive and progression‐free
1.0
0.8
0.6
0.4
0.2
0.0
mPFS HR
NIVO + IPI 14.0 0.40
NIVO 14.0 0.40
IPI 3.9 ‐‐
mPFS HR
NIVO + IPI 11.2 0.42
NIVO 5.3 0.60
IPI 2.8 ‐‐
C. Hoeller 2015 Larkin et al., N Engl J Med 2015; Wolcok J, presented at ASCO 2015
2/19/2016
49
C. Hoeller 2015
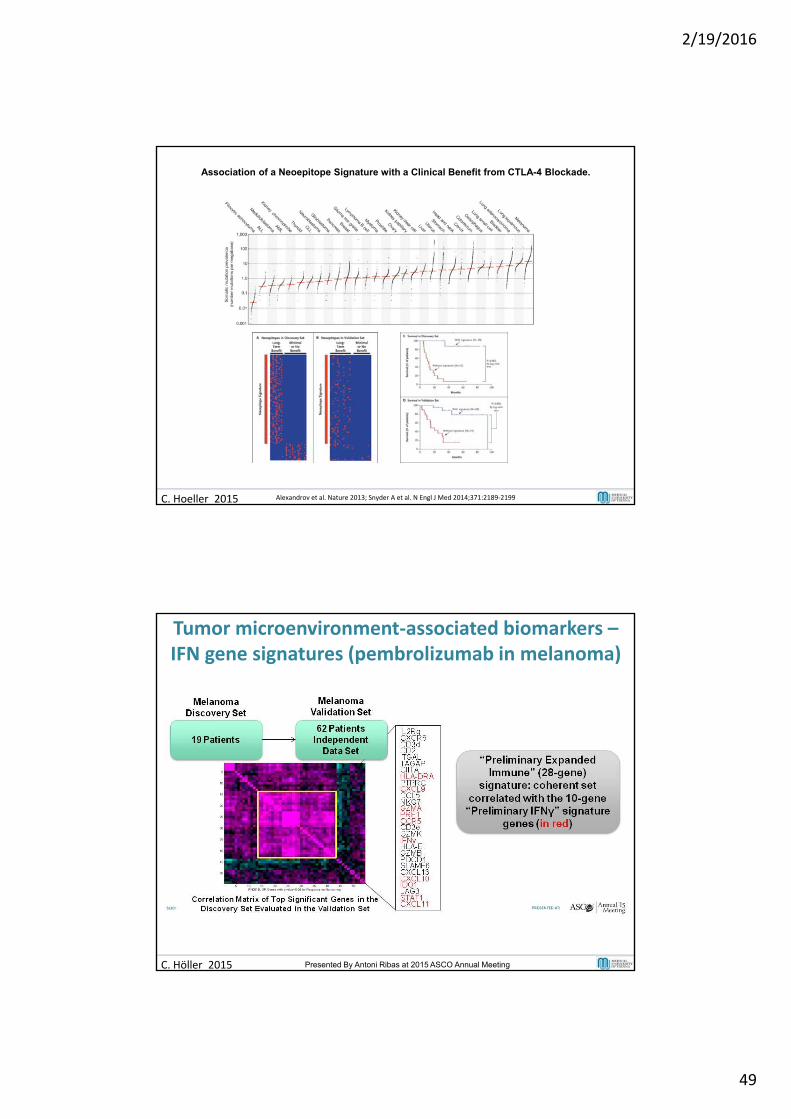
Association of a Neoepitope Signature with a Clinical Benefit from CTLA-4 Blockade.
Alexandrov et al. Nature 2013; Snyder A et al. N Engl J Med 2014;371:2189‐2199
Signature Expanded in Validation Set<br />(While Blinded to Clinical Outcome)
Presented By Antoni Ribas at 2015 ASCO Annual Meeting
Tumor microenvironment‐associated biomarkers –IFN gene signatures (pembrolizumab in melanoma)
C. Höller 2015 Presented By Antoni Ribas at 2015 ASCO Annual Meeting
2/19/2016
50
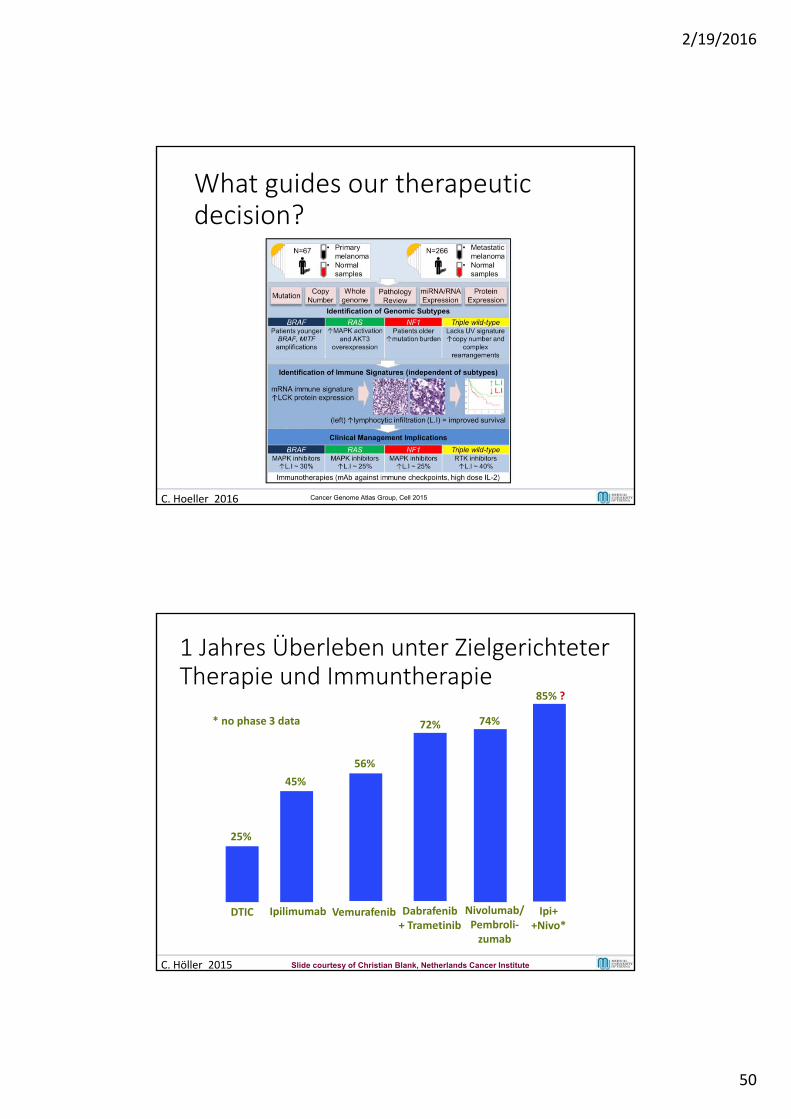
What guides our therapeuticdecision?
C. Hoeller 2016 Cancer Genome Atlas Group, Cell 2015
DTIC
25%
Ipilimumab
45%
Vemurafenib
56%
Dabrafenib+ Trametinib
72%
Nivolumab/Pembroli‐zumab
74%
Ipi++Nivo*
85% ?
* no phase 3 data
1 Jahres Überleben unter ZielgerichteterTherapie und Immuntherapie
C. Höller 2015 Slide courtesy of Christian Blank, Netherlands Cancer Institute
2/19/2016
51