MeerKLASS: MeerKAT Large Area Synoptic Survey - arXiv · Afonso11,12, David Alonso5, David Bacon13,...
22
MeerKLASS: MeerKAT Large Area Synoptic Survey Mario G. Santos *1,2 , Michelle Cluver 1,3 , Matt Hilton 4 , Matt Jarvis 5,1 , Gyula I. G. Jozsa 2,6,7 , Lerothodi Leeuw 8 , Oleg Smirnov 2,6 , Russ Taylor 1,3,9 , Filipe Abdalla 10,6 , Jose Afonso 11,12 , David Alonso 5 , David Bacon 13 , Bruce A. Bassett 14,15,16 , Gianni Bernardi 2,6 , Philip Bull 17,18 , Stefano Camera 19,20,21,1 , H. Cynthia Chiang 4 , Sergio Colafrancesco 22 , Pedro G. Ferreira 5 , Jose Fonseca 1 , Kurt van der Heyden 9 , Ian Heywood 5,6 , Kenda Knowles 23 , Michelle Lochner 2,14 , Yin-Zhe Ma 23,24,25 , Roy Maartens 1,13 , Sphesihle Makhathini 2,6 , Kavilan Moodley 4 , Alkistis Pourtsidou 13,26 , Matthew Prescott 1 , Jonathan Sievers 23 , Kristine Spekkens 27 , Mattia Vaccari 1,28 , Amanda Weltman 16 , Imogen Whittam 1 , Amadeus Witzemann 1,16 , Laura Wolz 29 , and Jonathan T. L. Zwart 1,9 1 Department of Physics and Astronomy, University of the Western Cape, Cape Town 7535, South Africa 2 SKA South Africa, 3rd Floor, The Park, Park Road, Pinelands, 7405, South Africa 3 Inter-University Institute for Data Intensive Astronomy, University of Cape Town, Rondebosch, 7701, South Africa 4 School of Mathematics, Statistics, and Computer Science, Astrophysics and Cosmology Research Unit, University of KwaZulu-Natal, Durban, 4041, South Africa 5 Astrophysics, University of Oxford, Keble Road, Oxford OX1 3RH UK 6 Department of Physics and Electronics, Rhodes University, PO BOX 94, Grahamstown, 6140, South Africa 7 Argelander-Institut für Astronomie, Auf dem Hügel 71, D-53121 Bonn, Germany 8 UNISA, South Africa 9 Department of Astronomy, University of Cape Town, Cape Town, 7005 South Africa 10 Department of Physics & Astronomy, University College London, Gower Street, London, WC1E 6BT, UK 11 Instituto de Astrofísica e Ciências do Espaço, Universidade de Lisboa, OAL, Tapada da Ajuda, PT1349-018 Lisboa, Portugal 12 Departamento de Física, Faculdade de Ciências, Universidade de Lisboa, Edifício C8, Campo Grande, PT1749-016 Lisbon, Portugal 13 Institute of Cosmology & Gravitation, University of Portsmouth, Burnaby Road, Portsmouth PO1 3FX, UK 14 African Institute for Mathematical Sciences, Muizenberg, Cape Town, South Africa 15 South African Astronomical Observatory, Observatory, Cape Town, South Africa 16 Department of Mathematics and Applied Mathematics, University of Cape Town, Cape Town, South Africa 17 California Institute of Technology, Pasadena, CA 91125, USA 18 Jet Propulsion Laboratory, California Institute of Technology, 4800 Oak Grove Drive, Pasadena, California, USA 19 Dipartimento di Fisica, Università degli Studi di Torino, 10125 Torino, Italy 20 INFN – Istituto Nazionale di Fisica Nucleare, Sezione di Torino, 10125 Torino, Italy 21 INAF – Istituto Nazionale di Astrofisica, Osservatorio Astrofisico di Torino, 10025 Pino Torinese, Italy 22 School of Physics, Wits University, Johannesburg WITS-2001, South Africa 23 School of Chemistry and Physics, Astrophysics and Cosmology Research Unit, University of KwaZulu-Natal, Durban, 4041, South Africa 24 NAOC-UKZN Computational Astrophysics Centre (NUCAC), University of KwaZulu-Natal, Durban, 4000 South Africa 25 Purple Mountain Observatory, Chinese Academy of Sciences, Nanjing 210008, China 26 School of Physics and Astronomy, Queen Mary University of London, Mile End Road, London E1 4NS, UK 27 Royal Military College of Canada, PO Box 17000, Station Forces, Kingston, Ontario K7L 2E1, Canada 28 INAF - Istituto di Radioastronomia, via Gobetti 101, 40129 Bologna, Italy 29 School of Physics, University of Melbourne, Parkville, VIC 3010, Australia * Email: [email protected] 1 arXiv:1709.06099v1 [astro-ph.CO] 18 Sep 2017
Transcript of MeerKLASS: MeerKAT Large Area Synoptic Survey - arXiv · Afonso11,12, David Alonso5, David Bacon13,...
MeerKLASS: MeerKAT Large Area Synoptic Survey
Mario G. Santos∗1,2, Michelle Cluver1,3, Matt Hilton4, Matt Jarvis5,1, Gyula I. G.Jozsa2,6,7, Lerothodi Leeuw8, Oleg Smirnov2,6, Russ Taylor1,3,9, Filipe Abdalla10,6, JoseAfonso11,12, David Alonso5, David Bacon13, Bruce A. Bassett14,15,16, Gianni Bernardi2,6,Philip Bull17,18, Stefano Camera19,20,21,1, H. Cynthia Chiang4, Sergio Colafrancesco22,
Pedro G. Ferreira5, Jose Fonseca1, Kurt van der Heyden9, Ian Heywood5,6, KendaKnowles23, Michelle Lochner2,14, Yin-Zhe Ma23,24,25, Roy Maartens1,13, Sphesihle
Makhathini2,6, Kavilan Moodley4, Alkistis Pourtsidou13,26, Matthew Prescott1, JonathanSievers23, Kristine Spekkens27, Mattia Vaccari1,28, Amanda Weltman16, ImogenWhittam1, Amadeus Witzemann1,16, Laura Wolz29, and Jonathan T. L. Zwart1,9
1Department of Physics and Astronomy, University of the Western Cape, Cape Town 7535, South Africa2SKA South Africa, 3rd Floor, The Park, Park Road, Pinelands, 7405, South Africa
3Inter-University Institute for Data Intensive Astronomy, University of Cape Town, Rondebosch, 7701, SouthAfrica
4School of Mathematics, Statistics, and Computer Science, Astrophysics and Cosmology Research Unit,University of KwaZulu-Natal, Durban, 4041, South Africa
5Astrophysics, University of Oxford, Keble Road, Oxford OX1 3RH UK6Department of Physics and Electronics, Rhodes University, PO BOX 94, Grahamstown, 6140, South Africa
7Argelander-Institut für Astronomie, Auf dem Hügel 71, D-53121 Bonn, Germany8UNISA, South Africa
9Department of Astronomy, University of Cape Town, Cape Town, 7005 South Africa10Department of Physics & Astronomy, University College London, Gower Street, London, WC1E 6BT, UK
11Instituto de Astrofísica e Ciências do Espaço, Universidade de Lisboa, OAL, Tapada da Ajuda, PT1349-018Lisboa, Portugal
12Departamento de Física, Faculdade de Ciências, Universidade de Lisboa, Edifício C8, Campo Grande,PT1749-016 Lisbon, Portugal
13Institute of Cosmology & Gravitation, University of Portsmouth, Burnaby Road, Portsmouth PO1 3FX, UK14African Institute for Mathematical Sciences, Muizenberg, Cape Town, South Africa15South African Astronomical Observatory, Observatory, Cape Town, South Africa
16Department of Mathematics and Applied Mathematics, University of Cape Town, Cape Town, South Africa17California Institute of Technology, Pasadena, CA 91125, USA
18Jet Propulsion Laboratory, California Institute of Technology, 4800 Oak Grove Drive, Pasadena, California,USA
19Dipartimento di Fisica, Università degli Studi di Torino, 10125 Torino, Italy20INFN – Istituto Nazionale di Fisica Nucleare, Sezione di Torino, 10125 Torino, Italy
21INAF – Istituto Nazionale di Astrofisica, Osservatorio Astrofisico di Torino, 10025 Pino Torinese, Italy22School of Physics, Wits University, Johannesburg WITS-2001, South Africa
23School of Chemistry and Physics, Astrophysics and Cosmology Research Unit, University of KwaZulu-Natal,Durban, 4041, South Africa
24NAOC-UKZN Computational Astrophysics Centre (NUCAC), University of KwaZulu-Natal, Durban, 4000South Africa
25Purple Mountain Observatory, Chinese Academy of Sciences, Nanjing 210008, China26School of Physics and Astronomy, Queen Mary University of London, Mile End Road, London E1 4NS, UK
27Royal Military College of Canada, PO Box 17000, Station Forces, Kingston, Ontario K7L 2E1, Canada28INAF - Istituto di Radioastronomia, via Gobetti 101, 40129 Bologna, Italy29School of Physics, University of Melbourne, Parkville, VIC 3010, Australia
∗Email: [email protected]
1
arX
iv:1
709.
0609
9v1
[as
tro-
ph.C
O]
18
Sep
2017

MeerKLASS
Abstract
We discuss the ground-breaking science that will be possible with a wide area survey, using theMeerKAT telescope, known as MeerKLASS (MeerKAT Large Area Synoptic Survey). The currentspecifications of MeerKAT make it a great fit for science applications that require large survey speedsbut not necessarily high angular resolutions. In particular, for cosmology, a large survey over ∼4, 000 deg2 for ∼ 4, 000 hours will potentially provide the first ever measurements of the baryonacoustic oscillations using the 21cm intensity mapping technique, with enough accuracy to imposeconstraints on the nature of dark energy. The combination with multi-wavelength data will giveunique additional information, such as exquisite constraints on primordial non-Gaussianity usingthe multi-tracer technique, as well as a better handle on foregrounds and systematics. Such a widesurvey with MeerKAT is also a great match for H i galaxy studies. In fact, MeerKLASS can provideunrivalled statistics in the pre-SKA era, for galaxies resolved in the H i emission line beyond localstructures at z > 0.01. It uniquely traces the faint neutral gas with high signal to noise, in a significantstatistical sample of resolved galaxies in the H i mass regime of ∼ 109M, well beyond the knee ofthe H i mass function, providing statistics of the most abundant galaxies. It will also produce a largecontinuum galaxy sample down to a depth of about 5µJy in L-band, which is quite unique over suchlarge areas and will allow studies of the large-scale structure of the Universe out to high redshifts,complementing the galaxy H i survey to form a transformational multi-wavelength approach to studygalaxy dynamics and evolution. Finally, the same survey will supply unique information for a rangeof other science applications, including a large statistical investigation of galaxy clusters, and thediscovery of rare high-redshift AGN that can be used to probe the epoch of reionization as well asproduce a rotation measure map across a huge swathe of the sky. The MeerKLASS survey will bea crucial step on the road to using SKA1-MID for cosmological applications and other commensalsurveys, as described in the top priority SKA key science projects.
2

MeerKLASS CONTENTS
Contents1 Rationale 4
2 Executive Summary 4
3 Cosmology 53.1 HI intensity mapping . . . . . . . . . . . . . . . . . . . . . . . . . . . . . . . . . . . . . 5
3.1.1 Detecting the HI intensity mapping signal with MeerKAT . . . . . . . . . . . . 63.1.2 Baryon acoustic oscillations and redshift space distortions . . . . . . . . . . . . 73.1.3 Multi-tracer constraints on primordial non-Gaussianity . . . . . . . . . . . . . . 93.1.4 Cross correlations with the CMB . . . . . . . . . . . . . . . . . . . . . . . . . . 10
3.2 Continuum galaxy survey: constraining dark energy . . . . . . . . . . . . . . . . . . . 103.3 Dark matter detections . . . . . . . . . . . . . . . . . . . . . . . . . . . . . . . . . . . . 11
4 Radio continuum: Galaxy evolution 114.1 AGN . . . . . . . . . . . . . . . . . . . . . . . . . . . . . . . . . . . . . . . . . . . . . . 124.2 High-redshift AGN . . . . . . . . . . . . . . . . . . . . . . . . . . . . . . . . . . . . . . 124.3 Star-forming galaxies . . . . . . . . . . . . . . . . . . . . . . . . . . . . . . . . . . . . . 124.4 Clustering measurements and AGN environments . . . . . . . . . . . . . . . . . . . . . 12
5 Clusters 135.1 Diffuse cluster emission . . . . . . . . . . . . . . . . . . . . . . . . . . . . . . . . . . . 135.2 Star formation in clusters . . . . . . . . . . . . . . . . . . . . . . . . . . . . . . . . . . 135.3 Cluster magnetic fields . . . . . . . . . . . . . . . . . . . . . . . . . . . . . . . . . . . . 14
6 MeerKLASS as an extragalactic HI survey 146.1 A comparison with other surveys . . . . . . . . . . . . . . . . . . . . . . . . . . . . . . 146.2 Neutral hydrogen in galaxies: science . . . . . . . . . . . . . . . . . . . . . . . . . . . . 166.3 Gas in galaxies: legacy value . . . . . . . . . . . . . . . . . . . . . . . . . . . . . . . . 16
7 The polarized sky – cosmic magnetic fields 17
8 Summary 18
3

MeerKLASS 2 EXECUTIVE SUMMARY
1 RationaleA new generation of radio telescopes with unprecedented capabilities for astronomy and tests offundamental physics will enter operation over the next few years. Thanks to their large survey speeds,they present a unique opportunity to probe the Universe using large sky surveys. These will delivermeasurements of the large-scale structure of the Universe across cosmic time, a crucial ingredient inpushing the current limits of precision cosmology and exploring new cosmological models, thanks totheir huge 3-dimensional information content.
The key example is SKA1-MID, the first phase of the SKA, to be set in South Africa, whichwill deliver competitive and transformational cosmology through a series of measurements using alarge sky survey (Maartens et al. 2015; Santos et al. 2015; Jarvis et al. 2015; Abdalla et al. 2015).However, in the immediate future, MeerKAT1, the SKA precursor in South Africa, will have thecapability to produce high impact cosmological constraints from a large sky survey. Several factorscontribute to this: i) the final MeerKAT specifications deliver excellent survey speed (low noise, largeprimary beam), exceeding initial expectations; ii) shorter baselines make MeerKAT a better fit forlarge, shallow surveys, instead of deep surveys that may suffer from confusion noise; iii) MeerKAT’sdish design, with single pixel feeds, provides a stable, well-tested set-up that should allow for abetter handle on calibration issues, an important consideration for extracting the small cosmologicalsignal (in particular using the auto-correlations). A large amount of the science that we plan to dowill benefit greatly from a multi-wavelength approach. Therefore, “full sky” surveys are not a strictrequirement, as we can achieve most of the science with smaller areas that are more easily coveredsimultaneously by surveys at other wavelengths.
Finally, the proposed survey will pave the way for using the full SKA1-MID array for cosmology– one of the SKA’s key science projects. This is also true for the wide range of commensal sciencewe are proposing here, which promise unique transformational results. The large requests of timeplanned with SKA1 need to be efficiently used in a commensal way by providing game changingresults in different fronts, something that we will be testing with the proposed survey.
2 Executive SummaryIn recognition of MeerKAT’s potential as a cosmological survey instrument, we propose a surveyof ∼ 4, 000 deg2 in ∼ 4, 000 hr, probably over the same sky area as the Dark Energy Survey, DES(www.darkenergysurvey.org), which will provide a wealth of multi-wavelength data (note however thatthe final survey footprint is still being decided and we have also considered other possibilities such asthe VIKING/KIDS area). This multi-wavelength coverage is not only beneficial for MeerKLASS butalso for other surveys that overlap in the same sky area. For instance, cross-correlations of the HIIntensity mapping (IM) survey with DES galaxies can significantly improve the photometric redshiftuncertainties of these galaxies (Alonso et al. 2017), something that can be crucial in improving theweak lensing constraints.
MeerKLASS will allow for a variety of scientific breakthroughs in a completely new regime:1. Possibly the first ever detection of baryon acoustic oscillations (BAO) and redshift space distortions(RSD) through the 21cm intensity mapping technique, which will allow novel cosmological constraintsto be placed on dark energy and alternative theories of gravity. This will be achieved in both auto-correlation and cross-correlation with other surveys, the latter guaranteeing a much cleaner signalwith regard to systematics. Besides cosmology, these measurements will also constrain the HI massfunction and its evolution, as well as the clustering bias of HI galaxies.2. Novel constraints on primordial non-Gaussianity using the multi-tracer technique, improving oncurrent limits.3. Detect ∼ 107 (mostly star-forming) galaxies in continuum, that can be used for several statisticaltests in cosmology and galaxy evolution.4. Detect in excess of ∼ 105 galaxies directly in H i providing the best statistics of resolved H i galaxyobservations among all planned SKA progenitor surveys, beyond the local structures at redshift z >0.01, uniquely including a significant statistical sample of resolved galaxies within theMH i ∼ 109Mregime at a sensitivity capable of tracing faint, extended components.5. Probe the AGN/ SF galaxy populations up to large masses, and even find the rarest high-redshiftAGN, which can be used to probe the epoch of reonisation through 21cm absorption.6. Provide a large sample of galaxy clusters and a study of radio halos and relics in clusters.7. Detect thousands of sources which can be used to investigate associated HI absorption systems.8. Produce a rotation measure map across a large patch of the sky.9. Detect or set strong upper limits to the dark matter induced radio emission in nearby structures:dwarf galaxies and galaxy clusters with offset DM-baryon spatial distribution.10. Perform slow transient searches.
1https://www.ska.ac.za/science-engineering/meerkat
4

MeerKLASS 3 COSMOLOGY
MeerKLASS plans to use MeerKAT’s L-band receivers (900–1670MHz), in order to achieve apoint source sensitivity in continuum of ∼ 5.3µJy. This is assuming about 25% band loss to RFI,and taking into account the expected confusion (which should be low at this level). The specificationsused in our calculations can be found at: http://meerkat2016.ska.ac.za/Files, where we used the full64 dishes. In the following analysis, we will sometimes consider other options (such as UHF-band ordifferent survey areas/time) in order to justify our choices.
We aim to use the single-dish auto-correlations and interferometric data from MeerKAT simul-taneously. The single-dish survey will require a particular calibration approach. The current ideais to take a fast scanning strategy, in order to suppress the effect of gain variations on the requiredangular scales for cosmology. The speed of such survey depends on current stability tests being done(ultimately could be just a drift scan), but we expect to take the scans at constant elevation in orderto deal with “ground pick-up”. Second, we plan to use the MeerKAT noise diodes to inject a frequent,stable signal that can be used for calibration. The interferometer data will be taken at the sametime, using an on-the-fly observing mode. This will require a careful calibration technique, where forinstance, the full dish primary beam will be included. Note also that cross-correlating the intensitybetween dishes can help with systematics and the noise bias. In the next sections, we describe indetail the science that can be done, and the reasoning for the requested sky area and sensitivity.
3 CosmologyMeerKLASS aims to provide some of the first constraints on cosmology using the new generation ofradio telescopes. With the same data, we will effectively run two different cosmological surveys: HI in-tensity mapping and a continuum radio galaxy survey. Combined with multi-wavelength information,these will allow exquisite constraints on several key cosmological parameters.
3.1 HI intensity mappingTypically, large-scale structure probes in cosmology use galaxy surveys with spectroscopic or pho-tometric redshifts in the optical or near-infrared. These are threshold surveys in that they set aminimum flux above which galaxies can be individually detected. For the radio, we will have to relyon the HI 21cm signal to obtain such redshifts. But this emission line is quite weak. The next gen-eration of radio telescopes will only achieve the required sensitivities to detect HI galaxies over smallvolumes not useful for cosmology. In fact, we will have to wait until SKA2 to achieve the sensitivityto do game-changing cosmology with an HI galaxy survey (Abdalla et al. 2014).
The intensity mapping technique relies on observations of the sky intensity over a large number ofpixels instead of trying to detect individual galaxies. For a reasonably large 3D pixel (in solid angleand frequency interval), we expect to have several HI galaxies in each pixel so that their combinedemission will provide a larger signal. Moreover we can use statistical techniques, similar to thosethat have been applied to CMB experiments, to measure quantities in the low signal to noise regime.By not requiring the detection of individual galaxies, the sensitivity requirements are much lessdemanding. Intensity mapping transfers the problem to one of foreground cleaning: how to developcleaning methods to remove everything that is not the HI signal at a given frequency, which alsoimpacts on the calibration requirements of the instrument (see Santos et al. 2015).
Intensity mapping experiments can be classified into two types: single-dish surveys and interfer-ometers. In single-dish surveys (e.g. using auto-correlations), each pointing of the telescope gives usone single pixel on the sky (though more dishes or feeds can be used to increase the field of view).This has the advantage of giving us the large-scale modes by scanning the sky. Since brightnesstemperature is independent of dish size, we can achieve the same sensitivity with a smaller dish,although that will in turn limit the angular resolution of the experiment (e.g., a 30 arcmin resolutionat z ∼ 1 would require a dish of about 50m in diameter). One example is the Green Bank Tele-scope (GBT) which produced the first (tentative) detection of the cosmological HI intensity signalby cross-correlating with the WiggleZ redshift survey (Chang et al. 2010; Switzer et al. 2013; Masuiet al. 2013). BINGO (Battye et al. 2013) is a proposed 40m multi-receiver single-dish telescope tobe situated in South America and aimed at detecting the HI signal at z ∼ 0.3.
Interferometers basically measure the Fourier transform modes of the sky. They have the advan-tage of easily providing high angular resolution as well being less sensitive to systematics that canplague the auto-correlation power. On the other hand, the minimum angular scale they can probeis set by their shortest baseline, which can be a problem when probing BAO scales. Some examplesof purpose-built interferometer for intensity mapping are CHIME (Bandura et al. 2014), aimed atdetecting the BAO at z ∼ 1, TIANLAI (Xu et al. 2015) , set in China and HIRAX, to be built inSouth Africa (Newburgh et al. 2016).
The next generation of large dish arrays can also potentially be exploited for HI intensity mappingmeasurements. This is the case for MeerKAT and SKA1-MID. However, these interferometers do not
5

MeerKLASS 3 COSMOLOGY
10-2 10-1
k [Mpc−1]
101
102
103P
HI(k)[m
K2M
pc3
]z= 0. 5
10-1
k [Mpc−1]
102
103
104
PH
Ig(k
)[m
KM
pc3
]
z= 0. 35
10-2 10-1
k [Mpc−1]
100
101
102
103
104
PH
Ig(k
)[m
KM
pc3
]
z= 0. 35
102
`
10-12
10-11
10-10
10-9
10-8
10-7
10-6
10-5
CH
I(`
)[m
K]
zf =0.3, zb =1
Figure 1: HI detection with MeerKLASS, showing the expected signal power spectrum (black solid)and measurement errors (cyan). Top left: HI auto-correlation. Top right: Cross-correlation with BOSSDR12-like sample. Bottom left: Angle-averaged cross-correlation with DES-like survey. Bottom right:DES galaxies (at zb = 1) as background sources to detect the cross-correlation between the HI densityfield (at zf = 0.3) and lensing.
provide enough baselines on the scales of interest (5 to 80m), so that their sensitivity to the BAOwill be small. The alternative is to use instead the auto-correlation information from each dish, e.g.with a survey using the array in single-dish mode. The large number of dishes available with thesetelescopes will guarantee a high survey speed for probing the HI signal. It will also allow us to probevery large cosmological scales, which will be unique to this approach. Our proposal is to use thecalibrated single dish auto-correlation from MeerKAT to measure the HI IM signal, while at thesame time keeping the interferometer data for the commensal science. In the following sections, wediscuss what can be achieved with such survey.
3.1.1 Detecting the HI intensity mapping signal with MeerKAT
After reionization, most HI will be found in dense systems inside galaxies. The total brightnesstemperature at a given redshift and in a unit direction n on the sky is
Tb(z,n) ≈ T b(z)[1 + bHI(z)δm(z,n)− (1 + z)
H(z)ni∂i
(n · v
)], (1)
where bHI is the HI galaxy bias, δm is the matter density contrast, v is the peculiar velocity of emittersand the average signal T b is determined by the comoving HI density fraction ΩHI (this is the properHI density, divided by (1 + z)3 and by the critical density at redshift zero). The last term in thebrackets is the usual RSD term. The signal will be completely specified once we have a prescriptionfor the ΩHI and bHI. This can be obtained by making use of the halo mass function, dn/dM and halobias, relying on a model for the amount of HI mass in a dark matter halo of massM , i.e. MHI(M). Weassumed a simple power law, MHI(M) = AMα, with α = 0.6 and A ∼ 220 both redshift independentand chosen to match the observed ΩHI at z = 0.8 (see Santos et al. 2015 for details). In this paper,we used the following functions which fit the above prescription quite well:
bHI(z) =bHI,0
0.677105
(6.6655× 10⁻¹ + 1.7765× 10⁻¹ z + 5.0223× 10⁻² z2
), (2)
ΩHI(z) =ΩHI,0
0.000486
(4.8304× 10⁻⁴ + 3.8856× 10⁻⁴ z − 6.5119× 10⁻⁵ z2
), (3)
T b(z) = 5.5919× 10⁻² + 2.3242× 10⁻¹ z − 2.4136× 10⁻² z2 mK. (4)
6
MeerKLASS 3 COSMOLOGY
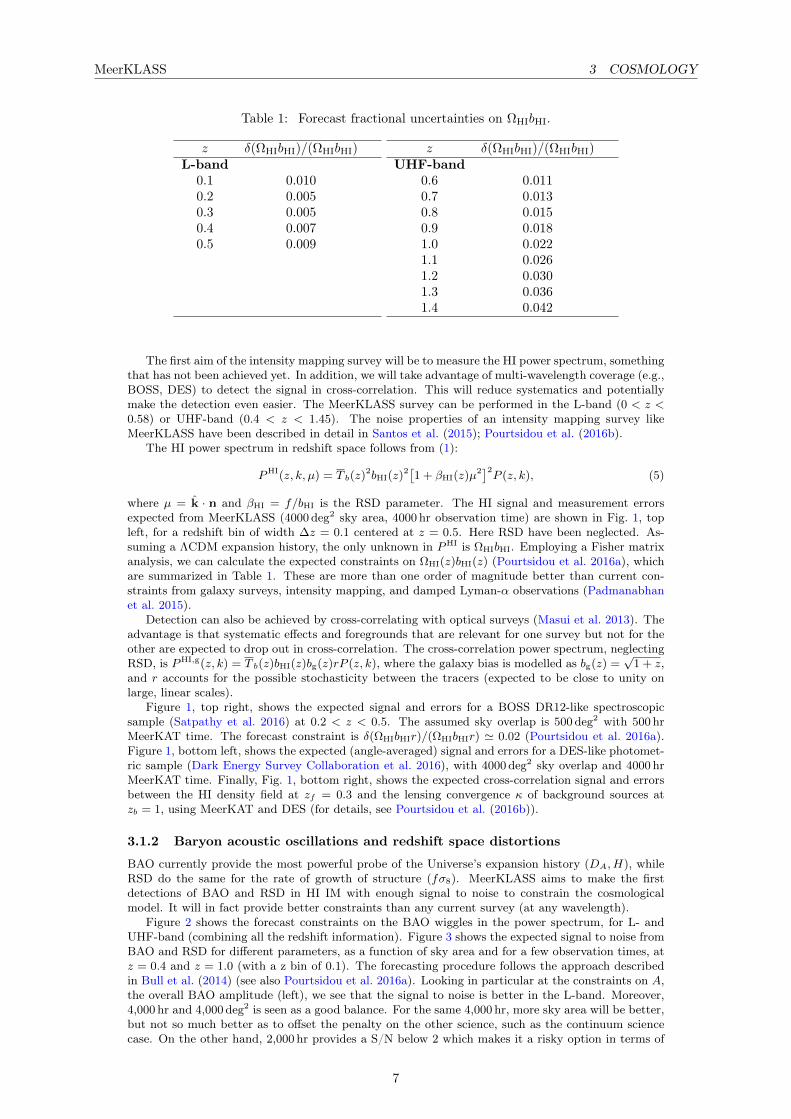
Table 1: Forecast fractional uncertainties on ΩHIbHI.
z δ(ΩHIbHI)/(ΩHIbHI)L-band
0.1 0.0100.2 0.0050.3 0.0050.4 0.0070.5 0.009
z δ(ΩHIbHI)/(ΩHIbHI)UHF-band
0.6 0.0110.7 0.0130.8 0.0150.9 0.0181.0 0.0221.1 0.0261.2 0.0301.3 0.0361.4 0.042
The first aim of the intensity mapping survey will be to measure the HI power spectrum, somethingthat has not been achieved yet. In addition, we will take advantage of multi-wavelength coverage (e.g.,BOSS, DES) to detect the signal in cross-correlation. This will reduce systematics and potentiallymake the detection even easier. The MeerKLASS survey can be performed in the L-band (0 < z <0.58) or UHF-band (0.4 < z < 1.45). The noise properties of an intensity mapping survey likeMeerKLASS have been described in detail in Santos et al. (2015); Pourtsidou et al. (2016b).
The HI power spectrum in redshift space follows from (1):
PHI(z, k, µ) = T b(z)2bHI(z)
2[1 + βHI(z)µ2]2P (z, k), (5)
where µ = k · n and βHI = f/bHI is the RSD parameter. The HI signal and measurement errorsexpected from MeerKLASS (4000 deg2 sky area, 4000 hr observation time) are shown in Fig. 1, topleft, for a redshift bin of width ∆z = 0.1 centered at z = 0.5. Here RSD have been neglected. As-suming a ΛCDM expansion history, the only unknown in PHI is ΩHIbHI. Employing a Fisher matrixanalysis, we can calculate the expected constraints on ΩHI(z)bHI(z) (Pourtsidou et al. 2016a), whichare summarized in Table 1. These are more than one order of magnitude better than current con-straints from galaxy surveys, intensity mapping, and damped Lyman-α observations (Padmanabhanet al. 2015).
Detection can also be achieved by cross-correlating with optical surveys (Masui et al. 2013). Theadvantage is that systematic effects and foregrounds that are relevant for one survey but not for theother are expected to drop out in cross-correlation. The cross-correlation power spectrum, neglectingRSD, is PHI,g(z, k) = T b(z)bHI(z)bg(z)rP (z, k), where the galaxy bias is modelled as bg(z) =
√1 + z,
and r accounts for the possible stochasticity between the tracers (expected to be close to unity onlarge, linear scales).
Figure 1, top right, shows the expected signal and errors for a BOSS DR12-like spectroscopicsample (Satpathy et al. 2016) at 0.2 < z < 0.5. The assumed sky overlap is 500 deg2 with 500 hrMeerKAT time. The forecast constraint is δ(ΩHIbHIr)/(ΩHIbHIr) ' 0.02 (Pourtsidou et al. 2016a).Figure 1, bottom left, shows the expected (angle-averaged) signal and errors for a DES-like photomet-ric sample (Dark Energy Survey Collaboration et al. 2016), with 4000 deg2 sky overlap and 4000 hrMeerKAT time. Finally, Fig. 1, bottom right, shows the expected cross-correlation signal and errorsbetween the HI density field at zf = 0.3 and the lensing convergence κ of background sources atzb = 1, using MeerKAT and DES (for details, see Pourtsidou et al. (2016b)).
3.1.2 Baryon acoustic oscillations and redshift space distortions
BAO currently provide the most powerful probe of the Universe’s expansion history (DA, H), whileRSD do the same for the rate of growth of structure (fσ8). MeerKLASS aims to make the firstdetections of BAO and RSD in HI IM with enough signal to noise to constrain the cosmologicalmodel. It will in fact provide better constraints than any current survey (at any wavelength).
Figure 2 shows the forecast constraints on the BAO wiggles in the power spectrum, for L- andUHF-band (combining all the redshift information). Figure 3 shows the expected signal to noise fromBAO and RSD for different parameters, as a function of sky area and for a few observation times, atz = 0.4 and z = 1.0 (with a z bin of 0.1). The forecasting procedure follows the approach describedin Bull et al. (2014) (see also Pourtsidou et al. 2016a). Looking in particular at the constraints on A,the overall BAO amplitude (left), we see that the signal to noise is better in the L-band. Moreover,4,000 hr and 4,000 deg2 is seen as a good balance. For the same 4,000 hr, more sky area will be better,but not so much better as to offset the penalty on the other science, such as the continuum sciencecase. On the other hand, 2,000 hr provides a S/N below 2 which makes it a risky option in terms of
7

MeerKLASS 3 COSMOLOGY
10−1
k [Mpc−1]
−0.10
−0.05
0.00
0.05
0.10L-Band; mean z = 0.3
10−1
k [Mpc−1]
UHF-Band; mean z = 0.9
Figure 2: BAO detection forecasts (4,000 hr): On larger scales, UHF performs slightly better (biggervolume at higher z reduces cosmic variance). On smaller scales the nonlinear kmax cutoff limits theconstraints. For the L-band kmax = 0.16 Mpc−1 and for UHF kmax = 0.21 Mpc−1, due to the higherredshift in UHF and the redshift scaling of kmax.
Figure 3: Signal to noise as a function of survey area. Columns from left to right show: BAO amplitudeparameter A, angular diameter distance DA, Hubble rate H, growth rate fσ8. Curves are for: 2,000(red), 4,000 (blue), 8,000 hr (orange). Upper row: z = 0.4 in L-band, lower row: z = 1.0 in UHF-band(redshift bin size = 0.1). Vertical dashed lines indicate 4,000 deg2. The L-band outperforms UHF for allobservables except H.
8
MeerKLASS 3 COSMOLOGY
1000 5000 10000 15000 20000 25000 30000
Sarea[deg2]
10
20
30
40
50
60
70
80
90
100
σf N
L
L
UHF
1000 2000 3000 4000 5000 6000 7000 8000 9000 10000
ttot [hr]
2
4
6
8
10
12
14
σf N
L
4 6 8 10 12 14 16 18 20
`min
1.5
2.0
2.5
3.0
3.5
4.0
4.5
5.0
5.5
6.0
σf N
L
LxDES
UHFxDES
1000 2000 3000 4000 5000 6000 7000 8000 9000 10000
ttot [hr]
1
2
3
4
5
6
7
8
σf N
L
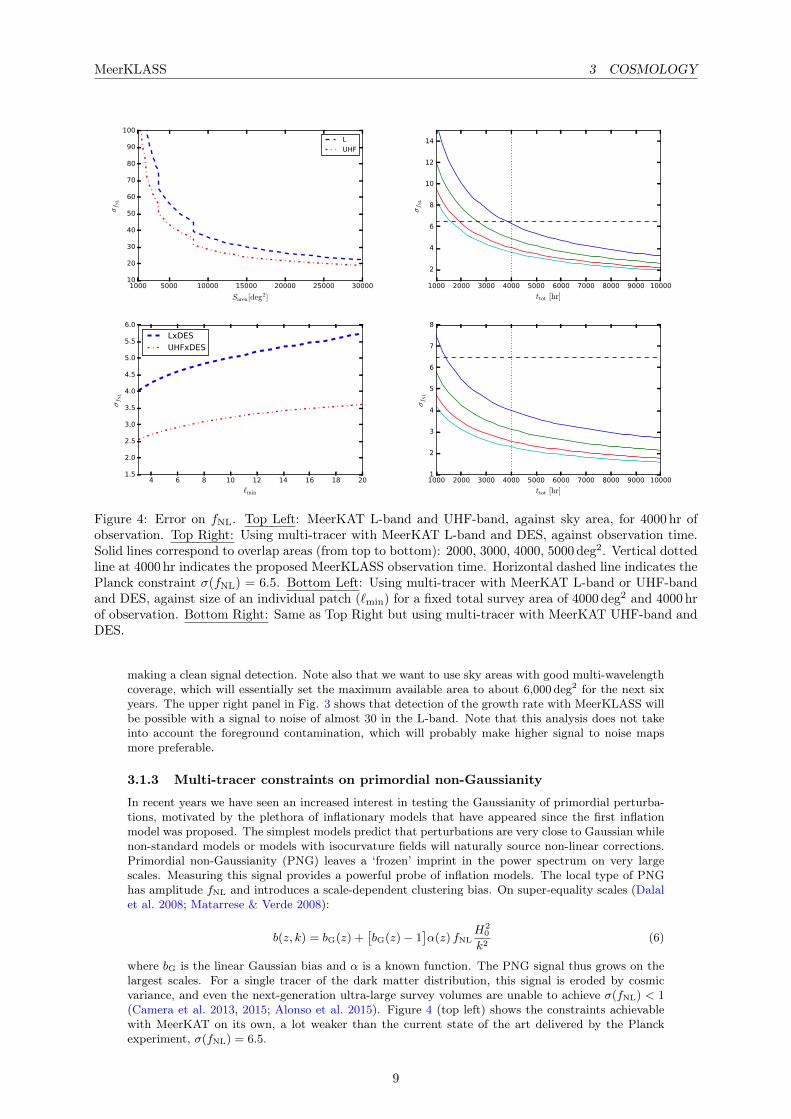
Figure 4: Error on fNL. Top Left: MeerKAT L-band and UHF-band, against sky area, for 4000 hr ofobservation. Top Right: Using multi-tracer with MeerKAT L-band and DES, against observation time.Solid lines correspond to overlap areas (from top to bottom): 2000, 3000, 4000, 5000 deg2. Vertical dottedline at 4000 hr indicates the proposed MeerKLASS observation time. Horizontal dashed line indicates thePlanck constraint σ(fNL) = 6.5. Bottom Left: Using multi-tracer with MeerKAT L-band or UHF-bandand DES, against size of an individual patch (`min) for a fixed total survey area of 4000 deg2 and 4000 hrof observation. Bottom Right: Same as Top Right but using multi-tracer with MeerKAT UHF-band andDES.
making a clean signal detection. Note also that we want to use sky areas with good multi-wavelengthcoverage, which will essentially set the maximum available area to about 6,000 deg2 for the next sixyears. The upper right panel in Fig. 3 shows that detection of the growth rate with MeerKLASS willbe possible with a signal to noise of almost 30 in the L-band. Note that this analysis does not takeinto account the foreground contamination, which will probably make higher signal to noise mapsmore preferable.
3.1.3 Multi-tracer constraints on primordial non-Gaussianity
In recent years we have seen an increased interest in testing the Gaussianity of primordial perturba-tions, motivated by the plethora of inflationary models that have appeared since the first inflationmodel was proposed. The simplest models predict that perturbations are very close to Gaussian whilenon-standard models or models with isocurvature fields will naturally source non-linear corrections.Primordial non-Gaussianity (PNG) leaves a ‘frozen’ imprint in the power spectrum on very largescales. Measuring this signal provides a powerful probe of inflation models. The local type of PNGhas amplitude fNL and introduces a scale-dependent clustering bias. On super-equality scales (Dalalet al. 2008; Matarrese & Verde 2008):
b(z, k) = bG(z) +[bG(z)− 1
]α(z) fNL
H20
k2(6)
where bG is the linear Gaussian bias and α is a known function. The PNG signal thus grows on thelargest scales. For a single tracer of the dark matter distribution, this signal is eroded by cosmicvariance, and even the next-generation ultra-large survey volumes are unable to achieve σ(fNL) < 1(Camera et al. 2013, 2015; Alonso et al. 2015). Figure 4 (top left) shows the constraints achievablewith MeerKAT on its own, a lot weaker than the current state of the art delivered by the Planckexperiment, σ(fNL) = 6.5.
9

MeerKLASS 3 COSMOLOGY
Cosmic variance can be beaten down using multiple tracers (Seljak 2009; Ferramacho et al. 2014;Fonseca et al. 2015), and this is applied to MeerKAT and DES in Fonseca et al. (2016). For moredetails on the multi-tracer technique look at the references therein. The results for L-band arepresented in Fig. 4 (top right). The multi-tracer technique can achieve errors on fNL better thanthose of Planck (horizontal dashed line), even with a conservative assumption on the overlap sky areabetween MeerKAT and DES (3000 or 4000 deg2), and with a maximum of 4000 hr integration time.MeerKLASS can therefore deliver the best constraints on fNL before SKA, Euclid and LSST deliverdata. These constrains would be tighter using the UHF-band, as one can see in Fig. 4 (bottom right),although the effect of foregrounds could affect this.
The last thing to note is that the forecasted error on fNL does not degrade rapidly if one breaksdown the total survey area into smaller patches of the sky. This is visible on the bottom left panel ofFig. 4. The sole effect of considering smaller non-contiguous patches lies on the minimum ` available.Although this option would be suboptimal, one can still deliver a measurement of fNL improving onPlanck results even for 4 patches of 1000 deg2 or 8 of 500 deg2.
3.1.4 Cross correlations with the CMB
Direct correlations of the HI intensity field with the CMB are challenging because CMB observables,such as the lensed field or the Sunyaev-Zel’dovich effect, are line-of-sight projected quantities withbroad redshift support, and it is precisely these long-wavelength radial modes that are lost in the21cm intensity field when removing galactic foregrounds. However, a cross-correlation signal canbe recovered using higher order correlations of the HI density field (Moodley et al. 2017) or tidalfield reconstruction (Zhu et al. 2016). Cross-correlations with the reconstructed CMB lensing field(Moodley et al. 2017) will allow us to constrain the high-redshift matter power spectrum and thechange in the HI density and bias with cosmic time.
3.2 Continuum galaxy survey: constraining dark energyA continuum survey can be done simultaneously with an HI intensity mapping survey. Contrary toline surveys, requiring high resolution in frequency, these surveys integrate over a continuous intervalin frequency (∼ 300MHz), providing high sensitivity and the detection of a large number of radiogalaxies (> 108 with SKA1). Unlike wide-field optical surveys, radio continuum emission is unaffectedby dust, and AGN and galaxies will be detected to high redshifts. MeerKLASS will be able to detectalmost 10 million radio galaxies in L-band (a factor of 10 more than current surveys), which willallow us to impose stringent constraints on dark energy.
0.0 0.5 1.0 1.5 2.0 2.5 3.0 3.5 4.0z
0
50
100
150
200
250
dn/dz
[deg−
2]
200µJy
FRI
FRII
SFG
SB
RQ
Total
0.0 0.5 1.0 1.5 2.0 2.5 3.0 3.5 4.0z
0
200
400
600
800
1000
dn/dz
[deg−
2]
50uJy
FRI
FRII
SFG
SB
RQ
Total
Figure 5: Redshift distribution of continuum sources detected at 200 (left) or 50µJy (right, the MeerK-LASS flux cut) for various radio galaxy populations (different colours) and the total (black). MostMeerKLASS galaxies will be star forming.
Since continuum radio surveys reach higher redshifts (z & 2.5) than optical/near-IR counterparts,they are in principle ideal to track the evolution of dark energy. Figure 5 shows the redshift distri-bution per square degree of various radio galaxy populations (coloured curves) that will be detectedby a continuum survey with a flux cut at 200 (left) or 50µJy (right). The latter is the expected∼ 10σ level for MeerKLASS, while the former roughly corresponds to the expected ∼ 10σ level forthe planned ASKAP EMU full sky survey (this could be more than ∼ 10σ depending on EMU’s finalspecs).
The distributions have a high-z tail, with non-negligible source number densities as deep as z ∼ 4.However, this major advantage of radio continuum for cosmology is spoiled by the featureless syn-
10

MeerKLASS 4 RADIO CONTINUUM: GALAXY EVOLUTION
chrotron spectrum, which does not allow for the measurement of redshift. To overcome this, we useredshift information from cross-identifying sources via observations at different wavelengths (Cameraet al. 2012). We use 5 photometric bins in 0.01 < z < 0.8 and then a large bin containing all theremaining high-z galaxies. Then we forecast the precision of a continuum angular power spectrum inconstraining the dark energy equation-of-state parameters w0 and wa, representing the present-dayvalue and the evolution with redshift. Figure 6 shows the dark energy figure of merit, with impressiveresults for MeerKLASS.
Figure 6: Dark energy equation-of-state figure of merit against sky area for MeerKAT with different fluxcuts (including a prior from Planck).
3.3 Dark matter detectionsMeerKLASS can be fruitfully employed for dark matter (DM) searches in both dwarf galaxies (dSphs)and in galaxy clusters using its radio signals from annihilation, as discussed in recent works (Regiset al. 2014; Colafrancesco et al. 2015; Beck & Colafrancesco 2016). Specific analysis of the mostpromising dSphs found in the MeerKLASS survey down to 5 uJy in L-band are probably the beststrategy to pursue this. With a few hours integration time over the region of a selected single dSph,one can increase the sensitivity by a factor of about 50 with respect to the present observations, thuslargely improving the ability to set constraints (or possibly detect) DM indirect radio signals (seeFig.6 in Regis et al. 2014). The analysis of DM annihilation radio signals in galaxy clusters will bedone out of the cluster blind survey, focusing on those systems which show the best spatial offsetsbetween DM and baryonic matter, as to facilitate the analysis of possible DM indirect radio signals.
4 Radio continuum: Galaxy evolutionIt is now accepted that most massive galaxies contain a central supermassive black hole that canundergo periods of accretion to create an Active Galactic Nuclei (AGN). These AGN show a stronginterplay with the star formation activity of galaxies and play a significant role in the their evolution.This is evident from comparisons made between the AGN and star formation rate density of theUniverse which has been shown to follow each other over the course of cosmic history (Franceschiniet al. 1999). More locally, the bulge masses of galaxies show a correlation with black hole masses,which suggests that an AGN feedback mechanism exists (Kormendy & Richstone 1995; Magorrianet al. 1998). Incorporating AGN feedback into semi-analytical galaxy simulations (Bower et al. 2006;Croton et al. 2006) has also been used as a mechanism to quench star formation, which produces theobserved bimodality in the colours of galaxies Strateva et al. (2001); Baldry et al. (2004).
11
MeerKLASS 4 RADIO CONTINUUM: GALAXY EVOLUTION
4.1 AGNRadio continuum emission at ∼ 1.4GHz is dominated by synchrotron emission from AGN and starforming (SF) galaxies, and provides a clear view of the emission mechanisms, free of dust obscuration.The depth and area of MeerKLASS is ideally suited for investigating evolution of AGN and theimpact they have on their host galaxy and wider environment. The most powerful AGN (L1.4GHz >1025 WHz−1) evolve strongly over cosmic time, with number density increasing by a factor of ∼ 1, 000from z = 0 to 2, and then declining beyond z ∼ 3. For lower luminosity AGN, the picture is moreuncertain, with some studies finding little or no evolution (e.g. McAlpine et al. 2013; Prescott et al.2016) and others finding more significant evolution (e.g. Sadler et al. 2007). Lower luminosity AGNdominate the AGN feedback required by the latest simulations of galaxy evolution, and understandingtheir evolution as a function of accretion rate and environment is crucial for our general understandingof massive galaxy evolution.
MeerKLASS will provide the data necessary to answer this question, particularly when combinedwith the wealth of multi-wavelength data available over the proposed fields. Using the S3 simulationas a guide, we will discover ∼ 50, 000 FRI-type galaxies at z < 1 and measure the evolution out toz ∼ 2, where it has yet to be measured with any precision. Furthermore, using optical and near-IRdata (DES, KIDS, VIKING, VHS), we will relate the radio emission to the host galaxy propertiesand the accretion rate of the AGN, using mid-infrared data from WISE and the next generation ofmulti-object spectrographs.
4.2 High-redshift AGNThe large sky area of MeerKLASS makes it ideal to search for rare, high-z AGN. These can beused to probe reionization, and can help constrain models of structure formation in the ∼ 1Gyrperiod following recombination. LOFAR and MWA hope to detect the 21cm transition line at z & 6,predominantly by searching for signatures via statistical fluctuations in the power spectrum. However,it is also possible to study reionization via 21cm absorption, if one can identify sufficiently distantbackground sources. This is one of the key science questions for the SKA.
Many attempts have been made to find z > 6 radio sources, mainly using ‘steep-spectrum’ se-lection, with the highest redshift radio galaxy at z = 5.19. The major limitation is the difficulty inobtaining complementary imaging data in the near-IR, which are needed to reliably eliminate low-zsources. The advent of wide-field near-IR surveys (Spitzer, UKIRT, VISTA, WISE) means thesedata are now available over sufficiently large sky areas to filter out sources at z < 2, and leave theremaining non-detections for spectroscopic follow-up (e.g. Jarvis et al. 2009).
With the proposed survey area, resolution and depth (required to reliably identify infrared coun-terparts), we expect to find, in combination with VIKING, about ten z > 6 radio sources with strongemission lines, plus another ∼ 300 lower-luminosity sources which should still be bright enough forSKA 21cm absorption studies.
4.3 Star-forming galaxiesThe star formation history of the Universe is of great importance to test cosmological theories andalso for many applications in astrophysics, such as estimating the build-up of stellar mass in galaxies,constraining the initial mass function, testing models of chemical evolution or constraining the natureof stellar deaths in supernovae and gamma-ray bursts. It is also one of the key science cases to beaddressed by the SKA (Jarvis et al. 2015). Radio emission from SF galaxies is produced from free-freeemission in HII regions near massive stars and cosmic ray electrons produced by supernova remnants,and offers an unobscured probe of the Universe without the need for extinction corrections.
A survey like MeerKLASS, containing millions of galaxies, will constrain the luminosity functionsof AGN and SF galaxies to much higher accuracy, and down to much lower luminosities than pre-viously. Combining the radio data with both spectroscopic and photometric redshifts from opticaland near-IR surveys will enable the investigation of how this evolution depends on stellar mass andenvironment. These are critical for relating the observations to the simulations and thus makingimportant insights into the physics of star formation and feedback processes.
4.4 Clustering measurements and AGN environmentsThe clustering properties (e.g. bias) of radio sources can be used to provide important constraints onhow galaxy formation and evolution are related to the underlying dark matter distribution. MeerK-LASS will allow us to extend this work several orders of magnitude deeper, and therefore probe theclustering of faint (sub-mJy) radio sources for the first time.
Clustering measurements can be used to determine the fraction of dark matter haloes of a givenmass which host radio-loud AGN (FRIs or FRIIs for example) and also what fraction of these exhibit
12
MeerKLASS 5 CLUSTERS
significant star formation activity, providing the information to measure the duty cycle of the AGNactivity, which can be used to estimate the timescale of activity and how it relates to the lifetime ofstar-formation activity in host galaxies. Constraining the duty cycle of AGN, and how this is affectedby accretion mode and morphology, is vital to understanding AGN feedback. Furthermore, novel useof cross-correlations between quiescent and active galaxies can be used to investigate how activitydepends on halo mass and possibly the age of the dark matter haloes.
The proposed survey will take studies of the clustering of radio sources to the next level: withthe large area covered and breadth of ancillary data, we will be able to determine the evolution ofthe clustering of radio sources as a function of their morphology, luminosity and accretion mode upto z ∼ 2.
5 ClustersMeerKLASS will observe total intensity and polarization over 4,000 deg2 down to a flux limit of∼ 5µJy/beam in L-band. More than 1,500 galaxy clusters above a M500 mass limit of 3 × 10¹⁴Mare expected within the survey area (assuming σ8 = 0.80). This blind survey will produce sensitiveradio observations of a statistically significant number of galaxy clusters above this mass limit andover a broad redshift range, from z = 0 up to 0.5 − 0.8, depending on the evolution of the physicalmechanisms producing the diffuse radio emission.
5.1 Diffuse cluster emissionMost diffuse emission studies have been carried out on high-mass (M500 > 6× 10¹⁴M), low redshift(0.2 < z < 0.4) systems due to the faint nature of the emission and sensitivity limits of currentinstruments. The MeerKLASS survey is expected to detect a radio halo and/or relic in approximately200 clusters, lower in mass and over a broad range of redshift, greatly extending the current numberof ∼ 65 sources (Yuan et al. 2015). This statistically significant sample of diffuse emission is crucialfor advancing the understanding of its formation and evolution.
MeerKLASS will measure fluxes and spectral indices across the broad MeerKAT band for eachdiffuse source (as well as wide band spectral indices through the correlation with other radio surveys,e.g. NVSS, SUMSS, TGSS, where there is overlap). For radio halos, this will allow a separation of thedetected population based on their formation theories: re-acceleration during cluster mergers createsturbulent halos, whereas off-state halos are found in less disturbed systems and are generated throughhadronic processes. The sensitivity of MeerKAT also allows for an investigation into the evolutionand formation of radio halos by studying the rate of occurrence in low mass and/or high redshiftsystems. Polarization data will be crucial to test the formation models for shock-induced radio relicsthrough magnetic field orientations and inferred Mach numbers. The blind survey will also detectanomalous diffuse sources which do not conform to the current emission characterizations, which willfurther the understanding of the evolution and properties of diffuse cluster emission. Finally, withthe 10 arcsecond L-band resolution of MeerKAT, a statistically significant population of mini-halosshould be detected around low-redshift BCGs. This population will be used to begin to investigatewhether mini-halos are inherently separate phenomena from radio halos or instead part of the latter’sevolutionary process.
MeeKLASS will also be able to detect and characterize many radio relics within and around galaxyclusters thus shedding light on their origin (re-acceleration of seed electron or connection with radiogalaxy remnants). In this context the survey will allow to measure radio-derived Mach numbers ofrelics and extend and characterize the P1.4-Mach number correlation which has been proposed as apowerful test of radio relic origin (Colafrancesco et al. 2017).
5.2 Star formation in clustersAs noted in Section 4.3, MeerKLASS will detect millions of star forming galaxies. The combinationof MeerKLASS with large, Sunyaev-Zel’dovich (SZ) effect selected galaxy cluster surveys, such asthat being conducted by the Advanced Atacama Cosmology Telescope (AdvancedACT; De Bernardiset al. 2016), will allow us to investigate the evolution of star formation in and around clusters, overhalf of the age of the Universe. The sensitivity of MeerKLASS (∼ 5µ Jy RMS) will allow individualgalaxies with star formation rates (SFR) > 20M/yr at z < 0.7 to be detected at 5σ, assuming theBell (2003) relation between SFR and 1.4 GHz luminosity. We will measure how the star formationrate per unit cluster mass evolves, and investigate how this varies with cluster mass. The clean,SZ selection of the clusters in the MeerKLASS field will simplify the interpretation of the results,by easing comparison with cosmological simulations. The sensitivity reached by the MeerKLASSobservations is comparable to surveys of ∼ 10 − 100s of clusters over a similar redshift range thathave been conducted at 24µm with MIPS on the Spitzer Space Telescope (Webb et al. 2013), or
13

MeerKLASS 6 MEERKLASS AS AN EXTRAGALACTIC HI SURVEY
20 40 60 80 100 120 140DlumMpc
6.0
6.5
7.0
7.5
8.0
8.5
log 1
0 (M M
)
V = 200V = 100V = 50V = 20
cz103 km s 1
2 4 6 8 10
Detection limits for line width V
500 1000 1500 2000 2500 3000 3500DlumMpc
8.5
9.0
9.5
10.0
10.5
11.0
log 1
0 (M M
)
V = 200V = 100V = 50V = 20
cz103 km s 1
20 40 60 80 100 120 140 160 180
Detection limits for line width V
Figure 7: H i point source distance detection limits for MeerKLASS. The panels refer to different redshiftranges. Blue: line width of 200 km s−1. Red: line width of 100 km s−1. Green: line width of 50 km s−1.Magenta: line width of 20 km s−1.
with Herschel at 250µm (Alberts et al. 2014). The advantage of our survey will be an increase inthe sample size by 1-2 orders of magnitude, and reliable masses based on SZ observables (previoussurveys are based on IR-selected cluster samples).
5.3 Cluster magnetic fieldsThe origin of cosmic magnetic fields is still an open field in terms of a full understanding of theprocesses which generate or amplify them. One of the methods to probe the strength and orientationof magnetic fields in the ICM, necessary for understanding cosmic magnetism, is through Faradayrotation of background sources. With its 5µJy/beam sensitivity limit, MeerKLASS is expected todetect ∼ 25 polarized sources per square degree (Rudnick & Owen 2014), several of which will be inor behind galaxy clusters. Magnetic field studies in clusters over a wide range of mass and redshiftwill provide crucial statistical information on the properties and evolution of magnetism on clusterscales.
6 MeerKLASS as an extragalactic HI surveyMeerKLASS promises to resolve a statistically significant number of galaxies over the widest rangeof galaxy H i masses, while at the same time maintaining a high sensitivity for low density extendedstructures (4 · 1019 atoms cm−2 at 4σrms over 20 km s−1 at HBPW = 30′′). It therefore perfectlycomplements WALLABY on ASKAP (Koribalski 2012), which will be unable to delve into the low-column density regime, as traced with MeerKLASS, and may be affected by confusion. This allowsus to prepare the full range of SKA science cases studying galaxy formation, dynamics, accretion,and depletion processes. This surface brightness sensitivity will be sufficient to trace the faint H iresiding in the outskirts of galaxies and/or intra-group gas.
6.1 A comparison with other surveysWith its large survey area and comparably high sensitivity, MeerKLASS will directly detect H i in afew hundred thousand galaxies. Its sensitivity is a factor of 3-4 better than the current gold standard,ALFALFA (Giovanelli et al. 2005), and will hence serve to significantly improve the statistics ofintegral H i properties of galaxies. Figure 7 shows the 5− σrms point source mass detection limits ofMeerKLASS. MeerKLASS will be able to detect the most massive galaxies up to the redshift limits ofthe MeerKAT L-band receiver (870 MHz, notice that also massive galaxies can have a narrower linewidth depending on inclination), while objects with low H i masses, between 106M and 107M,stay detectable within a reasonable survey volume. A galaxy like Leo T with a dark matter massthat is just enough to retain baryons, M(H i) ∼ 2.8 · 105M and radius ∼ 240 pc (Ryan-Weber et al.2008), would be detectable at a 5 − σrms level and resolved up to distances slightly beyond 5 Mpc.
14

MeerKLASS 6 MEERKLASS AS AN EXTRAGALACTIC HI SURVEY
Figure 8: Predicted distributions of resolved galaxy masses and redshifts for various surveys beyondz = 0.01. Left: Separated by H i mass. Right: Separated by redshift. Blue: MALS, yellow: MIGHTEEand FORNAX combined, green: medium-deep APERTIF, black: WALLABY and APERTIF shallowcombined, red: MeerKLASS. Numbers in parentheses show angular resolution.
With this, MeerKLASS will be capable of significantly improving statistics of H i mass, line-widthand -shape.
A further indication of the potential impact of MeerKLASS as an H i survey is evident from Fig. 8,where its detection statistics for resolved galaxies at z > 0.01 is calculated and compared to variousfuture H i surveys: we assume a very conservative rms noise of 0.5mJy/beam over a velocity intervalof 20 km/s at z = 0 (our assumed rms of 5µJy over the whole L-band, assuming 25% loss due to RFI,results in a line sensitivity of 0.4 mJy beam−1). This sensitivity corresponds to a 3-σrms detectionlimit of a column-density of 1M pc−2 (at z = 0) with a Gaussian beam size of 16′′ (HPBW). Suchcolumn density limit should be suitable to trace resolved H i out into the H i-dominated regimes ingalaxies.
To introduce a metric of the survey impact when targeting resolved objects, we assume a galaxyto be resolved if there are at least 5 synthesized beams across its major axis extent, the latter definedas the location at which the surface density equals 1M pc−2. We predict the H i extent of eachdetection using the tight correlation between this quantity and the H i mass (Broeils & Rhee 1997;Wang et al. 2014, 2016), the latter estimated from the H i mass function of Martin et al. (2010). It isclear that MeerKLASS will resolve significantly more galaxies out to larger distances than currentlyplanned H i surveys, providing a unique sample from which to measure the statistics of disk galaxystructure in the local Universe. Even in comparison with a (currently hypothetical) all-sky shallowsurvey as proposed for ASKAP and APERTIF ("WALLABY+WNSHS"), MeerKLASS will detect alarger amount of galaxies at z > 0.01, in particular cutting into the lower mass regime of slightlyabove 109M, thanks to its superior resolution and hence the ability to also resolve more distant H idisks at reasonable sensitivity. Adding the very local universe (0 < z < 0.01), we estimate that anall-sky survey with the specs of WALLABY would roughly resolve twice as many galaxies in a massrange below log MH i
M, but without the ability to trace faint gas. The Medium-Deep Survey (MDS)
with APERTIF is slightly more sensitive compared to MeerKLASS. At 30′′ resolution (HPBW),MeerKLASS will reach a 4− σrms sensitivity of 4 · 1019 atoms cm−2 over 20 km s−1 (here we include afactor of 1.5 in the rms noise estimate to account for losses due to robust weighting), while the MDSwill reach 3 · 1019 atoms cm−2. However, the MDS will not be able to produce comparable statistics;due to the extent of WSRT, its resolving power is limited (to approximately 16′′) and cannot beimproved by higher sensitivity. Hence, dominated by the ratio of survey areas, MeerKLASS will beable to detect ≈ 9 times more resolved galaxies than the MDS.
It should be pointed out that MeerKLASS will be the only H i survey to both resolve large numbersof galaxies in the mass range between 109M and 1010M, on the low-mass side of the knee of themass function (i.e. rather typical H i masses of galaxies) and retain the ability to image gas at alow column density level to provide statistics in that mass range. This quality depends heavily onboth the rms noise resulting from the integration time, as this guarantees the resolving power (of 16′′
HPBW), as well as the survey area, which is 8-10 times larger than foreseen for the medium-deepsurvey with APERTIF.
15

MeerKLASS 6 MEERKLASS AS AN EXTRAGALACTIC HI SURVEY
6.2 Neutral hydrogen in galaxies: scienceAccording to the metrics presented above, MeerKLASS will be superior to any other H i emission lineprogenitor survey for the SKA, enabling us to address several major research areas. For example, theH i mass function and velocity function are two of the most important measures for gas-rich galaxypopulations (Zwaan et al. 2003) and can be used to derive the cosmic H i mass density; this is anessential input into our understanding of the evolution of the cosmic SFR density and the processesgoverning the distribution and evolution of cool gas (e.g. Obreschkow et al. 2009). With the largevolume covered, and its high sensitivity, MeerKLASS will enable the study of the H i mass-functionas a function of the environment; the resolution of the MeerKAT means MeerKLASS will be far lesshampered by confusion than single-dish surveys or surveys limited by the array extent. MeerKLASSwill therefore be highly complementary to, in particular, WALLABY, which will deliver much higherdetection statistics, but at an angular resolution of 30′′. In addition to a direct comparison ofthe H i mass function with theoretical predictions (e.g. Power et al. 2010), in combination withcomplementary surveys at other wavelengths, the baryonic and total mass function for galaxies canbe derived to further test models of galaxy formation (e.g. Zwaan et al. 2010).
MeerKLASS will provide high-sensitivity data for a large number of well-resolved galaxies (withH i diameters in excess of 5 beams), which, in combination with surveys at other wavelengths (NIR,FIR, Hα, UV), will enable statistical studies of the correlation of star formation with the internal H idistributions and dynamical properties of galaxies (Bigiel et al. 2008; Leroy et al. 2008; Wang et al.2014, 2016), and challenge the standard cosmology by testing predictions about galaxy kinematicsand dynamics (de Blok et al. 2015). In nearby groups, galaxies with H i masses as low as a few105M can be detected.
Due to the comparably high resolution, MeerKLASS will be able to resolve environmental effectson galaxies, such as gas stripping (e.g. Oosterloo & van Gorkom 2005), gas accretion and galaxy in-teraction (see e.g. Sancisi et al. 2008), thus probing the mechanisms that regulate star formation. Gasmasses of galaxies as a function of galaxy density provide an important insight into the environmentalinfluences on galaxy evolution. MeerKLASS will be able to reach a sensitivity regime that makes itpossible to characterise outer H i disks, and the faint surroundings of galaxies on a statistical basis.
Resolved kinematics and morphologies of a large number of galaxies allows us to study gas ac-cretion processes onto galaxies (see e.g. Sancisi et al. 2008), manifesting in gaseous halos, warps andlopsidedness, with statistically significant findings. It will also be possible to study the tightly corre-lated spin characteristics of galaxies in relation to their environment (Obreschkow et al. 2015). Anadditional implication is that it will be possible to search for spin alignment in the outer disks; inan inside-out scenario of galaxy formation, this gas would be accreted most recently in a galaxy’sevolution and is thus more likely to be aligned compared to the inner disk (Popping et al. 2015). ForWALLABY, to reach this goal is already problematic as its column density sensitivity is too low, andfor the APERTIF MDS the number statistics are significantly lower. MeerKLASS will therefore be ahighly complementary survey to WALLABY, which will provide higher statistics for the inner, highcolumn-density regime.
6.3 Gas in galaxies: legacy valueIn summary, MeerKLASS will enable us to: (1) establish a H i mass function, and measure spectralcharacteristics of unresolved sources with an unprecedented accuracy, even in dense environments, (2)measure radial gas profiles of galaxies to study galaxy evolution; (3) quantify the matter distributionin galaxies; (4) study the intrinsic and mutual spin distribution in galaxies and its dependence onenvironment, and (5) study the low column density environment of galaxies to quantify AGN feedbackand accretion processes on a statistical basis. Again, MeerKLASS will enable us to observe the H i-dominated regime beyond the stellar disks, which is highly relevant in the context of galaxy evolution(Wang et al. 2014, 2016), as well as for dynamical studies (Obreschkow et al. 2015).
MeerKLASS will produce standard data products to address the above questions, namely: (1)basic emission line parameters; (2) H i emission line maps and data cubes of resolved objects; (3)parametrisations of extended morphology and kinematics, spin characteristics, rotation curves, andsurface density profiles of resolved galaxies, and (4) velocity and mass functions.
It is currently unclear how the shallow basis of the wedding cake for H i surveys will be established.Within its anticipated life time, APERTIF will not be used for a shallow survey that covers a quarterof the sky. A real all-sky survey, as assumed in our calculations, will hence not exist on a short timescale and the numbers of resolved galaxies observed by WALLABY and the APERTIF shallow surveywill hence be smaller than calculated above. Given the performance of MeerKAT, MeerKLASS couldtherefore even significantly complement WALLABY and the APERTIF shallow survey by the sheernumber of resolved detections to provide high-number statistics for H i astronomy at low redshifts,in addition to its quality to trace H i at a far lower column density.
16

MeerKLASS 7 THE POLARIZED SKY – COSMIC MAGNETIC FIELDS
Figure 9: Polarized intensity source counts over 0.1 deg2 at 5GHz (Taylor et al. 2014). Solid black line:SKADS simulation of total intensity counts. Red curve: predicted total polarized flux density counts.Dashed curves are predicted counts for FR II (green), FRI (orange) and normal galaxies (blue).
7 The polarized sky – cosmic magnetic fieldsCurrent studies of the sub-mJy polarized sky show that it presents questions which cannot be answeredby the strong source population alone (Taylor 2009). The mean fractional polarization of radio sourcesis anti-correlated with flux density. The faint end of this flux density range contains relatively moreobjects below the FRI/FRII luminosity boundary than the bright end. This raises a number ofquestions about the nature and evolution of the faint polarized sources. How is the higher degree ofpolarization of faint sources related to source structure, radio luminosity, redshift, or environment?Does the trend of increasing polarization continue to lower flux densities? When does it stop? Doesthe polarization of all AGN increase with flux density, or can we identify a sub-class of AGN that isresponsible for this trend?
The fractional polarization and intrinsic polarization angle of a source measure the order anddirection of its magnetic field. It is expected that these quantities will be different for distinct classesof object due to the different origin of the emission. In AGN they will mainly be related to the orderedmagnetic field in the jets and lobes; for SF galaxies, which are mostly spirals, they are likely to reflectthe degree of ordering in the intrinsic disk field. MeerKLASS will have the sensitivity to provide directdetection of the presence and properties of ordered magnetic fields in a vast number of galaxy disksout to intermediate redshifts. At even higher redshifts we will be able to measure statistical polarizedsource properties to nanoJy levels by stacking the polarized emission at positions corresponding tototal intensity detections, and thus trace the emergence of ordered fields in galaxies over cosmic time.With multi-wavelength information we will correlate the radio polarization properties with opticalemission line diagnostics, galaxy type and star-formation rates, revealing the relation of the evolutionof magnetic fields and the global star formation properties of galaxies.
MeerKLASS in the L-band will directly detect thousands of polarized sources spanning the tran-sition where SF and normal galaxies become a major component of the polarized population. MeerK-LASS will uniquely provide broad-band spectro-polarimetry for sources at µy levels over thousandsof square degrees. The large bandwidth will provide high precision Rotation Measure (RM) synthesismaking it possible to statistically examine the distribution of angular distribution of RMs to searchfor the imprint of intergalactic fields on galaxies on cosmological scales. We will also trace the degreeof polarization versus frequency due to internal Faraday rotation of the sources. The amount ofdepolarization by Faraday dispersion sets apart star-forming galaxies from most AGN powered ra-dio sources, potentially allowing us to separate them using the polarization observations; somethingwhich can be cross-checked using the multi-wavelength information.
The bandwidth of the survey will allow Faraday Rotation Measures to be measured with anaccuracy better than 2 rad-m−2 down to polarized flux densities of 100µJy. From recent JVLAimaging to 1µJy rms of a 0.1 deg2 field at 5GHz (Fig. 9), we expect to detect several 10s of sourcesper square degree down to 30µJy at about 1.3GHz. The 2-point correlation function of RM willbe measured on scales of arc minutes and precision of a few rad-m−2, precisely the regime wherefluctuations from primordial magnetic fields are expected to create detectable signal (Akahori & Ryu2010). This regime of sky density and RM accuracy has not been accessible to date, and will not be
17

MeerKLASS REFERENCES
surpassed until SKA1.
8 SummaryThe proposed MeerKAT survey is set to become the leading radio Cosmology survey in preparationtowards SKA1-MID. Its design fits well with the MeerKAT set-up both in terms of sensitivity andresolution. The survey will rely both on the dish auto-correlations (single-dish mode) and cross-correlations (interferometer mode). With this, it will provide a 4,000 deg2 map in HI intensity map-ping, continuum (∼ 5µJy rms) as well as HI line and polarization. This will allow us to achieve thefollowing science cases:
• Cosmology: (1) detect the HI intensity mapping signal both in the auto power spectrum and incross correlation with other surveys such as DES and CMB experiments (including lensing); (2)measure baryon acoustic oscillations and redshift space distortions and corresponding constraintson dark energy and modified gravity theories; (3) constraints on primordial non-Gaussianityusing the large scale power spectrum and the multi-tracer technique; (4) detect about 10 milliongalaxies in continuum capable of providing dark energy constraints in combination with multi-wavelength data.
• Galaxy evolution: (1) evolution of the AGN and SF galaxy populations out to high redshifts;(2) measure the environments and clustering of AGN; (3) identify high redshift AGN.
• Clusters: (1) test formation and evolution theories for radio halos, relics, and mini-halos viaa statistically significant blind cluster sample; (2) investigate cluster magnetic fields throughFaraday rotation of background sources over a wide range of cluster mass and redshift.
• Galaxy HI emission: (1) global galaxy spin distribution and (dark) matter distribution ingalaxies; (2) gas accretion; (3) quenching of star formation.
• Polarization: (1) detect thousands of polarized sources spanning the transition where SF andnormal galaxies become a major component of the polarized population; (2) search for theimprint of intergalactic fields on galaxies on cosmological scales; (3) trace the emergence ofordered fields in galaxies over cosmic time; (4) detect primordial magnetic fields.
Many other science cases will certainly take advantage of such a survey. In particular, if a fastscanning strategy is adopted (on the fly scanning), it will allow us to survey the area quickly, whichwill be especially suited to look for transients.
Several challenges will have to be overcome, however, if we want to use this signal for cosmologicalpurposes. In particular, cleaning of the huge foreground contamination, removal of any systematiceffects and calibration of the system. Foreground cleaning methods for intensity mapping have alreadybeen tested with relative success taking advantage of the foreground smoothness across frequency.The planned fast scanning strategy will allow us to deal with the typical 1/f noise expected in single-dish surveys by taking advantage of the system stability. Using the same scanning strategy for theinterferometer calibration will require sophisticated analysis methods in order to take advantage ofthe usual self-calibration process. Several techniques are currently being developed and we plan torun several tests with the MeerKAT system in the next few months. Although challenging, thisapproach has the promise to open a completely new observational window for Cosmology as well asto provide unprecedented high quality data for many other scientific purposes.
Acknowledgements. JF, MH, MJ, RM, OS, MP, MGS, AWi and IW are supported by the SouthAfrican Square Kilometre Array Project and the National Research Foundation. PB is supported bythe NASA Postdoctoral Program at the Jet Propulsion Laboratory, California Institute of Technology,administered by Universities Space Research Association under contract with NASA. DA and PGFare supported by the ERC, UK STFC and the Beecroft Trust. KK is supported by the Claude LeonFoundation. RM is also supported by the UK STFC, Grant ST/N000668/1. AP was supported bya Dennis Sciama Fellowship at the University of Portsmouth. AP acknowledges the University ofWestern Cape for hospitality. AWe is supported by the South African Research Chairs Initiativeand the National Research Foundation. JA gratefully acknowledges support from the Science andTechnology Foundation (FCT, Portugal) through the research grant PTDC/FIS-AST/2194/2012 andPEst-OE/FIS/UI2751/2014.
ReferencesAbdalla, F. B., Bull, P., Camera, S., et al. 2014, in Advancing Astrophysics with the Square Kilometre
Array, PoS (AASKA14) 017
Abdalla, F. B. et al. 2015, PoS, AASKA14, 017
18
MeerKLASS REFERENCES
Akahori, T. & Ryu, D. 2010, ApJ, 723, 476
Alberts, S., Pope, A., Brodwin, M., Atlee, D. W., Lin, Y.-T., Dey, A., Eisenhardt, P. R. M., Gettings,D. P., Gonzalez, A. H., Jannuzi, B. T., Mancone, C. L., Moustakas, J., Snyder, G. F., Stanford,S. A., Stern, D., Weiner, B. J., & Zeimann, G. R. 2014, MNRAS, 437, 437
Alonso, D., Bull, P., Ferreira, P. G., Maartens, R., & Santos, M. 2015, Astrophys. J., 814, 145
Alonso, D., Ferreira, P. G., Jarvis, M. J., & Moodley, K. 2017, PRD, 96, 043515
Baldry, I. K., Glazebrook, K., Brinkmann, J., Ivezić, Ž., Lupton, R. H., Nichol, R. C., & Szalay,A. S. 2004, ApJ, 600, 681
Bandura, K., Addison, G. E., Amiri, M., Bond, J. R., Campbell-Wilson, D., Connor, L., Cliche,J.-F., Davis, G., Deng, M., Denman, N., Dobbs, M., Fandino, M., Gibbs, K., Gilbert, A., Halpern,M., Hanna, D., Hincks, A. D., Hinshaw, G., Höfer, C., Klages, P., Landecker, T. L., Masui, K.,Mena Parra, J., Newburgh, L. B., Pen, U.-l., Peterson, J. B., Recnik, A., Shaw, J. R., Sigurdson,K., Sitwell, M., Smecher, G., Smegal, R., Vanderlinde, K., & Wiebe, D. 2014, in Proc. SPIE, Vol.9145, Ground-based and Airborne Telescopes V, 914522
Battye, R. A., Browne, I. W. A., Dickinson, C., Heron, G., Maffei, B., & Pourtsidou, A. 2013, Mon.Not. Roy. Astron. Soc., 434, 1239
Beck, G. & Colafrancesco, S. 2016, JCAP, 5, 013
Bell, E. F. 2003, ApJ, 586, 794
Bigiel, F., Leroy, A., Walter, F., Brinks, E., de Blok, W. J. G., Madore, B., & Thornley, M. D. 2008,AJ, 136, 2846
Bower, R. G., Benson, A. J., Malbon, R., Helly, J. C., Frenk, C. S., Baugh, C. M., Cole, S., & Lacey,C. G. 2006, MNRAS, 370, 645
Broeils, A. H. & Rhee, M.-H. 1997, A & A, 324, 877
Bull, P., Ferreira, P. G., Patel, P., & Santos, M. G. 2014, ArXiv e-prints
Camera, S., Raccanelli, A., Bull, P., Bertacca, D., Chen, X., Ferreira, P., Kunz, M., Maartens, R.,Mao, Y., Santos, M., Shapiro, P. R., Viel, M., & Xu, Y. 2015, Advancing Astrophysics with theSquare Kilometre Array (AASKA14), 25
Camera, S., Santos, M. G., Bacon, D. J., Jarvis, M. J., McAlpine, K., Norris, R. P., Raccanelli, A.,& Röttgering, H. 2012, MNRAS, 427, 2079
Camera, S., Santos, M. G., Ferreira, P. G., & Ferramacho, L. 2013, Phys.Rev.Lett., 111, 171302
Chang, T.-C., Pen, U.-L., Bandura, K., & Peterson, J. B. 2010, Nature, 466, 463
Colafrancesco, S., Marchegiani, P., & Paulo, C. M. 2017, MNRAS, 471, 4747
Colafrancesco, S., Regis, M., Marchegiani, P., Beck, G., Beck, R., Zechlin, H., Lobanov, A., & Horns,D. 2015, Advancing Astrophysics with the Square Kilometre Array (AASKA14), 100
Croton, D. J., Springel, V., White, S. D. M., De Lucia, G., Frenk, C. S., Gao, L., Jenkins, A.,Kauffmann, G., Navarro, J. F., & Yoshida, N. 2006, MNRAS, 365, 11
Dalal, N., Dore, O., Huterer, D., & Shirokov, A. 2008, Phys. Rev., D77, 123514
Dark Energy Survey Collaboration, Abbott, T., Abdalla, F. B., Aleksić, J., Allam, S., Amara, A.,Bacon, D., Balbinot, E., Banerji, M., Bechtol, K., Benoit-Lévy, A., Bernstein, G. M., Bertin, E.,Blazek, J., Bonnett, C., Bridle, S., Brooks, D., Brunner, R. J., Buckley-Geer, E., Burke, D. L.,Caminha, G. B., Capozzi, D., Carlsen, J., Carnero-Rosell, A., Carollo, M., Carrasco-Kind, M.,Carretero, J., Castander, F. J., Clerkin, L., Collett, T., Conselice, C., Crocce, M., Cunha, C. E.,D’Andrea, C. B., da Costa, L. N., Davis, T. M., Desai, S., Diehl, H. T., Dietrich, J. P., Dodelson, S.,Doel, P., Drlica-Wagner, A., Estrada, J., Etherington, J., Evrard, A. E., Fabbri, J., Finley, D. A.,Flaugher, B., Foley, R. J., Fosalba, P., Frieman, J., García-Bellido, J., Gaztanaga, E., Gerdes,D. W., Giannantonio, T., Goldstein, D. A., Gruen, D., Gruendl, R. A., Guarnieri, P., Gutierrez,G., Hartley, W., Honscheid, K., Jain, B., James, D. J., Jeltema, T., Jouvel, S., Kessler, R., King,A., Kirk, D., Kron, R., Kuehn, K., Kuropatkin, N., Lahav, O., Li, T. S., Lima, M., Lin, H., Maia,M. A. G., Makler, M., Manera, M., Maraston, C., Marshall, J. L., Martini, P., McMahon, R. G.,
19
MeerKLASS REFERENCES
Melchior, P., Merson, A., Miller, C. J., Miquel, R., Mohr, J. J., Morice-Atkinson, X., Naidoo, K.,Neilsen, E., Nichol, R. C., Nord, B., Ogando, R., Ostrovski, F., Palmese, A., Papadopoulos, A.,Peiris, H. V., Peoples, J., Percival, W. J., Plazas, A. A., Reed, S. L., Refregier, A., Romer, A. K.,Roodman, A., Ross, A., Rozo, E., Rykoff, E. S., Sadeh, I., Sako, M., Sánchez, C., Sanchez, E.,Santiago, B., Scarpine, V., Schubnell, M., Sevilla-Noarbe, I., Sheldon, E., Smith, M., Smith, R. C.,Soares-Santos, M., Sobreira, F., Soumagnac, M., Suchyta, E., Sullivan, M., Swanson, M., Tarle,G., Thaler, J., Thomas, D., Thomas, R. C., Tucker, D., Vieira, J. D., Vikram, V., Walker, A. R.,Wechsler, R. H., Weller, J., Wester, W., Whiteway, L., Wilcox, H., Yanny, B., Zhang, Y., & Zuntz,J. 2016, MNRAS, 460, 1270
De Bernardis, F., Stevens, J. R., Hasselfield, M., Alonso, D., Bond, J. R., Calabrese, E., Choi, S. K.,Crowley, K. T., Devlin, M., Dunkley, J., Gallardo, P. A., Henderson, S. W., Hilton, M., Hlozek,R., Ho, S. P., Huffenberger, K., Koopman, B. J., Kosowsky, A., Louis, T., Madhavacheril, M. S.,McMahon, J., Næss, S., Nati, F., Newburgh, L., Niemack, M. D., Page, L. A., Salatino, M.,Schillaci, A., Schmitt, B. L., Sehgal, N., Sievers, J. L., Simon, S. M., Spergel, D. N., Staggs, S. T.,van Engelen, A., Vavagiakis, E. M., & Wollack, E. J. 2016, in Proceedings of the SPIE, Vol. 9910,Observatory Operations: Strategies, Processes, and Systems VI, 991014
de Blok, E., Fraternali, F., Heald, G., Adams, B., Bosma, A., & Koribalski, B. 2015, AdvancingAstrophysics with the Square Kilometre Array (AASKA14), 129
Ferramacho, L. D., Santos, M. G., Jarvis, M. J., & Camera, S. 2014, MNRAS, 442, 2511
Fonseca, J., Camera, S., Santos, M. G., & Maartens, R. 2015, ApJ, 812, L22
Fonseca, J., Maartens, R., & Santos, M. G. 2016
Franceschini, A., Hasinger, G., Miyaji, T., & Malquori, D. 1999, MNRAS, 310, L5
Giovanelli, R., Haynes, M. P., Kent, B. R., Perillat, P., Saintonge, A., Brosch, N., Catinella, B.,Hoffman, G. L., Stierwalt, S., Spekkens, K., Lerner, M. S., Masters, K. L., Momjian, E., Rosenberg,J. L., Springob, C. M., Boselli, A., Charmandaris, V., Darling, J. K., Davies, J., Garcia Lambas, D.,Gavazzi, G., Giovanardi, C., Hardy, E., Hunt, L. K., Iovino, A., Karachentsev, I. D., Karachentseva,V. E., Koopmann, R. A., Marinoni, C., Minchin, R., Muller, E., Putman, M., Pantoja, C., Salzer,J. J., Scodeggio, M., Skillman, E., Solanes, J. M., Valotto, C., van Driel, W., & van Zee, L. 2005,AJ, 130, 2598
Jarvis, M., Bacon, D., Blake, C., Brown, M., Lindsay, S., Raccanelli, A., Santos, M., & Schwarz,D. J. 2015, PoS, AASKA14, 018
Jarvis, M., Seymour, N., Afonso, J., & et al. 2015, Advancing Astrophysics with the Square KilometreArray (AASKA14), 68
Jarvis, M. J., Teimourian, H., Simpson, C., Smith, D. J. B., Rawlings, S., & Bonfield, D. 2009,MNRAS, 398, L83
Koribalski, B. S. 2012, Publications of the Astron. Soc. of Australia, 29, 359
Kormendy, J. & Richstone, D. 1995, ARAA, 33, 581
Leroy, A. K., Walter, F., Brinks, E., Bigiel, F., de Blok, W. J. G., Madore, B., & Thornley, M. D.2008, AJ, 136, 2782
Maartens, R., Abdalla, F. B., Jarvis, M., & Santos, M. G. 2015, PoS, AASKA14, 016
Magorrian, J., Tremaine, S., Richstone, D., Bender, R., Bower, G., Dressler, A., Faber, S. M.,Gebhardt, K., Green, R., Grillmair, C., Kormendy, J., & Lauer, T. 1998, AJ, 115, 2285
Martin, A. M., Papastergis, E., Giovanelli, R., Haynes, M. P., Springob, C. M., & Stierwalt, S. 2010,ApJ, 723, 1359
Masui, K. W. et al. 2013, Ap. J. L., 763, L20
Matarrese, S. & Verde, L. 2008, Astrophys. J., 677, L77
McAlpine, K., Jarvis, M. J., & Bonfield, D. G. 2013, MNRAS, 436, 1084
Moodley, K., Prince, H., & Pénin, A. 2017, in prep.
20
MeerKLASS REFERENCES
Newburgh, L. B., Bandura, K., Bucher, M. A., Chang, T.-C., Chiang, H. C., Cliche, J. F., Davé,R., Dobbs, M., Clarkson, C., Ganga, K. M., Gogo, T., Gumba, A., Gupta, N., Hilton, M., John-stone, B., Karastergiou, A., Kunz, M., Lokhorst, D., Maartens, R., Macpherson, S., Mdlalose, M.,Moodley, K., Ngwenya, L., Parra, J. M., Peterson, J., Recnik, O., Saliwanchik, B., Santos, M. G.,Sievers, J. L., Smirnov, O., Stronkhorst, P., Taylor, R., Vanderlinde, K., Van Vuuren, G., Weltman,A., & Witzemann, A. 2016, in Proc. SPIE, Vol. 9906, Ground-based and Airborne Telescopes VI,99065X
Obreschkow, D., Croton, D., De Lucia, G., Khochfar, S., & Rawlings, S. 2009, ApJ, 698, 1467
Obreschkow, D., Meyer, M., Popping, A., Power, C., Quinn, P., & Staveley-Smith, L. 2015, AdvancingAstrophysics with the Square Kilometre Array (AASKA14), 138
Oosterloo, T. & van Gorkom, J. 2005, A & A, 437, L19
Padmanabhan, H., Choudhury, T. R., & Refregier, A. 2015, MNRAS, 447, 3745
Popping, A., Meyer, M., Staveley-Smith, L., Obreschkow, D., Jozsa, G., & Pisano, D. J. 2015,Advancing Astrophysics with the Square Kilometre Array (AASKA14), 132
Pourtsidou, A., Bacon, D., & Crittenden, R. 2016a
Pourtsidou, A., Bacon, D., Crittenden, R., & Metcalf, R. B. 2016b, Mon. Not. Roy. Astron. Soc.,459, 863
Power, C., Baugh, C. M., & Lacey, C. G. 2010, MNRAS, 406, 43
Prescott, M., Mauch, T., Jarvis, M. J., & et al. 2016, MNRAS, 457, 730
Regis, M., Colafrancesco, S., Profumo, S., de Blok, W. J. G., Massardi, M., & Richter, L. 2014,JCAP, 10, 016
Rudnick, L. & Owen, F. N. 2014, ApJ, 785, 45
Ryan-Weber, E. V., Begum, A., Oosterloo, T., Pal, S., Irwin, M. J., Belokurov, V., Evans, N. W., &Zucker, D. B. 2008, MNRAS, 384, 535
Sadler, E. M., Cannon, R. D., Mauch, T., & et al. 2007, MNRAS, 381, 211
Sancisi, R., Fraternali, F., Oosterloo, T., & van der Hulst, T. 2008, Astronomy and AstrophysicsReviews, 15, 189
Santos, M., Bull, P., Alonso, D., & et al. 2015, Advancing Astrophysics with the Square KilometreArray (AASKA14), 19
Satpathy, S. et al. 2016, Submitted to: Mon. Not. Roy. Astron. Soc.
Seljak, U. 2009, Physical Review Letters, 102, 021302
Strateva, I., Ivezić, Ž., Knapp, G. R., Narayanan, V. K., Strauss, M. A., Gunn, J. E., Lupton, R. H.,Schlegel, D., Bahcall, N. A., Brinkmann, J., Brunner, R. J., Budavári, T., Csabai, I., Castander,F. J., Doi, M., Fukugita, M., Győry, Z., Hamabe, M., Hennessy, G., Ichikawa, T., Kunszt, P. Z.,Lamb, D. Q., McKay, T. A., Okamura, S., Racusin, J., Sekiguchi, M., Schneider, D. P., Shimasaku,K., & York, D. 2001, AJ, 122, 1861
Switzer, E. R., Masui, K. W., Bandura, K., Calin, L.-M., Chang, T.-C., Chen, X.-L., Li, Y.-C., Liao,Y.-W., Natarajan, A., Pen, U.-L., Peterson, J. B., Shaw, J. R., & Voytek, T. C. 2013, MNRAS,434, L46
Taylor, A. R. 2009, in Astronomical Society of the Pacific Conference Series, Vol. 407, The Low-Frequency Radio Universe, ed. D. J. Saikia, D. A. Green, Y. Gupta, & T. Venturi, 12
Taylor, A. R., Bhatnagar, S., Condon, J., Green, D. A., Stil, J. M., Jagannathan, P., Kantharia, N.,Kothes, R., Perley, R., Wall, J., & Willis, T. 2014, in Astronomical Society of India ConferenceSeries, Vol. 13, Astronomical Society of India Conference Series, 99–104
Wang, J., Fu, J., Aumer, M., Kauffmann, G., Józsa, G. I. G., Serra, P., Huang, M.-l., Brinchmann,J., van der Hulst, T., & Bigiel, F. 2014, MNRAS, 441, 2159
Wang, J., Koribalski, B. S., Serra, P., van der Hulst, T., Roychowdhury, S., Kamphuis, P., & Chen-galur, J. N. 2016, MNRAS, 460, 2143
21

MeerKLASS REFERENCES
Webb, T. M. A., O’Donnell, D., Yee, H. K. C., Gilbank, D., Coppin, K., Ellingson, E., Faloon, A.,Geach, J. E., Gladders, M., Noble, A., Muzzin, A., Wilson, G., & Yan, R. 2013, AJ, 146, 84
Xu, Y., Wang, X., & Chen, X. 2015, ApJ, 798, 40
Yuan, Z. S., Han, J. L., & Wen, Z. L. 2015, ApJ, 813, 77
Zhu, H.-M., Pen, U.-L., Yu, Y., & Chen, X. 2016, ArXiv e-prints
Zwaan, M. A., Meyer, M. J., & Staveley-Smith, L. 2010, MNRAS, 403, 1969
Zwaan, M. A., Staveley-Smith, L., Koribalski, B. S., Henning, P. A., Kilborn, V. A., Ryder, S. D.,Barnes, D. G., Bhathal, R., Boyce, P. J., de Blok, W. J. G., Disney, M. J., Drinkwater, M. J.,Ekers, R. D., Freeman, K. C., Gibson, B. K., Green, A. J., Haynes, R. F., Jerjen, H., Juraszek,S., Kesteven, M. J., Knezek, P. M., Kraan-Korteweg, R. C., Mader, S., Marquarding, M., Meyer,M., Minchin, R. F., Mould, J. R., O’Brien, J., Oosterloo, T., Price, R. M., Putman, M. E., Ryan-Weber, E., Sadler, E. M., Schröder, A., Stewart, I. M., Stootman, F., Warren, B., Waugh, M.,Webster, R. L., & Wright, A. E. 2003, AJ, 125, 2842
22